

Abstract
Adolescence is a critical time for the continued maturation of brain networks. Here, we assessed structural connectome development in a large longitudinal sample ranging from late child- to young adulthood. Using novel techniques that project high-dimensional connectomes into compact manifold spaces, we could identify a marked expansion of structural connectomes with the strongest effects in transmodal regions during adolescence. Findings were reflected increased within-module connectivity together with increased segregation, indicating an increasing differentiation of higher order association networks from the rest of the brain. Projection of subcortico-cortical connectivity patterns into these manifolds showed parallel alterations in pathways centered on the caudate and thalamus. Connectome findings were contextualized via spatial transcriptome association analysis, highlighting genes enriched in cortex, thalamus, and striatum. Finally, we could show with statistical learning that cortico-subcortical manifold features at baseline and their maturational change predicted measures of intelligence at follow-up, supporting utility of connectome manifolds to bridge structural network reconfigurations and cognitive outcomes in adolescent development.
Introduction
Adolescence is a time of profound and genetically mediated changes in whole-brain network organization (Larsen and Luna, 2018; Menon, 2013). Adolescent development is important for overall maturation in cognitive and educational functions and brain health more generally, a notion reinforced by the overlapping onset of several neurodevelopmental and psychiatric disorders (Hong et al., 2019; Khundrakpam et al., 2017). With increased capacity to carry out longitudinal studies in large samples, it is now possible to track changes in brain network organization within subjects, providing mechanistic insights into maturational processes, their biological underpinnings, and their effects on behavior and cognition.
By offering an in vivo window into brain organization, neuroimaging techniques such as magnetic resonance imaging (MRI) offer the ability to track adolescent development over time, and to explore associations to cognitive functions. Early cross-sectional and longitudinal studies focused on the analysis of morphological changes (Gogtay et al., 2004; Shaw et al., 2006; Tamnes et al., 2017), including cortical thickness (Shaw et al., 2006; Tamnes et al., 2017) and volume measures (Gogtay et al., 2004; Tamnes et al., 2017), with initial grey matter increases until late childhood followed by a decline for the rest of the lifespan. More recent work explored changes in intracortical microstructure, capitalizing on myelin-sensitive contrasts such as magnetization transfer ratio (MT) mapping, which generally suggest overall increases in adolescence (Paquola et al., 2019a; Whitaker et al., 2016) together with depth dependent shifts in intracortical myelin profiles (Paquola et al., 2019a). Besides the increasingly recognized changes in cortico-cortical connectivity, additionally studying subcortical regions offer additional insights for understanding brain maturation during adolescence. Indeed, an increasing body of connectome level studies emphasizes that subcortical structures contribute significantly to patterns of whole-brain organization, dynamics, and cognition (Hwang et al., 2017; Müller et al., 2020; Shine et al., 2019). In prior neurodevelopmental studies, it has been shown that the volumes of the striatum and thalamus decrease between adolescence and adulthood, potentially paralleling processes resulting in cortical grey matter reduction during this time window (Herting et al., 2018). A close inter-relationship between cortical and subcortical development is also suggested by recent functional connectivity work suggesting that cortico-subcortical pathways are intrinsically remodeled during adolescence (Váša et al., 2020), and these changes affect cognitive functioning. Collectively, these prior findings suggest measurable trajectories of cortical and subcortical structural organization and support associations to cognitive development (Baum et al., 2020; Shaw et al., 2006).
Recent conceptual and methodological advances have increasingly emphasized the analysis of brain networks as being the way forward to study brain organization, development, and substrates underlying cognitive trajectories in humans. One key modality to track developmental changes in structural connectivity is diffusion MRI (dMRI), a technique sensitive to the displacement of water in tissue that allows for the non-invasive approximation of inter-regional white matter tracts. Prior cross-sectional and longitudinal studies in children and adolescents outlined changes in the microstructure of major white matter tracts during development based on the analysis of dMRI derived tissue parameters (Lebel and Beaulieu, 2011; Schmithorst and Yuan, 2010). These findings have been complemented by assessments of brain network topology using graph-theoretical analysis (Oldham and Fornito, 2019), which reported a relatively preserved spatial layout of structural hubs across adolescent development on the one hand (Hagmann et al., 2010), yet with a continued strengthening of their connectivity profiles, likely underpinned by the ongoing maturation of long-range association fibers (Lebel and Beaulieu, 2011; Oldham and Fornito, 2019). One emerging approach to synoptically address connectome organization and development comes from the application of manifold learning techniques to connectivity datasets. By decomposing whole-brain structural and functional connectomes into a series of lower dimensional axes capturing spatial gradients of connectivity variations (Margulies et al., 2016; Vos de Wael et al., 2020), these techniques allow for the analysis of local connectivity changes within the context of macroscale motifs of brain wiring. Gradients derived from a variety of techniques have been shown to be genetically determined and relatively conserved across primate evolution (Valk et al., 2020). Furthermore, functional connectome findings suggest their promise to serve as spatial axes aligned with the cortical hierarchy (Margulies et al., 2016; Mesulam, 1998) and to capture functional activation patterns across different task states (Karapanagiotidis et al., 2020; Mckeown et al., 2020). A recent study furthermore demonstrated that the application of manifold learning techniques to whole-brain dMRI connectomes is feasible, and that these gradients provide a coordinate system to interrogate the coupling between brain structure and functional dynamics (Park et al., 2021). Still, the application of manifold techniques to dMRI connectomes in children and adolescents to track their longitudinal maturations has not been performed. In a recent assessment by our team, manifold learning techniques have been applied to myelin sensitive intracortical MT data, showing an increasing myeloarchitectural differentiation of association cortex throughout adolescence (Paquola et al., 2019a).
Here, we charted developmental changes in structural connectome organization, based on an accelerated longitudinal neuroimaging study from late childhood to early adulthood, covering the entire adolescent time period involving a total of 208 participants investigated between 14 to 26 years of age (Kiddle et al., 2018; Whitaker et al., 2016). Compared to cross-sectional designs, longitudinal studies track within-subject change, separating developmental effects from between-subject variability (Louis et al., 1986). We first estimated longitudinal changes in structural connectome manifolds across age. The compact and lower dimensional space furthermore allowed for the integration of connectome level findings with changes in MRI-based measures of cortical morphology and intracortical myelin. We furthermore projected subcortico-cortical connectivity patterns into the manifold space, to assessed parallel developmental shifts of these pathways in the studied time window. Connectome-manifold changes were contextualized at the molecular level via transcriptomic association and developmental enrichment analyses based on post-mortem datasets, which furthermore allowed for data-driven exploration of time windows of spatially co-localized gene sets. To also assess behavioral associations of connectome manifold changes, we harnessed supervised machine learning to predict future measures of cognitive function. Multiple sensitivity analyses were conducted at several steps to verify the robustness of our findings, and analytical code is made fully accessible to allow for independent replication of our findings.
Results
These findings were based on the Neuroscience in Psychiatry Network (NSPN) 2400 cohort (Kiddle et al., 2018; Whitaker et al., 2016). In brief, we studied 208 healthy individuals enrolled in an accelerated longitudinal study, where several age-stratified cohorts were enrolled to span the time period from adolescence and young adulthood. Participants (48% female) had a mean age of 18.82 years (range = 14–25 years) at baseline and 19.95 years (15–26 years) at follow-up. The average interval between baseline and follow-up scan was 11.28 months (range = 6–12 months). See the Methods for details on participant selection, image processing, and analysis.
Macroscale structural connectome manifold
For every participant, we built cortex-wide structural connectome manifolds formed by the eigenvectors displaying spatial gradients in structural connectome organization using non-linear dimensionality reduction techniques (https://github.com/MICA-MNI/BrainSpace) (Vos de Wael et al., 2020). Individual manifolds were aligned to a template manifold estimated from a hold-out dataset (see Methods) (Langs et al., 2015; Vos de Wael et al., 2020). Three eigenvectors (E1, E2, and E3) explained approximately 50% of variance in the template affinity matrix, with each eigenvector showing a different axis of spatial variation across the cortical mantle (Fig. 1A). Eigenvectors depicted a continuous differentiation between medial and lateral cortices (E1), between inferior and superior cortices (E2), and between anterior and posterior areas (E3). For each participant and time point, we calculated manifold eccentricity, which depicts how far each node is located from the center of the template manifold (see Methods). It thus simply quantifies the changes in eigenvectors between the time points in terms of expansion and contraction instead of comparing multi-dimensional connectome manifolds (Bethlehem et al., 2020). The manifold eccentricity showed high values in frontal and somatomotor regions, while temporoparietal, visual, and limbic regions showed low values (Fig. 1B).
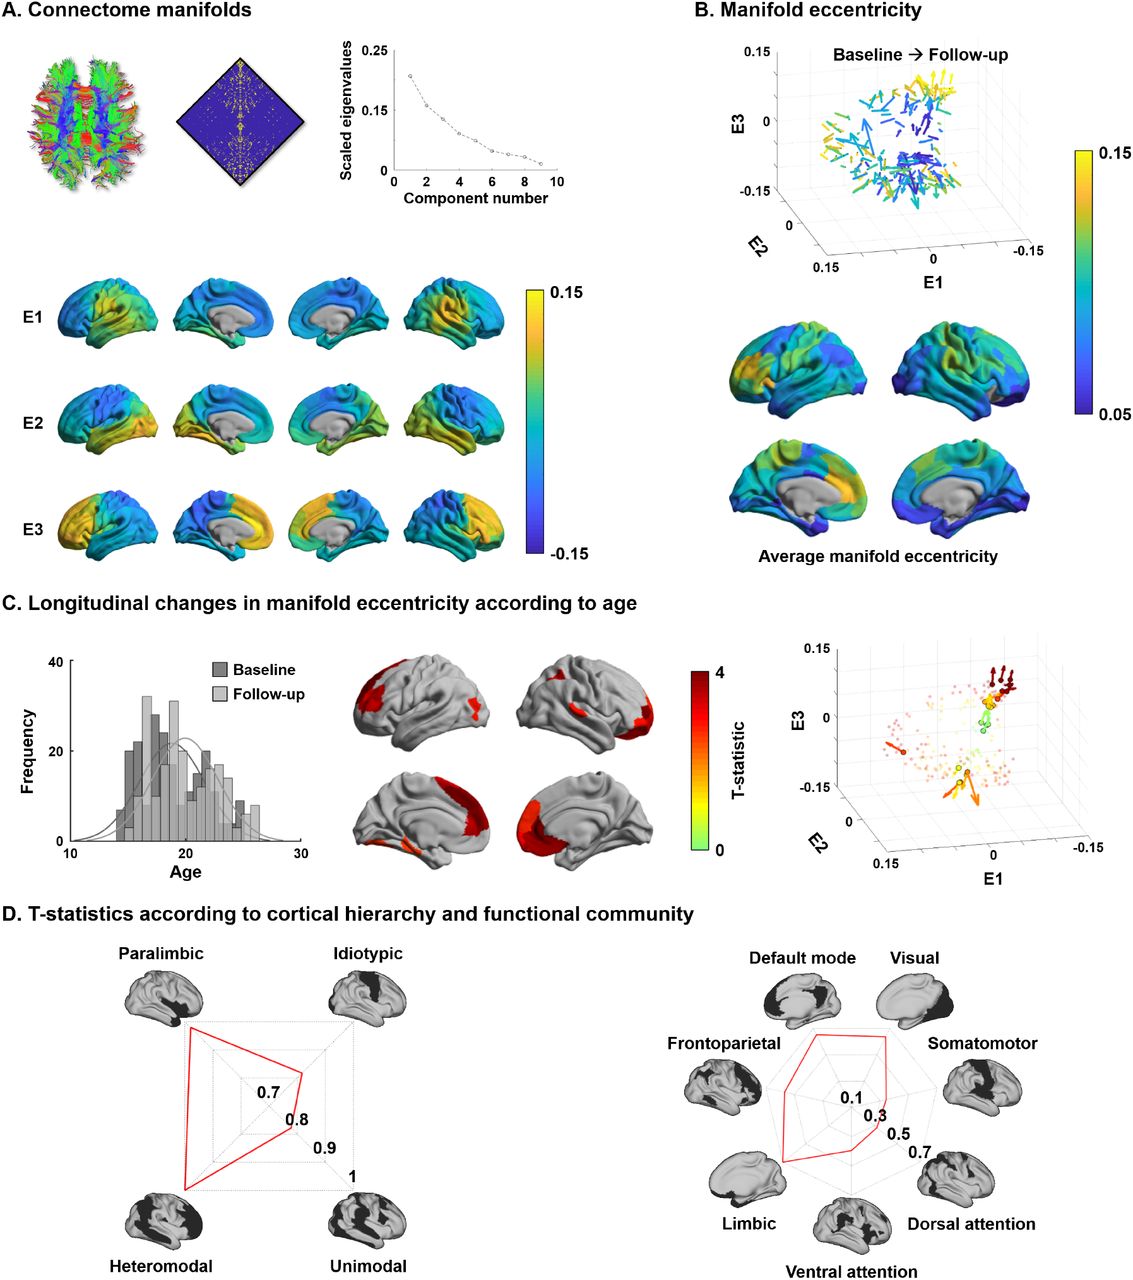
(A) Systematic fiber tracking based on dMRI generated a cortex-wide structural connectome, which was subjected to diffusion map embedding. As shown in the scree plot, three eigenvectors (E1, E2, E3) explained approximately 50% connectome variance, and each depicted a different gradual transition across the cortical mantle. (B) Manifold eccentricity measured by Euclidean distance between the template center and each data point. Arrows depict average positional change in connectivity space from baseline to follow-up. The color of each arrow represents each brain region mapped on the surface on the bottom. (C) The histogram represents age distribution of all subjects at baseline and follow-up. The colors on brain surfaces indicate t-statistics of regions showing significant longitudinal changes in manifold eccentricity across age, following multiple comparisons correction with a false discovery rate (FDR) procedure. Datapoint colors in the scatter plot represent t-statistics. Identified regions are represented with arrows that originate from baseline to follow-up. (D) Stratification of age-related changes in manifold eccentricity along cortical hierarchy (Mesulam, 1998) and functional community (Yeo et al., 2011).
Changes in manifold eccentricity across age
Leveraging linear mixed effect models that additionally controlled for effects of sex, site, head motion, and subject-specific random intercepts (Worsley et al., 2009), we assessed changes in manifold eccentricity across age (see Methods). Manifold eccentricity expanded as age increased, especially in bilateral prefrontal and temporal areas, as well as left early visual and right lateral parietal cortices (false discovery rate (FDR) < 0.05 (Benjamini and Hochberg, 1995); Fig. 1C). Stratifying these effects along four cortical hierarchical levels, defined using an established taxonomy based on patterns of laminar differentiation and tract-tracing data in non-human primates (Mesulam, 1998), we identified peak effects in heteromodal association and paralimbic areas (Fig. 1D). Convergent findings were observed when analyzing the effects with respect to intrinsic functional communities (Yeo et al., 2011), showing highest effects in default mode and limbic areas followed by visual and frontoparietal cortices. No significant contraction of manifold eccentricity was observed. In addition, we could not find any significant effects when we fitted the model with a quadratic form of age (i.e., age2), indicating the manifold eccentricity linearly increases across age.
To conceptualize the findings derived from manifold eccentricity with respect to conventional network topologies, we correlated manifold eccentricity changes with several graph-theoretical measures of structural connectome (Fig. S1) (Rubinov and Sporns, 2010). We first defined six spatially contiguous clusters within the regions that showed significant age-related changes in manifold eccentricity (see Fig. 1C) and correlated within-subject changes in manifold eccentricity with those in degree centrality, connectivity distance, and modular parameters (i.e., within-module degree and participation coefficient based on modules defined via Louvain’s community detection algorithm (Blondel et al., 2008); see Methods; Fig. S2). We found significant positive associations for degree centrality and within-module degree, suggesting that connectome manifold expansion reflects a concurrent increase of overall connectivity, particularly within modules. Stratifying changes in manifold eccentricity as well as connectome topology measures according to the discretized age bins confirmed these age-related trends (Fig. S3). Indeed, except for participation coefficient, values in general increased from childhood to young adulthood.
Effects of cortical morphology and microstructure
Previous studies demonstrated significant changes in cortical morphology and microstructure during adolescence, showing co-occurring reductions in cortical thickness and MT skewness, the latter being an index of depth dependent intracortical myelin changes in multiple lobes (Gogtay et al., 2004; Khundrakpam et al., 2017; Paquola et al., 2019a; Shaw et al., 2006). We replicated these findings by showing cortical thinning in almost all brain regions across the studied age window as well as reductions in depth dependent MT skewness, suggestive of supragranular enrichment of myelin (Fig. 2A). To evaluate whether the age-related changes in manifold eccentricity were robust above and beyond these regional changes in cortical thickness and MT, we implemented linear mixed effect models after correcting for cortical thickness and MT from the manifold eccentricity (Fig. 2B). While we observed virtually identical spatial patterns of manifold eccentricity changes in models that controlled for thickness, MT skewness, and both, effects in clusters of manifold eccentricity findings were reduced in models that additionally controlled for these values (average reduction of t-value in models controlling for thickness/MT skewness/both = 42/18/68%).

(A) The t-statistics of identified regions that showed significant age-related changes in cortical thickness (upper row) and MT (bottom row), and stratification of t-statistics according to cortical hierarchy (Mesulam, 1998) and functional community (Yeo et al., 2011). (B) Age-related changes in manifold eccentricity after controlling for cortical thickness and MT.
Age-related changes in subcortico-cortical connectivity
Besides visualizing these changes in cortico-cortical connectivity, we also capitalized on the manifold representation to assess adolescent changes in the connectivity of subcortical regions, to obtain a more holistic insight into whole-brain connectome reconfigurations during this time period, and to examine whether subcortical connectivity patterns undergo parallel developmental trajectories (Hwang et al., 2017; Shine et al., 2019). Specifically, we assessed changes in subcortical-weighted manifolds across age, defined by projecting the streamline strength of subcortical regions to cortical targets to the manifold space (see Methods). Such an analysis situates changes in subcortico-cortical pathways in the macroscale context of cortico-cortical connectivity identified in the previous analyses. After multiple comparison correction, the caudate and thalamus showed significant effects of subcortical-weighted manifolds (FDR < 0.05; Fig. 3), and marginal effects were observed in the putamen, pallidum, and hippocampus (FDR < 0.1).

The t-statistics of age-related changes in subcortical-weighted manifolds. The effects of each subcortical region are reported on the radar plot. Abbreviation: FDR, false discovery rate.
Transcriptomic association analysis
Connectome organization more generally, and macroscale gradients more specifically, have been argued to reflect genetic expression profiles, underscoring the close link between the physical layout of the brain and innate molecular factors (Buckner and Krienen, 2013; Fornito et al., 2019). Here, we carried out a transcriptomic association and developmental enrichment analyses to contextualize the age-related manifold eccentricity changes with respect to patterns of post-mortem gene expression from a sample of independent adults (Fig. 4A). Specifically, leveraging mixed effect models, we associated the spatial patterns of manifold change across age that controlled for cortical thickness and MT in the NSPN sample with cortical maps of post-mortem gene expression data from the Allen Institute for Brain Sciences (Arnatkeviciute et al., 2019; Gorgolewski et al., 2015, 2014; Hawrylycz et al., 2012; Markello et al., 2020). Among the list of most strongly associated genes (FDR < 0.05), we selected only genes that were consistently expressed across different donors (r > 0.5) (Arnatkeviciute et al., 2019) (Data S1). We fed those into a developmental gene enrichment analysis, which highlights developmental time windows across macroscopic brain regions in which genes are strongly expressed (see Methods) (Dougherty et al., 2010). This analysis highlighted marked associations between the spatial pattern of longitudinal change in connectome manifold eccentricity and the expression of genes that were found enriched from childhood onwards in the cortex, thalamus, and cerebellum (FDR < 0.001; Fig. 4B). Although signal was reduced, genes were also showing an enrichment for expression in the striatum at the transition from childhood to adolescence (FDR < 0.05). On the other hand, identified genes were not found to be expressed in the hippocampus and amygdala.

(A) Gene decoding process by associating t-statistics from the linear mixed effect model with post-mortem gene expression maps. (B) We identified genes that were spatially correlated with the input t-statistic map (false discovery rate (FDR) < 0.05) and selected only those that were furthermore consistently expressed across different donors (r > 0.5). These genes were fed into a developmental enrichment analysis, showing strong associations with cortex, thalamus, striatum, and cerebellum during childhood-to-adulthood time window. The degree of gene expression for developmental windows is reported on the bottom. The curve represents log transformed FDR corrected p-values, averaged across the brain regions reported as on the bottom. ***FDR < 0.001, ** FDR < 0.01, *FDR < 0.05.
Association between connectome manifold and cognitive function
To finally establish associations between connectome reconfigurations and cognitive functioning, we utilized a supervised machine learning to predict full intelligence quotient (IQ) at follow-up using manifold eccentricity features. Independent variables were combinations of cortical and subcortical manifold features at baseline and their age-related trajectory data. We used elastic net regularization (Zou and Hastie, 2005) with ten-fold cross-validation (see Methods), and repeated the prediction 100 times with different training and test dataset compositions to mitigate subject selection bias. The manifold eccentricity of cortical regions at baseline significantly predicted future IQ score (mean ± SD r = 0.21 ± 0.03; mean absolute error (MAE) = 8.76 ± 0.10). Prediction performance was slightly improved when we combined the manifold eccentricity both at baseline and differences between follow-up and baseline (r = 0.26 ± 0.02; MAE = 8.44 ± 0.10) (Fig. 5A). Notably, prediction accuracy was improved if we additionally considered subcortical manifold features (baseline: r = 0.27 ± 0.02; MAE = 8.59 ± 0.12; baseline and maturational change: r = 0.34 ± 0.03; MAE = 8.74 ± 0.17) (Fig. 5B). The regions showing strongest predictive validity for IQ were prefrontal, parietal, and temporal cortices, as well as the caudate and thalamus. The probability map of the selected brain regions (bottom right of Fig. 5B) was further decoded using Neurosynth (Yarkoni et al., 2011), revealing strong associations with higher order cognitive and social terms (Fig. S4).

(A) Probability of selected brain regions across ten-fold cross-validation and 100 repetitions for predicting future IQ using only baseline manifold eccentricity (left), and both baseline and maturational change in the feature (right). Correlations between actual and predicted IQ are reported. Black lines indicate mean correlation and gray lines represent 95% confidence interval for 100 iterations with different training/test dataset. (B) The prediction performance when both cortical and subcortical features were considered. Abbreviations: IQ, intelligence quotient; MAE, mean absolute error.
Sensitivity analysis
Repeating the longitudinal modeling with a different spatial scale (i.e., 300 parcels), findings were highly consistent (Fig. S5). Furthermore, manifold eccentricity of the identified cortical regions and age consistently correlated positively in the different sites and within both biological sexes, yielding non-significant interaction effects (Fig. S6). When we changed parameters of diffusion map embedding for generating connectome manifolds (see Methods), t-statistic maps of age-related changes in manifold eccentricity were largely consistent (mean ± SD linear correlation r = 0.92 ± 0.10).
Discussion
The current study tracked whole-brain structural connectome maturation from adolescence to young adulthood in an accelerated longitudinal imaging cohort (Kiddle et al., 2018; Whitaker et al., 2016). Capitalizing on advanced manifold learning techniques applied to diffusion MRI derived connectomes, we established that higher order association cortices in prefrontal, medial and superior temporal, as well as parieto-occipital regions expanded in their connectome manifold representation indicative of an increased differentiation of these systems from the rest of the brain in adolescence. Parallel topological fingerprinting based on graph theory indicated that these changes co-occurred alongside increases in the within-module connectivity of transmodal cortices. Findings were consistent across the different acquisition sites and biological sexes, and similar albeit slightly weaker when correcting connectivity manifolds for MRI-based measures of cortical morphology and microstructure. In addition to the cortical manifold expansion, we found parallel reconfigurations of subcortical pathways, particularly for connectivity patterns of the caudate and thalamus. Decoding of our findings with post-mortem gene expression maps highlighted an implication of genes enriched in adolescence and young adulthood, again pointing to both cortical as well as subcortical targets. Finally, the combination of both cortical and subcortical manifold measures predicted behavioral measures of intelligence at follow-up, with higher performance than cortical or subcortical data alone. Collectively, our findings provide new insights into adolescent structural connectome maturation, and how multiple scales of cortical and subcortical organizations interact in typical neurodevelopment.
Leveraging advanced manifold learning, we depicted macroscale connectome organization along continuous cortical axes. Similar approaches have previously been harnessed to decompose microstructural (Paquola et al., 2019b, 2019a) and functional MRI (Bethlehem et al., 2020; Hong et al., 2019; Margulies et al., 2016; Murphy et al., 2019; Vos de Wael et al., 2020). These techniques are appealing, as they offer a low dimensional perspective on connectome reconfigurations in a data-driven and spatially unconstrained manner. In our longitudinal study, we could identify marked connectome expansion during adolescence, mainly encompassing transmodal and heteromodal association cortex in prefrontal, temporal, and posterior regions, the territories known to mature late in development (Gogtay et al., 2004; Shaw et al., 2006). Connectome expansion can be understood as an overall greater differentiation of the connectivity of these areas from the rest of the brain, as they would then cover wider portions of the corresponding manifold space. Manifold expansion in higher order areas correlated with an increase in their within-module connectivity, but not with participation coefficient and connectivity distance measures that would be more reflective of their between-module connectivity. Our findings, thus, extend prior dMRI studies that have focused on specific tract groups and that have indicated considerable developmental shifts in diffusion parameters, such as increases in fractional anisotropy and decreases in mean diffusivity in early and late adolescence (Olson et al., 2009). Other studies have furthermore reported increased streamline count estimates (Genc et al., 2020). In this context, our macroscale manifold findings likely reflect an ongoing consolidation of transmodal communities. These findings align with prior graph-theoretical studies, which have pointed to concurrent increases in network integration and consolidation of network hubs from late childhood to early adulthood (Oldham and Fornito, 2019). Considering their distributed regional substrate, these network effects are likely driven by the ongoing maturation of fiber bundles that interconnect these higher order cortices, including superior longitudinal fascicules, but also thalamic and basal ganglia pathways (Tamnes et al., 2010), throughout adolescence.
Projecting manifold solutions back onto cortical surfaces allowed us to integrate our connectome manifold results with morphometric and intracortical intensity indices obtained via structural and quantitative MRI contrasts in the same participants. We were thus able to balance the network level effects against trajectories of intracortical remodeling. Longitudinal changes in these cortical features were overall in agreement with prior work, suggesting marked reductions in cortical thickness in adolescence (Khundrakpam et al., 2017; Shaw et al., 2006), possibly reflecting synaptic pruning processes (Petanjek et al., 2011) together with decreases in the skewness of intracortical MT profiles, a feature sensitive to preferential myelination of supragranular layers (Paquola et al., 2019a). Although we still observed significant age-related changes in manifold eccentricity after controlling for these intracortical and morphological measures, the effect sizes of our findings were reduced. This effect was particularly evident when running a parallel analysis that additionally controlled for depth dependent shifts in cortical microstructure, a finding in line with more generally demonstrated links between cortical microstructural context and inter-regional connectivity (Paquola et al., 2019b). In the context of adolescence and prior findings in the NSPN dataset (Paquola et al., 2019a), these results thus suggest a coupled process that affects depth-dependent shifts in cortical myeloarchitecture on the one hand, and adolescent shifts in macroscale connectome organization as shown by our longitudinal manifold analyses on the other.
In addition to emphasizing a distributed set of association cortices and their cortico-cortical connections, analysis of subcortico-cortical connectivity patterns highlighted parallel developmental processes in several subcortical structures and their connections, particularly the caudate and thalamus. These findings were independently supported by transcriptomic association studies and developmental enrichment analyses, which implicated genes expressed in cortical regions and these subcortical structures during late childhood, adolescence, and young adulthood. The caudate in the striatum has long been recognized to play an important role in mediating large-scale cortical network organization (Aglioti, 1997; Alexander and Crutcher, 1990; Graybiel, 1995), a finding also increasingly recognized in the connectome literature (Hwang et al., 2017; Müller et al., 2020; Shine et al., 2019). It is known to modulate activity in prefrontal association areas during memory-driven internal thought processes (Aglioti, 1997), and higher order cognitive functions, notably motivational processes, decision making, as well as cognitive control and executive functions more generally (Aglioti, 1997; Graybiel, 1995). The other structure that our analyses pointed to, striatum, participates in dense cortico-subcortical feedback loops, and exchanges neural activity through dense connections with adjacent basal ganglia structures as well as the thalamus (Aglioti, 1997; Alexander and Crutcher, 1990). These cortico-subcortical interactions likely involve the interplay of multiple neurotransmitter systems, including dopaminergic as well as GABA/Glutamate signaling. On the other hand, perturbations in cortico-striatal connections and neurotransmitter imbalances have been reported in multiple neurodevelopmental disorders, including schizophrenia (Tziortzi et al., 2014), autism (Sohal and Rubenstein, 2019), and attention deficit/hyperactivity disorder (Bonaventura et al., 2017; Hong et al., 2015).
Higher order cognitive function implicates functionally relevant whole-brain network mechanisms, and its prediction may thus leverage structurally governed principles of network integration and segregation. Application of a supervised machine learning framework with cross-validation and regularization to our cohort demonstrated that it is possible to predict inter-individual variations in future IQ from structural connectome manifold data. These findings complement conceptual accounts linking brain organization to cognitive function (Margulies et al., 2016; Mesulam, 1998), and earlier efforts to predict IQ measures from inter-regional measures of connectivity and graph-theoretical indices of network topology (Greene et al., 2018). Notably, evaluations of several feature combinations highlighted that predictive performance was highest when including both baseline and trajectory data, and when complementing cortical and subcortical manifold features. These findings reemphasize the benefits of incorporating subcortical nodes in the characterization of large-scale cortical network organization and overall cognitive function (Alves et al., 2019; Müller et al., 2020; Shine et al., 2019).
Adolescence is a time characterized by ongoing brain changes (Baum et al., 2020; Gogtay et al., 2004; Larsen and Luna, 2018; Menon, 2013; Shaw et al., 2006), gradually increasing independence from caregivers, and strong increments in knowledge and our ability to think more abstractly and to cooperate with our peers to achieve common goals. On the other hand, adolescence is also a sensitive time window for risk taking, the development of addictions, and hosts the onset of several prevalent psychiatric disorders (Hong et al., 2019; Khundrakpam et al., 2017). Our study has shown that structural brain network organization continues to mature significantly during this time period, with particularly higher order association cortices in prefrontal and posterior regions showing an expansion of their corresponding connectome manifold signature. Findings were related to an increased strengthening of intra-community connectivity as well as cortico-subcortical connectivity patterns to thalamo-striatal regions. Although the current work was restricted to a longitudinal sample of typically developing adolescents, our framework may be useful to explore multi-scale network perturbations in cohorts with a psychiatric diagnosis or those at risk for addiction or atypical neurodevelopment.
Methods
Participants
We obtained imaging and phenotypic data from the NSPN 2400 cohort, which contains questionnaire data on 2,402 individuals (with MRI data on a subset of ~300) from adolescence to young adulthood in a longitudinal setting (Kiddle et al., 2018; Whitaker et al., 2016). Included participants completed quality-controlled (see Data preprocessing section) multimodal MRI scans consisting of T1-weighted, MT, and dMRI for at least two time points. Our final sample consisted of a total of 208 participants (48% female; mean (range) age = 18.82 (14–25) years at baseline and 19.95 (15–26) at follow-up; inter-scan interval of 11.28 (6–12) months), collected from three different UK sites: Wolfson Brain Imaging Centre and MRC Cognition and Brain Sciences Unit in Cambridge; and University College London. We divided the participants into template and non-template cohorts with matched age, sex, and site ratio. The template dataset (n = 30; 50% female; mean (range) age = 18.69 (15–24) years at baseline and 19.84 ± 2.66 (16–25) at follow-up) was used for constructing template structural connectome manifold and the non-template dataset (n = 178; 47% female; mean (range) age = 18.84 (14–25) years at baseline and 19.97 (15–26) at follow-up) was used for conducting main analyses. Of note, changing the template dataset composition did not markedly affect main findings (Fig. S7).
MRI acquisition
Imaging data were obtained using a Siemens Magnetom TIM Trio 3T scanner. T1-weighted and MT sequences were acquired using a quantitative multiparameter mapping (MPM) sequence (repetition time (TR)/flip angle = 18.7ms/20° for T1-weighted and 23.7ms/6° for MT; six equidistance echo times (TE) = 2.2–14.7ms; voxel size = 1mm3; 176 slices; field of view (FOV) = 256 × 240mm; matrix size = 256 × 240 × 176) (Weiskopf et al., 2013). The dMRI data were acquired using a spin-echo echo-planar imaging (EPI) sequence (TR = 8,700ms; TE = 90ms; flip angle = 90°; voxel size = 2mm3; 70 slices; FOV = 192 × 192mm2; matrix size = 96 × 96 × 70; b-value = 1,000s/mm2; 63 diffusion directions; and 6 b0 images).
Data preprocessing
T1-weighted data were processed using the fusion of neuroimaging preprocessing (FuNP) pipeline integrating AFNI, FSL, FreeSurfer, ANTs, and Workbench (Avants et al., 2011; Cox, 1996; Fischl, 2012; Glasser et al., 2013; Jenkinson et al., 2012; Park et al., 2019), which is similar to the minimal preprocessing pipeline for the Human Connectome Project (Glasser et al., 2013). Gradient nonlinearity and b0 distortion correction, non-brain tissue removal, and intensity normalization were performed. The white and pial surfaces were generated by following the boundaries between different tissues (Dale et al., 1999), and they were averaged to generate the midthickness surface, which was used to generate the inflated surface. The spherical surface was registered to the Conte69 template with 164k vertices (Van Essen et al., 2012) and downsampled to a 32k vertex mesh. Quality control involved visual inspection of surface reconstruction of T1-weighted data, and cases with faulty cortical segmentation were excluded. Surface-based co-registration between T1-weighted and MT weighted scans were performed. We generated 14 equivolumetric cortical surfaces within the cortex and sampled MT intensity along these surfaces (Paquola et al., 2019a). The vertex-wise MT profiles for each surface depth were averaged based on the Schaefer atlas with 200 parcels (Schaefer et al., 2018). The dMRI data were processed using MRtrix3 (Tournier et al., 2019), including correction for susceptibility distortions, head motion, and eddy currents. We visually inspected the quality of co-registration between the adolescence data and adult-driven surface template as well as parcellation atlas, and all data showed reasonable registration results.
Structural connectome manifold identification
Structural connectomes were generated from preprocessed dMRI data (Tournier et al., 2019). Anatomically constrained tractography was performed using different tissue types derived from the T1-weighted image, including cortical and subcortical grey matter, white matter, and cerebrospinal fluid (Smith et al., 2012). Multi-shell and multi-tissue response functions were estimated (Christiaens et al., 2015), and constrained spherical-deconvolution and intensity normalization were performed (Jeurissen et al., 2014). The tractogram was generated with 40 million streamlines, with a maximum tract length of 250 and a fractional anisotropy cutoff of 0.06. Subsequently, spherical-deconvolution informed filtering of tractograms (SIFT2) was applied to reconstruct whole-brain streamlines weighted by the cross-section multipliers, which considers the fiber bundle’s total intra-axonal space across its full cross-sectional extent (Smith et al., 2015). The structural connectome was built by mapping the reconstructed cross-section streamlines onto the Schaefer 7-network based atlas with 200 parcels (Schaefer et al., 2018) then log-transformed to adjust for the scale (Fornito et al., 2016).
Cortex-wide structural connectome manifolds were identified using BrainSpace (https://github.com/MICA-MNI/BrainSpace) (Vos de Wael et al., 2020). First, a template manifold was estimated using a group representative structural connectome of the template dataset. The group representative structural connectome was defined using a distance-dependent thresholding that preserves long-range connections (Betzel et al., 2019). An affinity matrix was constructed with a kernel of normalized angle and eigenvectors were estimated via diffusion map embedding (Fig. 1A), which is robust to noise and computationally efficient compared to other non-linear manifold learning techniques (Tenenbaum et al., 2000). It is controlled by two parameters α and t, where α controls the influence of the density of sampling points on the manifold (α = 0, maximal influence; α = 1, no influence) and t controls the scale of eigenvalues of the diffusion operator. We set α = 0.5 and t = 0 to retain the global relations between data points in the embedded space, following prior applications (Hong et al., 2019; Margulies et al., 2016; Paquola et al., 2019a, 2019b; Vos de Wael et al., 2020). In this new manifold, interconnected brain regions are closely located, and regions with weak inter-connectivity located farther apart. After generating the template manifold, individual-level manifolds were estimated from the non-template dataset and aligned to the template manifold via Procrustes alignment (Langs et al., 2015; Vos de Wael et al., 2020). To analyze how the multi-dimensional manifold structures change in the low dimensional manifold space, we simplified the multivariate eigenvectors into a single scalar value by calculating the Euclidean distance between the center of template manifold and all data points (i.e., brain regions) in the manifold space, which was referred to as manifold eccentricity (Fig. 1B) (Bethlehem et al., 2020). The template center was defined as the centroid of the first three eigenvectors, which explained 50% variance. Specifically, manifold eccentricity was defined as follows:

 CT is the template center; N number of brain regions; T(·) template manifold; ME manifold eccentricity; I(·) individual manifold; CT(e) template center of eth manifold.
Age-related changes in structural manifolds
We assessed changes in manifold eccentricity across age using a linear mixed effect model (Worsley et al., 2009), controlling for effects of sex, site, head motion, and subject-specific random intercept to improve model fit in accelerated longitudinal designs. The t-statistics of each brain region were computed and we corrected for multiple comparisons by using a FDR threshold of q < 0.05 (Fig. 1C) (Benjamini and Hochberg, 1995). We stratified age-related effects based on a seminal model of neural organization and laminar differentiation that contains four cortical hierarchical levels (Mesulam, 1998), as well as seven intrinsic functional communities (Yeo et al., 2011) (Fig. 1D). To assess the effects with respect to age2, we repeated implementing a linear mixed effect model by adding a quadratic term of age to the model.
To provide the underlying structure of manifold eccentricity, we compared the changes in manifold eccentricity with those in connectome topology measures. We first defined clusters within the identified regions based on their spatial boundaries (Fig. S1A). Then, we calculated degree centrality, as well as modular measures of within-module degree and participation coefficient using the Brain Connectivity Toolbox (https://sites.google.com/site/bctnet/) (Rubinov and Sporns, 2010) and connectivity distance using a recently published approach (Larivière et al., 2020). Degree centrality is defined as the row-wise sum of the weighted connectivity matrix, representing the connection strength of a given node (Rubinov and Sporns, 2010). Connectivity distance is a given brain region’s geodesic distance to its structurally connected brain areas within the cortex (Oligschläger et al., 2019), and it is defined as the multiplication between the geodesic distance and the binarized structural connectome (Hong et al., 2019; Oligschläger et al., 2019). Within-module degree and participation coefficient are nodal measures reflecting different facets of community organization (Rubinov and Sporns, 2010). For each individual subject, community structure was defined using Louvain’s algorithm (Blondel et al., 2008) and a consistency matrix was constructed, where each element of the matrix represents whether the two different nodes are involved in the same community (i.e., 1) or not (i.e., 0) (Fig. S2A). We constructed the group-wise consistency matrix by averaging the consistency matrix of all subjects and applied k-means clustering (Fig. S2B). The optimal number of clusters was determined using the silhouette coefficient, i.e., the k that maximized the silhouette coefficient (Kannan et al., 2010). We calculated within-module degree and participation coefficient based on these modules. Within-module degree is the degree centrality within a community, indicating intra-community connection strength, while participation coefficient represents inter-community connectivity (Rubinov and Sporns, 2010). We calculated linear correlations between changes in manifold eccentricity and those in each graph theoretical measure for each cluster (Fig. S1B). The significance of the correlation was corrected using 1,000 permutation tests by randomly shuffling subject indices in one of the data vectors, and we corrected for multiple comparisons across clusters using an FDR procedure (Benjamini and Hochberg, 1995). To visualize age-related changes in these parameters, we stratified each measure according to discretized age bins (< 17, 17-19, 19-21, 21-23, ≥ 23; Fig. S3).
Cortical morphology and microstructure
It has been shown that cortical morphology and microstructure significantly change during development (Gogtay et al., 2004; Khundrakpam et al., 2017; Paquola et al., 2019a; Shaw et al., 2006). Here, we confirmed these changes by assessing age-related changes in MRI-based cortical thickness measures and intracortical measures of MT, an index sensitive to myelin content (Weiskopf et al., 2013), using linear mixed effect models (Fig. 2A) (Worsley et al., 2009). We further regressed out cortical thickness and MT from the connectome manifold eccentricity metric. We then implemented linear mixed effect models using the residuals of manifold measures to assess whether age-related connectome manifold effects exist above and beyond age-related effects on cortical morphology and microstructure (Fig. 2B).
Subcortico-cortical connectivity
To assess age-related changes in subcortical manifold organizations in addition to cortical manifold structures, we first parcellated the accumbens, amygdala, caudate, hippocampus, pallidum, putamen, and thalamus for each individual (Patenaude et al., 2011), and approximated cross-section streamlines connect each subcortical region to the rest of the brain. For each individual and each subcortical region, we projected the streamline strength to cortical manifold space by weighting the cortical manifolds with the streamline strength of the connection between each subcortical region and cortical parcels, yielding a matrix with the form of (number of brain regions × number of cortical manifolds). We averaged the matrix across the axis of cortical manifolds to construct subcortical-weighted manifold vector. We assessed age-related changes in the subcortical-weighted manifold using a linear mixed effect model (Worsley et al., 2009), controlling for sex, site, head motion, and subject-specific random intercept, and FDR corrected for multiple comparisons (Fig. 3) (Benjamini and Hochberg, 1995).
Transcriptomic analysis
We performed spatial correlation analysis to post-mortem gene expression data and carried out a developmental enrichment analysis (Fig. 4). In brief, we first correlated the t-statistics map, which represents age-related changes in manifold eccentricity that controlled for cortical morphology and microstructure, with the post-mortem gene expression maps provided by the Allen Institute using the Neurovault gene decoding tool (Gorgolewski et al., 2015, 2014; Hawrylycz et al., 2012). Leveraging mixed effect models to associate the input t-statistic map with the genes of six donor brains, Neurovault yields the gene symbols associated with the input spatial map. Gene symbols that passed for a significance level of FDR < 0.05 were further tested whether they are consistently expressed across different donors using abagen toolbox (https://github.com/rmarkello/abagen) (Arnatkeviciute et al., 2019). For each gene, we estimated whole-brain gene expression map and correlated it between all pairs of donors. Only genes showing consistent whole-brain expression pattern across donors (FDR < 0.05) were fed into enrichment analysis, which involved comparison against developmental expression profiles from the additional BrainSpan dataset (http://www.brainspan.org) using the cell-type specific expression analysis (CSEA) developmental expression tool (http://genetics.wustl.edu/jdlab/csea-tool-2) (Dougherty et al., 2010). As the Allen Brain Institute repository is composed of adult post-mortem datasets, it should be noted that the associated gene symbols represent indirect associations with the input t-statistic map derived from the developmental data.
Association with the development of cognitive function
Leveraging a supervised machine learning with ten-fold cross-validation, we predicted full IQ score measured by Wechsler Abbreviated Scale of Intelligence (Wechsler, 1999) at follow-up using cortical and subcortical features. Four different feature sets were evaluated: (1) manifold eccentricity of the identified cortical regions at baseline and (2) manifold eccentricity at baseline and its longitudinal change (i.e., differences between follow-up and baseline), and (3) cortical manifold eccentricity and subcortical-weighted manifold of the identified regions at baseline and (4) manifold eccentricity and subcortical-weighted manifold at baseline and their longitudinal changes. For each evaluation, a subset of features that could predict future IQ was identified using elastic net regularization (ρ = 0.5) with optimized regularization parameters (L1 and L2 penalty terms) via ten-fold cross-validation (Zou and Hastie, 2005). Feature selection procedure was conducted using the training data (9/10 segments), and it was repeated 10 times with different training and test dataset. The features that were most frequently identified across the cross-validation iterations (>50%) were selected and fed into a linear regression model for predicting IQ scores. Here, the actual feature values were considered, not multiplied by the regression weights. The model was controlled for effects of age, sex, site, and head motion. The IQ prediction using linear regression was performed with a ten-fold cross-validation by training the model with the training data (9/10 segments) and applying it to the test data (1/10 segment). The prediction procedure was repeated 100 times with different training and test sets to reduce bias. Prediction accuracy was indexed by computing linear correlations between the actual and predicted IQ scores as well as mean absolute error (MAE). A 95% confidence interval of the accuracy measures was also reported. Permutation-based correlations across 1,000 tests were conducted by randomly shuffling subject indices to check whether the prediction performance exceeded chance levels.
Sensitivity analysis
Spatial scale. To assess the consistency of our findings across spatial scales, we additionally performed the linear mixed effect modeling using a finer parcellation scheme of 300 parcels (Fig. S5) (Schaefer et al., 2018).
Site effect. Participants were recruited from three different sites. To assess whether the longitudinal changes in manifold eccentricity across age are consistent across different sites, we calculated interaction effects of the relationship between age and manifold eccentricity of the identified regions across sites (Fig. S6B).
Sex effect. We repeated computing interaction effect of the relationship between age and manifold eccentricity across male and female subjects to assess whether the age-related changes are affected by sex (Fig. S6C).
Different parameters for diffusion map embedding. To assess the sensitivity of our findings, we generated connectome manifolds with different parameters for diffusion map embedding (α = 0.25, 0.5, 0.75; t = 0, 1, 2, 3). We assessed age-related changes of the newly defined manifold eccentricity and calculated linear correlation with t-statistic map of the default setting (α = 0.5; t = 0; Fig. 1C).
Author contributions
B.P. and B.C.B. designed the experiments, analyzed the data, and wrote the manuscript. R.A.I.B. aided data curation. R.A.I.B., C.P., S.L., R.R.C., and R.V.D.W. aided with the experiments. E.T.B. designed the NSPN MRI study and edited the manuscript. B.P. and B.C.B. are the corresponding authors of this work and have responsibility for the integrity of the data analysis.
Conflict of interest
The authors declare no conflicts of interest.
Supporting Information
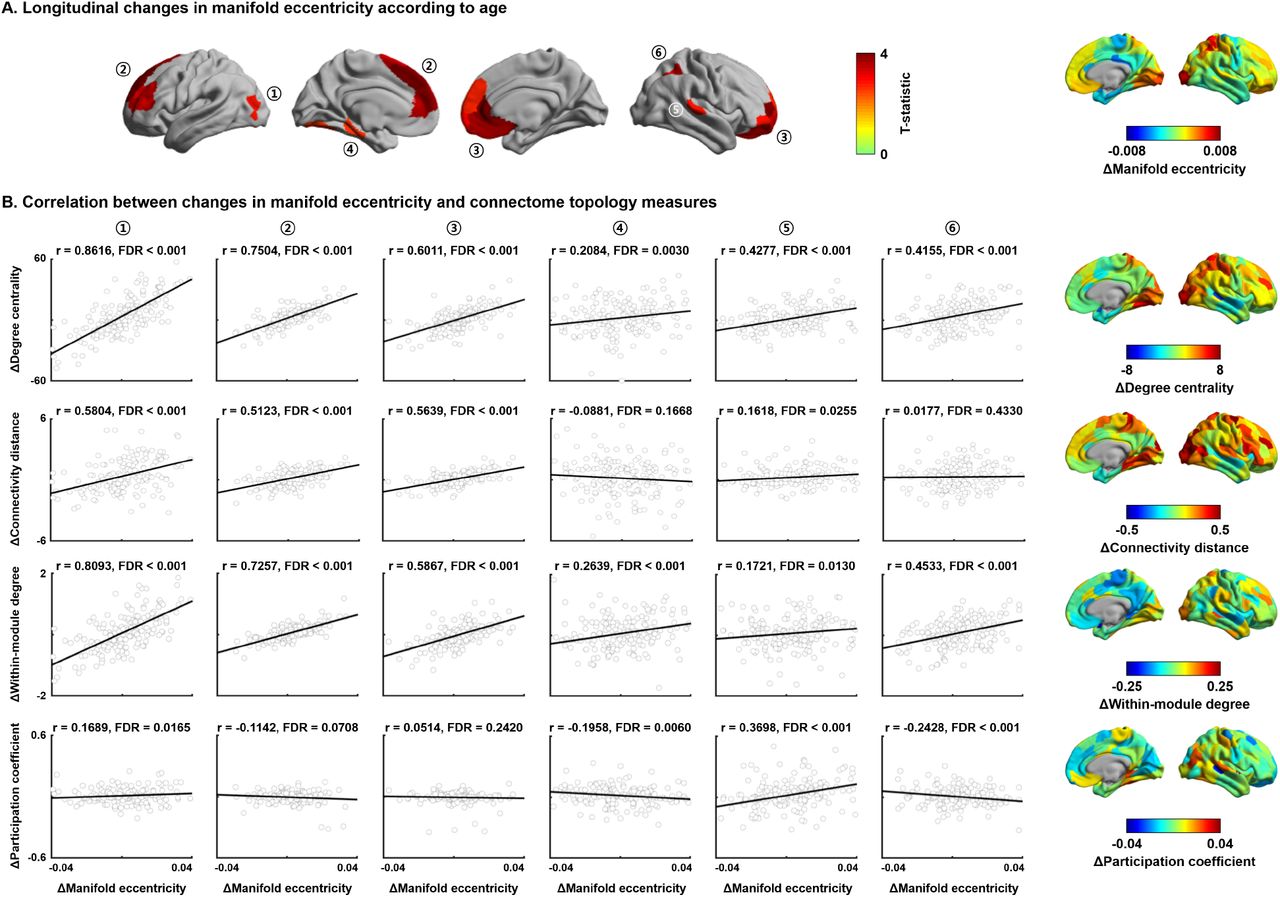
(A) Six clusters defined within the identified regions that showed significant age-related changes in manifold eccentricity (see Fig. 1C). (B) Associations between within-subject changes in manifold eccentricity and those of each connectome topology measure. Brain surfaces on the right side represent changes in each measure between baseline and follow-up. Significance was calculated using a false discovery rate (FDR).

(A) Pipeline for constructing consistency matrix. We constructed individual subject-wise consistency matrix by considering whether two different nodes were involved in the same module. (B) Group-wise consistency matrix was constructed by averaging subject-wise consistency matrices. The k-means clustering with silhouette coefficient was used for defining modules. Seven modules on the brain surface are reported on the right side.

Age-related changes in manifold eccentricity, degree centrality, connectivity distance, within-module degree, and participation coefficient. Abbreviation: y, years.

(A) Probability of selected cortical and subcortical regions for predicting future IQ using both baseline and maturational changes (see Fig. 5). (B) A word cloud derived by cognitive decoding using NeuroSynth (Yarkoni et al., 2011).

(A-D) Main findings were replicated using a different parcellation scale. For details, see Fig. 1.

(A) The t-statistics of identified regions that showed significant age-related changes in manifold eccentricity. (B) Interaction effects of the relationship between age and manifold eccentricity for sites and (C) biological sexes. Abbreviations: WIBC, Wolfson Brain Imaging Centre; CBU, MRC Cognition and Brain Sciences Unit; UCL, University College London.
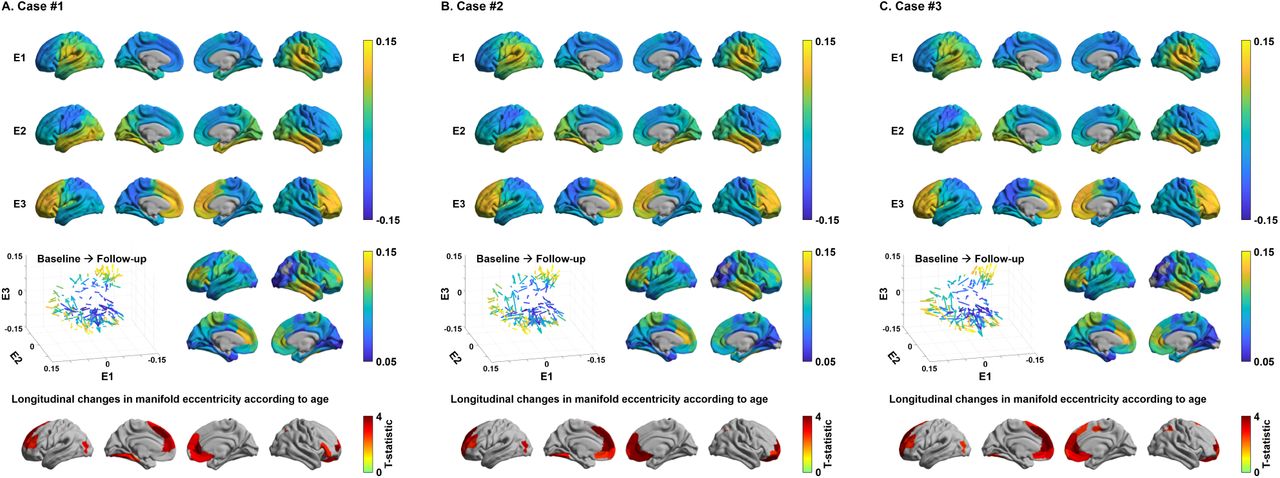
(A-C) Structural connectome manifolds and association to age using different template cohort. Three representative cases are reported. For details, see Figure 1.
Data S1 | Significant gene lists correlated with patterns of manifold eccentricity changes across age. Gene symbol with name and t-statistic as well as false discover rate (FDR) corrected p-value are reported in the Supplementary Data file (Supplementary_Data1.xlsx).
Neuroscience in Psychiatry Network (NSPN) Consortium author list
Principal investigators:
Edward Bullmore (CI from 01/01/2017)1,2,3; Raymond Dolan4,5; Ian Goodyer (CI until 01/01/2017)1; Peter Fonagy6; Peter Jones1
NSPN (funded) staff:
Michael Moutoussis4,5; Tobias Hauser4,5; Sharon Neufeld1; Rafael Romero-Garcia1,2; Michelle St Clair1; Petra Vértes1,2; Kirstie Whitaker1,2; Becky Inkster1; Gita Prabhu4,5; Cinly Ooi1; Umar Toseeb1; Barry Widmer1; Junaid Bhatti1; Laura Villis1; Ayesha Alrumaithi1; Sarah Birt1; Aislinn Bowler5; Kalia Cleridou5; Hina Dadabhoy5; Emma Davies1; Ashlyn Firkins1; Sian Granville5; Elizabeth Harding5; Alexandra Hopkins4,5; Daniel Isaacs5; Janchai King5; Danae Kokorikou5,6; Christina Maurice1; Cleo McIntosh1; Jessica Memarzia1; Harriet Mills5; Ciara O’Donnell1; Sara Pantaleone5; Jenny Scott1; Beatrice Kiddle1; Ela Polek1
Affiliated scientists:
Pasco Fearon6; John Suckling1; Anne-Laura van Harmelen1; Rogier Kievit4,7; Sam Chamberlain1
1Department of Psychiatry, University of Cambridge, United Kingdom
2Behavioural and Clinical Neuroscience Institute, University of Cambridge, United Kingdom
3ImmunoPsychiatry, GlaxoSmithKline Research and Development, United Kingdom
4Max Planck University College London Centre for Computational Psychiatry and Ageing Research, University College London, UK
5Wellcome Centre for Human Neuroimaging, University College London, United Kingdom
6Research Department of Clinical, Educational and Health Psychology, University College London, United Kingdom
7Medical Research Council Cognition and Brain Sciences Unit, University of Cambridge, United Kingdom
Acknowledgements
Dr. Bo-yong Park was funded by the National Research Foundation of Korea (NRF-2020R1A6A3A03037088), Molson Neuro-Engineering fellowship by Montreal Neurological Institute and Hospital (MNI), and a postdoctoral fellowship of the Fonds de la Recherche du Quebec – Santé (FRQ-S). Dr. Richard A. I. Bethlehem was funded by a British Academy Post-Doctoral Fellowship and the Autism Research Trust. Dr. Casey Paquola and Dr Raul R. Cruces were funded through postdoctoral fellowships of the FRQ-S. Ms. Sara Larivière acknowledges funding from the Canadian Institutes of Health Research (CIHR). Dr. Edward T. Bullmore was supported by a Senior Investigator award from the National Institute of Health Research (NIHR). Dr. Boris C. Bernhardt acknowledges research support from the National Science and Engineering Research Council of Canada (NSERC Discovery-1304413), the CIHR (FDN-154298), SickKids Foundation (NI17-039), Azrieli Center for Autism Research (ACAR-TACC), BrainCanada, FRQ-S, and the Tier-2 Canada Research Chairs program. Drs. Bo-yong Park, Richard A. I. Bethlehem, Casey Paquola, and Boris C. Bernhardt are jointly funded through an MNI-Cambridge collaborative award. The Neuroscience and Psychiatry Network (NSPN) study was funded by a Wellcome Trust award to the University of Cambridge and University College London. The data were curated and analyzed using a computational facility funded by an MRC research infra-structure award (MR/M009041/1) and supported by the NIHR Cambridge Biomedical Research Centre. The views expressed are those of the authors and not necessarily those of the NHS, the NIHR or the Department of Health and Social Care.
Footnotes
↵1 A complete list of investigators from the Neuroscience in Psychiatry Network (NSPN) Consortium can be found in the Supporting Information.
Additional analyses, revision & clarification of several sections.
References


