

Summary
Marine viruses are considered as major evolutionary and biogeochemical drivers of microbial life, through metabolic reprogramming of their host and cell lysis that modulates nutrient cycling1, primary production and carbon export in the oceans2. Despite the fact that viruses are the most abundant biological entities in the marine environment, we still lack mechanistic and quantitative approaches to assess their impact on the marine food webs. Here, we provide the first quantification of active viral infection, during bloom succession of the cosmopolitan coccolithophore Emiliania huxleyi, by subcellular visualization of both virus and host transcripts on a single cell resolution across thousands of cells. Using this novel method, that we coined Virocell-FISH, we revealed that distinct transcriptional states co-exist during the infection dynamics, and that viral infection reached only a quarter of the E. huxleyi population although the bloom demised in a synchronized manner. Through a detailed laboratory time-course infection of E. huxleyi by its lytic large virus EhV, we quantitatively show that metabolically active infected cells chronically release viral particles, and that viral-induced lysis is not systematically accompanied by virion increase, thus challenging major assumptions regarding the life cycle of giant lytic viruses. Using Virocell-FISH, we could further assess in a new resolution, the level of viral infection in cell aggregates, a key ecosystem process that can facilitate carbon export to the deep ocean3. We project that our approach can be applied to diverse marine microbial systems, opening a mechanistic dimension to the study of host-pathogen interactions in the ocean.
One Sentence Summary Quantifying active viral infection in algal blooms
Main Text
Microbes play a crucial role in shaping the marine ecosystem and its biogeochemical cycles4. In particular, abundant photosynthetic micro-eukaryotes and cyanobacteria (phytoplankton) contribute to half of the total primary production on Earth and form the basis of the marine food web 5–7. Phytoplankton blooms can undergo synchronized demise following infection by viruses that can reach 108 viruses per L of seawater3,8 and are therefore hypothesized to control the fate of phytoplankton blooms and the subsequent massive release of organic matter that fuels the microbial life via the viral shunt9. One of the main challenges in aquatic virology is to quantify how viruses, through control of the host metabolism and abundance, remodel nutrient fluxes within major biogeochemical cycles and impact the microbial community10,11. This challenge meets the critical need to quantify active viral infection within host cells (virocell), and to assess the magnitude of viral-induced mortality within a complex microbial consortium in the marine environment.
Approaches such as bulk RNA-seq12,13, ddPCR14, polony15, viral-BONCAT16, phageFISH17 and single cell genomics18,19 have considerably expanded the toolbox of viral ecology and provided insights into viral diversity and viral-encoded auxiliary metabolic genes that remodel the host metabolism20. However, they do not report active viral infection of individual cells thereafter named “virocells”, that can be defined as “the living form of the virus in its intra- cellular form”21. Recent advances in single cell transcriptomics have greatly improved our understanding of host-virus interactions by uncovering high heterogeneity in the host metabolic states and viral program dynamics within individual virocells22–24. However, these methods lack the ability to visualize infection on the subcellular level that can provide fresh insights into the complex life cycle of viruses in their host cells. Single molecule mRNA Fluorescent In Situ Hybridization (smFISH) enables detection, counting and localization of single mRNA molecules within morphologically intact individual cells25. In this approach, fluorescently labeled viral and host mRNA accumulate in infected cells, whereby probe fluorescence intensity becomes a proxy for gene expression levels26. It therefore provides a new tool to visualize specific microbial interactions within its natural heterogeneous populations.
Here, we provide unprecedented quantification of active viral infection and host response of the cosmopolitan unicellular alga Emiliania huxleyi both in the laboratory and in the field. E. huxleyi’s massive oceanic bloom demise are considered to be terminated via infection by its large dsDNA virus EhV3,27,28, a member of the Nucleo-Cytoplasmic Large DNA Viruses29. We detected and characterized host and virus fluorescently labelled mRNA by high throughput imaging flow cytometry and tracked infection dynamics at a single virocell level. Our approach, named Virocell-FISH, provides major insights into the life cycle of lytic giant virus and its ecology, including how virocells can release virions without lysing, and lyse without releasing virions even though the host undergoes a synchronized demise.
To track the metabolic state of E. huxleyi during viral infection, we monitored the mRNA expression of psbA, a chloroplast-encoded gene of the D1 protein. D1 is a major component of the photosystem II (PSII) complex involved in the first step of the light reaction during photosynthesis. D1 has a rapid turnover, requiring constant transcription of psbA30, and is essential for optimal viral infection E. huxleyi31. Concomitantly, we followed the expression of the viral gene mcp, that encodes the major capsid protein expressed at the late stage of the viral program24 (Fig. 1A). Analysis of epifluorescence images of cells at 1 and 24 hours post infection (hpi) showed an increasing fraction of cells expressing viral mcp at 24 hpi in concert with a profound loss of psbA expression (Fig. 1B, 1C).

(A) Simplified workflow of sample processing and data acquisition. After initial fixation, samples are hybridized to custom-made fluorescent probes and are subjected to either epifluorescence microscopy (high resolution) and imaging flow cytometry (high throughput) analyses, or both. (B, C) Epifluorescence images of infected E. huxleyi cells at 1 and 24 hpi (early and late infection, respectively) in each different channel (Scale bar = 20 μm).. (D, E) Cell and virion concentrations respectively, of infected and non-infected cultures during an E. huxleyi infection at high virus:host ratio. (F) Fraction of mcp+ and psbA+ cells throughout viral infection. Values are presented as the mean ± s.d., n = 3. (G, H) Distribution of mcp and psbA fluorescence intensity values across single cells of E. huxleyi acquired on ImageStream during a time course of viral infection. The dashed line depicts the intensity threshold used to define mcp+ and psbA+ cells according to the fluorescent intensity (103 a.u.). **** P < 0.0001 tested with Linear mixed model fit by REML. T-tests use Satterthwaite's method.
In order to quantify active viral infection and host metabolic state in a high throughput manner, a highly resolved time course of E. huxleyi infection at high host:virus ratio was performed. Cell abundance of infected cultures remained relatively stable at 5*105 cell per ml before decreasing at 48 hpi during the onset of the lytic phase (Fig. 1D). The first increase in extracellular concentration of virions occurred at 8 hpi before reaching a plateau at 56 hpi of 5.3*108 per mL (Fig. 1E). Based on Virocell-FISH, samples were probed against mcp and psbA, stained with DAPI and acquired using a multispectral imaging flow-cytometer (ImageStream). mcp+ cells represented 19% of the population at 4 hpi, 75% at 24 hpi, plateaued at 60% between 32 and 48 hpi before declining (Fig. 1F). Host psbA expression showed that 98% of the non-infected control cells remained psbA+, in contrast with a sharp drop to 12% in the infected cultures between 8 and 24 hpi (Fig. 1F). Infected single cells, defined as mcp+, showed large variability in the amounts of mcp mRNA per cell, reflected by a wide dynamic range of intensity values in the mcp probe per cell (from 103 to 105 a.u. fluorescence), suggesting cell-cell heterogeneity in viral infection (Fig. 1G). Simultaneously, we detected a dual response in the population with high and low psbA expression (threshold at 1.1 × 10³ a.u. fluorescence) indicating the loss of photosynthetically active cells in a distinct subpopulation (Fig. 1H). Virocell-FISH therefore enables dual quantification of host and viral genes during infection dynamics across thousands of single cells.
To investigate E. huxleyi virocell heterogeneity during infection, we plotted host and virus mRNA expressions in parallel and revealed four distinct co-existing subpopulations (Fig. 2A) that we quantified through time of infection (Fig. 2B, Fig. S1). At 0 and 1 hpi, most of the cells were mcp−/psbA+ (green gate), indicating photosynthetically active cells. Control cells continuously appeared in this gate. At 4 hpi, 24% of the cells were both mcp+ and psbA+ (red gate), co-expressing viral and host genes. Two new subpopulations were clearly distinguishable at 24 hpi: 60% of the cells were mcp+/psbA− (yellow gate) as a consequence of psbA transcription shutdown of mcp+/psbA+ cells, and 20% of the cells were mcp−/psbA− (grey gate) and most likely originated from mcp−/psbA+ experiencing gradual photosynthetic shutdown, and cells from mcp+/psbA− that interrupted mcp transcription. We further compared those four subpopulations with single cell dual RNA-Seq data from24 and confirm that our subpopulations correspond to clear stages of viral progression as defined by kinetic classes of viral genes (Fig. S2). Viral release was observed within 8 hpi, yet no cell death could be detected by Sytox Green staining (Fig. 2C) which suggested that metabolically active infected cells (mcp+/psbA+) are responsible for early viral release. This was supported by the fact that mcp+/psbA+ cells had much higher DAPI intensity than other subpopulations and showed strong positive correlation between mcp and DAPI intensities (Fig. S3), a likely consequence of the virus-induced de novo nucleotide synthesis required to meet the high demand of giant viruses32 (Fig. 2D). Among mcp+/psbA− cells at 24 hpi, mcp and DAPI signals were strongly co-localized, suggesting overlap between viral genome dsDNA and transcripts of viral structural proteins (Fig. S4).psbA intensity in infected cells (mcp+/psbA+) was higher than in non-infected cells (mcp−/psbA+) at 8 and 24 hpi (Fig. S5). Higher psbA expression in mcp+/psbA+ could either reflect enhanced psbA transcription in infected cells or down regulation of psbA translation leading to accumulation of mRNA, as shown for plant viruses33 though transcript and protein levels can be uncorrelated34 and that at the population level cell chlorophyll intensity decreases (Fig. S6). Higher psbA in mcp+ population emphasized the interdependence between optimality of infection (mcp expression) and host metabolic regulation (psbA expression).

(A) The central panel represents co-expression of host psbA and viral mcp (X and Y axes, respectively in arbitrary units of fluorescence) in an infected E. huxleyi culture 24 hpi. Four subpopulations, representing distinct transcriptional states, are observed: mcp-/psbA+ (green gate), mcp+/psbA+ (red gate), mcp+/psbA- (yellow gate) and mcp-/psbA- (grey gate). Single-cell morphology and fluorescent signal of each subpopulation is presented, showing brightfield image (BF), mcp (yellow), DAPI (purple) and psbA (red). (B) Relative abundance of the four subpopulations throughout the course of infection. (C) Close-up on virion production (virions ml−1), cell death (Sytox+), and mcp+ dynamics in the 24 first hours post infection. (D) Comparison of DNA content based on DAPI intensity between the four subpopulations (with more than 25 events per population) throughout infection. Comparison of DAPI intensity was with a Linear mixed model fit by REML. T-tests use Satterthwaite's method. * P < 0.05, **** P < 0.0001. (E) Schematic model of potential cell fates of the different subpopulations.
Interestingly, based on our intracellular virocell infection dynamics, we quantify fundamental parameters in the life cycle of a marine giant viruses. We estimate that the eclipse phase, in which viruses have penetrated the host but no virions are produced35, occurs within the first 4 hours, based on the induction of mcp+/psbA+ cells, without virion increase (Fig. 2C). The onset of the maturation phase, during which viral progeny is released, occurs within 8 hours. The distinct infection states can be associated with unique cell fates: metabolically active infected cells (mcp+/psbA+) are responsible for early viral release most likely through budding whilst mcp+/psbA− likely contribute less to this process. The mcp−/psbA− subpopulation, correlated with Sytox Green staining (Fig. S1B), suggests that a substantial fraction of the cells lyse without releasing viruses after 56 hpi. These cells can die from accumulation of DNA damage36, cytotoxic viral glycosphingolipids coming from neighboring infected cells37, or by abortive infection. The accumulation of these cells during lytic phase can originate from either the mcp+/psbA+ subpopulation that halts mcp transcription before lysis, or from the mcp−/psbA+ subpopulation that shuts down psbA transcription24. At later time point, the mcp−/psbA+ cells might serve as the seed for the resistant phenotypes often observed in small subpopulation that recovered from viral infection38. The transition between different phenotypic states could be mediated by an array of infochemicals, such as viral glycosphingolipids37,39, or by extracellular vesicles40 (Fig. 2E). Virion egress from the host cells without induction of cell death may provide an optimal co-existence mechanism during bloom initiation phase41.
The consequences of viral infection in the ocean are not limited to the cell fate of the individual host cell. Viral infection can also lead to aggregate formation, mediated by production of transparent exopolymer particles (TEP) consisting of acidic polysaccharides, which are classically quantified in bulk by staining with Alcian Blue42. Aggregates accelerate sinking of biomass, contribute to “marine snow” and enhance carbon export to the deep sea3. In order to assess the contribution of viral infection to aggregate formation, we quantified aggregated E. huxleyi cells and characterized the infection state among individual cells within the aggregates using Virocell-FISH (Fig. 3A). Upon infection, up to 40% of the algal cells (DAPI positive fraction) were found within aggregates (Fig. 3B). At the early stage of infection, aggregates are rare (<10%), mostly infected (75% of the aggregates were mcp+) and photosynthetically active (100% were psbA+) (Fig. 3D, 3E). At the onset of the lytic phase (48 hpi), aggregates were highly abundant, less infected (25% were mcp+) and less photosynthetically active (30% were psbA+). In infected cultures at 8 hpi, the fraction of mcp+ aggregates was higher than the fraction of mcp+ single cells (75% and 45%, respectively, Fig. 1F and Fig. 3D). We hypothesize that aggregates enriched with infected cells may favor sinking of newly produced virions out of the photic zone and prevent further dissemination of viruses in the bloom, suggesting a host defense strategy3,28. The overall presence of infected cells in aggregates corroborates previous observations of TEP-attached viruses42,43. This could further explain the estimates of 109 viruses per gram of marine sediment, some being infectious, hence may serve as a possible inoculum to infect subsequent blooms44,45.
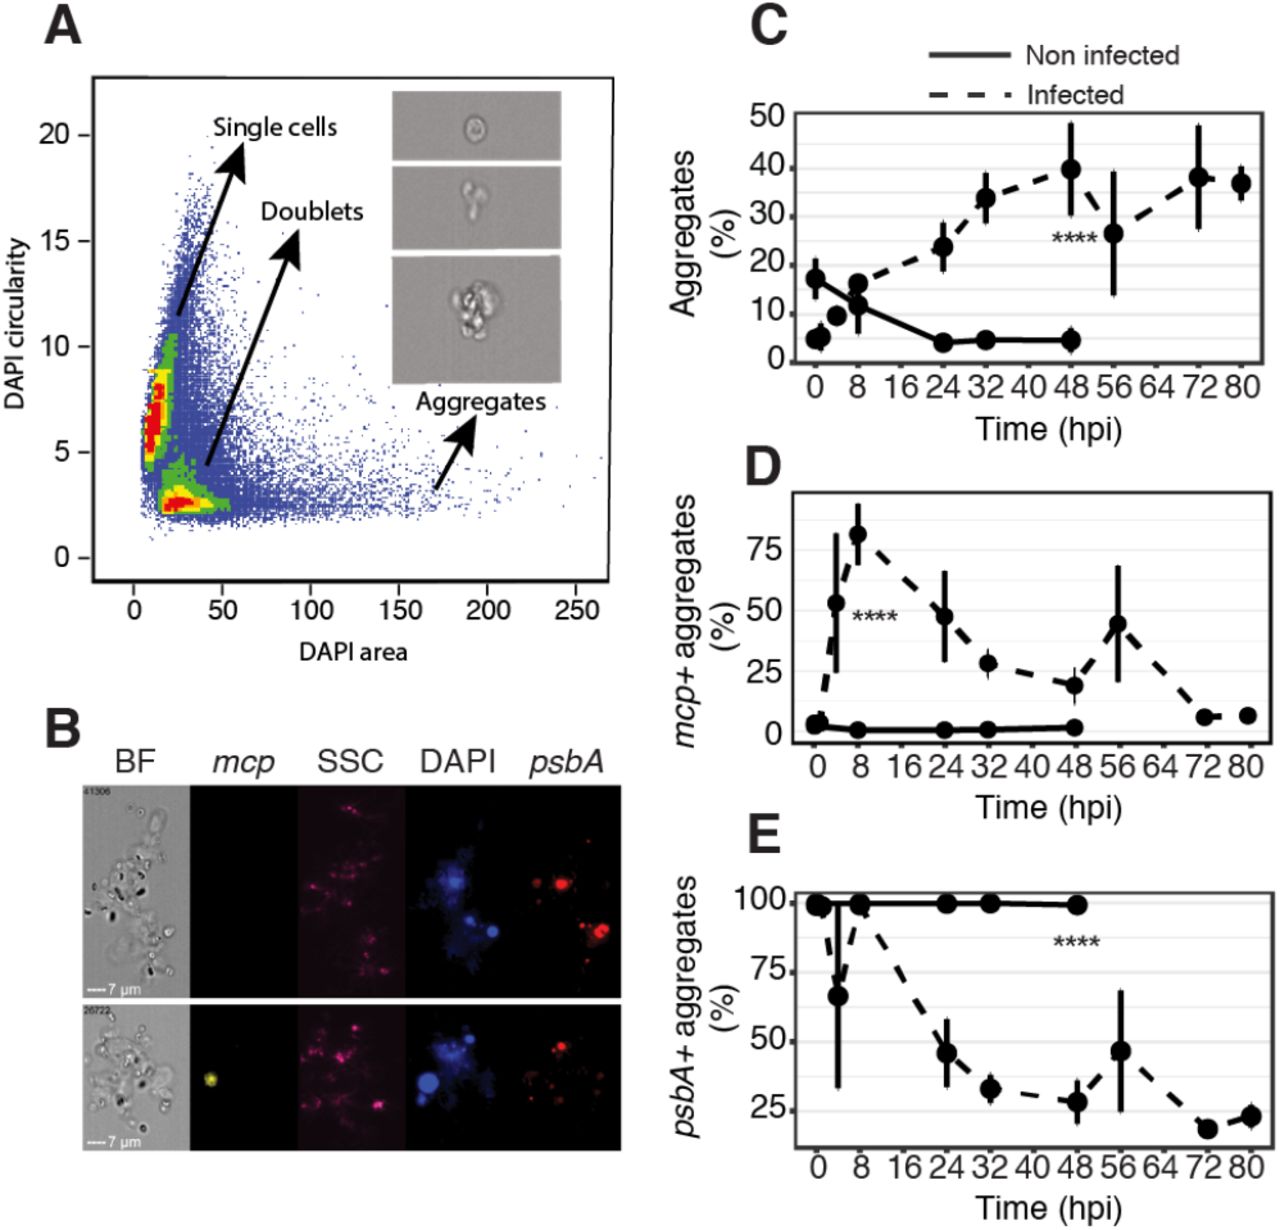
(A) Based on the DAPI mask area and circularity (the degree of the mask’s deviation from a circle), three populations are identified as single cells, doublets and aggregates (aggregates are defined by a DAPI area above 60 μm2). (B) Imaging flow-cytometry images of non-infected (top) and infected (bottom) aggregates in the brightfield (BF), mcp (yellow), Side Scatter (SSC as a proxy for calcification, pink), DAPI (blue), and psbA (red) channels. (C) Fraction of aggregates (DAPI area above 60 μm2) out of all DAPI+ events in infected and non-infected cultures. (D, E). Quantification of mcp+ and psbA+ aggregates respectively, through time across three replicates between infected and non-infected cultures. **** P < 0.0001 (t-test).
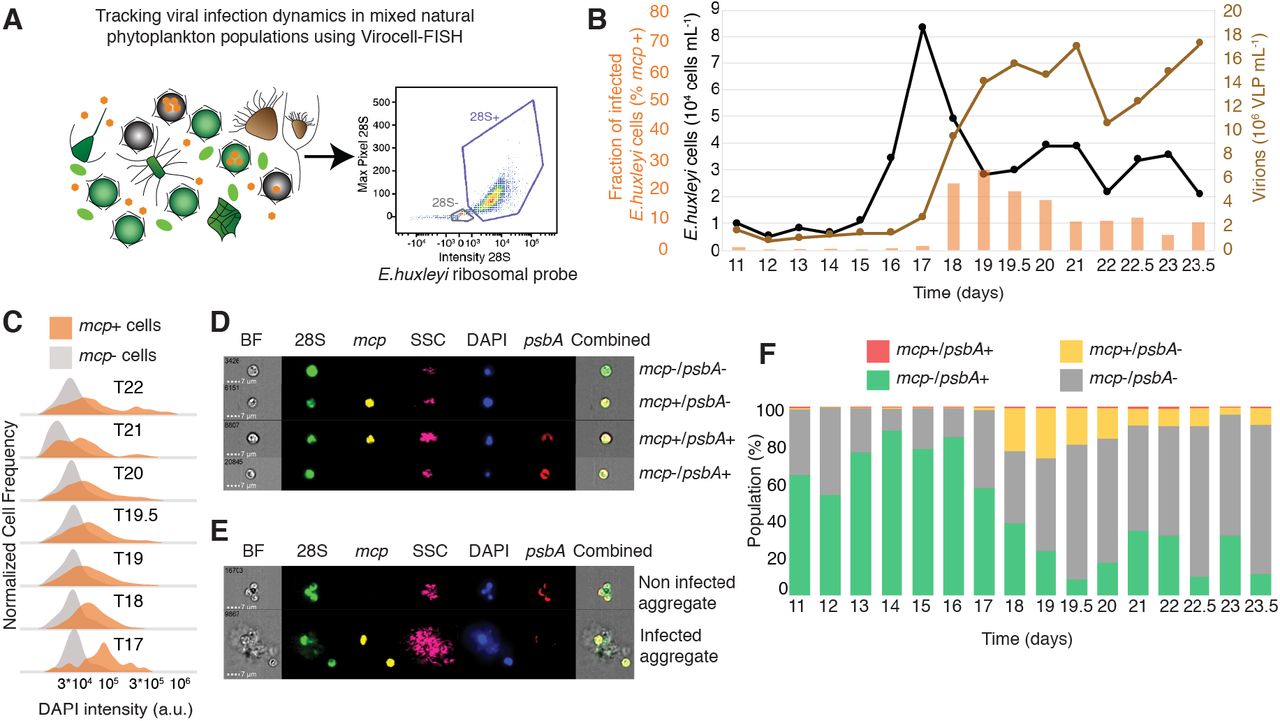
One of the fundamental knowledge gaps in aquatic virology is the ability to quantify active viral infection in natural populations and to mechanistically resolve the viral impact on microbial ecosystems. We therefore conducted a mesocosm experiment in a Fjord near Bergen, Norway, and collected samples for Virocell-FISH analysis across different phases of an E. huxleyi bloom. We quantified viral infection specifically in E. huxleyi cells by using a 28S ribosomal probe unique to that algae, a psbA probe as a proxy for host metabolic state and a probe targeting viral mcp transcripts (Fig. 4A). Virocell-FISH analysis conducted by imaging flow cytometry successfully revealed the fraction of infected E. huxleyi cells during bloom succession, based on over 5000 cells at each time point (Fig. S7). From the initiation of the bloom to the peak in E. huxleyi abundance, infection level (% of mcp+ cells) was minimal (<1%). A tipping point was detected in which the fraction of infection cells rose from 1.51% on day 17 to 23.22% on day 18 while cell abundance dropped at the onset of bloom demise (Fig. 4B). Strikingly, the maximal fraction of infected cells on the demise phase, did not reach beyond 27% of E. huxleyi population even at the highest levels of E. huxleyi infection. Furthermore, mcp+ cells displayed higher DAPI intensity than mcp− cells (Fig. 3C), confirming laboratory results regarding the induction of de-novo nucleotide synthesis in infected cells. Quantification of co-expression of mcp and psbA over the course of the bloom (Fig. S8) revealed a major drop in mcp−/psbA+ cells between days 16 and 18, accompanied by an increase in mcp+/psbA- cells. From day 19 onwards a large fraction of the E. huxleyi population was mcp−/psbA- resembling increase in the fraction of cell death during bloom demise (Fig. 4F). These results suggest algal bloom demise can be synchronized despite co-existence of diverse virocell states and only a subpopulation of infected cells. We suggest that other mortality agents might act in concert with viral lysis to control synchronized bloom demise at a later stage. These top-down regulators may include pathogenic bacteria46, eukaryotic parasites and grazers3,47,48, programmed cell death of non-infected bystander cells mediated by release of viral-derived infochemicals37,39 or extracellular vesicles40. Alternatively, a highly synchronized viral infection and release might have occurred in a large fraction of the E. huxleyi population in a narrow time frame between day 17 and 18. Indeed, recent reports demonstrated that viruses are intrinsically synchronized with the daily rhythms of their photosynthetic host both in controlled lab experiments and in natural populations49,50.
(A) Applying Virocell-FISH to track viral infection of E. huxleyi cells within mixed natural microbial populations. Viral mRNA was targeted using the mcp probe whilst host mRNA was monitored using psbA; an additional probe specifically targeting the 28S ribosomal RNA of E. huxleyi was used to identify our host of interest, based on the intensity and max pixel of the probe signal. (B) Fraction of infected (mcp+) E. huxleyi cells (orange), abundance of calcified E. huxleyi cells (black) and EhV like particles (brown) throughout bloom succession (days post inoculation) in a mesocosm experiment. Active viral infection in E. huxleyi cells was measured using Virocell-FISH; E. huxleyi and EhV-viral like particles abundance were measured by flow-cytometry. Days with 0.5 digit represent evening samples. (C) Comparison of DAPI intensities between infected and non-infected E. huxleyi populations throughout bloom succession. (D, E) Visualizing subpopulation of E. huxleyi single cells and aggregates respectively, using ImageStream. (F) Quantification of the relative abundance of the four subpopulations in single cells throughout the bloom succession, by co-probing of host and viral mRNA (psbA and mcp respectively).
Our approach opens up new avenues to study individual virocells in the marine environment, by following infection dynamics both intra- and extracellularly of morphologically intact cells. It unravels fundamental aspects of the life cycle of a large virus by linking scales between single cell and population level dynamics, showing viral increase without cell lysis, and cell lysis without viral increase. Such high-resolution examination of host and virus transcriptional states reveals cell-to-cell heterogeneity in viral infection, mediated by the dependence on the host metabolic state, despite synchronized bloom demise. Concomitantly, it can inform about viral hijacking mechanisms of the host photosynthetic machinery. Coupling enhanced viral and photosynthetic transcriptions may require to maintain photosynthetic activity to energize the redirection of carbon flux from the Calvin cycle to the pentose phosphate pathway in order to enhance production of NADPH required for de novo DNA synthesis51 to meet the high demand of DNA synthesis of giant viruses and to enhance the antioxidant capacity under oxidative stress52. Therefore, we propose that a functional convergence arises among viruses infecting phototrophs from diverse evolutionary origin, whereby cyanophages53, small RNA plant viruses54 and large algal dsDNA viruses share the strategy to manipulate their photosynthetic host metabolism by different mechanisms. Quantifying the virocells infection and metabolic states, through their diverse phenotypes will help integrate viral-dependent processes in ecosystem models by providing necessary numbers of infection dynamics, such as the fraction of actively infected cells, resistant cells, the nature of sinking biomass, as well as their genetic composition as a function of time and other stresses55. Finally, this quantitative approach can be expanded to diverse host-pathogen and host-symbiont systems with important ecological significance, adding a mechanistic dimension to the field of marine microbial ecology.
Funding
This work was supported by the European Research Council (ERC) CoG (VIROCELLSPHERE grant # 681715; A.V.), the Israeli Academy for Science and Humanities and Weizmann Dean of Faculty (F.V.)
Author contributions
F.V. and A.V. designed and conceptualized the study. U.S. developed smFISH on E. huxleyi and F.V. implemented it in high throughput. Z.P. helped with ImageStream analysis F.V. prepared the cell cultures, performed all acquisition and data analysis. F.V. prepared the figures and wrote the manuscript with A.V. and input from U.S.; A.V. supervised the study
Competing interests
Authors declare no competing interests
Data and materials availability
All data, code, and materials used in the analysis are available upon demand.
Supplementary Materials
Materials and Methods
Table S1
Table S1. Calculation of virus:host ratio using the MPN method
Figures S1-S13
Fig. S1. Dynamics of subpopulations during infection in EhV201
Fig. S2. Comparison of Virocell-FISH with single-cell RNA-Seq
Fig. S3. mcp and DAPI intensities in single cells throughout infection
Fig. S4. Morphology of metabolically active infected and non-infected cells
Fig. S5. Temporal dynamics of psbA intensities in psbA + subpopulations
Fig. S6. Chlorophyll mean intensity during infection
Fig. S7. Adapting Virocell-FISH to target specifically E.huxleyi in environmental samples
Fig. S8. Defining mcp/psbA subpopulations in environmental samples.
Fig. S9. Pipeline of single cell identification in ISX (Only SM)
Fig. S10. Comparison of the Virocell-FISH method with or without RNAase treatment (Only SM)
Fig. S11. Quantifying infected cells in microscopy data using CellProfiler (Only SM)
Fig. S12. Gene expression of psbA and mcp in single cell RNA-seq sequencing data (Only SM)
Fig. S13. Flow cytometry gates used for E. huxleyi cells in the field(Only SM)
Acknowledgments
We thank S. Itzkovitz, L. Farack, S. Ben-Moshe for guidance in smFISH protocols, analysis, and fruitful discussions; D. Hirsch for training on the epifluorescence microscope. The AQUACOSM-VIMS consortium for the mesocosm experiment and all Vardi lab members for discussion. We particularly thank G. Schleyer and D. Schatz for critical reading, and R. Avraham for useful critical feedback
References and Notes


