

ABSTRACT
The H3K27me2/me3 histone demethylase KDM6B is over-expressed in neuroblastoma and essential to neuroblastoma cell survival. While the KDM6B inhibitor, GSK-J4, has shown activity in in vitro and in vivo preclinical models, the mechanism of action remains poorly defined. We demonstrate that genetic and pharmacologic inhibition of KDM6B downregulate the pRB-E2F transcriptome and MYCN expression. Chemical genetics analyses show that a high E2F transcriptome is positively correlated with sensitivity of cancer cells to the KDM6 inhibitor GSK-J4. Mechanistically, inhibition of KDM6B activity reduces the chromatin accessibility of E2F target genes and MYCN. GSK-J4 alters distribution of H3K27me3 and broadly represses the enhancer mark H3K4me1, which may consequently disrupt the long-range chromatin interaction of E2F target genes. KDM6B inhibition phenocopies the transcriptome induced by the specific CDK4/6 inhibitor palbociclib. Overexpression of CDK4/6 or Rb1 knockout not only confers neuroblastoma cell resistance to palbociclib but also to GSK-J4. A gene signature targeted by KDM6B inhibition is associated with poor survival of patients with neuroblastoma regardless of the MYCN status. These data indicate that KDM6B activity promotes an oncogenic CDK4/6-pRB-E2F pathway in neuroblastoma cells via H3K27me3-dependent enhancer-promoter interactions, providing a rationale to target KDM6B for high-risk neuroblastoma.
INTRODUCTION
KDM6 is a Jumonji domain-containing H3K27me3/me2 demethylase subfamily1–4, antagonizing the activity of polycomb repressive complex 2 (PRC2)5, the methyltransferase of H3K27. KDM6 consists of 3 members, KDM6A, KDM6B and UTY, although UTY has low lysine demethylase activity6. While KDM6A is believed to be a tumor suppressor and is mutated in many different types of cancer7,8, the function of KDM6B in cancer remains poorly defined. Early studies have shown that KDM6B contributes to activation of the Ink4a/Arf locus in fibroblasts in response to oncogenic stress9,10, and nuclear p53 protein stabilization in glioblastoma cells11. Loss of KDM6B enhances aggressiveness of pancreatic cancer cells12. These data suggest KDM6B might have a tumor suppressive function. However, KDM6B is overexpressed in various cancers13, indicating that KDM6B may play different roles depending on the cellular context. KDM6B appears to be essential for the initiation and maintenance of NOTCH-driven acute T-cell lymphoblastic leukemia14, regulates multiple myeloma cell growth and survival by modulating the MAPK pathway15, drives glioblastoma stem cell plasticity and drug tolerance by chromatin remodeling16, and promotes migration, invasion, and stem cell-like behaviors in hepatocellular carcinoma17. KDM6B is also involved in chemotherapy resistance18.
Neuroblastoma, the most common extra-cranial solid tumor in children, arises as a result of blocked differentiation of neural crest precursors (NCCs) during development of the sympathetic nervous system19,20. This aggressive malignancy accounts for 15% of cancer-related deaths in children21. Although outcomes for children with low- or intermediate-risk disease are excellent, fewer than 50% of children with high-risk disease survive despite aggressive multimodal therapy. In patients with high-risk disease, one key biological feature associated with poor prognosis is amplification of the MYCN oncogene (MNA)22. As a master lineage transcription factor that drives tumorigenesis, the functions of MYCN have been associated with targetable epigenetic modifiers23–25. Our previous study demonstrated that the histone demethylase KDM4B regulates MYC activity and promotes tumor growth and maintenance of neuroblastoma26. More recently, we identified a novel KDM4B inhibitor ciclopirox27, that inhibits tumor growth and promotes differentiation27. EZH2, the essential catalytic unit of PRC2 complex, is a MYCN target that represses neuronal differentiation in a H3K27me3-dependent manner, leading to inactivation of a tumor suppressive program in neuroblastoma28.
In this study, we show that KDM6B is highly expressed in neuroblastoma and its genomic locus is broadly marked with transcriptionally active histone modifications and transcription factor binding. Using chemical genetic and epigenetic approaches, we show that KDM6B is involved in regulation of the key oncogenic CDK4/6-pRB-E2F pathway and expression of both MYCN and C-MYC proto-oncogenes. Furthermore, the E2F transcriptome serves as a biological marker of KDM6 inhibitor sensitivity. Pharmacological inhibition of KDM6B activity alters the chromatin accessibility of E2F target genes and MYCN, induces the redistribution of H3K27me3 and broad reduction of enhancer mark H3K4m1. We propose that this may disrupt the long-range chromatin interaction of E2F transcriptome within the same topologically associated domains (TAD). At the level of transcriptome, KDM6B inhibition mimics the CDK4/6 inhibitor palbociclib. Cancer cells resistant to CDK4/6 inhibitor also are resistant to KDM6B inhibition. The gene signature targeted by KDM6 inhibition was associated with poor patient survival. Thus, our studies reveal that KDM6B regulates the oncogenic CDK4/6-pRB-E2F pathway in neuroblastoma, revealing a new mechanism of regulation of the E2F transcriptome by an epigenetic modulator.
RESULTS
KDM6B is highly expressed in human neuroblastoma and is associated with a transcriptionally active epigenetic landscape
We have previously shown that KDM6B, but not KDM6A or UTY, is essential for neuroblastoma cell survival27. To more clearly define the role of KDM6B in neuroblastoma, we first compared expression of KDM6 family genes in normal trunk neural crest-derived tissues, neuroblastoma being a neural crest-derived cancer of the peripheral nervous system29, with expression in tumors in 4 different neuroblastoma patient cohorts30–32. While expression of KDM6A and UTY did not show consistent differences in tumors as compared to normal tissue of neural crest origin, KDM6B expression was significantly elevated across all 4 neuroblastoma cohorts (p<0.001) (Figure 1A-1C). We also found that levels of KDM6B expression, but not KDM6A or UTY, in neuroblastoma cell lines were among the highest, across 40 different cancer lineages (Supplementary Figure 1A). Analysis of the data from 15 subtypes of pediatric cancers (PCGP project performed at St Jude) also showed KDM6B expression was among the highest in neuroblastoma (Supplementary Figure 1B). We then compared the RNA-seq transcript counts of KDM6B, KDM6A and UTY in three large neuroblastoma cohorts and found that expression of KDM6B was significantly higher than that of KDM6A or UTY (Figure 1D-1F).

(A) The expression of KDM6B from different cancer lineages. The RNA-seq data was downloaded from https://portals.broadinstitute.org/ccle. Y-axis represents the Fragment Per Kilobase of transcript per Million (FPKM) mapped reads.
(B) The expression of KDM6B from different cancer lineages. The RNA-seq data was downloaded from https://pecan.stjude.cloud. Y-axis represents the Fragment Per Kilobase of transcript per Million (FPKM) mapped reads.

(A-C) The expression of KDM6B, KDM6A and UTY in normal human trunk neural crest (GSE14340) and 4 different neuroblastoma cohorts (Versteeg GSE16476, Delattre GSE14880, Hiyama GSE16237, Lastowska GSE13136). Y-axis represents the normalized log2 expression value. ***p<0.001, student t test
(D-F) The expression of KDM6B, KDM6A and UTY in 3 different neuroblastoma RNA-seq cohorts. The RNA-seq data of St Jude was downloaded from https://pecan.stjude.cloud. The RNA-seq data of TARGET and SEQC datasets were downloaded from R2 (https://hgserver1.amc.nl/cgi-bin/r2/main.cgi). Y-axis represents the Fragment Per Kilobase of transcript per Million (FPKM) mapped reads.
(G) The epigenetic landscapes consisting of histone marks and transcription factor binding distinguish KDM6B from KDM6A in primary neuroblastoma tissues with MYCN amplification or without MYCN amplification (https://pecan.stjude.cloud/proteinpaint/study/mycn_nbl_2018).
(H) Crystal violet staining of colonies after BE2C and SKNAS cells were transfected with four different siRNA oligos to knockdown KDM6B for 7 days. siCtrl = siRNA control oligo, NT= no treatment.
(I) Western blot analysis with indicated antibodies to assess MYCN or C-MYC expression after 3-day transfection of 4 different siRNA to knockdown KDM6B in BE2C and SKNAS.
Gene transcription status is usually associated with a distinct epigenetic landscape. For example, high levels of H3K4me1, H3K4me3 and H3K27Ac are marks of active gene transcription while high levels of H3K27me3 and H3K9me3 are marks of repressive gene transcription33. To determine whether high expression of KDM6B in neuroblastoma is associated with active epigenetic modifications, we investigated the epigenetic landscapes at the genomic loci of KDM6B, KDM6A and UTY in 7 primary human neuroblastoma tissues, 4 with MNA and 3 without MNA (Figure 1G, Supplementary Figure 2). Regardless of the MYCN status, the genomic locus of KDM6B across 22-kb in length in all 7 human neuroblastoma cell lines is occupied by RNA polymerase II, which drives gene transcription, in accordance with enrichment of active gene transcription marks H3K4me1, H3K4me2, H3K4me3, H3K27Ac, H3K9-K14Ac, and H3K36me3. However, no transcriptionally repressive H3K27me3 and H3K9me3 marks were occupied at the KDM6B locus. The broad occupation of H3K4me1 and H3K27Ac across the whole locus of KDM6B indicates that a super-enhancer34,35 may regulate the expression of KDM6B in neuroblastoma. In contrast, the epigenetic landscapes at the KDM6A and UTY loci appeared to lack transcriptionally active gene transcription marks (Figure 1G, Supplementary Figure 2). The promoter region and gene body of KDM6A were occupied by the transcriptionally repressive marks H3K27me3 and H3K9me3, respectively. In summary, KDM6B is highly expressed in human neuroblastoma and its genomic locus is epigenetically modified for active gene transcription, which is distinct from its paralogs KDM6A and UTY.
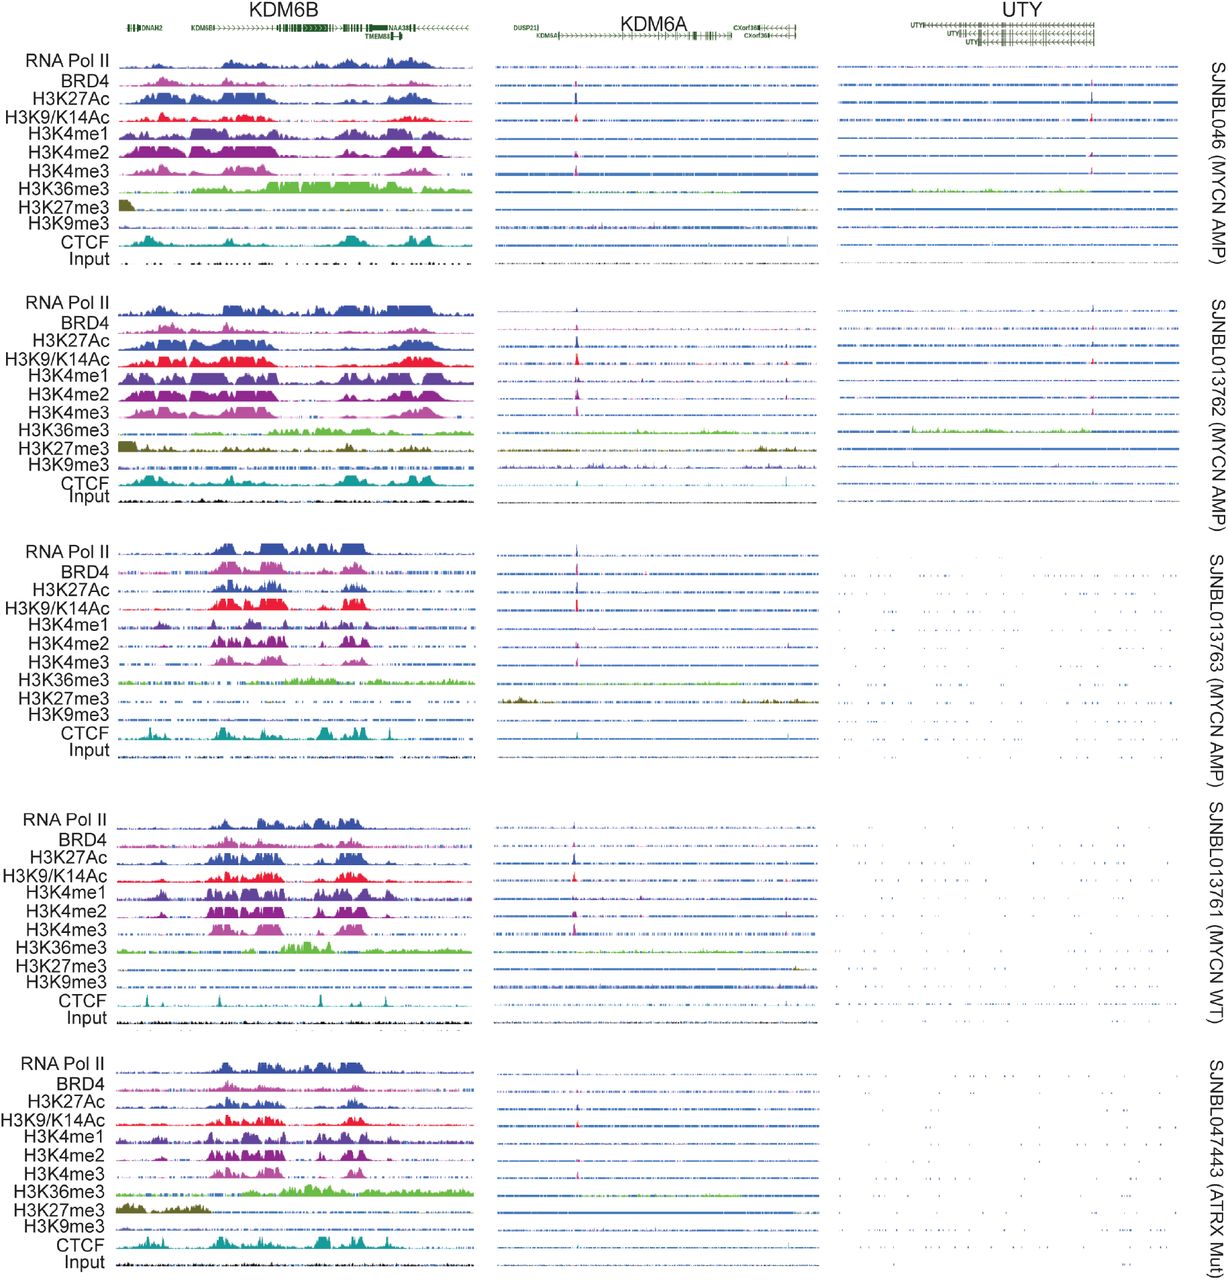
The epigenetic landscapes consisting of histone marks and transcription factor binding distinguish KDM6B from KDM6A and UTY in primary neuroblastoma tissues with MYCN amplification (SJNBL046, SKNBL013762, SJNBL013763), without MYCN amplification (SJNBL013761), or with ATRX mutation (SJNBL047443).
KDM6B regulates MYC expression
We further validated the importance of KDM6B in neuroblastoma by assessing colony formation after knocking down KDM6B with 4 different siRNAs in BE2C cells (with MNA) and SK-N-AS cells (with high C-MYC activity). KDM6B depletion greatly reduced colony formation in both neuroblastoma cell lines, and was correlated with the KDM6B knockdown efficiency (Figure 1H,1I), consistent with our previous study27. Notably, depletion of KDM6B led to MYCN and C-MYC reduction in neuroblastoma cells (Figure 1I). We found that KDM6B also regulated MYC expression in other cancer lineages such as lung cancer, osteosarcoma, and colorectal cancer cells and that this was independent of p53 status (Supplementary Figure 3). These data indicate that KDM6B is needed for MYC expression in cancer.

(A-D) Western blot analysis with indicated antibodies to assess MYCN or C-MYC expression after 3-day transfection of 3 or 4 different siRNA to knockdown KDM6B in lung adenocarcinoma A549 (A), osteosarcoma U2OS (B), colorectal HCT116 (C) and p53 null isogenic HCT116 cells (D).
KDM6B regulates an pRB-E2F transcription program in neuroblastoma
To investigate the molecular function of KDM6B in neuroblastoma, we performed RNA-seq followed by gene set enrichment analysis (GSEA) after knockdown of KDM6B in BE2C cells. Strikingly, GSEA results showed that the top hits of KDM6B downstream targets were enriched with E2F gene sets, Rb1 knockout signatures (Rb1 encodes pRB, is a negative regulator of E2F activity36) and other cell cycle gene signatures (Figure 2A-2C). Motif analysis of the KDM6B target genes also revealed that they were mainly enriched with E2F binding motifs (Table 1). These data indicate that KDM6B regulates the transcriptome of the E2F pathway in neuroblastoma cells. The E2F transcription factors are critical regulators of cell cycle progression by directly regulating more than 100 genes including those encoding cyclins37. Early studies showed that E2F also binds to promoters of C-MYC and MYCN to regulate their expression38,39. GSEA data revealed that MYC targets were also significantly downregulated by KDM6B depletion (Figure 2A).

(A) Quantitative comparison of all chemical and genetic perturbation gene sets (n = 3403) from the MSigDB by gene set enrichment analysis (GSEA) for increased (left) and reduced (right) expression of global genes caused by KDM6B knockdown. Data are presented as a scatterplot of normalized p value/false discovery q value vs normalized enrichment score (NES) for each evaluated gene set. The gene sets circled in red color indicate cell cycle, pRB-E2F and MYC pathway gene sets.
(B) Two examples of GSEA show that genes downregulated by depletion of KDM6B are enriched with Rb1 knockout and E2F targets.
(C) Heatmap shows the gene list from the E2F targets (B).
(D-F) Similar analysis for GSK-J4 treatment as shown in (A-C).
Transcription factor binding motif enrichment for KDM6B target genes (top15)
We further investigated KDM6B function using pharmacologic inhibition. Treatment of neuroblastoma cells and normal human fibroblasts (HS68) with GSK-J4, the only selective KDM6 inhibitor40, in a colony formation assay, showed that GSK-J4 inhibited colony formation in a concentration-dependent manner, with significant effect observed in the majority of cell lines at concentrations of 1.0-2.0μM (Supplementary Figure 4A). However, HS68 cells were unaffected by GSK-J4. Consistent with these results, another recent study showed that GSK-J4 has a potent effect on neuroblastoma cell survival41. To define the molecular mechanism of GSK-J4 action on neuroblastoma cells, we performed global gene expression profiling for GSEA analysis after GSK-J4 treatment of BE2C cells. GSK-J4 induced a very similar transcriptome profiling as depletion of KDM6B and most the gene sets most significantly downregulated by this inhibitor were enriched with cell cycle, Rb1 knockout and E2F pathways (Figure 2D-2F). Transcription factor motif binding analysis showed that genes downregulated by GSK-J4 were greatly enriched with E2F binding (Table 2). Again, MYCN and C-MYC expression were also downregulated by GSK-J4 treatment (Supplementary Figure 4B-4D), consistent with KDM6B depletion (Supplementary Figure 3). Thus, GSK-J4 phenocopied KDM6B depletion in neuroblastoma cells and therefore its therapeutic effect may be mediated through inhibition of KDM6B. Taken together, genetic and pharmacologic inhibition of KDM6B predominantly leads to downregulation of the pRB-E2F transcriptional program in neuroblastoma cells.

(A) Crystal violet staining of colonies after neuroblastoma cell lines and human normal fibroblast HS68 cells were treated with different concentrations of GSK-J4 for 7 days.
(B-D) Western blot analysis with indicated antibodies to assess MYCN or C-MYC and H3K27me3 expression after 48-hour treatment with GSK-J4 of BE2C (B), CHLA20 (C) and SKNAS cells (D)
Transcription factor binding motif enrichment for GSK-J4 target genes (top 15)
Pharmacogenetics reveals that the E2F transcriptome is associated with sensitivity to KDM6B inhibition
While the presence of KDM6B is a prerequisite for GSK-J4 activity in neuroblastoma cells41, expression levels of KDM6B do not correlate with GSK-J4 sensitivity41. A biomarker that predicts therapy response is critical for patient stratification. Since KDM6B inhibition appears to affect its anti-tumor activity through downregulation of the E2F transcriptome, we hypothesized that high levels of the E2F transcriptome may correlate with the response of cancer cells to KDM6B inhibition. The gene signatures induced by chemical (i.e., small-molecule) or genetic perturbations (i.e., siRNA knockdown) can be used to connect unknown mechanisms of action (MoA) of chemical probes. The differential gene expression has been correlated with patterns of small-molecule sensitivity across many cell lines to illuminate the actions of compounds whose MoA are unknown42,43. The Cancer Therapeutic Response Portal correlated the sensitivity patterns of 481 compounds including GSK-J4 with 19,000 basal transcript levels across 823 different human cancer cell lines and identified selective outlier transcripts42,43, which allowed us to interrogate whether the KDM6B inhibitor activity was correlated with specific transcripts. The E2F genes such as E2F8 were the ones most significantly affected by KDM6B inhibition (Figure 2). E2F8 is an atypical E2F and downstream target of E2F1-344. We chose E2F8 as a representative gene to correlate E2F pathway activity with drug effect. Strikingly, GSK-J4 ranked highest among the top compounds whose cellular activity was correlated with E2F8 expression (Pearson correlation R=-0.528, z-score = - 4.56, Figure 3A). We arbitrarily chose 13 cell lines with high E2F8 expression as group A, and 8 cell lines with low E2F8 expression as group B, which had high sensitivity and low sensitivity to GSK-J4, respectively (Figure 3B). We then used GSEA to infer the pathways that differed in the two groups. We found that the pRB-E2F gene sets were the most significant hits in group A cell lines (Figure 3C, 3D). The genes highly expressed in group A cells were profoundly enriched with E2F transcription factor binding motifs (Supplementary Table S1), and most of the top 50 genes such as E2F1 and E2F8 are involved in regulation of the cell cycle (Supplementary Figure 5A). MYC signatures were also enriched in group A cells (Supplementary Figure 5B-5D). We also selectively investigated several other E2F genes including ASF1B, CDK2 and E2F1, all of which were positively correlated with GSK-J4 sensitivity (Supplementary Figure 5E-5G). Therefore, cancer cells with high E2F activity appear to be more sensitive to KDM6B inhibition.

(A) The GSEA heatmap shows the top 50 genes highly expressed in GSK-J4 sensitive (group A) vs resistant (group B), after analysis of data which was extracted from The Cancer Therapeutics Response Portal (CTRP).
(B-D) GSEA show that genes highly expressed in GSK-J4 sensitive (group A) cells are enriched with MYC gene sets.
(E-G) The Pearson correlation of GSK-J4 with expression of E2F target genes, ASF1B(E), CDK2 (F), E2F1 (G), analyzed by using the online program https://discover.nci.nih.gov/cellminercdb/.
Transcription factor motif (TFT) for group A cells in Figure 3B
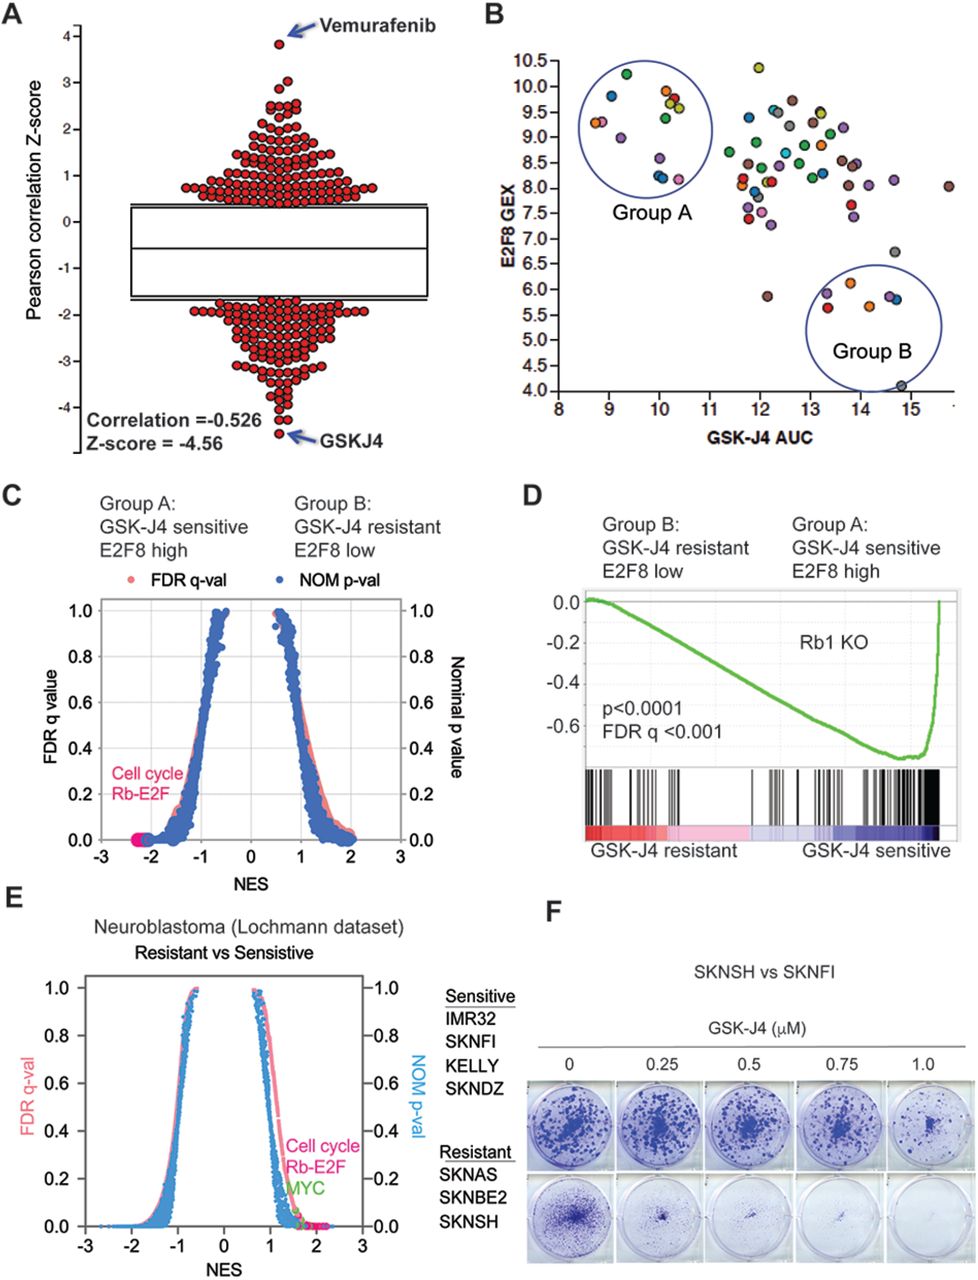
(A) The Pearson correlation Z-score for each tested compound with E2F8 expression, which was extracted from The Cancer Therapeutics Response Portal (CTRP). The correlation of GSK-J4 and E2F8 ranked on the top with R=-0.626, Z-score =-4.56.
(B) The plot of E2F8 expression and GSK-J4 sensitivity for each tested cell line. The y-axis represents the transcript expression levels of E2F8 in each cell line. The x-axis represents the drug response metrics (area under curve, AUC) to GSK-J4. The lower the AUC, the more sensitive to GSK-J4. The circled group A and B populations are arbitrarily chosen as GSK-J4 sensitive vs resistant.
(C) Quantitative comparison of all chemical and genetic perturbation gene sets (n = 3403) from the MSigDB by gene set enrichment analysis (GSEA) for GSK-J4 sensitive (group A) and resistant (group B). Data are presented as a scatterplot of normalized p value/false discovery q value vs normalized enrichment score (NES) for each evaluated gene set. The red dots highlight cell cycle and Rb-E2F pathway gene sets.
(D) GSEA show that genes highly expressed in GSK-J4 sensitive (group A) cells are enriched with Rb1 knockout.
(E) Quantitative comparison of all chemical and genetic perturbation gene sets (n = 3403) from the MSigDB by gene set enrichment analysis (GSEA) for GSK-J4 sensitive and resistant neuroblastoma cells, as shown in the right panel of cell lines. Data are presented as a scatterplot of normalized p value/false discovery q value vs normalized enrichment score (NES) for each evaluated gene set. The red and green dots highlight cell cycle and Rb-E2F pathway gene sets and MYC gene sets, respectively.
(F) Crystal violet staining of colonies after SK-N-SH and SK-N-FI neuroblastoma cell lines were treated with different concentrations of GSK-J4 for 7 days.
To specifically investigate the conclusion that high E2F activity serves as a biomarker for sensitivity to KDM6B inhibition in neuroblastoma, we categorized neuroblastoma cell lines into two groups according to their IC50 to GSK-J441. GSEA analysis of RNA-seq data of these cell lines showed very similar transcriptome pattern to KDM6B knockdown or GSK-J4 inhibition for those with lower IC50 to GSK-J4 (more sensitive), which were enriched with E2F and MYC gene signatures (Figure 3E). For example, SK-N-FI cells with high E2F transcriptome were more sensitive to GSK-J4 than SK-N-SH cells (Figure 3F), which had lower expression of E2F transcriptome. The genes highly expressed in neuroblastoma cells that were more sensitive to GSK-J4 were predominantly enriched with E2F transcription factor binding motifs (Table 3). Taken together, these data demonstrate that high E2F gene signature is correlated with GSK-J4 sensitivity, and thus it may serve as a biomarker for effectiveness of KDM6B inhibitors in cancer treatment in the future. These data also further support that KDM6B regulates the E2F transcriptome.
Transcription factor binding motif enrichment for neuroblastoma cells sensitive to GSK-J4
Inhibition of KDM6B activity reduces the chromatin accessibility of E2F target genes
To understand how KDM6B regulates the E2F pathway, we performed Assay for Transposase-Accessible Chromatin with high-throughput sequencing (ATAC-seq) after 24h and 48h of GSK-J4 treatment, for mapping genome-wide chromatin accessibility45. The 24h GSK-J4 treatment resulted in upregulation of 8386 nucleosome free, open chromatin regions (log2 fold change >=0.5, p<0.05, Figure 4A), 46.9% of which were located at the annotated promoter regions (within 2-kb from transcription start site, TSS) and 39% of which were located at the annotated enhancer regions (2-50kb distance from TSS). The rest (14.1%) were located at more distal regions. However, 9574 nucleosome free, open chromatin regions were downregulated by GSK-J4 treatment (Figure 4A), only 18.5% of which were located at the promoter regions and 61.8% of which were located at enhancer regions, while 19.7% were located at more distal regions. The 48h GSK-J4 treatment further enhanced its effect on DNA accessibility, resulting in an increase of 13546 and decrease of 11027 peaks, respectively (Figure 4A). The proportions of the annotated regions tended to be similar to that of 24h treatment. Among the regions with upregulated chromatin accessibility, 57.6% were located at promoter regions, 29.5% were located at enhancer regions, 12.9% were located at more distal regions (Figure 4A). Among the regions with downregulated chromatin accessibility, 17.9% were located at promoter regions and 57.8% were located at enhancer regions, while 24.3% were located at more distal regions (Figure 4A). We further assessed whether altered chromatin accessibility was associated with changes in gene expression. Indeed, the genes annotated with differential accessibility regions (DARs) at promoters or enhancers were significantly enriched in differentially expressed genes by GSK-J4 treatment (Supplementary Figure 6). For example, DNA accessibility at the promoter region of the oncogene AKT1 was reduced by GSK-J4, and one additional peak at a potential enhancer region near the long non-coding RNA LINC00638 was also decreased (Figure 4B). The reduction of chromatin accessibility was consistent with the reduced expression of AKT1 transcripts. AKT1 is a key molecule in the PI3K-mTOR pathway46, and E2F upregulates AKT activity through a transcription-dependent mechanism47. E2F8, whose expression was downregulated by KDM6B knockdown and GSK-J4 treatment, did not show significant changes in DNA accessibility within its promoter region. However, several peaks at the distal region of E2F8 which extended to the adjacent NAV2 locus were altered by GSK-J4 (Figure 4C). Notably, our RNA-seq analysis showed that the NAV2 locus is not expressed in BE2C cells (Figure 4C). These data suggest that E2F8 expression might be regulated by a distal enhancer that is silenced by KDM6B inhibition. Similarly, we did not observe significant changes at the promoter regions of MYCN, and cell cycle genes (CCNE1, BUB1 and BIRC5); however, the DNA accessibility at the distal regions of these genes were reduced (Supplementary Figure 7A-7D). The downregulation of gene expression by GSK-J4 was not always correlated with reduction of DNA accessibility. For example, chromatin accessibility at the AURKB promoter was increased by GSK-J4 although its transcript expression was reduced (Supplementary Figure 7E), suggesting that the open chromatin may recruit transcription suppressors to repress its gene transcription. For CDKN1A, which encodes p21 to inhibit the CDK2/Cyclin E complex during S phase of cell cycle, the DNA accessibility at its promoter and enhancer regions was enhanced, consistent with its transcript induction by KDM6B inhibition (Supplementary Figure 7F).

GSEA analysis of differentially altered chromatin accessibility regions against the gene expression data based on RNA-seq at 48h treatment by GSK-J4.

The ATAC-seq analysis of MYCN and cell cycle genes (CCNE1, BUB1, BIRC5, AURKB, CDKN1A) shows the alterations of DNA accessibility at their promoter and distal enhancer regions by GSK-J4 treatment for 24h and 48h. RNA-seq data analysis shows the RNA reads effected by GSK-J4 treatment for 24h and 48h.
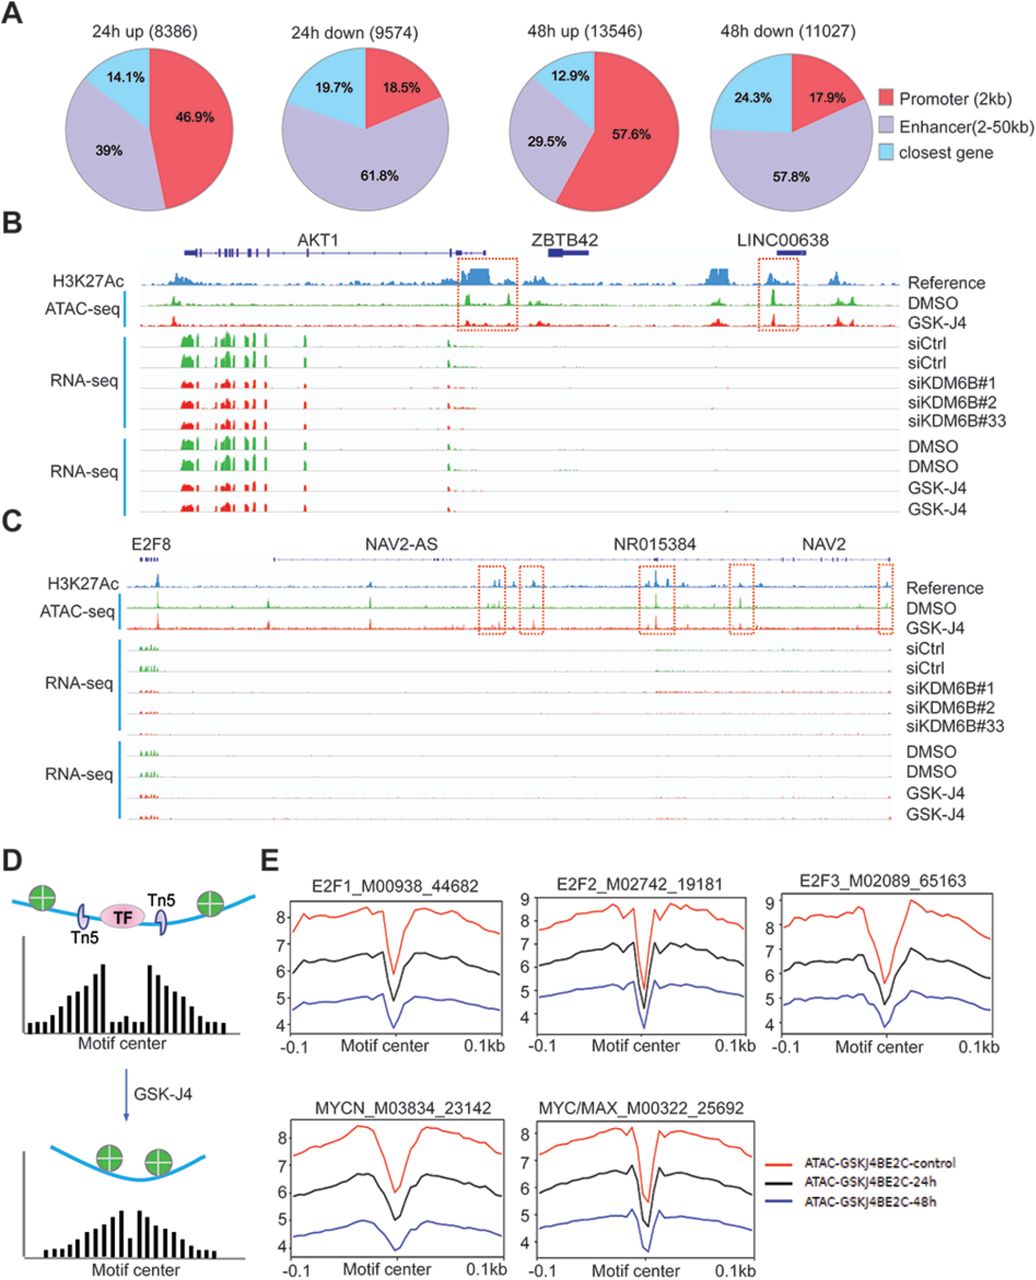
(A) ATAC-seq was performed after BE2C cells were treated with 2.5μM of GSK-J4 for 48 hours. Summary of peak calling number of ATAC-seq (p<0.05, log2 fold change >=0.5) including the upregulated and downregulated nucleosome free regions, and the annotated locations of the peaks at defined promoter and enhancer regions.
(B) Snapshot of AKT1 locus using Integrative Genomic Viewer (IGV) for ATAC-seq, H3K27Ac ChIP-seq, and RNA-seq. The ATAC-seq analysis shows the downregulation of two peaks at the 5’ promoter region of AKT1 and one peak at the non-coding RNA LINC00638. The RNA-seq results showed that AKT1 transcript was downregulated by 48h of GSK-J4 treatment and KDM6B knockdown. H3K27Ac in BE2C cells was referenced to GSM211351897.
(C) Snapshot of E2F8 locus using Integrative Genomic Viewer (IGV) for ATAC-seq, H3K27Ac ChIP-seq, and RNA-seq. The ATAC-seq shows the downregulation of three peaks at the enhancer region of E2F8, next to the NAV2 gene locus. The RNA-seq results showed that E2F8 transcript was downregulated by KDM6B inhibition while the adjacent NAV2 expression is barely detectable.
(D) Cartoon indicates the rationale of footprinting analysis. The DNA motifs bound by transcription factors such as E2F1 protect the cut from transposase Tn5, while the adjacent open chromatin gives rise to a high signal of nucleosome free region after ATAC-seq analysis. After GSK-J4 treatment, the open chromatin was repressed and consequently reducing the reads of free DNA.
(E) Footprinting plot shows the reduction of open chromatin at predicted binding motifs of E2Fs and MYC after BE2C cells were treated with GSK-J4 for 24 h and 48h.
Transcription factor motif analysis of the ATAC-seq data using genomic footprinting demonstrated that E2F binding motifs had reduced DNA accessibility (Figure 4D, 4E). Downregulated open chromatin regions were also observed for MYCN and MYC/MAX binding motifs (Figure 4E). These data indicate that KDM6B inhibition impacts the chromatin accessibility and transcription of E2F and MYC pathway genes.
KDM6B inhibition induces redistribution of H3K27me3 and broad decrease of the enhancer mark H3K4me1
Next, we performed chromatin immunoprecipitation with sequencing (ChIP-seq) to assess the genomewide histone mark alterations induced by GSK-J4, focusing on H3K27me3, the KDM6B substrate, and H3K4me1, the enhancer mark. The results showed that GSK-J4 treatment did not induce a dramatic global change of H3K27me3 marks (Figure 5A); instead, only about 2447 loci were increased (p<0.05; Figure 5B, Supplementary Table S2). Interestingly, 11912 loci of H3K27me3 were reduced although the extent was modest compared with the increased peaks (Figure 5B). Downregulated H3K27me3 peaks were largely identified at intergenic (56.7%) and intronic (38.5%) regions (Figure 5C), while upregulated H3K27me3 peaks were identified at the promoter/TSS regions (16.4%), intergenic regions (32.1%), introns (40.4%) and exons (6%) (Figure 5C). These data demonstrated that the distal non-promoter regions were remarkably impacted by KDM6B inhibition, indicating that regulatory elements such as enhancers may play a critical role in regulating KDM6B-mediated gene expression. Consistent with this assumption, the enhancer mark, H3K4me1, was dramatically downregulated by GSK-J4 at a global level (Figure 5D, 5E), with 24439 peaks downregulated (p<0.05) and only 38 upregulated (Figure 5E, Supplementary Table S3). The downregulated H3K4me1 peaks were mainly identified at intergenic (34.6%) and intron (57.3%) regions (Figure 5F), consistent with the role of H3K4me1 as an enhancer mark48. Our ATAC-seq analysis showed that the DNA accessibility at the E2F8 locus was reduced by GSK-J4, which was consistent with a broad reduction of H3K4me1 and increased H3K27me3 peaks near and on the NAV2 locus (Figure 5G).

(A) ChIP-seq density heatmaps in DMSO control and 2.5μM of GSK-J4 treatment for 48 hours, ranked by H3K27me3 read intensity within ±5kb of peak summits.
(B) Volcano plot shows the genomic loci with significant changes of H3K27me3 (p<0.05).
(C) The distribution of H3K27me3 peaks at different regions of annotated genes. 3’UTR = 3’ untranslated region, 5’UTR = 5’ untranslated region, TSS= transcription start site.
(D) ChIP-seq density heatmaps in DMSO control and 2.5μM of GSK-J4 treatment for 48 hours, ranked by H3K4me1 read intensity within ±5kb of peak summits.
(E) Volcano plot shows genomic loci with significant changes of H3K27me3 (p<0.05).
(F) The global distribution of H3K4me1 peaks at different regions of annotated genes. 3’UTR = 3’ untranslated region, 5’UTR = 5’ untranslated region, TSS= transcription start site.
(G) The of H3K4me1 and H3K27me3 peaks at genomic locus of E2F8, snapshot using IGV program.
(H) The Hi-C data of SKNDZ neuroblastoma cells (data extracted from the online program http://promoter.bx.psu.edu/hi-c/view.php) show that E2F8 and its adjacent NAV2 gene are located in the same topologically associated domain (TAD). The E2F8 anchor site (the promoter-centered region as indicated by the pink bar) shows the interaction of E2F8 with adjacent gene loci including the NAV2. Each triangle represents one TAD.
(I) Barplots of normalized promoter-centered chromatin interaction frequencies (y axis) emanating from the E2F8 promoter that physically interacts with its adjacent NAV2 gene loci in IMR90 and MSC cells. The loop indicates the interaction between two genomic loci with p<0.01. The promoter capture Hi-C (pcHi-C) data has been reported54.
While these results showed antagonism of KDM6B by GSK-J4, the analysis of transcription factor binding motif enrichment on the annotated genes with increased H3K27me3 showed no E2F gene signature (Supplementary Table 4). H3K4me1 is an essential feature of enhancers and is bound by multiple chromatin-associated factors such as BAF complex and cohesion49, which facilitate enhancer-promoter looping50,51. Since the majority of upregulated H3K27me3 peaks were located at distal enhancer regions (correlated with decreased H3K4m1), we hypothesized that the increased H3K27me3 at these distal regions repressed E2F target gene transcription via alterations of chromatin structure and enhancer/promoter interactions. To investigate this possibility, we cross-referenced the Hi-C chromatin conformation of SKNDZ neuroblastoma cells with MYCN amplification. Interestingly, E2F8 was located in the same topologically associated domain (TAD) as the NAV2 locus which showed increased H3K27me3 by GSK-J4 treatment (Figure 5G). A TAD domain is a self-interacting genomic region that regulates gene expression by limiting the enhancer-promoter interaction to each TAD52,53. The E2F8 anchor site (E2F8 promoter centered region) showed multiple chromatin interactions with adjacent genes within the TAD, particularly to the NAV2 locus (Figure 5H). We further cross-referenced the promotercapture Hi-C data54 using fibroblast cell line (IMR90) and mesenchymal stem cell (MSC) and further demonstrated that the E2F8 promoter region physically interacted with the NAV2 locus although the MSC cells showed multiple chromatin interactions (Figure 5I). The increase of H3K27me3 and reduction of H3K4me1 by GSK-J4 at the NAV2 loci marked with H3K27Ac indicates that it may potentially impact the interaction of this region with the E2F8 promoter, consequently downregulating E2F8 expression. Taken together, these data suggest that KDM6B inhibition might alter the long-range interactions of E2F target genes in TAD, repressing the E2F regulated transcriptome.
GSK-J4 reduces the expression of the PRC2 complex
The homeostasis of H3K27me3 is balanced by PRC2 and KDM65. More H3K27me3 peaks were expected by KDM6 inhibition. However, GSK-J4 treatment actually led to a reduction of more loci of H3K27me3 (Figure 6A). To explain this discrepancy, we examined the expression of the PRC2 complex. The key PRC2 components (EZH2, SUZ12 and EED) have been shown to be pRB-E2F targets55,56. Consistent with the data that KDM6B inhibition mainly downregulated an pRB-E2F transcriptome, GSK-J4 treatment indeed reduced the expression of PRC2 complex (Supplementary Figure 8A), However, the expression of global H3K27me3 was minimally affected, indicating that the expected H3K27me3 upregulation by KDM6 inhibition is counterbalanced by reduced expression of PRC2. A recent study identified a 37-gene signature of EZH228, which is repressed by EZH2 and silenced in MYCN-amplified high-risk neuroblastoma. GSEA analysis revealed that this 37-gene signature was significantly associated with the GSK-J4 treatment (Supplementary Figure 8B, 8C), suggesting that KDM6B inhibition consequently downregulates the functions of PRC2, leading to the induction of tumor-suppressive program repressed by EZH2.

(A) Western blot analysis with indicated antibodies to assess PRC2 complex, MYCN and histone modification mark expression after 48-hour treatment with 2.5μM of GSK-J4 of BE2C
(B) GSEA analysis of EZH2 signature against the gene expression data based on RNA-seq at 48h treatment by GSK-J4.
(C) Heatmap of the 37-gene signature from Figure B.
CHLA20 (C) and SKNAS cells (D) RNA-seq data shows the read peaks of each exon of SUZ12 and EED in BE2C cells treated with 2.5 μM of GSK-J4 for 24 and 48h

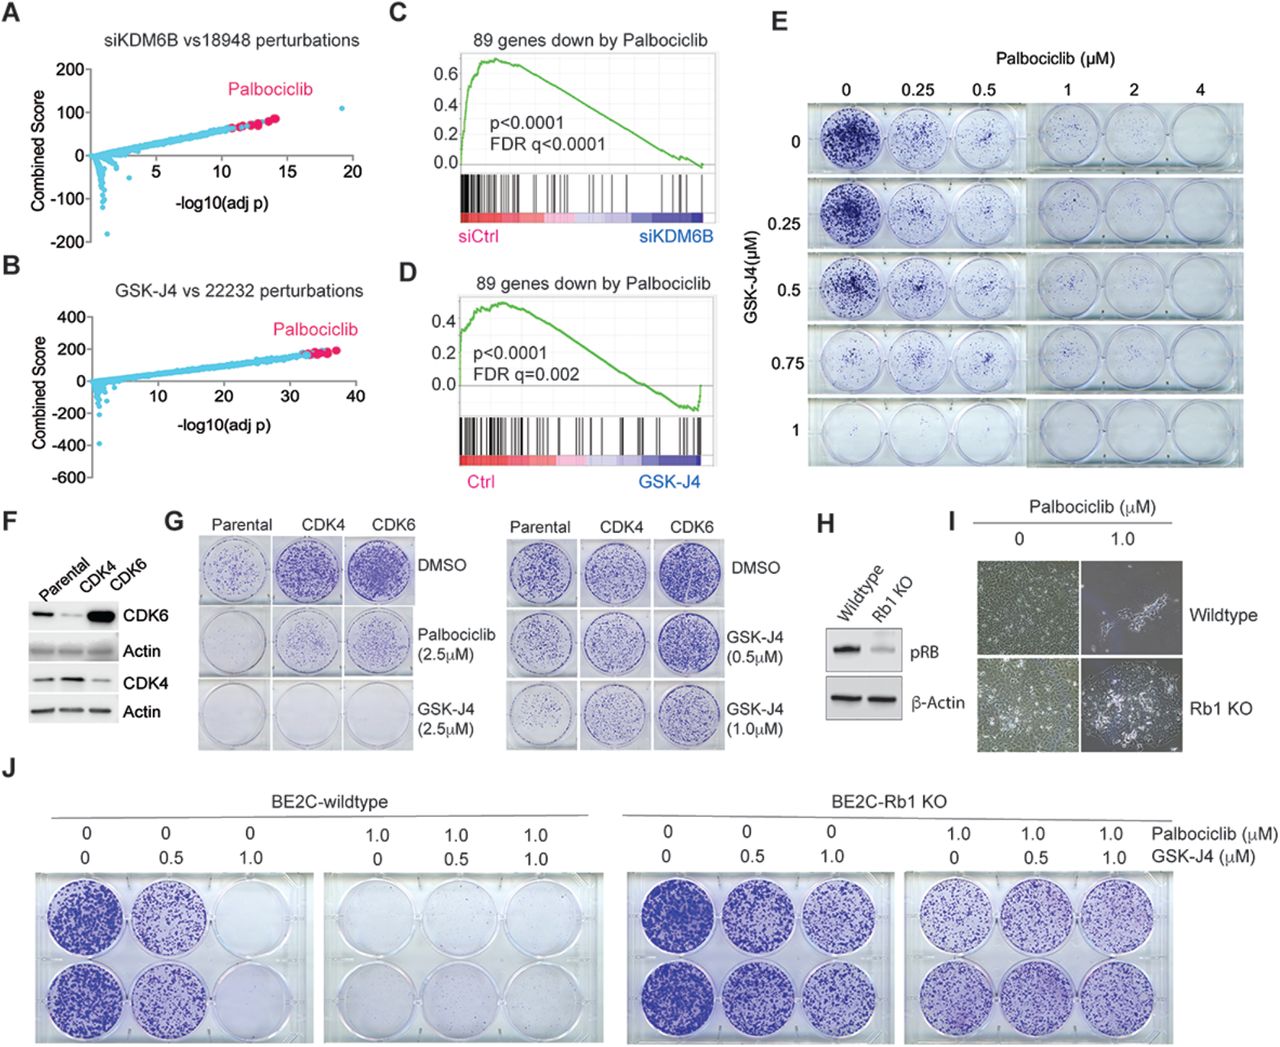
(A) Genes downregulated by KDM6B knockdown were compared with gene profiles induced with chemical compounds from Library of Integrated Network-Based Cellular Signatures (LINCS). The top chemical signature hits, which are basically overrepresented by palbociclib, are highlighted in pink dots.
(B) Same analysis performed as in (A) for GSK-J4 treatment.
(C) The 89-gene signature derived from palbociclib treatment of 4 neuroblastoma cell lines was included in gene sets for GSEA analysis of KDM6B knockdown.
(D) The 89-gene signature derived from palbociclib treatment was included in gene sets for GSEA analysis of GSK-J4.
(E) BE2C cells were seeded with low numbers in 6-well plate and treated with different concentrations of GSK-J4 or/and palbociclib for 10 days. The cell colonies were stained with crystal violet.
(F) Western blot to assess the expression of CDK4 and CDK6 that were transduced into BE2C cells.
(G) The BE2C parental and CDK4/6 overexpressing cells were seeded with low numbers in 6-well plate and treated with different concentrations of GSK-J4 or palbociclib for 8 days. The cell colonies were stained with crystal violet.
(H) Western blot to assess the expression of pRB after inducible knockout in BE2C cells.
(I) Photos taken under microscope (10x) show Rb1 knockout leads to resistance to palbociclib.
(J) The BE2C wildtype and Rb1 knockout cells were seeded with low numbers in 6-well plate and treated with different concentrations of GSK-J4 or/and palbociclib for 8 days. The cell colonies were stained with crystal violet.
Inhibition of KDM6B mimics CDK4/6 inhibitor Palbociclib
To further investigate the biological functions of KDM6B, we integrated the KDM6B downstream target genes with information from the Library of Integrated Network-Based Cellular Signatures (LINCS) data. LINCS data is composed of tens of thousands of gene sets, indicative of the transcriptional responses to a large library of chemical compounds57. With this approach, we found that genes downregulated by KDM6B knockdown in neuroblastoma cells (Supplementary Table S5) overlapped significantly with the transcriptomes downregulated by palbociclib (Figure 6A), a specific CDK4/6 inhibitor that acts upstream of the E2F pathway in cell cycle regulation. Similarly, genes downregulated by GSK-J4 (Supplementary Table S6) also significantly overlapped the transcriptomes downregulated by palbociclib (Figure 6B). CDK4/6 inhibitor signatures being identified among the most correlated signatures with KDM6B knockdown or GSK-J4 treatment further demonstrated that KDM6B is mainly involved in regulation of E2F pathway. To corroborate these findings, we treated 4 different neuroblastoma cell lines (2 with MNA and 2 without MNA) with palbociclib and performed RNA-seq for differential gene expression analyses. By comparing the genes most significantly downregulated by palbociclib among these cell lines via Venn program (Supplementary Figure 9), we extracted 89 common genes (Supplementary Table S7). GSEA results showed that the 89-gene signature was significantly enriched within gene sets downregulated by KDM6B knockdown (Figure 6C) or GSK-J4 treatment (Figure 6D). Although single drug treatment effectively inhibited colony formation in a dose dependent manner, the combination of GSK-J4 and palbociclib did not enhance the inhibitory effect on colony formation (Figure 6E), likely because both drugs target the same pathway. However, GSK-J4 greatly enhanced the effect of 17-DMAG, an HSP90 inhibitor (Supplementary Figure 10A), and JQ-1, a bromodomain inhibitor that targets BRD458 (Supplementary Figure 10B).

4 neuroblastoma cells lines were treated with palbociclib for RNA-seq. The differentially expressed genes in each cell line were analyzed by using Venn program to find the commonly upregulated (A) or downregulated genes (B)

(A) BE2C cells were seeded with low numbers in 6-well plate and treated with different concentrations of GSK-J4 or/and 17-DMAG for 7 days. The cell colonies were stained with crystal violet.
(B) BE2C cells were seeded with low numbers in 6-well plate and treated with different concentrations of GSK-J4 or/and JQ-1 for 7 days. The cell colonies were stained with crystal violet.
Cancer cells with acquired CDK4/6 inhibitor resistance are less responsive to GSK-J4
Upon mitogen stimulation, CDK4 and CDK6 phosphorylate the pRB protein, leading to release of E2F transcription factors from pRB for gene transcription59. CDK4/6 inhibitors including palbociclib showed promising efficacy in ER+/HER2- breast cancer and have been approved for clinical use60,61. Over 100 clinical trials of CDK4/6 inhibitors for a variety of cancers are currently in progress60. However, acquired resistance to CDK4/6 inhibitors, as observed in breast cancer treatment, is expected and the mechanism involves amplification of CDK6 or loss of function of Rb160,61. To test if these mechanisms also diminish the effect of GSK-J4, we transduced the BE2C cells with lentiviral based CDK4 and CDK6 (Figure 6F). Overexpression of CDK4 or CDK6 conferred expected resistance in neuroblastoma cells to palbociclib (Figure 6G). Cells which overexpressed CDK4 or CDK6 also gained resistance to GSK-J4, although a higher concentration of GSK-J4 at 2.5μM was still able to kill them (Figure 6G). We then generated an Rb1 knockout cell line for testing the response to GSK-J4 and palbociclib (Figure 6H). As expected, loss of Rb1 conferred resistance to palbociclib (Figure 6I). Similarly, the Rb1 knockout cells were also resistant to GSK-J4 treatment in comparison with the Rb1 wildtype cells (Figure 6J). Similar to the CDK4 or CDK6 overexpressing cells, the combination of palbociclib and GSK-J4 was not synergistic (Figure 6J). These data further demonstrate that KDM6B is on the same pathway as pRB-E2F in neuroblastoma.
A gene signature targeted by KDM6B inhibition is associated with poor outcome
To correlate the clinical relevance of target genes of KDM6B inhibitor, we identified a 149-gene signature (Supplementary Table 8) that was commonly downregulated by GSK-J4 in BE2C and three other neuroblastoma cell lines (IMR5, LAN5 and SK-N-FI)41. Among these 149 genes, 85 was highly expressed in the high-risk neuroblastomas while 20 was highly expressed in the low-risk neuroblastomas (Supplementary Table 9). Based on the expression levels of these differentially expressed genes in neuroblastomas, they were categorized into 4 clusters (Figure 7A). Cluster 3 and 4 neuroblastomas expressed higher levels of GSK-J4 signature, and were enriched with high-risk, high-stage and MYCN amplified ones. While patients in cluster 1 and 2 showed excellent event-free and overall survival, the cluster 3 and 4 patients had a significant worse outcome (Figure 7B, 7C). No difference was observed between cluster 1 and 2. Cluster 4 showed a poorer survival than that of cluster 3, in line with the higher expression levels of GSK-J4 target genes in cluster 4. MYCN amplification (MNA) is the well-known high-risk factor of neuroblastoma. To investigate whether the correlation of GSK-J4 signature with patient outcome was affected by MNA status, we compared the event-free survival of cluster 3 and 4 with MNA. The results showed that cluster 4 which had higher levels of GSK-J4 signature was still correlated with a poorer event-free survival of patients with MNA although the overall survival was not statistically significant (Figure 7D, 7E). However, in stage 4 patients, cluster 4 showed significant worse outcome in both event-free and overall survival than that of cluster 3. These data indicate that, in stage 4 or MNA patients, higher expression levels of GSK-J4 signature is a high-risk factor.

(A) 149-gene signature was uploaded into R2 genomics analysis program (https://hgserver1.amc.nl/cgi-bin/r2/main.cgi) to find the differentially expressed genes in high-risk neuroblastoma in a cohort dataset (GSE49710) that has 498 neuroblastoma cases, followed by k-means cluster analysis. Risk (Red =high risk; green =low risk); MYCN (red = Amplification; green = non-Amplification); Stage (red = stage 4; blue= stage 4S; brown =stage 3; dark green = stage 2, green= stage 1).
(B-C) Kaplan-Meier curve using Log-Rank method shows the event-free survival and overall survival of 4 clusters that have differential expression levels of GSK-J4 signature.
(D, F) Kaplan-Meier curve using Log-Rank method shows the event-free survival and overall survival of clusters 3 and 4 with MNA.
(E, G) Kaplan-Meier curve using Log-Rank method shows the event-free survival and overall survival of clusters 3 and 4 with stage 4 disease.
DISCUSSION
Despite one recent study suggests that KDM6B might be tumor suppressive in neuroblastoma62, we and others found that KDM6B plays an important role in MYC driven tumorigenesis and that pharmacologically targeting KDM6B by a small molecule GSK-J4 is therapeutically efficacious in multiple tumor models14,27,63–66, including the high-risk neuroblastoma41. However, the anticancer mechanisms of KDM6B inhibition are poorly understood. Here we show that KDM6B is significantly over-expressed in human primary neuroblastoma in comparison with its paralogs KDM6A and UTY. Strikingly, the 22-kb genomic locus of KDM6B is heavily occupied by active gene transcription marks, including H3K4me1, H3K27Ac, BRD4 and RNA polymerase II binding while the KDM6A and UTY loci lack such histone modifications and transcription factor binding. These data explain why KDM6B is expressed at much higher levels than KDM6A and UTY in neuroblastoma. The long-distance broad marks of KDM6B locus with H3K4me1 and H3K27Ac suggest KDM6B expression is under the control of a super-enhancer, the large clusters of transcriptional enhancers that drive expression of genes that define cell identity67. We further found that KDM6B is predominantly involved in regulation of MYC expression and downstream target genes of the pRB-E2F pathway. Genetic and pharmacologic inhibition of KDM6B consistently repressed the expression of MYCN and C-MYC, and the transcriptome of E2F target genes. These results support previous studies demonstrating that E2F and MYC are functionally associated38,39, which show E2F drives MYC expression. MYC also regulates E2F expression and requires distinct E2F activities to induce S phase and apoptosis68. Moreover, a close association between E2F and MYC binding sites and their target genes has been observed69.
E2F deregulation in cancer often occurs through loss-of-function of the pRB tumor suppressor70. The E2F transcription factors (E2F1, E2F2, and E2F3a) bind at target gene promoters in complex with their dimerization partner (DP1 or DP2) and pRB36, which suppresses target gene transcription through the recruitment of chromatin modifiers and remodeling factors such as HDAC and EZH236,71. During the G1 phase of the cell cycle, oncogenes such as Ras induce D-type cyclins to activate cyclin dependent serine/threonine kinases CDK4 and CDK6, which phosphorylate pRB, consequently leading to release of E2F transcription factors from pRB, allowing for cell proliferation59. While Rb1 loss is very rare in neuroblastoma, several studies have shown that the Cyclin D/CDK4/CDK6 pathway is hyperactive in neuroblastoma72–77. Genome-wide CRISPR and shRNA screening demonstrated that knockout of CDK4 or CDK6 inhibited neuroblastoma cell proliferation/survival while Rb1 knockout promoted cell proliferation (https://depmap.org/portal/). A majority of neuroblastoma models with MNA are sensitive to CDK4/6 inhibition78. These data indicate that the deregulated E2F pathway is essential to neuroblastoma. The genetic and pharmacologic KDM6B inhibition results in a predominant reduction of E2F transcriptome and MYC, which may account for the therapeutic effect of KDM6B blockade in neuroblastoma. In addition, the transcriptome of KDM6B inhibition mimics the CDK4/6 inhibitor, palbociclib. When cells gained resistance to palbociclib by overexpressing CDK4/6 or by Rb1 knockout, they also gained resistance to GSK-J4. Thus, these data further support that KDM6B regulates the CDK4/6-pRB-E2F pathway in neuroblastoma.
Intriguingly, while transcriptome, chemical genetics and ATAC-seq analyses show that KDM6B inhibition impacts the E2F transcriptome, the loci of H3K27me3 alterations were not enriched with E2F genes. As the majority of enhancer mark H3K4me1 peaks were downregulated by the KDM6B inhibitor GSK-J4, and most of the increased H3K27me3 peaks by GSK-J4 were located at distal non-promoter regions, one possible explanation is that GSK-J4 disrupted the long-range chromatin interaction between the E2F genes and the regions with altered H3K27me3 and H3K4me1 because H3K4me1 functions to mediate the enhancer-promoter looping50,51. Indeed, many E2F target genes resided in same topologically associated domains (TAD) as the regions with elevated H3K27me3 by GSK-J4. TADs include chromatin loops that mediate promoter–enhancer contacts that regulate gene expression52,53. In erythroid cells, long-range control of epigenetic regulation has been observed in that KDM6B is recruited to the enhancer regions to erase H3K27me3, consequently evicting the gene silencing PcG protein for a high rate of transcription79. During early differentiation steps, the embryonic stem cell factor Tbx3 associates with KDM6B at the enhancer element of the Eomes locus to allow enhancer-promoter interactions80. This spatial reorganization of the chromatin primes the cells to respond to Activin signaling. In neural stem cells, SMAD3 recruits KDM6B at the enhancers in response to TGF-β, for enhancer transcription81. Here we propose a model that, once stimulated by mitogens due to oncogenic activity, KDM6B is recruited to chromatin to maintain the low levels of H3K27me3 at the distal regulatory enhancer regions, which loops and physically interacts with E2F transcription factors that bind at the promoters of target genes, together with associated transcriptional machinery including RNA polymerase II and transcription mediators, driving the expression of the E2F transcriptome (Figure 8A). When KDM6B is inhibited by GSK-J4, the H3K27me3 accumulates at the distal regions and disrupts the assembly of transcriptionally active interaction of promoter-enhancers, leading to the downregulation of the E2F transcriptome (Figure 8B). Interestingly, expression of the PRC2 complex, which is a downstream target of pRB-E2F55,56, was downregulated by KDM6B inhibition, in line with of the decrease of a large number of H3K27me3 peaks and de-repression of a tumor suppressive program governed by EZH228.

(A) Upon stimulation by mitogens, KDM6B is recruited to chromatin to maintain the low levels of H3K27me3 at the distal regulatory enhancer regions, which loops and physically interacts with E2F that binds at the promoter of target genes, together with associated transcriptional machinery including RNA polymerase II and mediators, driving the E2F transcriptome.
(B) When inhibited by CDK4/6 inhibitor, the inhibitory pRB complexes with HDAC to suppress gene transcription. When KDM6B is inhibited by GSK-J4, the H3K27me3 will accumulate at the distal regions and evicts the transcription activators of promoter-enhancer, leading to the downregulation of E2F transcriptome (Figure 7B).
(C) A network composed by MYCN, E2F, EZH2 and KDM6B regulates the cell proliferation and differentiation of neuroblastoma.
Neuroblastoma is a disease that arises as a result of blocked differentiation of neural crest precursors (NCCs) during development19,20. EZH2 is required to maintain the undifferentiation of neuroblastoma28,82. Thus, our data and that from other studies indicate that a network composed by MYCN, E2F, PRC2 and KDM6B regulates the cell proliferation and differentiation of neuroblastoma (Figure 8C), highlighting the importance of KDM6B in coupling the two essential features of cancer cells. In summary, we have defined a novel chromatin dependent mechanism of action of KDM6B inhibition that modulates the CDK4/6-pRB-E2F pathway in neuroblastoma. We also demonstrate the E2F target genes can act as biomarkers for sensitivity to KDM6B inhibitors in neuroblastoma and that this may well be predictive for other MYC-driven tumors.
MATERIALS AND METHODS
Cell Culture and Reagents
Neuroblastoma cell lines BE2(C) (ATCC), SIMA (DSMZ, Germany), SKNDZ (ATCC), SK-N-AS (ATCC), SK-N-SH (ATCC), IMR32 (ATCC), CHLA20 (COG), NB-1691 (Peter Houghton), HS68 (ATCC) were cultured in standard RPMI media supplemented with 10% FBS (Sigma), 1% L-glutamine (MediaTech), at 37 °C in 5% CO2. Colorectal cancer cell lines HCT116, and isogenic p53-/- HCT116 cells were kindly provided by Bert Vogelstein (Baltimore, MD), osteosarcoma cell line U2OS, lung cancer cell lines A549 purchased from ATCC, and they were cultured in standard DMEM media supplemented with 10% FCBS, 1% L-glutamine (MediaTech), at 37 °C in 5% CO2. Cell lines were validated by short tandem repeat (STR) using Promega PowerPlex 16 HS System once per month. PCR-based method was used for detection of Mycoplasma with LookOut Mycoplasma PCR Detection Kit (Sigma) and JumpStart Taq DNA Polymerase (Sigma) once per month to ensure cells were mycoplasma negative. GSK-J4, Palbociclib, 17-DMAG, JQ-1 were purchased from Selleckchem.
SDS-PAGE and Western blotting
For western blotting, samples were mixed with calculated volume of 2X sample buffer (1M TRIS/HCl, 10% SDS, 0.1% bromophenol-blue, 10% b-mercaptoethanol, 10% glycerol), and heated for 25 minutes at 96°C. Proteins were resolved on SDS-polyacrylamide gels (SDS-PAGE) and transferred onto PVDF membrane (Immobilon-P, Millipore). After being incubated with the primary antibody, horseradish peroxidase-(HRP) conjugated secondary antibody (Novex, Life technologies) at 1: 5000 was used for 1 hour incubation. The signals were detected by chemiluminescence (ECL, Thermo scientific). Antibodies including H3K4me1(Abcam Cat# ab8895, RRID:AB_306847), H3K4me3 (RevMAb Biosciences Cat# 31-1226-00, RRID:AB_2783580), H3K27ac (Active Motif Cat# 39133, RRID:AB_2561016), H3K27me3 (Cell Signaling Technology Cat# 9733, RRID:AB_2616029), CDK4 (Cell Signaling Technology Cat# 12790, RRID:AB_2631166), CDK6 (Cell Signaling Technology Cat# 13331, RRID:AB_2721897), β-ACTIN (Sigma-Aldrich Cat# A1978, RRID:AB_476692), GAPDH (Cell Signaling Technology Cat# 5174, RRID:AB_10622025), pRB (4H1) (Cell Signaling Technology Cat# 9309, RRID:AB_823629), MYCN (Cell Signaling Technology Cat# 9405, RRID:AB_10692664) or (Santa Cruz Biotechnology Cat# sc-53993, RRID:AB_831602), C-MYC (Cell Signaling Technology Cat# 13987, RRID:AB_2631168), KDM6B (Abcam, Cat# 154126, RRID:AB_2722742), were used for western blot.
Crystal Violet Staining
After removing media, cells were washed with Dulbecco’s phosphate buffered saline without calcium or magnesium (DPBS, Lonza) and treated with 4% Formaldehyde in PBS (PFA) for 20 minutes. Once PFA was removed, cells were stained with 0.1% crystal violet stain for 1 hour.
Small interfering RNA Transfection
Small interfering RNAs (siRNA) were transfected into subconfluent cells using Lipofectamine RNAiMax (Invitrogen) according to manufacturer’s instructions. The siRNA oligos for KDM6B have sequences as follows: KDM6B#1, 5-GGAAUGAGGUGAAGAACGU-3, KDM6B#2, 5-GGAGACCUCGUGUGGAUUA-3, KDM6B#31, 5-GCAUCUAUCUGGAGAGCAA-3, KDM6B#33, 5-GGAAGAGGAACAGCAACA-3.
CRISPR knockout of Rb1
The Rb1 CRISPR plasmid with gRNA sequence 5-GCTCTGGGTCCTCCTCAGGA-3 (TLCV2-RB1, Addgene#87836) was purchased from Addgene. Plasmids were maxipreped by using NucleoBond Xtra EF kits (Takara Bio USA, 740424-50) according to manufacturer’s protocol. Lentivirus was produced by transient transfection of PEI-pro DNA complex (6μg of TLCV2-RB1, 3 μg of 1-1r, 1 μg RTR, 1 μg of VSVg with 22 ul of PEI pro in 400 μl of DMEM medium) with 5 x 10⁶ HEK293T cells in 10 ml complete medium (DMEM, 100 U/mL penicillin/streptomycin, 1 x L-glutamine and 10% FBS) in a 10 cm dish. Virus supernatant was collected every 8-12 hours for 3 days, which were passed through a 0.45 μm filter and concentrated by ultracentrifuge at 28,500 rpm for 1.5 hours at 4°C. The TLCV2-RB1 virus particles were added to BE2C cells with polybrene to final concentration of 8 μg/ml. Puromycin (2.5 μg/ml in complete medium) selection were performed in the next day after virus transduction. To generate Rb1 knockout in BE2C, BE2C-Rb1 cells were treated with 1μM of doxycycline for 72 h, then sorted for green fluorescent protein (GFP) positive cells to enrich for RB1 knockout. The sorted cells were expanded without doxycycline in RPMI 1640 media (Corning, 10-040-CM) supplemented with 100 U/mL penicillin/streptomycin (Gibco, 15140122), and 10% FBS (Sigma-Aldrich, F2442).
Generation of CDK4 and CDK6 overexpressing cell lines
The CDK4 plasmid (pHAGE-CDK4, Addgene#116724) and CDK6 plasmid (pHAGE-CDK6, Addgene#116725) were purchased from Addgene. The plasmid maxiprep and lentiviral packaging were followed by the same protocol as described in Rb1 knockout. To overexpress CDK4 and CDK6 in BE2C cells, the pHAGE-CDK4 or pHAGE-CDK6 viral particles were transduced to BE2C cells and sorted for green fluorescent protein (GFP) positive ones.
RNA-seq and microarray
Total RNA was extracted from cells by using RNeasy Mini Kit (cat. # 74104) from QIAGEN. Paired-end sequencing was performed using the High-Seq platform with 100bp read length. Reads were aligned to the human GRCh37-lite using SJCRH’s Strongarm pipeline. Counts per gene were obtained using htseq-count version 0.6.1 with Gencode vM5 level 1 and 2 gene annotations. Counts were normalized with VOOM and analyzed with LIMMA within the R statistical environment. Significance was defined as having a false discovery rate (FDR) <0.05. VOOM normalized counts were analyzed with Gene Set Enrichment Analysis (GSEA)83. For Affymetrix microarray, after quality control with Agilent RNA analyzer, RNA was subjected to hybridization using an Affymetrix Clariom S human array. Differential gene expression was analyzed by t-test using the Differential Expression Analysis module at GenePattern server (http://genepattern.broadinstitute.org/gp/pages/protocols/DiffExp.html).
Assay for Transposase-Accessible Chromatin using sequencing (ATAC-seq)
Library preparations for ATAC-seq were based on the protocol with minor modifications45,84. Briefly, fresh cultured BE2C cells (100,000 per sample) with or without 2.5μM of GSK-J4 treatment were harvested and washed with 150μl cold Dulbecco’s Phosphate-Buffered Saline (DPBS) containing protease inhibitor (PI). Nuclei were collected by centrifuging at 500g for 10 minutes at 4°C after cell pellets were resuspended in lysis buffer (10 mM Tris-Cl pH 7.4, 10 mM NaCl, and 3 mM MgCl2 containing 0.1% NP-40 and PI). Nuclei were incubated with Tn5 transposon enzyme in transposase reaction mix buffer (Illumina) for 30 min at 37°C. DNAs were purified from transposition sample by using Min-Elute PCR purification kit (Qiagen, Valencia, CA) and measured by Qubit. Polymerase chain reaction (PCR) was performed to amplify with High-Fidelity 2X PCR Master Mix [72°C/5mins+ 98 °C /30 s +12 × (98 °C /10 s + 63 °C /30 s + 72 °C /60 s) + 72 °C /5 min]. The libraries were purified using Min-Elute PCR purification kit (Qiagen, Valencia, CA). ATAC-seq libraries followed by pair-end sequencing on HiSeq4000 (Illumina) in the Hartwell Center at St Jude Children’s Research Hospital.
ATAC-seq data analysis
2×100bp paired-end reads obtained from all samples were trimming for Nextera adapter by cutadapt(version 1.9, paired-end mode, default parameter with “-m 25 -O 6”)85 and aligned to human genome hg19(GRCh37-lite) by BWA (version 0.7.12-r1039, default parameter)86, duplicated reads were then marked with Picard(version 2.6.0-SNAPSHOT)87 and only non-duplicated proper paired reads have been kept by samtools (parameter “-q 1 -F 1804” version 1.2)88. After adjustment of Tn5 shift (reads were offset were offset by +4 bp for the sense strand and −5 bp for the antisense strand) we separated reads into nucleosome free, mononucleosome, dinucleosome, trinucleosome as described in Buenrostro et.al89 by fragment size and generated bigwig files by using the center 80bp of fragments and scale to 20M nucleosome free reads. We observed reasonable nucleosome free peaks and pattern of mono-, di-, trinucleosome on IGV (version 2.4.13)90. Next we merged each 2 replicates to enhance peak calling on nucleosome free reads by MACS2(version 2.1.1.20160309 default parameters with “--extsize 200 --nomodel”)91, all cell types have more than 20M nucleosome free reads after merge so we consider all important nucleosome free regions were called. To assure the replicability, we first merge peaks from different treatmeans to create a set of reference chromatin accessible regions. We then counted nucleosome free reads from each of samples overlap the reference regions by bedtools (v2.24.0)92. We conclude the reproducibility is good since spearman correlation coefficient between replicates are larger than between samples from different groups. To find the differential accessible regions, we first normalized raw nucleosome free reads counts used trimmed mean of M-values normalization method(TMM) and applied Empirical Bayes Statistics test after linear fitting from voom packge(R 3.23, edgeR 3.12.1, limma 3.26.9)93. FDR-correct p-value 0.05 and fold change > 2 were used as cutoff for differential accessible regions (DARs) while p-value > 0.5 and fold change < 1.05 were used for control regions. To find the Transcription factor enriched for DARs, we scanned the TRANSFAC 94 motif database using FIMO(parameter “--motif-pseudo 0.0001 --thresh 1e-4”) from MEME suite(v4.11.3)95, then for each motif, we counted how many DARs or control regions have the motif matches and using Fisher exact test to estimate their enrichment over the background(DAR or control regions don’t have the motif matches).
Chromatin Immunoprecipitation Sequencing (ChIP-seq)
1×10⁷ of BE2C cells treated with 0.1% DMSO control or 2.5μM of GSK-J4 for 48 h were cross-linked with fresh prepared 1% formaldehyde (final concentration) for 10 min and quenched with 125 mM glycine for 5 min at room temperature. Cells were washed once with Dulbecco’s Phosphate-Buffered Saline (DPBS). 5-8 ml of cold Cell lysis buffer (5 mM PIPES pH 8.0, 85 mM KCl, 0.5% NP-40 with 1 tablet protease inhibitor cocktail) were added to plate after removing DPBS. The cells were scraped with a cell scraper and transfer into 50-ml conical tubes on ice. Cell pellets were collected by centrifuging at 2,000 rpm for 5 minutes at 4°C. The pellets were resuspended in cell lysis buffer and incubated on ice for 10 min. Cells were passed through a 20-gauge needle 20 times. The nuclei were collected by centrifuging at 2,000 rpm at 4°C for 5 minutes. The nuclear pellets were resuspended and lysed with 250 μl RIPA buffer (1X PBS, 1% NP-40, 0.5% sodium deoxycholate, 0.1% SDS with 1 tablet protease inhibitor cocktail). The lysates were sonicated for at least 30 min (30 sec on / 30 sec off) using Bioruptor Pico (Diagenode, Inc., Denville, NJ) and centrifuged at 14,000 rpm in a microfuge for 15 minutes at 4°C. The supernatant was collected and the sonicated DNA fragments were examined by electrophoresis on a 1% agarose gel. The sonicated samples with enrichment of fragments between the 100 to 500 bp range were used for the chromatin immunoprecipitation (ChIP) after removing 50 μL from each sample as input. The primary antibodies H3K27me3 (CST#9733S) and H3K4me1 (Abcam Cat# ab8895) were coupled with 25 μL magnetic beads (Dynabeads M-280 Sheep Anti-Rabbit IgG, Invitrogen 11203D) overnight in the cold room at 4°C, washed three times with PBS/BSA (1XPBS / 5 mg/ml BSA (fraction V)) at 4°C, then incubated with sonicated DNA chromatin samples overnight in the cold room at 4°C. The beads containing immuno-bound chromatin were collected by placing the microfuge tube on a magnet rack. The beads were extensively washed with LiCl wash buffer (100 mM Tris pH 7.5 / 500 mM LiCl / 1% NP-40 / 1% sodium deoxycholate) 5 times and TE Buffer (10 mM Tris-HCl pH 7.5 / 0.1 mM Na2EDTA) once. Bound chromatin was eluted by IP Elution Buffer (1 % SDS / 0.1 M NaHCO3) and reverse-crosslinked at 65°C overnight. DNAs were purified using Min-Elute PCR purification kit (Qiagen, Valencia, CA) after the treatment of RNase A and proteinase K. ChIP enrichment DNAs were submitted to library preparation and sequencing. ChIP-seq library preparation and sequencing were carried out by the Hartwell Center at St Jude Children’s Research Hospital. Briefly, 5-10 ng of DNA was used to prepare libraries by the NEBNext ChIP-Seq Library Prep Reagent Set for Illumina with NEBNext Q5 Hot Start HiFi PCR Master Mix according to the manufacturer’s instructions (New England Biolabs). Completed ChIP-seq libraries were analyzed for insert size distribution using a 2100 BioAnalyzer High Sensitivity kit (Agilent) or Caliper LabChip GX DNA High Sensitivity Reagent Kit (Perkin Elmer). All libraries were quantified using the Quant-iT PicoGreen dsDNA assay (Life Technologies), Kapa Library Quantification kit (Kapa Biosystems). Fifty-cycle single-end sequencing was performed using an Illumlina HiSeq 2500 or HiSeq 4000.
ChIP-seq data analysis
Mapping reads and visualizing data
The ChIP-seq raw reads were aligned to the human reference genome (hg19) using BWA (version 0.7.12; default parameter) to and then marked duplicated reads with Picard (version 1.65), with only nonduplicated reads kept by samtools (version 1.3.1, parameter “-q 1 -F 1024”). To control the quality of the data and estimate the fragment size, the nonduplicated version of SPP (version 1.11) was used to calculate relative strand correlation value with support of R (version 3.5.1). To visualize ChIP-seq data on integrated genome viewer (IGV) (version 2.3.82), we used genomeCoverageBed (bedtools 2.25.0) to produce genome-wide coverage in BEDGRAPH file and then converted it to bigwig file by bedGraphToBigWig. The bigwig files were scaled to 15 million reads to allow comparison across samples.
Peak calling, annotation and motif analysis
MACS2 (version 2.1.1) was used to call narrow peaks (H3K27me3 and H3K4me1) with option “nomodel” and “extsize” defined as fragment size estimated by SPP, FDR corrected p value cutoff 0.05. For broad peaks (H3K27me3, and H3K4me1), SICER (version 1.1, with parameters of redundancy threshold 1, window size 200bp, effective genome fraction 0.86, gap size 600bp, FDR 0.00001 with fragment size defined above) has been used for domain calling. Enriched regions were identified by comparing the IP library file to input library file. Peak regions were defined to be the union of peak intervals in replicates from control or treated cells respectively. Promoters were defined as mouse RefSeq TSS ± 1000bp regions. Genomic feature annotation of peaks was done by annotatePeaks.pl, a program from HOMER suite (v4.8.3, http://homer.salk.edu/homer/). The HOMER software was used to perform de novo motif discovery as well as check the enrichment of known motifs in a set of given peaks.
Differential analysis
ChIP-seq raw read counts were reported for each region/each sample using bedtools 2.25.0. Raw read counts were voom normalized and statistically contrasted using the R(version 3.5.1) packages limma and edgeR (version 3.16.5) for CPM calculation and differential analysis. An empirical Bayes fit was applied to contrast treated samples to control samples and to generate log fold changes, p values and false discovery rates for each peak region
Hi-C data mining
To view the 3D chromatin conformation of E2F8 gene, we mined the Hi-C database, 3DIV (a 3D-genome Interaction Viewer and database) (http://kobic.kr/3div)96, which provides a list of long-range chromatin interaction partners for the queried locus with genomic and epigenomic annotations. 3DIV provides 66 billion uniformly processed raw Hi-C read pairs obtained from 80 different human cell/tissue types. The promoter capture Hi-C (pcHi-C) data was published 54, which generated maps of long-range chromatin interactions centered on 18,943 well-annotated promoters for protein-coding genes in 27 human cell/tissue types.
Library of Integrated Network-based Cellular Signatures (LINCS) analysis
We had two sets of gene expression data: microarray and RNA-seq for siKDM6B and GSK-J4 treatment. While the pathway analysis showed very similar results for each, we used them in different purposes. Because Lincs used a limited number of genes in charactering chemical compounds signatures, we chose our microarray data to compare since RNA-seq data gave rise to a large amount of gene expression data that were not covered by Lincs chemical signatures. We first identify differentially expressed genes in microarray data using GenePattern program (https://cloud.genepattern.org/gp/pages/index.jsf). Then we chose the downregulated genes (with logFC >=0.7) by KDM6B knockdown or GSK-J4 treatment to compare with the chemical signatures in LINCS database (http://www.lincsproject.org/LINCS/tools). The datasets from LINCS L1000 Chem Pert down were downloaded and analyzed using PRISM program.
The Cancer Therapeutics Response Portal (CTRP) analysis
Cancer Therapeutic Response Portal (https://portals.broadinstitute.org/ctrp.v2.1/) correlated the sensitivity patterns of 481 compounds including GSK-J4 with 19,000 basal transcript levels across 823 different human cancer cell lines and identified selective outlier transcripts42,43, which allowed to interrogate whether KDM6B inhibitor was correlated with specific transcripts. We chose the features that show the correlation of drug sensitivity with gene expression or copy number of quired genes such as E2F8.
Kaplan-Meier analysis
A 149-gene signature commonly downregulated by GSK-J4 in BE2C and three other neuroblastoma cell lines (IMR5, LAN5 and SK-N-FI)41 was uploaded into R2 genomics analysis and visualization program (https://hgserver1.amc.nl/cgi-bin/r2/main.cgi) to find the differentially expressed genes in high-risk neuroblastoma in dataset (GSE49710) that has 498 cases, followed by k-means cluster analysis. The 4 clusters were stored as track for Kaplan-Meier curve analysis using Log-Rank method for event-free survival and overall survival.
Statistical analysis
To determine statistical significance, the unpaired, two-tailed Student t test was calculated using the t test calculator available on GraphPad Prism 8.0 software. A p value of less than 0.05 was considered statistically significant.
Contributions
Alexandra D’Oto, Jie Fang, Shivendra Singh, Anoushka Mullasseril, Victoria Jones, Xinyu von Buttlar, Bailey Cooke, Dongli Hu, performed experiments. Beisi Xu and Hongjian Jin analyzed sequencing data. Jun Yang and Andrew M Davidoff conceived the project. Jun Yang wrote the manuscript with input from Jason Shohet, Andrew J Murphy and Andrew M Davidoff.
Acknowledgments
This work was partly supported by American Cancer Society-Research Scholar (130421-RSG-17-071-01-TBG, Jun Yang) and National Cancer Institute (1R01CA229739-01, Jun Yang). The content is solely the responsibility of the authors and does not necessarily represent the official views of the National Institutes of Health.
References


