

Abstract
Adolescence is a period of critical development of the brain, that coincides with a sexually dimorphic increase in risk of depression for females. We hypothesized that there might be sexual dimorphisms in human brain network development underlying the dimorphism in depression. First, we tested for sex differences in parameters of brain network development (baseline connectivity at age 14, FC14, adolescent change in connectivity FC14–26, and maturational index, MI), measured repeatedly in resting state functional MRI scans from N=298 healthy young people aged 14-26 years, scanned a total of 520 times. We measured the maturational index (−1 < MI < 1) at each of 346 regions for each sex separately. Regions with negative MI were located in the cortical default mode network (DMN), the limbic system and subcortical nuclei. This cortico-subcortical system shared a disruptive pattern of development, e.g., weak functional connectivity with these regions at age 14 became stronger over the course of adolescence. This developmentally disruptive system was sexually dimorphic, i.e., the sex difference in MI was significantly less than zero at 83 regions. We then investigated the biological plausibility, and relevance to depression, of this fMRI-derived map of dimorphic brain development. It was significantly co-located with the cortical expression map of a weighted function of whole genome transcription, by partial least squares regression on prior adult post mortem data. Genes that were most strongly expressed in disruptively developing brain regions were enriched for X chromosome genes; genes specialized for perinatal and adolescent phases of cortical and subcortical development, respectively; and risk genes for major depressive disorder (MDD), defined by genome-wide significant association. The dimorphic development map was also significantly co-located with (i) brain regions activated by prior task-activated fMRI studies of reward and emotional processing and (ii) a map of adult MDD-related differences in functional connectivity from an independent case-control fMRI study (N=96). We conclude that sex differences in adolescent development of cortico-subcortical functional network connectivity were biologically validated by anatomical co-location with brain tissue expression of sex-, development- and MDD-related genes. Dimorphically disruptive development of DMN, limbic and subcortical connectivity could be relevant to the increased risk of depressive symptoms in adolescent females.
Introduction
Adolescence is a period of critical development of the brain, characterized by changes in both structure (1; 2; 3; 4) and function (5; 6), that coincide with changes in cognition and behaviour. It is also a time of increasing incidence of many psychiatric disorders, including depression, which occurs more frequently in females than males (7; 8). Small sex differences in mood have been reported from the age of 11, and by the age of 15 females are about twice as likely to be depressed as males (7; 8; 9). Recent work has supported the idea that sexually-dimorphic risk for mood disorders could be related to sex-dimorphisms in adolescent brain network development (10).
Functional brain networks derived from resting state functional magnetic resonance imaging (rs-fMRI) can be used to study complex network organization in the brain. Each node of these networks is an anatomical region and each edge weight is an estimator of association, so-called functional connectivity, typically the correlation or coherence between the two fMRI signals simultaneously measured for each possible pair of nodes in the network (11; 12).
The brain is plastic and undergoes maturational changes throughout life. Previous resting-state fMRI studies have suggested that during adolescence a shift from local to distributed networks (13) and an increase in the strength of long-range connections (14; 15) occurs. Since most long-range connections originate from association cortical areas, these maturational processes have previously been associated with the idea that primary sensory and motor areas mature most rapidly during childhood, while association areas undergo their most profound changes during late adolescence (6; 16; 17). However, it has since been noted that in-scanner head motion may have confounded many of the effects previously attributed to age, particularly in younger participants (18; 19; 20). Developmental imaging studies have therefore employed different strategies to address these concerns, e.g., by restricting analysis to motion-uncontaminated sub-samples of acquired data with no detectable head motion (6), or by regressing each nodal fMRI signal on the global average fMRI signal (21). Issues concerning optimal head motion correction for pre-processing fMRI data remain controversial (22; 23; 24).
It is not yet clear how functional connectivity differs between males and females, either during adolescence or adulthood. One widely reported sex difference is increased functional connectivity of the default mode network (DMN) in females (25; 26; 27; 28; 29). Female-increased connectivity has also been reported in the subcortex and limbic areas (cingulate gyrus, amygdala, hippocampus) (30); whereas male-increased connectivity has been reported for sensori-motor areas (30; 25; 28). However, these effects are not consistently found across studies (27; 26; 31). Importantly, most research on sex differences has focused on pre-selected regions, often including the amygdala (32; 33), with few studies having investigated sex differences comprehensively over all brain regions (25; 28; 34; 35; 36). Most prior fMRI studies of brain development have focused on estimating “average” effects of age across both sexes, e.g., by including sex as a covariate in the statistical model for estimation of developmental parameters (cf. Table 4 in Supplementary Materials) and few have reported age-by-sex interactions or the conditioning of developmental parameters by sex (35; 30).
We start from the hypothesis that the sexually dimorphic risk trajectory for depression, with higher depressive symptom scores for adolescent females than males (7; 8), could be the psychological or clinical representation of an underlying dimorphism in adolescent brain network development (34; 27; 28).
To investigate this overarching hypothesis experimentally, we first identified sexually dimorphic systems of healthy adolescent brain development, and then tested the anatomical co-location of dimorphic fMRI systems with prior maps of human brain gene expression and depression-related fMRI phenotypes.
We estimated the effects of sex on three parameters of adolescent development of resting-state functional connectivity, using fMRI data from an accelerated longitudinal study (N=298; age range 14-26 years; 50% female; Table 1), stratified by age and balanced for sex per age stratum (37). There was a significant sex difference in head motion (framewise displacement, FD, mm) during fMRI scanning, so we pre-processed the data to mitigate the potentially confounding effects of head motion and subsequently demonstrated the robustness of the key results to alternative fMRI pre-processing strategies. We found that females had significantly more disruptive development of functional connectivity in a default mode cortical, limbic and subcortical network. We then tested the hypotheses that this developmentally dimorphic brain system was co-located with expression of a weighted function of the whole genome enriched for X chromosome genes, genes related to perinatal and post-natal brain development, and genes related to major depressive disorder (MDD). We also tested the hypothesis that the sexually dimorphic system was co-located with an anatomical map of depression-related differences in functional connectivity from an independent case-control fMRI study of MDD.
Total N = 298 healthy young people participated in an accelerated longitudinal MRI study, with recruitment balanced for sex in each of five age-defined strata, and each participant scanned at least twice (baseline and follow-up 18 months later). FD = framewise displacement, a measure of head movement in mm, was significantly greater in males compared to females on average over all ages, and in the youngest two age strata specifically (P<0.05, uncorrected)(SI Fig. S1).
Results
Analysable sample and head motion
A total of 36 scans were excluded by quality control criteria including high in-scanner motion (mean FD > 0.3 mm or maximum FD>1.3 mm), co-registration errors, or low variance due to widespread susceptibility artefacts. The analyzable sample thus consisted of 520 scans from 298 participants (151 females; Table 1, Fig. S1). Males had significantly more head movement than females in the youngest two age strata (P<0.05, uncorrected) and on average over all ages (Table 1).
After pre-processing for within-subject correction of head motion effects on individual fMRI time series, functional connectivity was positively correlated with individual differences in mean FD, and this effect scaled with distance between the nodes (SI Fig. S2A). We therefore also corrected for b etween-subj ect differences in head motion by regressing each inter-regional correlation on mean FD across all participants. This removed the relationship between connectivity and FD, as well as the distancedependence in this relationship (18; 38) (SI Fig. S2). To assess the robustness of key results to this two-step process for head motion correction, we conducted three sensitivity analyses: (i) sex-specific motion correction – FC matrices were regressed on FD separately for males and females (SI Text, SI Fig. S24-27); (ii) GSR correction – the fMRI time series at each node were regressed on the global fMRI signal per participant (SI Text, SI Fig. S21-23); and (iii) motion-matched sub-sample analysis – we used a subset of data (N=314), comprising equal numbers of males and females, for which there was no statistical difference in FD (SI Text, SI Fig. S17-20). There was a significant correlation between the developmental parameters (FC14,FC14-26, and MI) estimated by each of these alternative head motion correction methods and the parameters estimated by our principal method (SI Fig. S28-29). The key finding of dimorphic adolescent development of functional connectivity between DMN, limbic and subcortical regions, as reported below, was conserved in all cases.
Age and sex effects on functional connectivity
We modeled age and sex effects on global functional connectivity of each participant, estimated as mean weighted degree, using linear mixed effects models (LMEs). Functional connectivity increased with age (t(219)=2.3, P<0.05) and males had higher global mean connectivity degree than females (t(296)=5.5, P<0.0001) (Fig. 1A).

(A) Global functional connectivity (FC) strength increased with age (t(219)=2.3, P<0.05) and was higher in males (t(296)=5.5, P<0.0001). (B) To estimate two parameters of development at each regional node, we fit a linear model to the relationship between age and weighted degree (k, nodal strength of connectivity to the rest of the network) for males and females separately. The two model parameters are the intercept, or “baseline” connectivity at age 14 (FC14), and the linear rate of change in connectivity during adolescence (FC14–26). (C) We found 323 regions had significantly increased cortico-cortical connectivity, and 309 regions had increased cortico-subcortical connectivity (PFDR<0.05; 95.7%), at baseline, FC14, in males. (D) FC14–26 was only significantly different between sexes, decreased in females, in subcortico-cortical connectivity of the caudate and nucleus accumbens.
Sex differences in parameters of adolescent development
Regional functional connectivity was estimated between and within cortical and subcortical subsets of nodes by averaging the relevant parts of the connectivity matrix (SI Fig S3). To model development of functional connectivity during adolescence, we focused on three parameters: regional baseline connectivity at age 14, FC14; regional linear change in connectivity between 14-26 years, FC14-26 (Fig. 1B); and the signed Spearman correlation of these two parameters (estimated at the edge-level), termed mat-urational index (−1 < MI < +1) (Fig. 2A; (6)). Previous work on this sample has reported developmental change (controlling for sex) in terms of these parameters estimated at each regional node of a whole brain fMRI network (6). Here we estimated each of these parameters for males and females separately, and the between-sex difference for each parameter, e.g., ΔMI = MIfemale-MImale. We tested the significance of the between-sex difference in each parameter at each regional node using permutation or parametric tests (SI Fig. S3, SI Text).
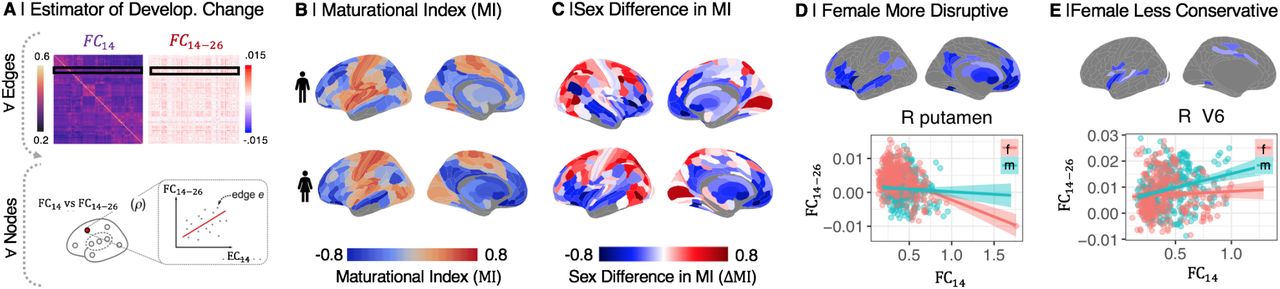
(A) The maturational index (MI) was estimated as the correlation between edgewise baseline connectivity at age 14 (FC14), and the adolescent rate of change in connectivity (FC14-26), at each regional node. (B) MI maps for males and females separately. MI was generally negative (blue) in frontal and association cortical areas, and positive (orange) in primary motor and sensory cortices. (C) The sex difference in MI, ΔMI = MIfemale – MImale, was significant in 230 regional nodes (PFDR = 0.05). ΔMI was significantly negative (less than zero) in the ventral and medial prefrontal gyrus, ventrolateral prefrontal cortex, anterior and posterior cingulate gyrus, medial temporal gyrus, and subcortical nuclei (SI Table S2), indicating sex differences in adolescent development of connectivity of these regions. More specifically, negative ΔMI defined a set of brain regions where adolescent development was either more disruptive (weak connections at 14 years became stronger during adolescence, or strong connections became weaker) or less conservative (strong connections at 14 years became weaker during adolescence) in females compared to males. (D) Map of brain regions where development was more disruptive in females. As exemplified by right putamen, functional connections of disruptively developing nodes that were strong at 14 years (high FC14, x-axis) became weaker over the period 14-26 years (FC14-26 < 0, y-axis), and edges that were weakly connected at 14 y became stronger over the course of adolescence, especially in females. (E) Map of brain regions where development was less conservative in females. As exemplified by right visual area V6, connections that were strong at baseline become stronger over the period 14-26 years, especially in males.
Baseline connectivity at age 14 was greater in primary sensorimotor cortex than in association cortex for both sexes (Fig. 1B, SI Fig. S4-5). As predicted by the sex difference in global functional connectivity at all ages (Fig. 1A), males had significantly stronger baseline connectivity than females at 14 years, i.e., ΔFC14 = FC14,female – FC14,maie > 0, in cortico-cortical and cortico-subcortical connections, but not subcortico-cortical connections (Fig. 1C).
Adolescent rate of change in connectivity was strongly positive in sensorimotor cortex, and less positive or slightly negative in association cortical and limbic areas, for both sexes. There was no significant sex difference, i.e., ΔFC14-26 = 0, for cortico-cortical and cortico-subcortical connectivity, but a subset of subcortico-cortical connections (involving caudate and nucleus accumbens) had significantly more negative rates of change in females compared to males (Fig. 1D, Fig. S8-S9; PFDR < 0.05).
Maturational index was positive in sensorimotor cortex, and negative in association cortex and subcortical areas, in both sexes separately (Fig. 2B), as previously reported for both sexes on average (6). However, there were many areas of significant sex difference in MI (PFDR < 0.05). Females had more negative MI than males in 107 regions (Fig. 2B; SI Table S2, SI Fig S11). In 84 of these regions, exemplified by the right putamen (Fig. 2D), there was more disruptive development in females, i.e., weak connections at 14 years became stronger during adolescence, or strong connections became weaker, in females compared to males. In 23 regions, exemplified by right visual area V6 (Fig. 2D), there was less conservative development in females, i.e., strong connections at 14 years became stronger during adolescence in males compared to females.
The unthresholded map of ΔMI was co-registered with a prior map of cortical cytoarchitectonic classes (Fig. 3B) and a prior map of resting state networks (39) from an independent component analysis of adult fMRI data (Fig. 3C). Regions of negative ΔMI were concentrated in secondary sensory, limbic, and insular classes of cortex, and in subcortical structures, defined anatomically Fig. 3B); and in default mode, limbic, ventral attentional and subcortical systems defined functionally (Fig. 3C).

(A) ΔMI was most negative in secondary sensory, limbic, and insula cortex, and subcortical structures defined by cell type, (B) as well as functionally defined default mode network (DMN), ventral attention network, limbic, and subcortical structures. (C) Wordcloud of Neurosynth meta-analytical cognitive terms scaled according to their strength of association with the disruptively developing brain regions (cortical map of ΔMI < 0). (D) Top, identically parcellated brain map of MDD case-control differences in weighted degree, t statistics. Bottom, ΔMI (x-axis) was positively correlated with case-control t-statistics (y-axis; ρ = 0.4, P < 0.001). Regions with dimorphically disruptive development in adolescence (negative ΔMI) had reduced degree of connectivity in adult MDD cases.
Automated meta-analytic referencing of the unthresholded map of significantly negative ΔMI was conducted using the Neurosynth database of task-related fMRI activation coordinates (40). This indicated that regions with more disruptive (or less conservative) development in females were typically activated by tasks related to reward processing, emotion, motivation, incentive delay, and dopamine (Fig. 3C).
Gene transcriptional enrichment of dimorphically developing brain systems
To investigate the relationships between gene transcriptional profiles and sexually dimorphic adolescent brain development, we used partial least squares (PLS) regression to find the weighted gene expression pattern that was most closely co-located with the ΔMI map (Fig. 3A; (5; 42)). Whole genome transcripts were estimated for the average of each of 180 bilaterally homologous cortical regions using adult post-mortem data (N=6) provided by the Allen Human Brain Atlas (27).
The first PLS component (PLS1; Fig. 3A) explained 34.6% of the variance in ΔMI, significantly more than expected by chance (Pperm.<0.05). The PLS1 gene expression weights were positively correlated with ΔMI, thus negatively weighted genes were overexpressed in regions with negative ΔMI, and positively weighted genes were under-expressed in regions of negative ΔMI (Fig. 4B). To test the hypothesis that sex chromosomal gene expression was related to the sexual dimorphism in adolescent brain development, we assessed chromosomal enrichment of the genes on PLS1. We found that the most negatively weighted genes, which were highly expressed in disruptively developing regions, were most strongly enriched for X chromosome genes (P<0.001; Fig. 4C, SI Table S4). Regional differences in cortical gene expression have been attributed to different proportions of functionally specialised neuronal, glial and other cell types in different cortical areas (43). We therefore used the Cell Specific Enrichment Analysis tool (CSEA) tool (44) to assess cell type enrichment of the most positively and negatively weighted genes on PLS1. We found that negatively weighted genes (Z<-2.58) were enriched for genes with cortical expression in late fetal and early postnatal life, and for genes with amygdala, hippocampal and striatal expression in late childhood and adolescence (Fig. 4D). In contrast, positively weighted genes (Z>2.58) were enriched for genes with cortical, cerebellar and thalamic expression during adolescence and young adulthood (Fig. 4D). This result indicates that the negatively weighted genes, most strongly co-expressed with the disruptively developing cortico-subcortical system, were specialised for perinatal and adolescent phases of cortical and subcortical development, respectively.

(A) We used partial least squares (PLS) regression to map the Allen Human Brain Atlas (AHBA) gene expression data (27) onto the ΔMI map. (B) Relationship of ΔMI to expression of exemplary single genes: SCN1B, a positively weighted gene close to the top of the ranked list of PLS1 weights; CORT, a near-zero weighted gene in the middle of the list; and SST, a negatively weighted gene close to the bottom. Negatively weighted genes were more strongly expressed in regions with more disruptive development in females indicated by negative ΔMI; whereas positively weighted genes were more strongly expressed in regions with female more conservative development indicated by positive ΔMI. (C) Enrichment analysis for chromosomal genes. Plot of the median rank of genes from each chromosome on PLS1, with standard deviations. (D) Enrichment analysis for neurodevelopmental genes. Negatively weighted genes (blue) were enriched for genes typically expressed in cortex during late fetal and early post-natal development and for genes expressed in the amygdala, hippocampus and striatum during late childhood and adolescence. Positively weighted genes (red) were enriched for genes typically expressed in cortex and cerebellum during adolescence and early adult life. (E) Enrichment analysis for prenatal cell type-specific genes. Negatively weighted genes (blue) were significantly enriched for genes expressed by prenatal radial glia (vRG, oRG), microglia (Mic), oligodendrocyte progenitor cells (OPG), and excitatory neurons. (F) Enrichment analysis for adult cell type-specific genes. Negatively weighted genes were significantly enriched for genes expressed by adult astrocytes, OPC, and excitatory neurons. (G) Enrichment analysis for MDD-related genes. Negatively weighted genes were significantly enriched for genes associated with major depressive disorder by an independent genome wide association study (GWAS; (41)).
We further explored developmental aspects of the sexually dimorphic system by testing for enrichment by genes specific to prenatal and post-natal cell types (45). We found that genes which were over-expressed in disruptively developing brain regions were enriched for pre-natal cell types (46), including oligodendroglial precursor cells (OPC), microglia, astrocyte progenitor radial cells, inhibitory and excitatory cortical neurons (Fig. 4E), as well as for multiple adult glial and neuronal cell classes (Fig. 4F, SI Fig. S14).
Dimorphic brain development and depression
Extending the enrichment analysis to consider depression-related genes, we found that the list of genes strongly co-expressed with dimorphically disruptive brain systems was significantly enriched for genes with genome-wide association with major depressive disorder (MDD) (41). Specifically, the MDD risk genes were negatively weighted and ranked towards the bottom of the PLS1 list, indicating that they were more highly-expressed in brain regions with disruptive development, indexed by negative ΔMI.
To assess the anatomical correspondence between the dimorphi-cally disruptive brain system, and mood disorder-related changes in fMRI connectivity, we used resting state fMRI data from a prior case-control study of adult MDD cases (N=50) and healthy controls (N=46); see (SI Table S3). The parcellated, unthresholded map of MDD case-control differences in weighted degree (comprising 346 regional t statistics), was significantly co-located with the identically parcellated, unthresholded map of ΔMI (ρ = 0.4, P<0.001; Fig. 3D). Brain regions with sexually dimorphic development in adolescence (negative ΔMI) had reduced degree of functional connectivity in MDD cases compared to controls.
Discussion
In this accelerated longitudinal fMRI study of healthy young people, we have identified human brain systems that demonstrated a significantly different pattern of adolescent development in females compared to males. We found sex differences in several aspects of functional connectivity (FC): females had lower global mean FC across all ages, and reduced nodal strength of connectivity in most regional nodes at 14 years FC14. However, there were more anatomically specific sex differences in two developmentally sensitive parameters: the rate of change in FC during adolescence, FC14-26, was significantly reduced in females for connections between subcortical and cortical structures; and the maturational index, MI, a coefficient of the linear relationship between edgewise FC14 and FC14-26 at each node, was significantly more negative in females for cortical areas concentrated in the default mode network (DMN), ventral attentional and limbic networks, as well as subcortical nuclei.
The first explanatory hypothesis we considered was that the sex differences in developmental fMRI parameters were driven by sex differences in head motion during scanning. Males, especially younger males, had more head movement than females. We addressed this potential confound by a two-stage pre-processing pipeline which statistically corrected each participant’s functional connectome for between-subject differences in head motion, indexed by framewise displacement (FD). These pre-processed data passed standard quality control criteria for movement-related effects on functional connectivity. Moreover, we repeated the entire analysis for male and female data separately, for a “motion-matched” subset of the data in which there was no significant sex difference in FD, and for all data after global signal regression. In all three sensitivity analyses, the key results of our principal analysis were qualitatively and quantitatively conserved. We therefore consider that head motion can be discounted as a sufficient explanation for sexual dimorphism in these developmental parameters.
An alternative explanation is that sex differences in FC14-26 and MI reflect dimorphic development of specific cortico-subcortical circuits. In particular, females had a more disruptive pattern of adolescent development, indexed by negative ΔMI, whereby functional connections that were weak at 14 years became stronger, and connections that were strong became weaker, over the course of adolescence. We can interpret this as indicating sex differences in an underlying process of reconfiguration or remodelling of cortico-subcortical connectivity at a synaptic or neuronal scale.
To assess the plausibility of this biological interpretation, we used pre-existing data on human brain gene expression, and the dimension-reducing multivariate method of partial least squares (PLS), to identify the set of genes that were most over-or underexpressed in brain regions corresponding to the dimorphic system defined by developmental fMRI. Enrichment analysis demonstrated that the genes that were most strongly expressed in brain regions with more disruptive development in females included significantly more X chromosome genes than expected by chance. The same set of genes was also significantly enriched for genes that are known a priori to be expressed in cortical areas during early (perinatal) development and in subcortical structures, such as amygdala, during adolescent development.
Sexual differentiation of the brain has been proposed to occur in two stages: an initial “organizational” stage before and immediately after birth, and a later “activational” stage during adolescence (47). It has long been argued that these events are driven by gonadal hormones. However, more recent work suggests a complex interplay of sex chromosomes and their downstream products leading to sexual differentiation of brain cells (48; 49; 50). In this context, the results of our enrichment analysis suggest that cortical regions of the dimorphic fMRI system may become sexually differentiated during the early, organizational stage, whereas inter-connected subcortical structures become differentiated during the later, activational stage of development. In short, sexual dimorphism of adolescent development of cortico-subcortical connectivity could be driven by developmentally phased and sexually dimorphic gene expression.
Finally, we assessed the pathogenic relevance of this dimorphi-cally developing brain system to the greater risk of depression in adolescent females. Macroscopically, the DMN and subcortical structures that had more disruptive development in females, e.g., ventral medial prefrontal cortex, medial temporal gyrus, anterior and posterior cingulate cortex, have previously been implicated as substrates of depressive disorder (51; 52). This anatomical convergence was quantified by the significant spatial correlation between the whole brain map of sex differences in MI and an independent map of MDD case-control differences in nodal degree of functional connectivity. At a microscopic scale, the (PLS1) list of genes transcriptionally co-located with the dimorphically developing fMRI system were enriched for risk genes from prior genome-wide association studies of MDD, as well as genes specifically expressed by adult neuronal and glial cells that have been linked to neuroimaging phenotypes of depression (53). Psychologically, cognitive functions that typically activated the dimorphic system, based on meta-analysis of a large prior database of task-related fMRI studies, included reward-related processes that are fundamental to the core depressive symptom of anhedonia.
Methodological issues
It is a strength of the study that our analysis of a dimorphi-cally developing brain system is based on a longitudinal fMRI dataset with approximately equal numbers of males and females in each stratum of the adolescent age range. Head motion is known to be a potentially problematic confound in developmental fMRI (18; 19; 20). We have mitigated its impact on these data by a two-step pre-processing pipeline that satisfied prior quality control criteria; and we have demonstrated the robustness of our key results to three alternative motion correction strategies, including GSR (23) (SI Fig. S17-29). Limitations of the study include our reliance on gene expression maps from post mortem examination of six adult, mostly male, brains. Biological validation of this dimorphic fMRI system would be more directly informed by sex-specific human brain maps of whole genome transcription in adolescence. It will also be important in future to test the hypothesis that an anatomically homologous cortico-subcortical system has dimorphic adolescent development in animal models that allow more precise but invasive analysis of the cellular and molecular substrates of fMRI phenotypes than is possible in humans. We have shown that this normative developmental dimorphism is anatomically, genetically and psychologically relevant to depression. However, further studies will be needed to test the hypothesis that the emergence of depressive symptoms in adolescent females is directly related to the dimorphically disruptive development of DMN, limbic and subcortical connectivity that we have identified in this cohort of healthy participants.
Conclusion
We conclude that there is sexual dimorphism in adolescent development of functional connectivity between nodes of a human cortico-subcortical system that is anatomically, genetically and psychologically relevant to depression.
Methods
Study sample
Analysable fMRI data were available for N=298 healthy participants, aged 14 to 26 years, each scanned one to three times as part of an accelerated longitudinal study of adolescent brain development (Neuroscience in Psychiatry Network, NSPN; (37; 54; 6)). Participants self-identified their sex as either male or female. There were approximately equal numbers of males and females in each of five age-defined strata at baseline (Table 1). All participants aged 16 years or older gave informed consent; participants younger than 16 gave informed assent and consent was provided by their parent or guardian. The study was ethically approved by the National Research Ethics Service and conducted in accordance with UK National Health Service research governance standards.
fMRI data acquisition
Functional MRI data were acquired at three sites, on three identical 3T Siemens MRI scanners (Magnetom TIM Trio, VB17 software version), with a standard 32-channel radio-frequency (RF) receive head coil and RF body coil for transmission using a multi-echo echo-planar (ME-EPI) imaging sequence (55) with the following scanning parameters: repetition time (TR): 2.42s; GRAPPA with acceleration factor 2; Flip Angle: 90; matrix size: 64×64×34; FOV: 240×240mm; in-plane resolution: 3.75×3.75 mm; slice thickness: 3.75 mm with 10% gap, sequential slice acquisition, 34 oblique slices; bandwidth 2368 Hz/pixel; echo times (TE) 13, 30.55 and 48.1 ms.
fMRI data pre-processing
Functional MRI data were preprocessed using multi-echo independent component analysis (ME-ICA;(56; 57)) which identifies and removes sources of variance in the times series that do not scale linearly with TE and are therefore not representative of the BOLD signal. Ventricular time series, representing variance in cerebrospinal fluid (CSF), were regressed from parenchymal time series using AFNI (58). Scans were parcellated into 360 bilateral cortical regions using the Human Connectome Project (HCP; (59)) template and 16 bilateral sub-cortical regions (amygdala, caudate, diencephalon, hippocampus, nucleus accumbens, pallidum, puta-men, and thalamus) provided by Freesurfer (60). Regional time series were averaged over all voxels within each parcel and bandpass filtered by the discrete wavelet transform, corresponding to frequency range 0.025-0.111 Hz (61).
After within-subject preprocessing and quality control, we retained regional time series for 330 cortical and 16 subcortical nodes. Individual functional connectivity matrices {346 × 346} were estimated by Spearman’s correlation for each possible of pair of nodes. Finally, we regressed each pairwise correlation or edge on the time-averaged head motion of each participant (mean FD). The residuals of this regression were the estimates of functional connectivity used for further analysis (SI Fig. S2).
Estimating parameters of adolescent development and testing sex differences
For males and females separately, we modeled region-wise and edge-wise local cortico-cortico, subcortico-cortical and cortico-subcortical (SI Fig. S3) maturational changes of functional connectivity as a function of age, using linear mixed effects models with fixed effects of age and site, and a subject-specific intercept as a random effect.
Baseline connectivity (FC14) was estimated as the predicted FC at age 14, the adolescent rate of change (FC14-26) as the slope of the model (Fig. 1). We calculated the maturational index (MI), as the Spearman correlation of edge-wise FC14 and FC14-26 (Fig. 2).
We parametrically tested for the significance of the sex difference in MI in a Z-test of the equivalence of the slopes of the regression of FC14 on FC14-26 for males and females (62).
Enrichment analysis
We extracted the first component (PLS1) of a partial least squares regression of ΔMI on post mortem gene expression data from the Allen Human Brain Atlas collected from 6 donor brains (5 males) (27) (Fig. 4). We then used a median rank-based approach to assess the enrichment of PLS1 on several published gene lists (63). This approach estimates the degree to which the spatial expression of PLS1 genes is related to a given gene set by comparing the observed (PLS1) median gene rank to a null distribution of median ranks from genes that were randomly sampled from the PLS component and matched by gene length (for null models, refer to SI Fig. S4-7). Thus if a gene set’s real median rank is significantly lower than expected by chance the gene set is associated with the bottom of PLS1 and if it is higher, its genes are enriched towards the top end of the component.
FMRI connectivity in major depressive disorder
We constructed a MDD case-control map by conducting multiple t-tests for the difference in nodal weighted degree of functional connectivity between two groups of resting state fMRI data from an independent sample of 47 healthy controls and 87 MDD cases (SI Text, SI Table S3). We then correlated the ΔMI map with the MDD case-control t map (Fig. 3).
Data and code availability
The main data set used for our analysis will be made publicly accessible upon publication. The code can be found at https://github.com/LenaDorfschmidt/sex_differences_adolescence.git.
Funding acknowledgements
This study was funded by a collaborative award from the Wellcome Trust for the Neuroscience in Psychiatry Network at University College London and the University of Cambridge. Additional funding was provided by the NIHR Cambridge Biomedical Research Centre. EB is an NIHR Senior Investigator. LD was supported by the Gates Cambridge Trust. P.E.V. is a Fellow of MQ: Transforming Metal Health (MQF1724) and of the Alan Turing Institute funded by EPSRC grant EP/N510129/1. R.A.I.B. was supported by a British Academy Post-Doctoral fellowship and the Autism Research Trust. Data were curated and analysed using a computational facility funded by an MRC research infra-structure award (MR/M009041/1) and supported by the NIHR Cambridge Biomedical Research Centre. This research was co-funded by the NIHR Cambridge Biomedical Research Centre. The views expressed are those of the authors and not necessarily those of the NHS, the NIHR or the Department of Health and Social Care.
Conflict of interest
E.T.B. serves on the Scientific Advisory Board of Sosei Heptares.
Author Contributions
L.D., P.E.V., and E.T.B. designed research. L.D., R.A.I.B., and J.S. analyzed data. L.D., R.R.-G, F.V., M.G.K., P.E.V. performed research. J.S., R.A.I.B, M.G.B., and A.A. contributed new reagents/analytical tools. S.R.W. advised on statistical methods E.T.B., P.J., R.D., I.G., and P.F. designed the NSPN study. N.A.H. designed the Biodep study E.T.B. and L.D. wrote the paper.
Footnotes
↵** A complete list of the NSPN Consortium can be found in the SI Appendix.
References


