

Abstract
Today, no effective tools are proposed in ecotoxicology to diagnose and predict the accumulation and effects of chemical substances on living organisms, accounting for exposure situations that are known to be complex (routes of exposure, metabolization processes, cocktail effects, etc.). Among elaborated tools, toxicokinetic/toxicodynamic (TKTD) models are now strongly recommended to describe the exposure time-dependency on individual life-history traits from experimental data collected through standard toxicity tests. In particular, the TK part is used to relate the exposure medium concentration to the internal concentration within organisms, considering various processes such as accumulation, depuration, metabolization and excretion (ADME). Regarding plant protection products in marketing authorization applications, regulation No 283/2013 (EU) defines the data requirements for active substances with a bioaccumulation test on fish following OECD guideline 305, which consists in an accumulation phase followed by a depuration phase. The concentration of the substance within fishes is followed over time during both phases thus allowing to describe the exposure time-dependency on individual (fit of TK model) and bioaccumulation factors. On a regulation point of view, these factors are decisive criteria for further estimating the concentration of active substances present in food items of vertebrates and more particularly of piscivorous birds and mammals. This paper presents a new ready-to-use tool providing on-line the estimation of the bioaccumulation factors associated with their uncertainty to facilitate the daily work of regulators, but also of any user, by benefiting of a freely available and user-friendly interface avoiding to invest into underlying methods. This tool, MOSAICBioacc, is available from the following adress: https://mosaic.univ-lyon1.fr/bioacc, and can be used as a turn-key decision making tool in the framework of environmental risk assessment.
1. Introduction
Nowadays, ecotoxicology has to provide relevant and effective methods and tools in a predictive (prior risk assessment) and diagnostic (posterior identification of effects and their remediation) perspective. The aims of these methods and tools are to quantify the exposure routes of potentially hazardous substances to assess dose-response relationships and define critical effect concentrations, helping in understanding the underlying biological and ecological mechanisms, and developing indicators for environmental quality. In this context, toxicokinetic/toxicodynamic (TKTD) models are now strongly recommended to describe the exposure time-dependency on individual life-history traits from experimental data collected through standard toxicity tests (Ockleford et al., 2018). In particular, the TK part is used to relate the exposure medium concentration to the internal concentration within organisms, considering various processes such as accumulation, depuration, metabolization and excretion (ADME). Regarding plant protection products in marketing authorization applications, regulation No 283/2013 (EU) (European Commission, 2013) defines the data requirements for active substances with a bioaccumulation test on fish following OECD guideline 305 (OECD, 2012), which consists in an accumulation phase followed by a depuration phase. During the accumulation phase, individuals are exposed to the substance under interest at a range of concentrations, chosen according to the mode of action of the substance. Then, organisms are transferred to a clear medium for the depuration phase. The concentration of the substance within fishes is followed over time during both phases thus allowing to define the bioconcentration factor (BCF), the biomagnification factor (BMF) or the bioaccumulation factor (BAF) according to the exposure route (via water, food or sediment respectively). On a regulation point of view, such factors are decisive criteria for further estimating the concentration of active substances present in food items of vertebrates and more particularly of piscivorous birds and mammals. A test with fish according to OECD TG 305 is also preferred where experimental information on bioaccumulation is needed for PBT/vPvB assessment under REACH regulation (European Commission, 2006; ECHA, 2017). In most cases, preference is also given to experimentally derived BCF values to be used for secondary poisoning assessment under Biocidal Products Regulation (European Commission, 2012).
In the past decades, many types of methods have been proposed to estimate parameters of simple TK models, making it possible to deduce bioaccumulation factors (especially BCF) values depending on the kinetics of accumulation and depuration observed in dedicated experiments (OECD, 2012). Nowadays, TK model parameters are rarely estimated simultaneously, considering both their uncertainties with correlation. However, it is crucial to properly estimate them for a better risk assessment and still remains a challenge today. Besides, regulators are sceptical about the diversity and complexity of these methods and tools, while thinking about their standardization at the same time (Tan et al., 2020). Ratier et al. (2019) recently proposed a full revisit of the approach based on a unified inference method to estimate parameters for both accumulation and depuration phases simultaneously. This innovent inference process makes it possible to incorporate the TK part into complete TKTD model.
This paper presents a new ready-to-use tool, MOSAICBioacc, leading to the estimation of bioaccumulation factors associated with their uncertainty to facilitate the daily work of regulators, but also of any user, benefiting of a freely available and user-friendly interface avoiding to invest into underlying methods. This web app clearly takes advantage of the new conceptual framework developed by Ratier et al. (2019) in order to estimate parameters of a one-compartment TK model including several exposure routes (water, food, sediment), accounting for metabolization (three metabolites) of the chemical substance and possibly for growth dilution. The web app will only requires to upload standard experimental data, then some clicks provide all results. In particular, BCF/BMF/BAF are delivered as probability distributions summarized by a median and a 95% credible intervals. In addition, a collection of goodness-of-fit criteria is provided to ensure the robustness of the results. At last, any output can be downloaded for further inclusion into any home-made document, while a full report can be directly downloaded in different convenient formats.
2. Description
MOSAICBioacc was developed as a Shiny environment, available at https://mosaic.univ-lyon1.fr/bioacc and hosted at the Rhône-Alpes Bioinformatics Center PRABI (2016). A user guide and an explanatory video are available at the beginning of the application to assist the user.
2.1. Data uploading
When using MOSAICBicacc, the first step is to upload input data (Fig. 1-a). MOSAICBicacc expects to receive bioassay data as a .txt file or a .csv file (comma, semicolon or tabular separator) with a specific format. Each line of the table corresponds to a time point for a given replicate and a given exposure concentration of the contaminant. The table must contain four columns, with the exact following header names, the order of column not mattering (Table 1): ‘time’ (the time point of the measurement at the exposure concentration, in hours, minutes, days or weeks), ‘exposure’ (the concentration of the contaminant in the exposure medium, in μg.mL−1), ‘replicate’ (a number or a string that is unique for each replicate, dimensionless), and ‘concentration’ (the concentration of the contaminant within the organism, in μg.g−1).

Data uploading and user information to enter from the MOSAICBioacc homepage.
Example of a data set ready to be used with a TK model.
As shown on Fig. 1-a, the user of MOSAICBioacc can either upload its own data set with a click on ‘Browse’ (by taking care about the format specification of its file) or try the platform with an example data set. When the upload is complete, the user has to manually select the corresponding separator, the appropriate time unit and the duration of the accumulation phase. The application first provides an overview of the raw data which allows the user to check if the data were correctly entered. The user can also visualize a plot of the data (Fig. 1-b). In case the user uploads a file with several exposure concentration, it has to select the one for which it wants to see the results. Indeed, only one file at a time can be analysed by the web app. It should be noted that for each new choice of exposure concentration, the duration of the accumulation phase is reset and framed in orange to invite the user to update it before to proceed to new calculations.
Some example files are provided in MOSAICBioacc to illustrate it and help the users. MOSAICBicacc is illustrated in this paper with a typical data set of a toxicokinetic bioassay where concentrations were collected for rainbow trout (Oncorhynchus mykiss) exposed to contaminated water at a highly hydrophobic chemical (logKcw = 9.06) at an exposure concentration of 0.0044 μg.mL−1 over 49 days, with one replicate at each time point. Then fishes are transferred in a clean medium for 98 days (Crookes & Brooke, 2011). The data set can be downloaded directly from the application.
2.2. Model and parameters
The organisms are considered as single compartments for which a first-order kinetic bioaccumulation model accounting for several exposure and elimination routes can be expressed in a generic way as follows (Eqs. (1) to (4)):

 where Cp(t) is internal concentration of the parent compound at time t(μg.g−1), Cm,ℓ(t) internal concentration of metabolite ℓ(∀ℓ =1… L with L total number of metabolites) at time t(μg.g−1), U sum of all uptake terms, E sum of all elimination terms for the parent compound, M sum of all elimination terms for metabolite, km,ℓ metabolization rate of metabolite ℓ(time−1), ke,mℓ elimination rate of metabolite ℓ(time−1). A summary of the meaning of symbols and letters is provided in Table 2.
The previous dynamical system can explicitly be solved when exposure concentration is assumed to be constant over time (Annex 1).
Summary of the meaning of symbols and letters of the TK model.
Within the MOSAICBioacc web app, we choose to only propose three routes of exposure (I = 3, i.e., water, food and sediment), three processes of elimination (J = 3, i.e., excretion, growth dilution and metabolization) and a maximum of three metabolites (L = 3) which directly come from the parent compound. Hence, the maximum number of parameters is 18 when the model is complete, and the user will have at the end a total of 56 possible models depending on the combination it chooses (Annex 2). According to the experimental design, the user is invited to select the corresponding parameters (Fig. 1-c). We assume a Gaussian probability distribution for the contaminant and its metabolites concentration within the organism as follow (Eqs. (5) and (6)):

 where variables and parameters are explained in Table 2.
In this paper, the results will be illustrated with a data set considering only the water exposure route (ku) with the corresponding elimination rate (ke). Thus the corresponding first-order kinetic bioaccumulation model can simply be expressed as follows as given by Eqs. (7) and (8):

By default, the basic parameters of the model are selected, i.e., water for the exposure medium and excretion for the depuration process (ku and ke). If the file has correctly been uploaded and the exposure concentration has been chosen for the analysis, a reminder of the latter is displayed on the screen and the button for launching the calculations is unlocked. When the user clicks on the ‘Calculate and Display’ button (Fig. 1-c), the calculations are launched with a notification informing it of the progress. When calculations are finished, results are displayed, as some plots and tables by default, and a button is available to display all the goodness-of-fit criteria.
2.3. Calculations
2.3.1. Definition of prior distributions
In MOSAICBicacc, the choice of priors is hidden to the user. As the application has to be the most generic as possible, priors were assumed following a non-informative (−5, 5) log10-uniform distribution for all uptake and elimination rate constants, and a non-informative (0.001, 0.001) Gamma prior for all standards deviations, as usually done in the field of bioaccumulation studies (Lambert et al., 2005; Ratier et al., 2019; Richards & Chaloupka 2009).
2.3.2. Bayesian inference
Model computations that underline MOSAICBicacc calculations are performed with JAGS (Plummer, 2019) and R software (version 3.6.3, R Core Team 2020) via the rjags package (Plummer, 2019). Models are fitted to bioaccumulation data using Bayesian inference via Markov Chain Monte Carlo (MCMC) sampling. For each model chosen by the user, running starts with a short sampling on three chains (5,000 iterations after a burn-in phase of 10,000 iterations) using the Raftery and Lewis method (Raftery & Lewis, 1992) to set the necessary thinning and number of iterations to reach a precise and accurate estimation of each model parameter. Thanks to rjags, model parameters are estimated with the computation of the joint posterior distribution from the likelihood of the observed data combined with prior distributions on parameters. All details on this approach can be found in the original research paper (Ratier et al., 2019) but also in many other papers in the field of ecotoxicology (Billoir et al., 2011; Ockleford et al., 2018).
2.3.3. Bioaccumulation factors
In MOSAICBicacc, bioaccumulation factors are calculated and provided as a first result. This paper illustrates the case of an organism exposed to contaminated water, providing both the kinetic bioconcentration factor (BCFk) and the BCF at steady state (BCFss), which are given by the application. These factors have exact mathematical expressions given by Equations (9) and (10):

 where Cp(tc) is the internal parent compound concentration (in μg.g−1) at the end of the accumulation phase (at t = tc, in time) and Cw is the contaminant concentration in the medium at steady-state (μg.mL−1).
2.4. Results
2.4.1. Bioconcentration factors
When the user clicks on ‘Calculate and Display’ button, some results are provided by default. First, the BCFk is given as a probability distribution (Fig. 2-a) and summarized with its median and its 95% uncertainty limits (95% credible interval, Table 3-a). If the user asks for the BCFss, its probability distribution is also given (Fig. 2-b) as well as its uncertainty limits (Table 3-a).

Probability distributions of BCFk (a) and BCFss (b). The middle-dotted line represents the median value, while left and right dotted lines are the 2.5 and 97.5% quantiles. (c) Measured (black dots) and predicted contaminant concentrations in the organism (μg.g−1), where the median is represented by the orange plain line and the uncertainty band by the gray zone, delimited by the 2.5% and 97.5% quantiles in orange dotted lines.
Example of BCF (a) and parameter (b) medians (50% quantile) with their 95% credibility intervals (2.5% - 97.5% quantiles). The hyphen stands for dimensionless parameters.
2.4.2. Predictions
Then, the fitted curve superimposed to the observations are provided (Fig. 2-c). From the joint posterior distribution, MOSAICBioacc also provides the marginal posterior distributions for each parameter, which are also summarized in a table (Table 3-b). All estimated parameters are provided as medians (for point estimates) and 2.5 and 97.5% quantiles (for 95% credible intervals) of marginal posterior distributions. The credible intervals are crucial to quantify the uncertainty on parameter estimates.
2.4.3. Goodness-of-fit
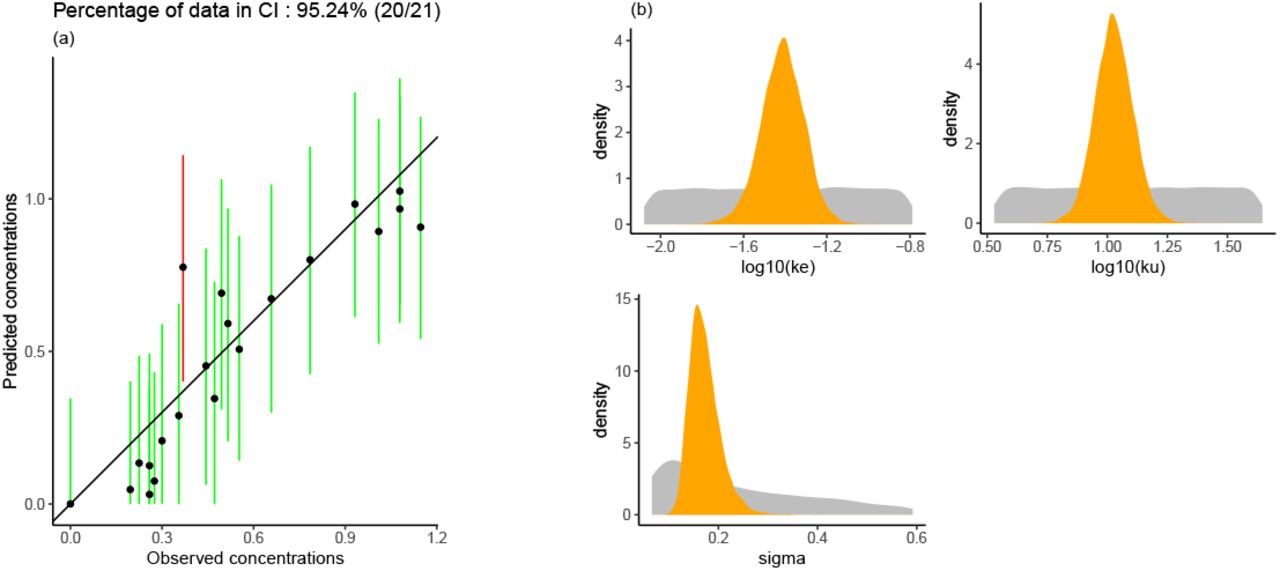
At the request of the user, several goodness-of-fit criteria are given in a prioritized order we chose based on their relevance and the case to interpret them. The fitting quality of the model can be the first check using a posterior predictive check plot: the idea is to compare each observed value to its prediction from the fitted model at the corresponding concentration associated with its 95% credible interval. If the fit is correct, we expect to see 95% of the observed values falling within the credible intervals of their predictions. As shown on Fig. 3-a, the observed values are read on the x-axis, while the y-axis reports the point estimates predicted by the fitted model at the corresponding concentrations, as well as their 95% credible intervals.

Some goodness-of-fit criteria as given in MOSAIC Bioacc : (a) Posterior Predictive Check (PPC) where black dots symbolyze measured data and vertical segments represent 95% credible intervals (coloured in green if it contains the observed value, in red otherwise); (b) prior (gray) and posterior (orange) distributions of parameters for the simplest TK model.
The robustness of the inference process can be secondly checked using the comparison of prior and posterior distributions. The overall expectation is to get a narrower posterior distribution compared to the prior one, what reflects that data contributed enough to precisely estimate parameters as illustrated in Fig. 3-b.
MOSAICBicacc also provides a correlation plot (Fig. S1), which allows the user to visualize the correlation between parameters by projecting the joint posterior distribution in a plot matrix in planes of parameter pairs. This plot also gives marginal posterior distribution of each model parameter and Pearson correlation coefficients. Correlations between parameters are important to consider in particular when they are high (namely, greater than 0.75) what would mean that one parameter estimate could considerably influence the other.
The convergence of the MCMC chains is checked with the Gelman-Rubin diagnostic (Gelman & Rubin, 1992) expressed via the potential scale reduction factor (PSRF) which is expected to be close to 1.00 (Fig. S1). It also could be visually verified by the MCMC traceplot, which shows the time series of the sampling process leading to the posterior distribution; we expect to obtain the overlapping of the three chains (Fig. S1).
The Deviance Information Criterion (DIC) is also given. It is a penalized deviance statistics accounting for the number of parameters and it is used to compare to the same data set. Sub-models with lower DIC values will be preferred. So, the DIC should be used when comparing several models based on different choices of parameters from combinations at the beginning of the web app.
2.5. Downloads
All results can be downloaded from the bottom of the page and a report can be downloaded with all results. The user can also download the R code corresponding to all graphs and calculations from its data set. This guarantees the transparency and the reproducibility of MOSAICBicacc results. This code can be used as a stepping stone to change default options and to perform further analyses directly in R. For example, the user can modify figures at its convenience, or make several analyses on several data sets at the same time.
3. Conclusions
The development of such a tool raises important methodological issues as for example: (1) the automatization of the parameter inference, in particular for the use of the Bayesian inference; (2) the default options to fix and the choices left to the discretion of the users; (3) the outputs to primarily provide, the goodness-of-fit to show, the downloads to propose, the kind of analysis report to render. We are convinced that MOSAICBicacc may be particularly useful to estimate parameters of TK models and to predict chemical concentrations bioaccumulated in organism from standard data. Besides its user-friendliness, this application is free of use and guarantees the privacy of the uploaded data as well as the transparency and the reproducibility of the results, together with a short response time. This tool could thus be used by risk assessors and decision makers in their daily work of assessing dossiers, e.g., for the authorization of substances on the market (Ockleford et al., 2018), since all results provided by MOSAICBicacc account for uncertainty and correlations between parameters. It can also be used by any environmental scientists, ecotoxicologists and managers when OECD n°305 tests are performed and need to be analysed. Further developments are already in progress to make available MOSAICBicacc as a new module dedicated to TK modelling approaches in the MOSAIC platform (Charles, Veber & Delignette-Muller 2018). Above all, this application will be extended to provide a prediction section that could allow to better design TK experiments in order to collect more relevant data for the model fitting and the estimation of bioaccumulation factors.
4. Authors’ contributions
GM contributed to the Shiny application development, from a basic script provided by CL. The whole TK model has been developed by AR and CL. All authors equally contributed to make the script the most generic as possible, then allowing to facilitate the Shiny application development. AR and SC led the writing of the manuscript.
6. Data accessibility
Directly within MOSAICBioacc at https://mosaic.univ-lyon1.fr/bioacc.
5. Acknowledgements
We are thankful to Anses for providing the financial support. This work benefited from the French GDR “Aquatic Ecotoxicology” framework which aims at fostering stimulating scientific discussions and collaborations for more integrative approaches. This work is part of the ANR project APPROve (ANR-18-CE34-0013) for an integrated approach to propose proteomics for biomonitoring: accumulation, fate and multi-markers (https://anr.fr/Projet-ANR-18-CE34-0013). This work was also made under the Graduate School H2O’Lyon (ANR-17-EURE-0018) and “Université de Lyon” (UdL), as part of the program “Investissements d’Avenir” run by “Agence Nationale de la Recherche” (ANR). We are truly grateful to the anonymous colleagues who participated in testing MOSAICBioacc and for giving their feedback. We also are grateful for Benoît BRET to provide the logo for MOSAICBioacc.
Footnotes


