

Abstract
Late endosomes/lysosomes (endolysosomes) emerge as a potential regulatory hub during cancer. Here, we investigate the intracellular landscape of this organelle in a collection of bladder cancer cell lines and normal human urothelium cells under standardized culture conditions. We find that high-grade bladder cancer cells are characterized by scattered endolysosomes that are accompanied by an altered cellular pH homeostasis and major changes of mTORC1 regulation. Mechanistically, we reveal that mTORC1 substrate specificity is altered, and mTORC1 responsiveness to endolysosome positioning is lost in high-grade cancer cells compared to low-grade cells, highlighting unexpected mechanisms of mTORC1 deregulation in the bladder cancer model. Because endolysosome positioning was critical for invasion from 3D spheroids, our results indicate that changes in their cellular positioning and ability to support signaling, strongly impact cancer cell behavior. Thus, monitoring detailed changes of endolysosomes at different steps of cancer disease reveals intricate spatial and temporal dimensions of tumorigenesis.
Statement of significance Our study reveals significant changes of endolysosomes in bladder cancer progression, highlighting endolysosome dysfunction as a fundamental driving progress in malignancies. The identified alterations in endolysosome positioning and associated mTORC1 signaling regulation could help to stratify emerging therapeutic strategies targeting the endolysosomal compartment.
Introduction
Malignant transformation is characterized by major alterations in the intracellular landscape. However, with the exception of the nucleus, it is generally not well understood to which extend intracellular organelles are altered during carcinogenesis. In recent years, late endosomes/lysosomes (endolysosomes) have emerged as a potential regulatory hub during cancer development (Perera et al., 2019; Thelen and Zoncu, 2017; Hämälistö and Jäättelä, 2016). Endolysosomes are heterogeneous acidic organelles that are functionally similar to yeast and plant vacuoles. They are specialized in the degradation of extracellular molecules or pathogens internalized by endocytosis or phagocytosis, and the intracellular recycling of macromolecules and organelles sequestered by autophagy (Ballabio and Bonifacino, 2020; Lawrence and Zoncu, 2019; Perera and Zoncu, 2016; Thelen and Zoncu, 2017). In addition to this classic role in cellular clearance, several core functions of endolysosomes are often deregulated in cancer. Endolysosomes attenuate growth factor signaling (Pu et al., 2016), whose increase is a common feature of many cancers. They are also the storage compartments for secretory proteases that degrade extracellular matrix during invasion and regulate the trafficking of adhesion molecules for cell migration (Castro-Castro et al., 2016; Steffan et al., 2014). Significantly, the surface of endolysosomes is the cellular platform where the mammalian Target of Rapamycin Complex 1 (mTORC1), a conserved serine/threonine kinase complex, integrates chemically diverse nutrients and growth factor signaling to adjust cellular metabolisms through either promotion of biosynthesis or catabolism (Ballabio and Bonifacino, 2020; Thelen and Zoncu, 2017). One important target of mTORC1 is the MiT/TFE family of transcription factors, which promote the development of several cancers, including renal cell carcinoma, melanoma, and sarcoma (Perera et al., 2019). The MiT/TFE family of transcription factors, including transcription factor EB (TFEB) and MITF, are master regulators of lysosome biogenesis and autophagy. It has been shown that a positive feedback mechanism between mTORC1 and TFEB was sufficient to promote cancer growth in mouse models (Calcagnì et al., 2016; Di Malta et al., 2017), and it is well established that MITF is an oncogene in melanoma (Perera et al., 2019). Moreover, endolysosomes are related to multivesicular bodies (MVB) that secrete one class of extracellular vesicles called exosomes that impact on tumor progression through exosome-dependent altering of stromal cell fate (Hyenne et al., 2017). Thus, endolysosomes seem to support several cellular pathways that are characteristic of tumors. Yet, it is not known whether and how endolysosomes change during cancer.
Here, we investigate the intracellular landscape of the endolysosomal compartment in a collection of bladder cancer cell lines as compared to normal human urothelium (NHU) cells. Bladder cancer represents the ninth most frequently-diagnosed cancer worldwide and fourth most common cancer in men in North America and Europe, thus is an important health burden (Antoni et al., 2017). Employing cell culture on adhesive micropatterns of defined geometry that allow normalization of cell shape, we find that high-grade bladder cancer cells are characterized by scattered endolysosomes that are accompanied by an altered cellular pH homeostasis, major changes of mTORC1 signaling regulation and increased invasiveness.
Results
High-grade cancer cell lines are specifically characterized by scattered, peripheral positioning of endolysosomes
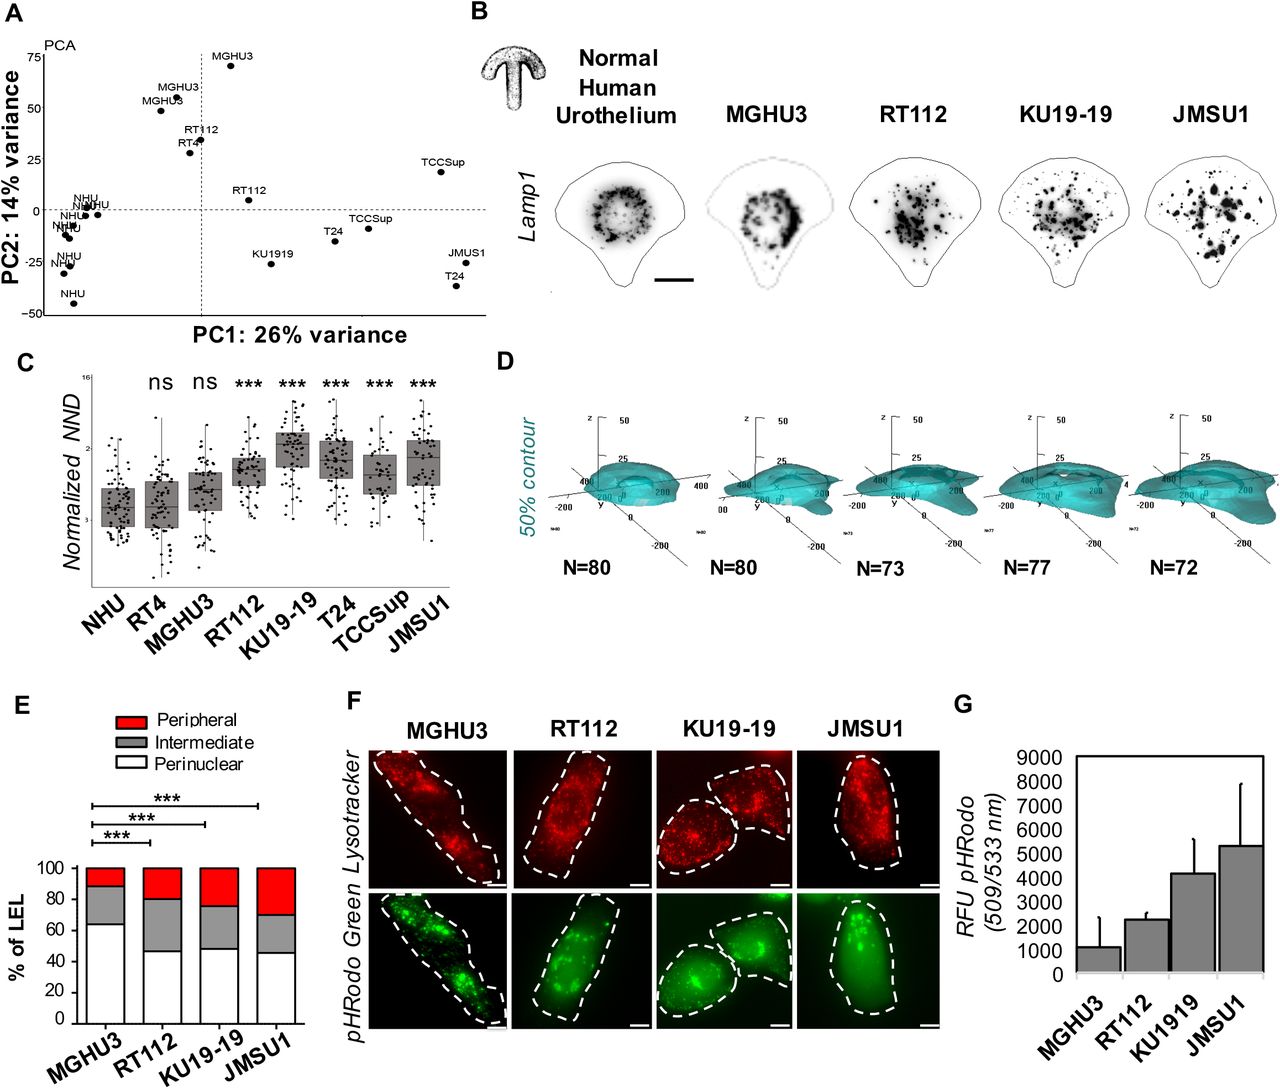
Because of the importance of endolysosomes in cellular homeostasis and its possible role in promoting cancer progression, we aimed at a systematic analysis of endolysosome morphology in a collection of bladder cancer cell lines and their comparison to primary normal human urothelium (NHU) cells. Bladder carcinomas are highly diverse, from low-grade luminal-like subtypes that are not very aggressive, to muscle-invasive bladder subtypes that are characterized by an aggressive behavior (Biton et al., 2014). We have analyzed seven broadly studied bladder cancer cell lines, namely MGHU3, RT4, RT112, KU19-19, T24, TCCSup and JMSU1. These cell lines show the diverse characteristics of bladder carcinomas. Therefore, to access the relation between the different tumor cell lines and compare them with NHU cells, we performed a principal component analysis employing transcriptome data of these cells (Figure 1A). As expected, the replicates of the NHU transcriptomes clustered together and separately from the tumor cells. The low-grade bladder cancer cell lines MGHU3 and RT4 clustered in the upper left corner, positioning them away from high-grade bladder cancer cells JMSU1, TCCSup and T24 that were found in the lower right corner. The cell lines RT112 and KU19-19 were found between these two groups. Next, to compare these different cells at the morphological level, we cultured them on identical crossbow-shaped patterns. All tested cells were fully spread after 3h incubation, visualized by the average projection of the actin cytoskeleton (Supplementary Figure 1A), indicating that all cells adapted well to the micropatterns. We visualized the endolysosomal compartment by immunofluorescence staining of the lysosomal-associated membrane protein 1 (LAMP-1, CD107a, Figure 1B), acquired images in 3D and segmented them to obtain quantitative information. No clear trend in the average volume or the number of endolysosomes per cell was found among the tested cell lines (Supplementary Figure 1B,C). Interestingly, the endolysosomal volume was negatively correlated with their total number (Supplementary Figure 1B,C,D), implying that the balance between few large endolysosomes and many small ones is differently regulated in individual bladder cancer cells. Because the total cell spreading area is controlled by the micropattern and is similar between all cells, we additionally calculated the nearest neighbor distance (NND) of all endolysosomes in each cell. Interestingly, the average NND of NHU cells and low-grade bladder cancer cell lines was smaller than the average NND high-grade bladder cancer cell lines (Figure 1C), indicating that endolysosomes are more scattered throughout the cell in high-grade bladder cancer cell lines. To better characterize the observed changes in endolysosomes, we chose four cell lines for detailed analysis, namely MGHU3 and RT112, KU19-19, and JMSU1. Invasion assays from spheroids into collagen matrix confirmed that MHGU3 was the less invasive cell line (invasion at 5d), followed by RT112 (invasion at 3d), KU19-19 and JMSU1 that both invaded at 1d, however whereas KU19-19 invaded via collective migration of few leader cells from few sites, JMSU1 escaped spheroids via single cells throughout the entire spheroid surface (Supplementary Figure 1E). Similarly, in agreement to the notion that nucleus size increases with transformation, the nuclei in micropatterned cells showed an increase in size from NHU cells to JMSU1 cells (Supplementary Figure 1F). To further analyze the average positioning of compartments we employed our original method based on probabilistic density maps to visualize the smallest cellular volume containing 50% of endolysosomes (Schauer et al., 2010). The corresponding density maps revealed striking differences between NHU and cancer cell lines (Figure 1D): while in NHU and MGHU3 cells endolysosomes were positioned centrally, they were found to be spread out to the periphery in RT112, KU19-19 and JMSU1 cells with strongest phenotype in high-grade cancer cell lines. To verify that positioning changes were not induced by micropatterning, we analyzed endolysosomes in classical cell culture conditions and classified them as peripheral, intermediate and perinuclear depending on their relative positioning between the nucleus and plasma membrane (Figure 1E and Supplementary Figure 1G). In agreement with our density map analysis, we found that the percentage of peripheral endolysosomes significantly increased from MGHU3 to JMSU1, with JMSU1 showing as much as 30% of peripheral endolysosomes. Endolysosomes are acidic compartments that acquire their characteristic pH through the transport of protons from the cytosol through V-type ATPases (Lawrence and Zoncu, 2019). Endolysosomes change their positioning as a response to changes in the cytosolic pH and acidic conditions disperse the endolysosomes to cell periphery in a rapid and reversible manner (Korolchuk et al., 2011), although the underlying biological significance is not well understood. Thus, we asked whether peripheral positioning in bladder cancer cell lines are accompanied by acidification of the cytoplasm. To test this, we incubated cells with the commercially available dye pHrodo-green, whose fluorescence intensity increases with decreasing pH. We found that cytoplasmic pH was indeed decreased in high-grade cancer cells as compared to low-grade cell line MGHU3, the JMSU1 cells showing the lowest pH (Figure 1F,G). Our analyses collectively indicate that the endolysosomal compartment shows differences between high-grade and low-grade bladder cancer cell lines as well as NHU. The most prominent alteration was a scattered, peripheral positioning of the endolysosomal compartment, accompanied by intracellular acidification, that we found as a specific feature of high-grade bladder cancer cell lines.
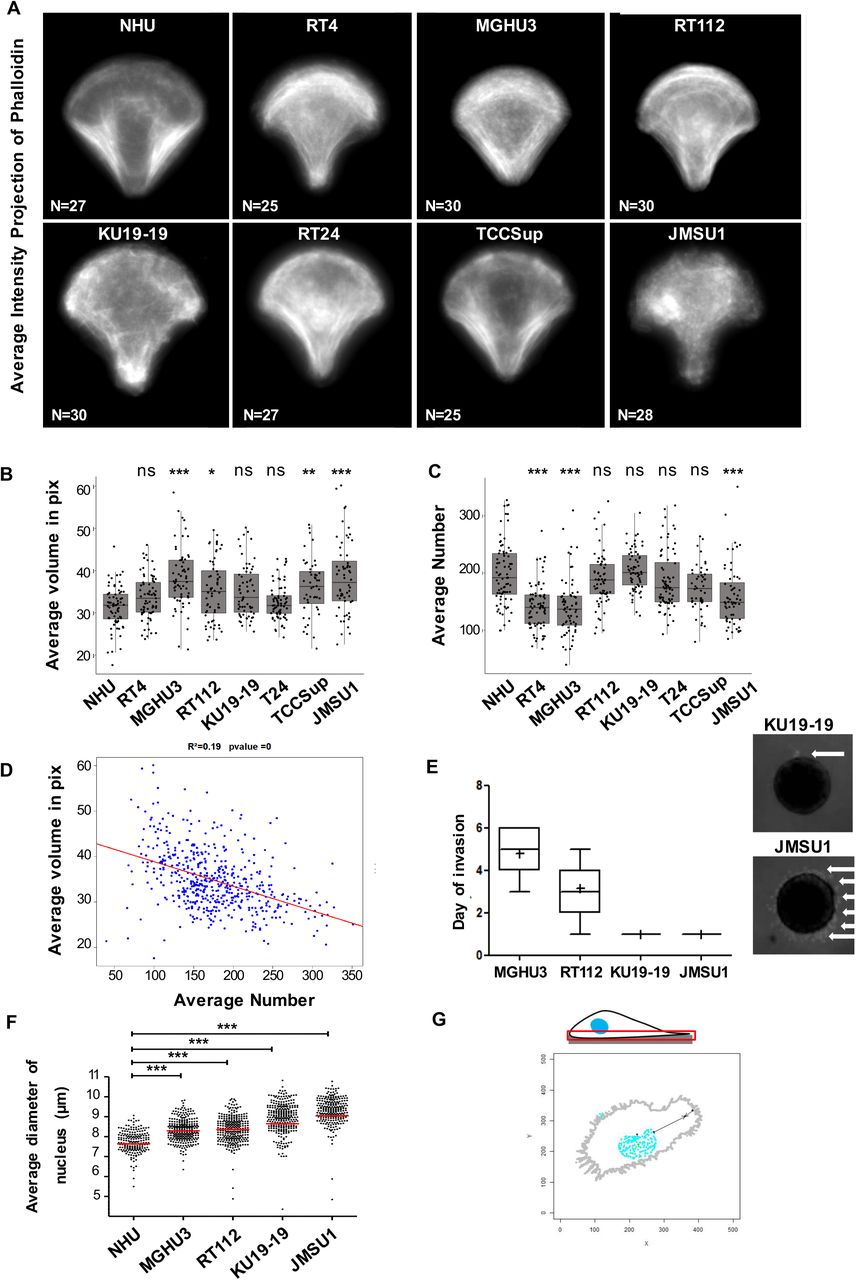
A. Average intensity projections of the actin cytoskeleton visualized by phalloidin of n cells of normal human urothelium (NHU) and bladder cancer cell lines RT4 (ATCC® HTB-2™), MGHU3 (Lin et al., 1985), RT112 (Marshall et al., 1977), KU19-19 (Tachibana et al., 1997), T24 (n=72), TCCSup (Nayak et al., 1977), JMSU1 (Morita et al., 1995). B. Distribution of the average volume of endolysosomes in NHU (n=80), RT4 (n=73), MGHU3 (n=80), RT112 (n=64), KU19-19 (n=77), T24 (n=72), TCCSup (n=48) and JMSU1 (n=72). Adjusted p-values of testing against NHU condition are RT4: 0.2475; MGHU3: <0.0001; RT112: 0.0095; KU19-19: 0.0220; T24: 0.9957; TCCsup: 0.0006; JMSU1: <0.0001 in a Kruskal-Wallis test with Dunn post-hoc test with Sidak correction for multiple comparisons. ns p > 0.01, * p < 0.01, ** p < 0.001 and *** p < 0.0001. C. Distribution of the average numbers of endolysosomes per cell in NHU (n=80), RT4 (n=73), MGHU3 (n=80), RT112 (n=64), KU19-19 (n=77), T24 (n=72), TCCSup (n=48) and JMSU1 (n=72). Adjusted p-values of testing against NHU condition are RT4: <0.0001; MGHU3: <0.0001; RT112: 0.9997; KU19-19: 0.8379; T24: 0.8755; TCCsup: 0.3407; JMSU1: <0.0001 in a Kruskal-Wallis test with Dunn post-hoc test with Sidak correction for multiple comparisons correction. ns p > 0.01 and *** p < 0.0001. D. Correlation analysis between average endolysosomal volume and average numbers per cell shows a weak (R2=0.19) but significant association (p-value < 0.001 in a t-test for correlation). E. Average day of invasion of MGHU3, RT112, KU19-19, and JMSU1 in invasion assays from 3D spheroids into collagen matrix, and representative images of 3D spheroids from KU19-19 (upper panel) and JMSU1 (lower panel) at 1 day after matrix embedding. White arrow indicates invasion of collagen matrix by escaping cells. F. Average nucleus size of NHU (n=80), MGHU3 (n=80), RT112 (n=64), KU19-19 (n=77) and JMSU1 (n=72) cells; *** p < 0.0001 in a χ2 test. G. Schematic representation of the classification analysis of endolysosome distribution in classical cell culture conditions, based on their relative positioning between the nucleus and plasma membrane as quantified in Figure 1E.

A. Principal component analysis of transcriptome data of normal human urothelium (NHU) cells and the bladder cancer cell lines RT4 (ATCC® HTB-2™), MGHU3 (Lin et al., 1985), RT112 (Marshall et al., 1977), KU19-19 (Tachibana et al., 1997), T24 (n=72), TCCSup (Nayak et al., 1977), JMSU1 (Morita et al., 1995). B. Representative images of endolysosomes visualized by immunofluorescence staining against the lysosomal-associated membrane protein 1 (LAMP-1, CD107a) in NHU, MGHU3, RT112, KU19-19 and JMSU1 single cells cultured on crossbow-shaped adhesive micropatterns for better comparison. Scale bar is 10 μm. C. Distribution of nearest neighbor distance (NND) between endolysosomes in NHU (n=80), RT4 (n=73), MGHU3 (n=80), RT112 (n=64), KU19-19 (n=77), T24 (n=72), TCCSup (n=48) and JMSU1 (n=72). Adjusted p-values of testing against NHU condition are RT4: 0.9999, MGHU3: 0.1501; RT112: <0.0001; KU19-19: <0.0001; T24: <0.0001; TCCsup: <0.0001; JMSU1: <0.0001 in a Kruskal-Wallis test with Dunn post-hoc test with Sidak correction for multiple comparisons. ns p >0.01 and *** p < 0.0001. D. 3D probabilistic density maps of endolysosomes in NHU (n=80), MGHU3 (n=80), RT112 (n=64), KU19-19 (n=77) and JMSU1 (n=72). The 50% contour visualizes the smallest cellular volume containing 50% of endolysosomes. E. Endolysosome distribution in classical cell culture conditions, classified into peripheral (red), intermediate (grey) and perinuclear (white) positioning based on their relative positioning between the nucleus and plasma membrane for n>60 cells per cell line analyzed (see also Supplementary Figure 1G), *** p < 0.001 in a χ2 test. F. Representative images of endolysosomes visualized by lysostracker (red) and intracellular pH sensor pHrodo-green (green) in MGHU3, RT112, KU19-19 and JMSU1. Scale bar is 5 μm. G. Quantification of pH sensor pHrodo-green (in relative fluorescence units emission at 509/533 nm) in MGHU3, RT112, KU19-19 and JMSU1, error bars represent s.d. of three independent experiments.
Altered endolysosomes reveal changes in mTORC1 substrates in cancer progression
Endolysosomes are the cellular signaling platform of the mammalian target of rapamycin (mTORC1), the main regulator of cell proliferation and survival which plays a key role in carcinogenesis (Calcagnì et al., 2016; Di Malta et al., 2017). Because mTORC1 signaling has been shown to be regulated by endolysosomes positioning (Korolchuk et al., 2011; Perera and Zoncu, 2016), we wondered whether altered endolysosome positioning across different bladder cancer cell lines affected mTORC1 signaling. We tested mTORC1 activity in bladder cancer cell lines monitoring the phosphorylation of several direct downstream substrates. First, we analyzed eIF4E Binding Protein (4EBP1) and p70-S6 Kinase 1 (S6K1) that are phosphorylated during activation of protein synthesis under control of mTORC1. Interestingly, whereas phosphorylation of 4EBP1 was high in high-grade cells KU19-19 and JMSU1 as compared to MGHU3 and RT112 cells (Figure 2A), phosphorylation of S6K1 was opposite: we detected low phosphorylation of S6K1 in high-grade bladder cancer cell lines compared to MGHU3 and RT112 cells (Figure 2B). Note that the total protein level of 4EBP1 was also upregulated in high-grade cell lines (Figure 2A) whereas the total protein level of S6K remained the same in all cell lines. Employing rapamycin and torin, which directly inhibit mTORC1 (Dumont and Su, 1995; Liu et al., 2010), wortmannin that inhibits upstream signaling as well as starvation that switches off mTORC1, we verified that both 4EBP1 and S6K1 phosphorylation was dependent on mTORC1 activity (Supplementary Figure 2A-D). Moreover, we monitored cellular localization of the transcription factors TFEB employing transfection of plasmid EGFP-N1-TFEB and monitoring cells 48h after transfection. We found that TFEB was retained in the cytosol in the majority of MGHU3 and RT112 cells whereas the majority of TFEB was found translocated into the nucleus in high-grade bladder cancer cell lines, KU1919 and JMSU1 (Figure 2C). This indicated that TFEB was stronger phosphorylated by mTORC1 in low-grade bladder cancer cell lines in which P-TFEB was retained in the cytoplasm. Again, as expected, translocation into the nucleus was induced upon rapamycin treatment in all cell lines indicating mTORC1 specificity (Supplementary Figure 2E). Overall, our results convey that mTORC1 activity is maintained across all grades in bladder cancer cell lines, but that substrate specificity of mTORC1 changes in different bladder cancer cell lines: MGHU3 and RT112 show a high mTORC1 phosphorylation of S6K1 and TFEB that is retained in the cytosol. High-grade bladder cancer cell lines, KU19-19 and JMSU1, show a high mTORC1 phosphorylation of 4EBP1 that is upregulated in these cell lines. Consistent with these results, we found that mTORC1 localizes on endolysosomes in all analyzed bladder cancer cell lines, which supports an active state of mTORC1 (Figure 2D).

A. Western Blot analysis of eIF4E Binding Protein (4EBP1) phosphorylation (P-4EBP1 Ser65) and p70-S6 Kinase 1 (S6K1) phosphorylation (P-p70-S6K Thr389) in MGHU3, RT112, KU19-19 and JMSU1 in control conditions (full media) and after treatment with Wortmannin at 1μM for 2 h. B. Western Blot analysis of 4EBP1 and S6K phosphorylation in MGHU3, RT112, KU19-19 and JMSU1 in control conditions (full media) and after treatment with Rapamycin at 20μM for 2 h. C. Western Blot analysis of 4EBP1 and S6K phosphorylation in MGHU3, RT112, KU19-19 and JMSU1 in control conditions (full media) and after treatment with Torin at 1μM for 2 h. D. Western Blot analysis of 4EBP1 and S6K phosphorylation in MGHU3, RT112, KU19-19 and JMSU1 in control conditions (full media) and after starvation in EBSS for 4h. E. Representative images of MGHU3, RT112, KU19-19 and JMSU1 cells transfected with TFEB-GFP (green) for 48h and treated with Rapamycin at 20μM for 2 h. Scale bars are 5 μm.

A. Western Blot analysis of eIF4E Binding Protein (4EBP1) phosphorylation (P-4EBP1 Ser65) in MGHU3, RT112, KU19-19 and JMSU1 and quantification of relative phosphorylated P-4EBP1 to GAPDH and total 4EBP1 protein levels. Error bars show s.d. of three independent experiments. B. Western Blot analysis of p70-S6 Kinase 1 (S6K1) phosphorylation (P-p70-S6K Thr389) in MGHU3, RT112, KU19-19 and JMSU1 and quantification of relative phosphorylated P-4EBP1 to GAPDH and total S6K1 protein levels. Error bars show s.d. of three independent experiments. C. Representative images of MGHU3, RT112, KU19-19 and JMSU1 cells transfected with TFEB-GFP (green) for 48h and quantification of relative fluorescent intensity between nucleus (grey) and cytoplasm (black). Scale bars are 10 μm. Error bars show s.d. of three independent experiments. D. Representative images of endolysosomes visualized by immunofluorescence staining against the lysosomal-associated membrane protein 1 (LAMP-1, CD107a) and mTORC1 visualized by immunofluorescence staining against mTOR in MGHU3, RT112, KU19-19 and JMSU1. The zoom shows the merged image of both proteins. Scale bars are 10 μm.
mTORC1 signaling does not respond to endolysosomes positioning changes in high-grade bladder cancer cell line
Next, we investigated how mTORC1 signaling responds to changes in endolysosome positioning within different cell lines. Nutrient status, pH and growth factors affect endolysosome positioning and impact on mTORC1 signaling (Ballabio and Bonifacino, 2020; Thelen and Zoncu, 2017), indicating that endolysosomes integrate different upstream signals via positioning for mTORC1 signaling (Korolchuk et al., 2011). Thus, in order to directly test mTORC1 activity due to endolysosome positioning, independent of the complex regulation by nutrients, we performed all assays in full media and specifically altered endolysosome positioning via recruitment or targeting of motor proteins. Dynein is the retrograde motor required for endolysosomal transport towards the cell center (Pu et al., 2016). To change positioning of endolysosomes, we induced recruitment of dynein on them employing FKBP/FRB heterodimerization by the A/C heterodimerizer, a strategy that has been previously validated (van Bergeijk et al., 2015). We engineered RT112 and JMSU1 cells, representing non-aggressive and aggressive cell lines, respectively, to stably express FKBP-fused to Lamp1-mCherry and FRB-fused to the dynein adaptor BicD2 (Supplementary Figure 3A). In these cell lines, addition of A/C heterodimerizer to the culture medium redistribute endolysosomes toward the cell center where they strongly cluster (Supplementary Figure 3B). We monitored mTORC1 activity by visualizing phosphorylation of 4EBP1 and nuclear translocation of TFEB in RT112 and JMSU1 cells. We found that whereas A/C heterodimerizer-induced clustering of endolysosomes in RT112 cells decreased 4EBP1 phosphorylation, clustering of endolysosomes in JMSU1 cells did not change 4EBP1 phosphorylation levels (Figure 3A, B). Similarly, we found monitoring TFEB that its nuclear translocation was increased in RT112 cells but not in JMSU1 cells after A/C heterodimerizer-induced endolysosome clustering (Figure 3C, D). To further confirm these results, we altered endolysosome positioning by targeting the small GTPases Arl8b or Rab7, which regulate the recruitment of molecular motors on endolysosomes (Supplementary Figure 3C). Arl8b recruits kinesins for anterograde transport (Pu et al., 2016), and thus gene silencing of Arl8b leads to retrograde movement of endolysosomes to the cell center (Supplementary Figure 3D). Similar to the A/C heterodimerizer-induced clustering of endolysosomes, siArl8b decreased phosphorylation of 4EBP1 in RT112 but not in JMSU1 (Supplementary Figure 3E, F). However, preventing recruitment of dynein and thus anterograde movement of endolysosomes to the cell periphery by silencing Rab7 (Pu et al., 2016) did not change the levels of phosphorylated 4EBP1 in either cell line (Figure 3D-F). Finally, we investigated mTORC1’s localization on endolysosomes after changing their positioning. Consistent with our previous results, we found that upon A/C heterodimerizer-induced clustering mTORC1 was lost from endolysosomes in RT112 cells (Figure 3E). Contrary, in JMSU1 cells, mTORC1 remained on clustered endolysosomes (Figure 3F). Altogether, our results show that mTORC1 recruitment, and thus mTORC1 signaling respond to endolysosomes positioning in non-aggressive RT112 cells but not in high-grade JMSU1 cells.

A. Schematic representation of the FKBP/FRB heterodimerization system that allows dynein recruitment on endolysosomes induced by A/C heterodimerizer addition according to (van Bergeijk et al., 2015). RT112 and JMSU1 cells were engineered to stably express FKBP-fused to Lamp1-mCherry and FRB-fused to the dynein adopter BicD2 to move endolysosomes to the cell center upon A/C heterodimerizer addition. B. Representative images of endolysosomes visualized by mCherry-LAMP1 in RT112 BicD2 single cells cultured on crossbow-shaped adhesive micropatterns in control condition (DMSO, Ctrl) and after addition of A/C heterodimerizer (A/C). Scale bar is 10 μm. Right panel shows corresponding 3D probabilistic density maps of endolysosomes in control condition (grey) and after addition of A/C heterodimerizer (cyan) for N>60 for each condition. The 50% contour visualizes the smallest cellular volume containing 50% of endolysosomes. C Western Blot analysis of Rab7 and Arl8b in RT112 and JMSU1 cells in control condition (siLUC) and upon targeting Rab7 (siRab7) or Arl8b (siArl8b) D. Representative images of endolysosomes visualized by immunofluorescence staining against the lysosomal-associated membrane protein 1 (LAMP-1, CD107a) in RT112 single cells cultured on crossbow-shaped adhesive micropatterns in control condition (siLUC) and upon targeting Rab7 (siRab7) or Arl8b (siArl8b). Scale bar is 10 μm E. Western Blot analysis of eIF4E Binding Protein (4EBP1) phosphorylation (P-4EBP1 Ser65) in RT112 cells in control condition (siLUC) and upon targeting of Rab7 (siRab7) or Arl8b (siArl8b) and quantification of relative phosphorylated P-4EBP1 to GAPDH levels. F. Western Blot analysis of eIF4E Binding Protein (4EBP1) phosphorylation (P-4EBP1 Ser65) in JMSU1 cells in control condition (siLUC) and upon targeting of Rab7 (siRab7) or Arl8b (siArl8b) and quantification of relative phosphorylated P-4EBP1 to GAPDH levels.

A. Western Blot analysis of eIF4E Binding Protein (4EBP1) phosphorylation (P-4EBP1 Ser65) in RT112 cells stably expressing FKBP-fused to Lamp1-mCherry and FRB-fused to the dynein adopter BicD2 (RT112 BicD2, see also Supplementary Figure 3A) in control condition (DMSO, Ctrl) and after addition of A/C heterodimerizer (A/C) and quantification of relative phosphorylated P-4EBP1 to GAPDH levels. Error bars show s.d. of three independent experiments. B. Western Blot analysis of eIF4E Binding Protein (4EBP1) phosphorylation (P-4EBP1 Ser65) in JMSU1 cells stably expressing FKBP-fused to Lamp1-mCherry and FRB-fused to the dynein adopter BicD2 (JMSU1 BicD2) in control condition (DMSO, Ctrl) and after addition of A/C heterodimerizer (A/C) and quantification of relative phosphorylated P-4EBP1 to GAPDH levels. Error bars show s.d. of three independent experiments. C. Representative images of RT112 BicD2 cells transfected with TFEB-GFP (green) for 48h in control condition (DMSO, Ctrl) and after addition of A/C heterodimerizer (A/C) and quantification of relative fluorescent intensity between nucleus (grey) and cytoplasm (black). Scale bars are 10 μm. Error bars show s.d. of three independent experiments. D. Representative images of JMSU1 BicD2 cells transfected with TFEB-GFP (green) for 48h in control condition (DMSO, Ctrl) and after addition of A/C heterodimerizer (A/C) and quantification of relative fluorescent intensity between nucleus (grey) and cytoplasm (black). Scale bars are 10 μm. Error bars show s.d. of three independent experiments. E. Representative images of mCherry-LAMP1 endolysosomes and mTORC1 visualized by immunofluorescence staining in RT112 BicD2 cells in control condition (DMSO, Ctrl) and after addition of A/C heterodimerizer (A/C). Scale bars are 5 μm. F. Representative images of mCherry-LAMP1 endolysosomes and mTORC1 visualized by immunofluorescence staining in JMSU1 BicD2 cells in control condition (DMSO, Ctrl) and after addition of A/C heterodimerizer (A/C). Scale bars are 5 μm.
Endolysosome positioning regulates invasion of bladder cancer cell lines
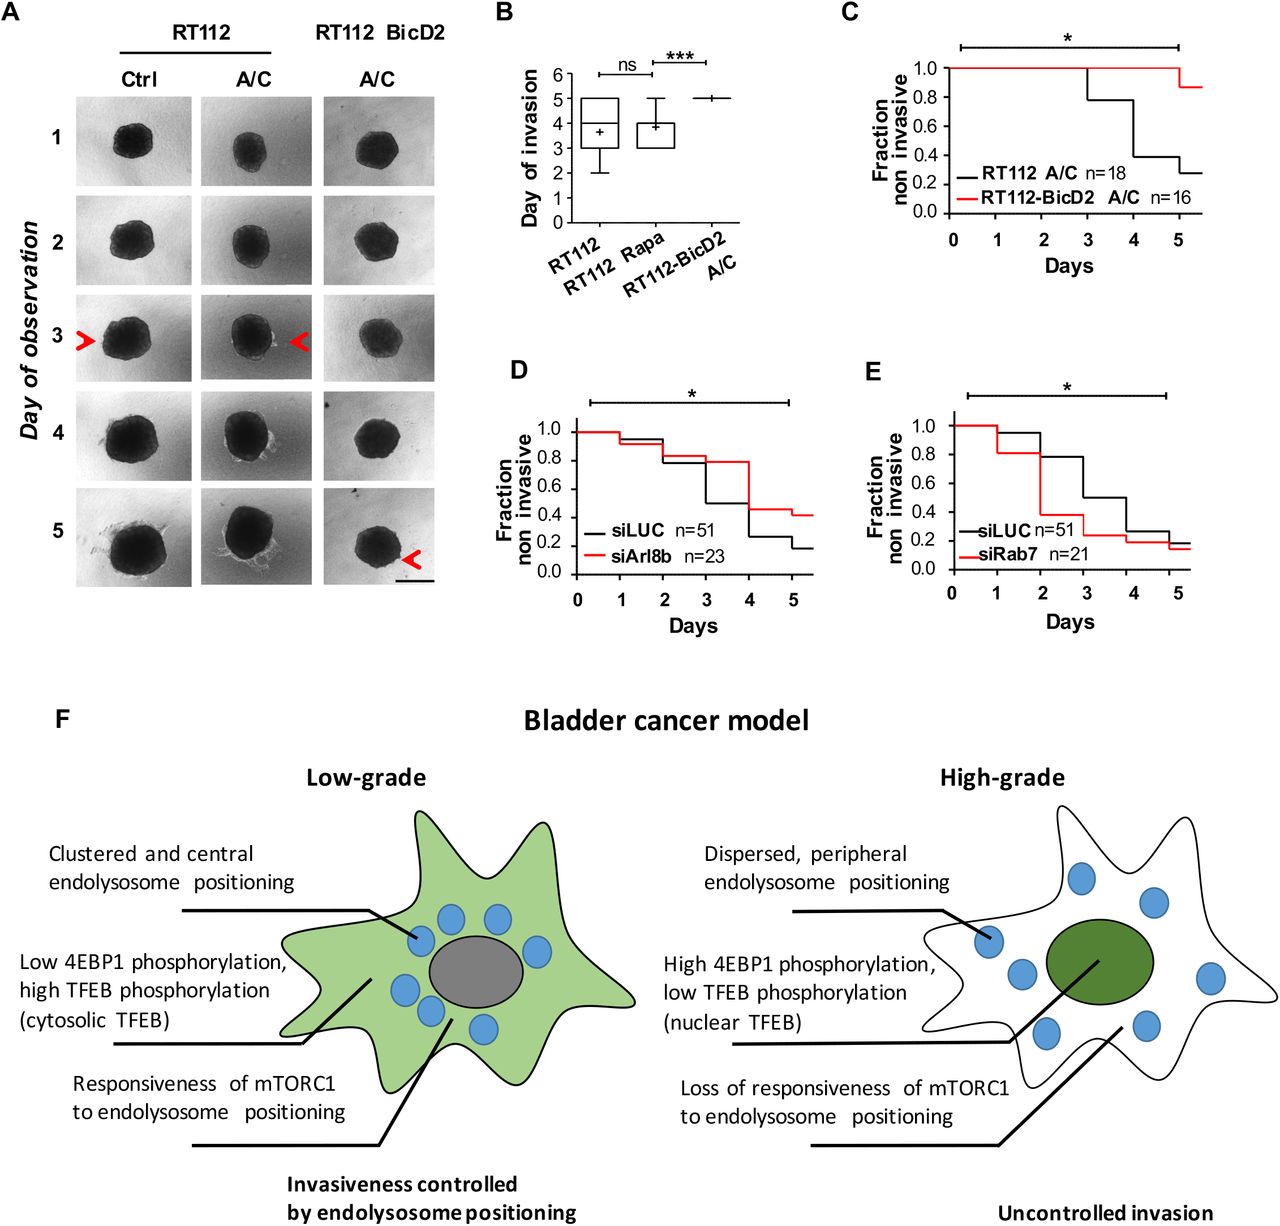
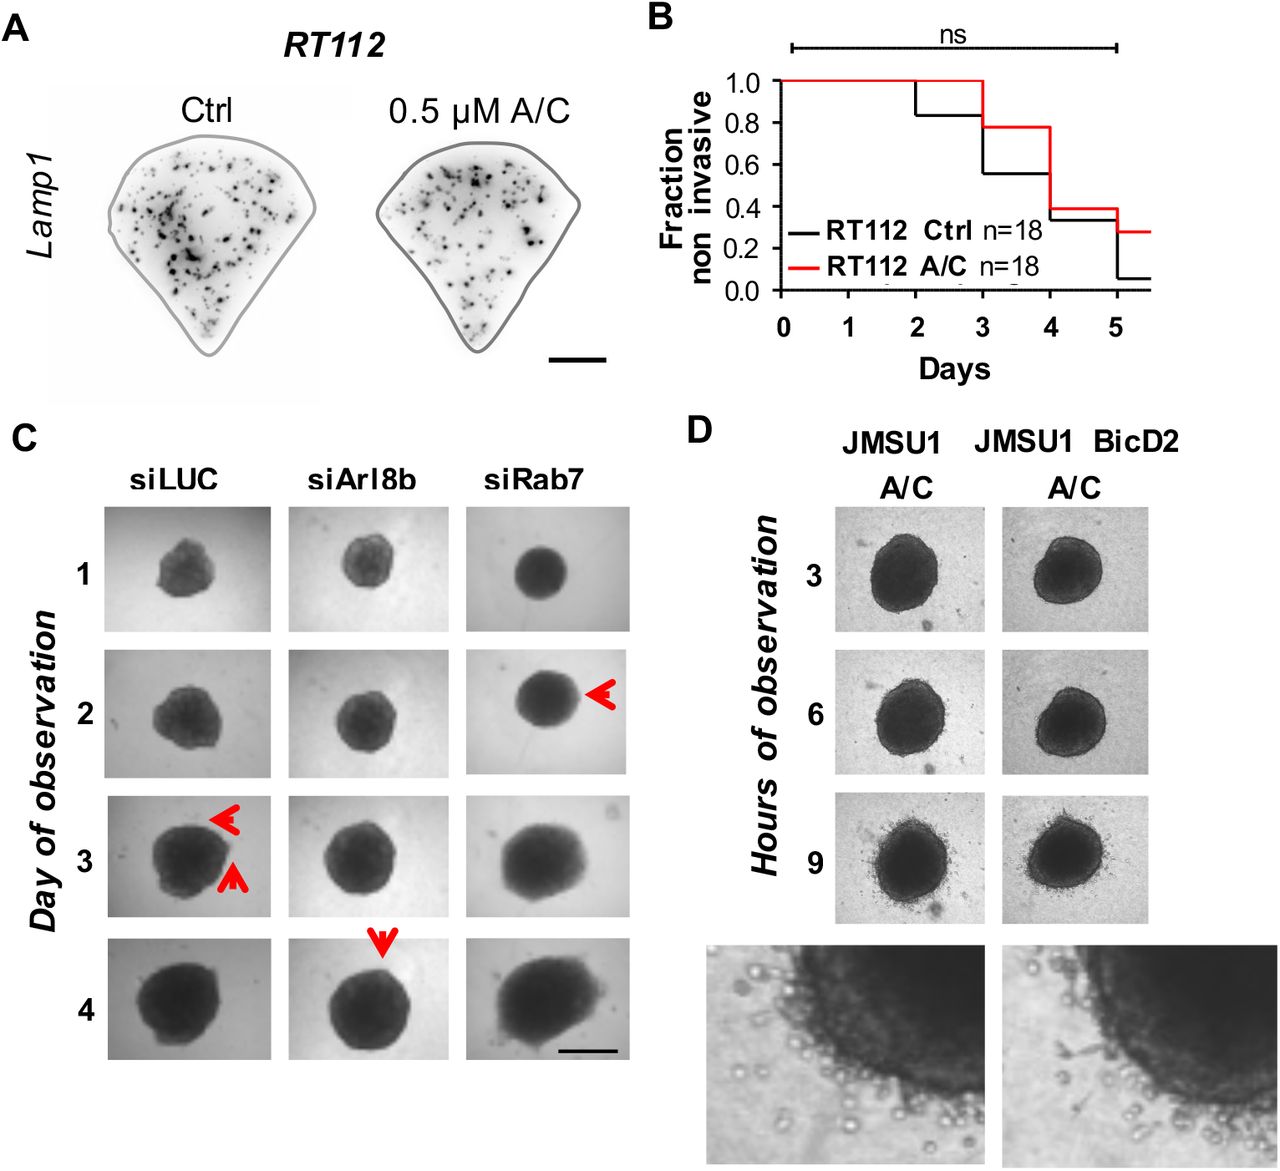
Finally, we investigated whether endolysosomes positioning impacts the invasive capacity of cells. We employed our FKBP/FRB engineered cell lines RT112 and JMSU1 to directly control endolysosome positioning and performed 3D invasion assay based on collagen I matrix invasion from cell spheroids. Invasion from RT112 spheroids occurred via collective migration of few leader cells that invaded the collagen matrix on average on day 3 (Supplementary Figure 1E), thus spheroids from RT112 cells were observed for 5 consecutive days (Figure 4A). A/C heterodimerizer treatment in control did not affect endolysosome positioning, and FKBP/FRB engineered cells showed comparable invasion behavior as control cells treated or not with A/C heterodimerizer (Supplementary Figure 4A, B). Strikingly, we found that A/C heterodimerizer-induced endolysosome clustering significantly reduced invasion from spheroids in RT112 cells, increasing the time of invasion to five days and the fraction of non-invasive spheroids from 20% to almost 90% (Figure 4B, C). We did not observe alteration in spheroid growth, indicating that under this condition cell proliferation was not affected. To confirm that endolysosome positioning can impact on invasion we additionally targeted several cellular regulators that regulate endolysosome positioning. When targeting Arl8b to displace endolysosomes towards the cell center in RT112 cells, we again observed a significant decrease in spheroid invasion (Figure 4D and Supplementary Figure 4C). Contrary, when we displaced endolysosomes towards the cell periphery by silencing Rab7, invasion was significantly earlier than in control cells (Figure 4E and Supplementary Figure 4C).

A. Representative images of endolysosomes visualized by immunofluorescence staining against the lysosomal-associated membrane protein 1 (LAMP-1, CD107a) in RT112 single cells cultured on crossbow-shaped adhesive micropatterns in control condition (DMSO) and in the presence of A/C heterodimerizer (A/C). B. Invasion rate of RT112 spheroids in the absence (black, n=18) and presence (red, n=16) of A/C heterodimerizer as a function of the time (observed at the interval of 1d). n.s. in a logrank test. C. 3D invasion of RT112 spheroids into collagen I matrix in control conditions (siLUC) or after siRNA targeting of Arl8b (siArl8b) or Rab7 (siRab7). Red arrows represent invading cells. Scale bar is 0.5 mm. D. 3D invasion of JMSU1 and JMSU1 BicD2 spheroids into collagen I matrix in the presence or absence of A/C heterodimerizer (A/C) observed at 3h interval. Scale bar is 0.5 mm.
A. 3D invasion of RT112 and RT112 BicD2 spheroids into collagen I matrix in the presence or absence of A/C heterodimerizer (A/C). Red arrows represent invading cells. Scale bar is 0.5 mm. B. Average day of invasion of RT112 and RT112 BicD2 spheroids in the presence or absence of A/C heterodimerizer (A/C). *** p < 0.001 in a student t-test. C. Invasion rate of RT112 (black, n=18) and RT112 BicD2 (red, n=16) spheroids in the presence of A/C heterodimerizer as a function of the time (observed at the interval of 1d). * p < 0.05 in a logrank test. D. Invasion rate of RT112 siLUC (black, n=51) and RT112 siArf8b (red, n=23) spheroids as a function of the time (observed at the interval of 1d). * p < 0.05 in a logrank test. E. Invasion rate of RT112 siLUC (black, n=51) and RT112 siRab7 (red, n=21) spheroids as a function of the time (observed at the interval of 1d). * p < 0.05 in a logrank test. F. Schematic representation of endolysosome dysfunction in the bladder cancer model: changes of the endolysosome compartment at different steps of cancer disease reveal intricate spatial and temporal dimensions of tumorigenesis. Endolysosomes are represented as blue circles, TFEB localization is represented by green color either in the cytosol or nucleus.
In striking difference, invasion from JMSU1 spheroids occurred via escape of single cells that invaded the collagen matrix after 3h (Supplementary Figure 1E, 4D). Contrary to RT112 cells, we did not observe any delay in invasion in JMSU1 cells upon A/C heterodimerizer-induced clustering of endolysosomes (Supplementary Figure 1E), indicating that invasion of JMSU1 was independent of endolysosome positioning. Taken together these results indicate that endolysosomes are critical players in cell invasion and that their changes during cancer progression, characterized by changes in their cellular positioning and ability to support signaling, strongly impact cancer cell behavior.
Discussion
Endolysosome dysfunction as a driving progress of cancer has been previously proposed (Perera et al., 2019; Zoncu et al., 2011; Perera et al 2016) and our results confirm that the endolysosomal compartment shows consistent alterations in a collection of bladder cancer cell lines. Surprisingly, we did not find an increase in the average number or volume of endolysosome in the bladder cancer model but rather changes of endolysosomal positioning that were more scattered and peripheral than in NHU cells. A general enlargement of the endolysosomal compartment could have been expected, because excessive endolysosomal activity has been proposed as a recurrent feature in cancer (Perera et al., 2019). Indeed, increased lysosome biogenesis and abundant lysosomes were observed in several cancer models, alveolar soft part sarcoma, pancreatic ductal adenocarcinoma and melanoma that all show hyperactivation of MiT/TFE transcription factors and upregulation of the mTORC1 regulatory small GTPases RagD that expands the endolysosomal compartment (Di Malta et al., 2017; Perera et al., 2019). In agreement with our results, we also did not find up-regulation of Rag genes in the transcriptome data of the bladder cancer cell lines (data not shown). However, changes in endolysosome positioning in bladder cancer cell lines were associated with alterations of the fundamental mTORC1 signaling pathways, shown to be involved in cancer progression (Bar-Peled et al., 2013; Di Malta et al., 2017). First, we found that mTORC1 was active in all cell lines despite of different endolysosome positioning. Yet, whereas low-grade cell lines MGHU3 or non-aggressive RT112 show high mTORC1 phosphorylation activation towards S6K1 and TFEB, high-grade bladder cancer cell lines, KU19-19 and JMSU1, show high mTORC1 activity towards 4EBP1. It should be noted, that the total levels of 4EBP1 were additionally increased in high-grade cells, indicating dysregulation of mTORC1 signaling by substrate competition. Although 4EBP1 and S6K1 both contribute to the regulation of translation, 4EBP1 has the higher affinity towards mTORC1 (Choo and Blenis, 2009). Thus, the preferential phosphorylation of 4EBP1 in high-grade cancer cell lines could allow to simultaneously keep maintenance of the cellular translation machinery and the nuclear translocation of TFEB that both seem to be regulated mutually exclusive by mTORC1 in non-transformed cells (Perera et al 2016). Given the fact that 4EBP1 has been suggested to be a tumor suppressor and its overexpression was shown to be associated with an unfavorable prognosis in a recent meta-analysis (Zhang et al., 2017), including bladder cancer, our results suggest that shifting substrates could be a strategy to fuel the overgrowth of bladder cancers. In the future, it will be important to further investigate whether this mechanism could be a driving progress in bladder cancer and potentially other cancer models.
Second, we found that mTORC1 signaling is specifically decoupled from endolysosome positioning in high-grade bladder cancer cell lines. Through a sophisticated machinery that dynamically assembles mTORC1 on the surface of endolysosomes, signals from nutrients in the cytoplasm, inside endolysomes as well as outputs downstream of growth factor signaling are integrated (Thelen and Zoncu, 2017). Notably, this machinery is coordinated with endolysosome positioning, as nutrient status or growth factors simultaneously change endolysosome positioning (Ballabio and Bonifacino, 2020; Thelen and Zoncu, 2017). An emerging picture is that dynamic endolysosome positioning helps to integrate the many upstream signals for mTORC1 via spatial compartmentalization, although the exact relation between endolysosome positioning and mTORC1 signaling remains controversial (Walton et al., 2019): whereas mTORC1 was shown to signal from peripheral endolysosomes in some studies (Korolchuk et al., 2011), others suggest the presence of active mTORC1 on central endolysosomes (Walton et al., 2019). Although mTORC1 signaling was present in low-grade cell lines with moderate central endolysosome positioning, we found that central clustering of endolysosomes via enforced recruitment of minus-end motor proteins leads to loss of mTORC1 and attenuation of downstream signaling in non-aggressive bladder cancer cell lines. Indeed, mTORC1 dissociation from endolysosomes in nutrient deficient or starvation conditions often correlates with displacement of endolysosomes to the cell center (Korolchuk et al., 2011; Perera and Zoncu, 2016). Interestingly, we did not observe a loss of mTORC1 from clustered endolysosomes in high-grade cancer cell lines, indicating that mTORC1 responses are uncoupled from endolysosome positioning. As nutrient status and endolysosome positioning are tightly linked, the loss of the spatial compartmentalization of mTORC1 signaling may help cancer cells to evade metabolic checks on anabolism and proliferation. Future studies will address by which mechanisms mTORC1 is retained on central endolysosomes in high-grade bladder cancer cells.
Finally, we found that endolysosomes are important for invasion of bladder cancer cells in the 3D spheroid model. Interestingly, invasion of non-aggressive cell line RT112, which shows intermediate upregulation of 4EBP1 (compared to low-grade MGHU3 cells) and responsiveness of mTORC1 signaling to endolysosome positioning, was controlled by placement of endolysosomes. Whereas central positioning led to decreased invasiveness, peripheral positioning had the opposite effect. Invasion was observed from isolated loci after several days and showed phenotypes typical for collective cell migration. Contrary, high-grade cancer cell line JMSU1, which shows a high expression of 4EBP1 and no responsiveness of mTORC1 signaling to endolysosome positioning, invaded rapidly (after 3h) by single cell escape and invasiveness was not regulated by endolysosome positioning. Our study proposes that monitoring detailed changes of the endolysosome compartment could reveal intricate spatial and temporal dimensions of tumorigenesis (Figure 4F). Besides the alterations in mTORC1 signaling that we observed in bladder cancer cells, important for cellular homeostasis and nutrient balance, endolysosome positioning regulates protease secretion/proteolysis (Castro-Castro et al., 2016; Steffan et al., 2014), migration (Pu et al., 2016) and remodeling of tumor environment through the release of exosomes (Hyenne et al., 2017). Indeed, proteins and mechanisms implicated in endolysosome positioning are often found to be deregulated in the progression of different kind of cancers (Dykes et al., 2016; Steffan et al., 2014). Thus, it is tempting to speculate that altered endolysosomes could link dysregulation of metabolism, signaling or/and trafficking to invasiveness and migration that characterize cancer cell behavior.
One important question to address in the future is why endolysosomes change positioning in high-grade bladder cancer cell lines. It was previously reported that endolysosomes are more peripheral due to acidification of the extracellular tumor microenvironment (Steffan et al., 2014; Walton et al., 2019) that is a common feature of cancer. Interestingly, we found that endolysosome positioning changes are accompanied by a decrease in intracellular pH. As both extracellular and intracellular pH regulate endolysosome displacement (Walton et al., 2019) and are closely coupled to cellular metabolism and its regulation via mTORC1, it will be critical to investigate in detail how metabolic rewiring, common to all cancer cells, is interconnected with pH homeostasis and endolysosome positioning.
In conclusion our study revealed characteristic changes in endolysosome positioning that were associated with unexpected outcomes of mTORC1 signaling in a collection of bladder cancer cell lines. Particularly, we revealed that mTORC1 substrate specificity is altered, and responsiveness to endolysosome positioning is lost in high-grade bladder cancer cell lines as compared to low-grade cancerous cells. Importantly, our results suggest that endolysosome positioning is critical for cell invasion from 3D spheroids. Our study proposes that monitoring detailed changes of the endolysosome compartment at different steps of cancer disease could reveal intricate spatial and temporal dimensions of tumorigenesis. Targeting lysosomal function is emerging as a promising avenue in several malignancies (Hämälistö and Jäättelä, 2016) and a full understanding of the basic biological processes underlying transitions during cancer progression will be critical to improve cancer detection, prevention, and the rational design of more effective and less toxic therapeutic strategies.
Methods
Cell culture
Bladder cancer cells lines MGHU3, RT112, KU19-19, JMSU1, T24 and TCCSup were grown in RPMI medium (Life Technologies, Carlsbad, CA, USA), supplemented with 10% Fetal Bovine Serum (FBS; Eurobio, Courtaboeuf, France). RT112 and JMSU1 cells stably expressing Lamp1-mCherry-FKBP and BicD2-HA-FRB were obtained via viral transduction. For A/C heterodimerizer induced endolysosome clustering in cells stably expressing the FKBP-FRB system, 0.5 μM of A/C heterodimerizer (635056; Takara) was added in complete media for 1 hour at 37 °C. Normal human urothelium (NHU) cells were from Jennifer Southgate (University of York, UK). NHU were grown in KSFMC medium according to (Southgate et al., 1994, 2002). For experiments with inhibitors, the day after cell seeding, respective drugs were added for 2 hours at 37°C. The concentration of inhibitors used were as follows: Rapamycin (20μM), Wortmannin (1μM), Torin (1μM). For starvation experiment, the day after cell seeding, the media was removed and cells were washed once with EBSS (Earle’s Balanced Salt Solution) and incubated in EBSS for 4hours before lysate preparation.
Cell transfection
For gene depletion studies, 200 000 cells were transfected in 6 well plate with 25 pmol.mL−1 siRNA (siLuc: 5’-CGTACGCGGAATACTTCGA-3’; siRab7: 5’-CACGTAGGCCTTCAACACAAT-3’ and 5’-CTGCTGCGTTCTGGTATTTGA-3’;siArl8b: 5’-GAUAGAAGCUUCCCGAAAU-3’; Sigma-Aldrich) using Lipofectamine RNAiMAX Transfection Reagent (5 μL.mL−1; Life Technologies). Cells were incubated 72 h prior to further manipulations. Efficiency of siRNA gene silencing was verified by Western Blot on cell lysate after three days of transfection. In invasion assays, the siRNA was added into the collagen mix. For plasmid transfection, 100 000 cells were transfected in a 12 well plate on sterilized coverslips (12mm) using Lipofectamine LTX with Plus reagent (Invitrogen). pEGFP-N1-TFEB plasmid was a gift from Shawn Ferguson (Addgene plasmid # 38119; http://n2t.net/addgene:38119; RRID:Addgene_38119n (Roczniak-Ferguson et al., 2012)). Cells were transfected using 1 μg of plasmid for 48 hours before PFA fixation and imaging.
PCA analysis
Micro array data were analyzed with R (3.5.2). The annotation was performed using affy package (1.58.0) with a custom CDF from brain array (huex10st, genome version 23). Normalization was done with RMA algorithm and batch effect corrected with ComBat. The PCA was computed from these normalized and corrected data.
Micropatterned coverslips preparation and cell seeding
Micropattern production was as previously described (Schauer et al., 2010) using photo-lithography methods. Briefly, coverslips were coated with Poly-L-Lysine(20)-grafted[3.5]-Polyethyleneglycol(2) (PLL-g-PEG) from SuSoS (Dübendorf, Switzerland) at a final concentration of 0.1 mg.mL−1 in 10 mM HEPES (pH 7,3) solution. Coverslips were exposed to deep UV during 5 min using a photomask containing arrays of crossbows (37 μm diameter, 7 μm thick). Prior to cell seeding, the patterned surface was incubated for 1h with a mixture of 50 μg/ml fibronectin (Sigma-Aldrich, St. Louis, MO, USA), 5 μg/ml concanavalin A (Sigma-Aldrich, St. Louis, MO, USA) and 1 μg/ml fibrinogen–Cy5 (Invitrogen). Cells were seeded on micropatterns in RPMI medium supplemented with 20 mM HEPES (Life Technologies) for 4 h prior the experiment.
Immunofluorescence, image acquisition and processing
Cells were fixed with 4 % formaldehyde for 15 min at room temperature, washed three times with PBS and permeabilized in PBS/0.2% BSA/0.05% saponin. Cells were then incubated with the primary antibodies (mouse monoclonal antibody against Lamp1/CD107a (555798, BP Pharmingen™), rabbit mAb against mTOR (7C10, #2983, Cell Signaling Technology)) and Alexa Fluor 488- or Cy3- coupled secondary antibodies (Jackson ImmunoResearch) for 1 h. Actin was visualized by FluoProbes 547H (557/572nm) coupled Phalloïdin (Interchim) and nuclei with 0.2 μg.ml−1 4’,6-diamidino-2-phenylindole (DAPI; Sigma-Aldrich). Slices were mounted in Mowiol (Sigma-Aldrich). Images from immunolabelled cells were acquired with an inverted wide field Deltavision Core Microscope (Applied Precision) equipped with highly sensitive cooled interlined charge-coupled device (CCD) camera (CoolSnap Hq2, Photometrics). Z-dimension series were acquired every 0.5 μm. For each experiment, several tens of cells were imaged and aligned using the coordinates of the center and the angle of rotation of the micropattern (determined on ImageJ (Bethesda, MD, USA) as previously described (Schauer et al., 2010). To extract the 3D spatial coordinates of intracellular structures, images were segmented with the multidimensional image analysis (MIA) interface on MetaMorph (Molecular Devices, Sunnyvale, CA, USA) based on wavelet decomposition.
Kernel density estimation
The coordinates of the segmented structures were processed for density estimation programmed in the ks library in R according to (Schauer et al., 2010). For visualizing kernel density estimates, we used probability contours and the extension libraries mvtnorm, rgl, and miscd.
Invasion assay
Cells were trypsinized and 104 cells/ml were re-suspended in RPMI medium containing 10% FBS and 1% Penicillin-Streptomycin (Life Technologies). Then 100 μl of cell suspension was plated in 48-well plates coated with 1% agarose (Life Technologies) and incubated for 3 days. In each well, a spheroid was formed from 103 cells. Next, the spheroids were plated on Lab-Tek chambers (Sigma), in a mixture of collagen I from rat tail (Corning) at a final concentration of 2 mg.ml−1, PBS, sodium hydroxide (NaOH) and serum-free medium. For siRNA experiments, the medium was replaced with the transfection mixture (Opti-MEM medium from Life Technologies, Lipofectamin RNAiMAX and siRNA). For inducible cargo trafficking assays, 0.5 μM of A/C heterodimerizer (635056, Takara) was added to the collagen mixture and the culture medium. The spheroids were monitored for 5 consecutive days by using an inverted Leica microscope (Wetzlar, Alemanha) equipped with camera device using 4x objective.
Cytoplasmic pH testing
Cells (200,000) were seeded in 35mm Fluorodishes and stained with pHRodo Green (Invitrogen) according to the manufacturer’s protocol along with 50nM LysoTracker Deep Red (Invitrogen) and incubated at 37°C for 1 hour. Cells were washed with complete RPMI media and imaged live using an inverted wide field Deltavision Core Microscope. For calculating the RFU (Relative Fluorescence Unit) of cytoplasmic pH, 25,000 cells were seeded in black bottom 96 well cell culture plates and stained with pHRodo Green as before for 1 hour at 37°C. Cells were then washed with complete RMPI 1640 media and readings were taken using CLARIOstar plate reader (BMG LABTECH) using excitation/emission of 509/533.
Western Blot
Cells were seeded in a 12 well plate (250,000) one day prior to the experiment. To prepare lysates, cells were lysed in loading buffer (β-Mercaptoethanol (6%), Bromophenol blue (0.02%) Glycerol (30%), SDS (Sodium dodecyl sulfate) (10%), Tris-Cl (250 mM, pH 6.8), and 1X Protease Inhibitor Cocktail) on ice, boiled at 95°C for 5 min and stored at −20 °C before further use. On the day of western blot, lysates were thawed and passed through a syringe to shred genomic DNA. Equal volume of lysates from each cell line was loaded on a 10% or 12% polyacrylamide gel. Proteins were then resolved by SDS-PAGE. Proteins were transferred to nitrocellulose membranes which was then blocked with 5% BSA in TBST (for phospho-antibodies) or 5% milk in TBST (for all other antibodies). Membranes were incubated with respective primary antibodies at 4°C overnight with constant shaking. Concentration of the primary antibody used were as follows: Phospho P-70 (Thr389)-S6K (CST: 9205S, 1:1000 in 5% BSA in TBST), P-70 S6K (CST: 9202S, 1:1000 in 5% milk in TBST), Phospho(Ser65)-4EBP1 (CST: 9451, 1:1000 in 5% BSA in TBST), 4EBP1(CST: 9452, 1:1000 in 5% milk in TBST), GAPDH (Sigma: G9545, 1:10,000 in 5% milk in TBST). The next day, blots were washed with TBST (3×5 min) and incubated with respective species specific HRP secondary antibodies (concentration of 1:10,000 was used for all secondary antibodies) for 1hour at room temperature. Blots were washed again as before with TBST and developed using ECL western blotting substrate.
Statistical analysis
The statistical analysis of endolysosome volume, number and normalized NND was performed with R (3.6.0). For NND analysis, the centroids distance between structures was calculated from a constant number of endolysosomes that was randomly sampled from each cell. The statistical analysis was based on the Kruskal-Wallis test with Dunn post-hoc test with Sidak correction for multiple comparisons correction.
For all experiment, a large number of cells were monitored from 3 to 6 independent experiments. Two-sided Student t-tests were performed on averages to access the significance of difference. To compare the fraction of non-invasive spheroids a logrank (Matel-Cox) test was performed in Prism software. Additionally, to compare the global distribution of cell population, χ2 tests were performed (R function “chi-square()”). In this case, results from independent experiments were individually compared and combined for representation and statistical analysis.
Acknowledgements
We greatly acknowledge Lucas Kapitein (Utrecht University, The Netherlands) for FRBP/FRB system, Danijela Vignjevic (Institut Curie, France) and her team for help with invasion assays. We thank Jannifer Southgate (University of York, UK) for her gift of NHU cell extracts and Clémentine Krucker (Institut Curie) and Yann Neuzillet (Foch Hospital, France) for deriving these cells. We thank Elodie Chapeaublanc for help on the bioinformatics analysis. The authors greatly acknowledge the Cell and Tissue Imaging Facility (PICT-IBiSA @Burg and @Pasteur) and the Nikon Imaging Center at Institut Curie (Paris) that are member of the French National Research Infrastructure France-BioImaging (ANR10-INBS-04). This project was supported by grants from the European Union’s Horizon 2020 research and innovation programme under the Marie Skłodowska-Curie grant agreement No 666003 to PM; Capes/ Ciência sem Fronteiras/ Process (9121137) to CDBS; Grants from Fondation ARC pour la recherche sur le cancer to KS and HL, Institut Curie SIRIC grant to KS, Agence Nationale de la Recherche (#2010 BLAN 122902), the ITMO Nanotumor grant to KS, the Centre National de la Recherche Scientifique and Institut Curie. The Goud team is member of Labex CelTisPhyBio (11-LBX-0038) and Idex Paris Sciences et Lettres (ANR-10-IDEX-0001-02 PSL). The Molecular Oncology team (FR) is supported by La Ligue Contre le Cancer (Equipe labellisée program). The authors declare no conflict of interest.
Footnotes
The authors declare no potential conflicts of interest.
References


