

Abstract
Several MRI measures have been proposed as in vivo biomarkers of myelin content, each with a concrete application ranging from plasticity to pathology. Despite the broad availability of these myelin-sensitive MRI modalities, specificity and sensitivity have been a matter of discussion. Debate about which MRI measure is the most suitable one for quantifying myelin is still ongoing.
In this study, we performed a systematic review of published quantitative validation studies, and used meta-analysis tools to clarify how different these measures are when compared to the underlying histology, controlling for the study sample size and using interactive visualization tools (https://neurolibre.github.io/myelin-meta-analysis). A first qualitative selection of 58 studies proposed 35 different measures to characterize myelin content. However, a quantitative analysis showed that most of these measures have a limited coefficient of determination and provide little information to inform future studies, because of the large prediction intervals and high heterogeneity. These results indicate that most measures are statistically equivalent regarding their relationship with histology and that future work should take inter-study variability into consideration.
Introduction
Myelin is a key component of the central nervous system. The myelin sheaths insulate axons with a triple effect: allowing fast electrical conduction, protecting the axon, and providing trophic support (Nave & Werner, 2014). The conduction velocity regulation has become an important research topic, with evidence of activity-dependent myelination as an additional mechanism of plasticity (Sampaio-Baptista & Johansen-Berg, 2017). Myelin is also relevant from a clinical perspective, given that demyelination is often observed in several neurological diseases such as multiple sclerosis (Y. Wang et al., 2015).
Given this important role in pathology and plasticity, measuring myelin in vivo has been an ambitious goal for magnetic resonance imaging (MRI) for almost two decades (Petiet et al., 2019). Even though the thickness of the myelin sheath is in the order of micrometres, well beyond the MRI spatial resolution, its presence influences several physical properties that can be probed with MRI, from longitudinal and transversal relaxation phenomena to water molecule diffusion processes.
However, being sensitive to myelin is not enough: to study how and why myelin content changes, it is necessary to define a specific biomarker. Interestingly, the quest for measuring myelin has evolved in parallel with an important paradigm shift in MRI research, where MRI data are no longer treated as just “pictures”, but as actual 3D distributions of quantitative measures. This perspective has led to a new field of research, quantitative MRI (qMRI), that encompasses the study of how to measure the relevant electromagnetic properties that influence magnetic resonance phenomena in biological tissues (Cercignani, Dowell, & Tofts, 2018; Cohen-Adad & Wheeler-Kingshott, 2014). From the very definition of qMRI, it is clear that its framework applies to any approach for non-invasive myelin quantification.
Similarly to other qMRI biomarkers, MRI-based myelin measurements are indirect, and might be affected by other microstructural features, making the relationship between these indices and myelination noisy. Assessing the accuracy of such measurements, and their sensitivity to change, is essential for their translation into clinical applications. Validation is therefore a fundamental aspect of their development (Cohen-Adad, 2018). The most common approach is based on acquiring MR data from in vivo or ex vivo tissue and then comparing those data with the related samples analysed using histological techniques. Despite being the most realistic approach, this comparison involves several methodological choices, from the specific technique used as a reference to the quantitative measure used to describe the relationship between MRI and histology. So far, a long list of studies have looked at MRI-histology comparisons (Cohen-Adad, 2018; Laule & Moore, 2018; MacKay & Laule, 2016; Petiet et al., 2019), each of them focusing on a specific pathology and a few MRI measures. Despite these numerous studies, there is still an ongoing debate on what MRI measure should be used to quantify myelin and as a consequence there is a constant methodological effort to propose new measures. This debate would benefit from a quantitative analysis of all the findings published so far, specifically addressing inter-study variations and prospects for future studies, something that is currently missing from the literature.
In this study, we systematically reviewed quantitative MRI-histology comparisons and we used meta-analysis tools to address the following question: how different are the modalities for myelin quantification in terms of their relationship with the underlying histology?
Results
Literature survey
The screening process is summarized in the flowcharts in Figure 1 and Figure A1. The keywords as reported in the appendix returned 688 results on PubMed (last search on 03/06/2020). These results included 50 review articles. From the 50 review articles, six were selected as relevant for both the topics of myelin and related MRI-histology comparisons (Cohen-Adad, 2018; Laule & Moore, 2018; Laule et al., 2007; MacKay & Laule, 2016; Petiet et al., 2019; Turner, 2019). After the assessment, 58 original research studies were considered eligible, as shown in Table A1 (in the appendix) and Figure S2. All the data collected are available in the supplementary materials.

Sankey diagram representing the screening procedure (PRISMA flow chart provided in the appendix). To see the interactive figure: https://neurolibre.github.io/myelin-meta-analysis/01/selection.html#Figure-1
In terms of specific modalities, the survey shows that the most common MRI approach compared with histology was diffusion-weighted imaging (used in 28 studies), followed by magnetization transfer (MT, 27 studies), T2 relaxometry (19 studies) and T1 relaxometry (10 studies). Only 20 studies considered more than one approach: among the others, 20 focused exclusively on diffusion, 12 on MT, and 6 on T2 relaxometry.
From these 58 studies, we then focused only on brain studies and we further excluded studies not reporting either the number of subjects or the number of ROIs per subject. We also excluded one single-subject study that relied on voxels as distinct samples, whereas the other studies in this review are based on ROIs (i.e. including more than one voxel). In the end, 43 suitable studies were identified for the subsequent analyses.
Meta-analysis
To compare the studies of interest, we first organized them according to the terms of MRI measure used. Figure 2 and Figure 3 (and also Figure S3-S4) show the R2 values for the selected studies across measures: the highest values (R2>0.8) are obtained mostly from MT measures, but they are associated with small sample sizes (with an average of 32 sample points). The studies with largest sample sizes are associated with R2 values between 0.6 and 0.8 for MT and T2 relaxometry, but with lower values for T1 relaxometry and other approaches.

Bubble chart of R2 values between a given MRI measure and histology for each study across MRI measures, with the area proportional to the number of samples. To see the interactive figure: https://neurolibre.github.io/myelin-meta-analysis/02/closer_look.html#Figure-3
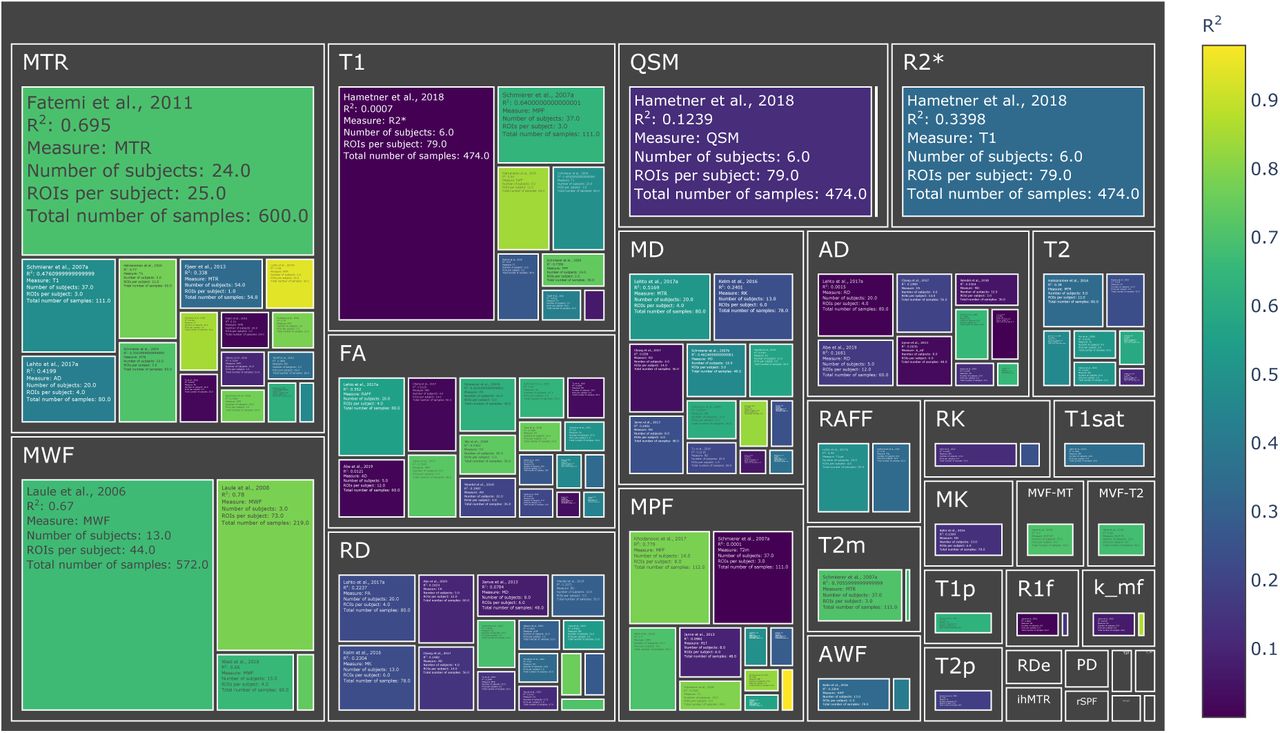
Treemap chart of the studies considered for the meta-analysis, organized by MRI measure. The color of each box represents the reported R2 value while the size box is proportional to the sample size. To see the interactive figure: https://neurolibre.github.io/myelin-meta-analysis/02/closer_look.html#Figure-4
To combine the results for each measure, we then used a mixed-effect model: in this way we were able to express the overall effect size in terms of a range of R2 values within a confidence interval, but also to assess prediction intervals and inter-study differences. The results are shown in Figure 4 (and also Figure S5).

Forest plots showing the R2 values reported by the studies and estimated from the mixed-effect model for each measure. The hourglasses and the dotted lines in the mixed-effect model outcomes represent the prediction intervals. To see the interactive figure: https://neurolibre.github.io/myelin-meta-analysis/03/meta_analysis.html#Figure-5
Apart from MPF and MWF, all the measures showed R2 overall estimates in the range 0.21-0.53. When considering the prediction intervals, for most measures the interval spanned from 0.1 to 0.9. This implies that future studies relying on such measures can expect, on the basis of these studies, to obtain any value in this broad interval. The only exceptions were MPF (0.49-1) and MWF (0.45-0.95), whose intervals were narrower than the alternatives. Finally, I2 (a measure of how much of the variability in a typical study is due to heterogeneity in the experimental design) was generally quite high (Table 1). MWF showed the lowest I2 across measures, but considering that it was based on only 4 studies while the other measures included around 10 studies, it was relatively high. Excluding MWF, MPF also showed a relatively low I2. Qualitative comparisons across experimental conditions and methodological choices highlighted differences across pathology models, targeted tissue types and reference techniques (Figure 5 and Figure S6). Other factors such as magnetic field, co-registration, specific tissue and the related conditions (Figure S7) showed comparable distributions.
Results from the mixed-effect models: for each measure we reported the number of studies, the estimate and standard error of the overall R2 distribution, the tau2 and the I2.

Experimental conditions and methodological choices influencing the R2 values (top: reference techniques; middle: pathology model; bottom: tissue types). To see the interactive figure: https://neurolibre.github.io/myelin-meta-analysis/03/meta_analysis.html#Figure-6
Discussion
Indirect measures are the most popular (for better or worse)
The literature survey offers an interesting perspective on popular research trends (Figure S2). The first consideration one can make is that the most common families of approaches, DWI and MT, both provide indirect measures of myelin. The MT effect is driven by saturation pulses interacting with myelin macromolecules that transfer their magnetization to water, whereas in diffusion experiments myelin is just not part of the picture. Diffusion acquisitions are blind to direct myelin measurement (Campbell et al., 2018) because the TEs used are too long (∼100ms) to be influenced by the actual macromolecules (with T2 of ∼10us) or even the water molecules trapped in the myelin sheath (with T2 of ∼30ms). To infer myelin content, one needs to rely on the interaction between intra-cellular and extra-cellular water compartments. The majority of diffusion studies included in this analysis used tensor-based measures (with fractional anisotropy being the most common), but some also used kurtosis-based analysis. The main issue with this approach is that other factors affect those measures, making it difficult to specifically relate changes in the water compartments to changes in myelin.
Despite this issue, the use of diffusion as a proxy for myelin is quite widespread, specifically outside the field of quantitative MRI. This is probably a consequence of how popular DWI has become and how widely available are the related acquisition sequences. MT, the second most popular technique for quantifying myelin, estimates myelin by acquiring data with and without saturating the macromolecular proton pool. The simplest MT measure, MT ratio (MTR), incorporates non-myelin contributions in the final measurement. Recent acquisition variations include computing MTR from acquisitions with ultra-short echo times (Guglielmetti et al., 2020) or relying on inhomogeneous MT (Duhamel et al., 2019). More complex experiments, e.g. quantitative MT, are based on fitting two compartments to the data, the free water and the macromolecular compartments, or pools. In this way, one is able to assess myelin through MPF with higher specificity, although still potentially including contributions from other macromolecules. Additional measures have also been considered (including the T2 of each pool, the exchange rate between the pools). The drawback of qMT is the requirement for a longer and more complex acquisition. Recently there have been alternative techniques to estimate only MPF, resulting in faster acquisitions with similar results (M. Khodanovich et al., 2019; M. Y. Khodanovich et al., 2017). Following diffusion and MT, the most popular approach is T2 relaxometry. Unlike diffusion and MT, in T2 relaxometry experiments one can directly observe the contribution from the water trapped between the myelin bilayers, and can therefore estimate the myelin water fraction. A simpler but less specific approach consists in estimating the transverse relaxation time considering the decay to be mono-exponential. The main drawback of these approaches is that they require longer acquisitions.
Finally, other studies used a diverse collection of other measures, including T1 relaxometry, apparent transversal relaxation rate (R2*), proton density (PD), macromolecular tissue volume (MTV), relaxation along a fictitious field (RAFF), and quantitative susceptibility mapping (QSM).
After this general overview, it is clear that each modality could be a suitable candidate for a quantitative myelin biomarker. To then make a choice informed by the studies here reported, it becomes necessary to consider not only effect sizes in terms of correlation, but also sample sizes and acquisition times.
There is no myelin MRI measure true to histology
When looking at the R2 values across the different measures, the first detail that catches one’s eye is how most measures present a broad range of values (Figure 2 and Figure 3). When taking into account the sample size, the largest studies show higher correlations for MT and T2 relaxometry studies than any other approach (Figure S3 and Figure S4). In quantitative terms, the meta-analysis corroborates this idea, showing that MPF and MWF tend to be more specific to myelin compared to the other measures (respectively with R2=0.7657 and R2=0.6997), in line with the underlying theory. Notably, diffusion-based measures show the lowest overall estimates (with values between R2=0.3766 for FA and R2=0.2095 for AD): this could be due to the fact, as already mentioned, that DWI does not specifically measure myelin properties, and despite FA and RD being influenced by the myelin content, they are also influenced by other factors that make them unsuitable as measures of myelin.
Despite these considerations on the advantages of MPF and MWF, one should refrain from concluding that they are the “true” MRI measures of myelin. The reason for this caution is given not by the overall effect sizes observed here, but by the collateral outcomes of the meta-analysis. The first one is given by the prediction intervals: most measures showed quite a large interval (Figure 4), not supporting the idea of them being robust biomarkers. MPF and MWF seem to be again the most suitable choices for future studies, but a range between 0.5 and 1 is still quite large.
The second important aspect to consider is given by the differences across studies: the meta-analysis showed how such differences strongly limit inter-study comparisons for a given measure (Figure 5). This result should be expected, given that the studies here examined are inevitably influenced by the specific experimental constraints and methodological choices. A clear example of this aspect is the validation modality used as a reference, which will be dictated by the equipment availability and cost. However, such a choice has an impact on the actual comparison: histology and immunochemistry, despite being specific to myelin, do not offer a volumetric measure of myelin, but rather a proxy based on the transmittance of the histological sections. So far, the only modality able to give a volumetric measure would be electron microscopy, which is an expensive and resource-consuming approach. Also, electron microscopy has several limitations, including tissue shrinkage, degradation of the myelin sheath structure due to imperfect fixation, imperfect penetration of the osmium stain, polishing, keeping focus over large imaging regions. All these effects participate in the lack of precision and accuracy when quantifying myelin content with EM-based histology (Cohen-Adad, 2018). Another important observation is that none of the studies here reviewed considered histology reproducibility, which is hard to quantify as a whole given that a sample can be processed only once: collateral factors affecting tissue processing (e.g. sectioning distortions, mounting and staining issues) constitute an actual limitation for histology-based validation.
In addition to differences in experimental and methodological designs, there are also several considerations that arise out of the lack of shared practices in MRI validation studies. The first evident one is the use of correlations: despite being a simple measure that serves well the purpose of roughly characterizing a relationship, Pearson correlation is not the right tool for quantitative biomarkers, as it does not characterize the actual relationship between histology and MRI. Linear regression is a step forward but has the disadvantage of assuming a linear relationship. Despite Pearson correlation and linear regression being the most common measures used in the studies here reviewed, it is still not clear if the relationship is actually linear. Only one study among the considered ones computed both Pearson and Spearman correlation values (Tardif, Bedell, Eskildsen, Collins, & Pike, 2012), and reported higher Spearman correlations, pointing out that non-linear relationships should actually be considered. One last consideration regarding the use of correlation measures for validating quantitative biomarkers is about the intercept in the MRI-histology relationship. Notably, only MWF is expected to assume a value equal to zero when myelin is absent (West et al., 2018). For the other measures, it would be necessary to estimate the intercept, which leads to the calibration problem in the estimate of myelin volume fraction. Notably, calculating Pearson correlation does not provide any information for such calibration.
Another arbitrary practice that would benefit from some harmonization is the choice of ROIs. The studies reported here examined a diverse list of ROIs, in most cases hand-drawn on each modality, encompassing different types of tissue, and the most common approach is to report a single, pooled correlation. This is problematic, as different types of tissue (e.g. grey matter and white matter) will show different values for MRI-based measures but also for histology-based ones, making linearity assumptions about the two modalities. However, with this approach gross differences between tissues drive the observed correlation, without actually showing if the MRI-based measure under analysis is sensitive to subtle differences and therefore a suitable quantitative biomarker for myelin.
It should be clear at this point that any debate about a universal MRI-based measure of myelin is pointless, at least at the moment, as the overall picture provided by previous studies does not point to any such ideal measure. Nevertheless, is debating about a universal measure helpful for future studies?
Better biomarkers require more reproducibility studies
Rather than debating about a perfect measure, we would argue that what is missing at the moment is a clear picture of what can be achieved with each specific MRI modality. The studies examined here focus on a large set of different measures, and more than half of them considered at most two measures, highlighting how the field is mostly focused on formulating new measures. While it is understood that novel measures can provide new perspectives, it is also fundamentally important to understand the concrete capabilities and limitations of current measures. From this meta-analysis, what the literature clearly lacks is reproducibility studies, specifically answering two main questions: (1) what is the specificity of each measure? We should have a practical validation of our theoretical understanding of the relevant confounds; (2) what is the “parameter sensitivity” of each measure? Here we refer to parameter sensitivity in a broad sense, that includes also experimental conditions and methodological choices. The results here presented show how certain conditions (e.g. pathology) seem to affect the coefficient of determination more than others but given the limited number of studies for each modality, we refrained from additional analyses to avoid speculation. A warning message that is evident from these results is the inherent limitation of DWI for estimating myelin content. If estimating myelin content is relevant in a diffusion study, it is important to consider complementing the diffusion measure with one of the modalities here reviewed; in this way, it would be possible to decouple the influence of myelin content from the many other factors that come into play when considering diffusion phenomena.
Finally, an important factor to take into account when choosing a biomarker of myelin is the actual application. For animal research, long acquisitions are not a major issue. However, when considering biomarkers for potential clinical use, the acquisition time can become a relevant issue. This is particularly problematic for measures such as MWF, that could only be used for a specific slice in a hypothetical clinical scenario. Faster techniques have been proposed for estimating it with gradient- and spin-echo (GRASE) sequences (Faizy et al., 2018). Even in this case, the acquisition time still reaches 15 minutes for acquiring roughly the whole brain with an isotropic resolution of 2mm. Complex MT acquisitions such as qMT suffers from the same problem, although it is possible to use optimized and faster protocols to focus specifically on MPF (M. Khodanovich et al., 2019; M. Y. Khodanovich et al., 2017).
Conclusions
Several MRI measures are sensitive to myelin content and the current literature suggests that most of them are statistically equivalent in terms of relationship with the underlying histology. Measures highly correlated with histology are also the ones with a higher expected specificity. This suggests that future studies should try to better address how specific each measure is, for the sake of clarifying suitable applications.
Methods
Review methodology
The Medline database (https://pubmed.ncbi.nlm.nih.gov) was used to retrieve the articles. The keywords used are specified in the appendix. We followed the PRISMA (Preferred Reporting Items for Systematic Reviews and Meta-Analyses) guidelines for record screening and study selection. The results were first screened to remove unrelated work. Specifically we discarded: work relying only on MRI; work relying only on histology or equivalent approaches; work reporting only qualitative comparisons. After this first screening, the remaining papers were assessed. At this stage, we discarded: studies using MRI-based measures in arbitrary units (e.g. T1-weighted or T2-weighted data); studies using measures of variation in myelin content (defined either as the difference between normal and abnormal myelin content) either for MRI or for histology; studies using arbitrary assessment scales; studies comparing MRI-based absolute measures of myelin with histology-based relative measures (e.g. g-ratio); studies reporting other quantitative measures than correlation or R2 values; studies comparing histology from one dataset and MRI from a different one. As an additional source for potential candidate studies, we screened the review articles in the initial results, and we selected the relevant studies that were not already present in the studies already selected.
From the final papers, we collected first the following details: the DOI; which approach was used (diffusion, MT, T1 relaxometry, T2 relaxometry, or other); which specific MRI measures were compared to histology or equivalent techniques; the magnetic field; the technique used as a reference (histology, immunochemistry, microscopy, electron microscopy); the focus of the study in terms of brain, spinal cord or peripheral nerve; if the subjects were humans or animals, and if the latter which animal; if the tissue under exam was in vivo, in situ or ex vivo, and in the latter case if the tissue was fixed or not; if the tissue was healthy or pathological, and if the latter which pathology; the specific structures examined for correlation purposes; which comparison technique was used (e.g. Pearson correlation, Spearman correlation, linear regression); the number of subjects; the number of ROIs per subject; the male/female ratio; if registration procedures were performed to align MRI and histology; in case of pathological tissue, if control tissue was considered as well; other relevant notes. If before calculating the correlations the data were averaged across subjects, the number of subjects was considered to be one. The same consideration was made for averaging across ROIs. This is because the numbers of subjects and ROIs were used to take into account how many sample points were used when computing the correlation. We set each of those numbers to 1 for all the studies where the data were averaged respectively across subjects and across ROIs. Finally, in those cases where the number of ROIs or the number of subjects were given as a range rather than specific values, we used the most conservative value and added the related details to the notes.
We then proceeded to collect the quantitative results reported for each measure and for each study in the form of R2. Given that different studies may rely on a different strategy when reporting correlations, we adopted the following reasoning to limit discrepancies across studies while still objectively representing each of them. In case of multiple correlation values reported, for our analysis we selected the ones referring to the whole dataset and the entire brain if available, and considering each ROI in a given subject as a sample if possible; if only correlation values for specific ROIs were reported, the one for the most common reported structure would be chosen. In the case of multiple subjects, if data were provided separately for each group, the correlation for the control group was used. When different comparison methods were reported (e.g. both Pearson and Spearman correlation) or if the MRI data was compared with multiple references (e.g. both histology and immunohistochemistry), the correlations used were chosen on the basis of the following priority orders (from the most preferable to the least): for multiple comparison methods, linear regression, Spearman correlation, Pearson correlation; for multiple references, electron microscopy, immunohistochemistry, histology. Finally, in any other case where more than one correlation value was available, the most conservative value was used. Any other additional value was in any case mentioned in the notes of the respective study.
Meta-analysis
For the quantitative analysis, we restricted our focus on brain studies and only on the ones providing an indication of both the number of subjects and the number of ROIs. For each study, we computed the sample size as the product between the number of subjects and the number of ROIs per subject. In this way, we were able to compare the reported R2 values across measures taking into account the related number of points actually used for correlation purposes. We note that correlation or regression analyses run on multiple ROIs and subjects represents a repeated measures analysis, for which the degrees of freedom computation can be complex; however, most papers neglected the repeated measures structure of the data and thus the sample size computation here represents a very approximate and optimistic view of the precision of each R2 value.
Assuming that an underlying Pearson’s correlation r has variance (1-ρ2)2/N, where ρ is the true correlation, we use a first order expansion to approximate the variance of R2 as 4ρ2(1-ρ2)2/N, where we plug in R2 for ρ2. Again, we recognise that some papers computed Spearman correlation, for which this calculation is again optimistic and may underestimate the sampling variability of the squared Spearman correlation.
We then proceeded to fit a mixed-effect model to each measure where more than one study was available. This model takes into account potential differences across studies as random effects and allows us to estimate a prediction interval of effect sizes (in our case, the R2 values) on the basis of the effects and sample sizes of each study. We reported two additional measures from the mixed-effect model, I2 and tau2: the former expresses as a percentage how much of variability in a typical study is due to heterogeneity (i.e. the variation in study outcomes between studies) rather than chance (Higgins & Thompson, 2002), while the latter can be used to calculate the prediction interval (Raudenbush, 2009), which gives the expected range for the measure of interest in future studies. We used forest plots to represent the outcomes, and both the mixed effects estimate of the population estimated R2, with both a 95% confidence and a (larger) 95% prediction interval.
To compare the R2 across measures, we used the Jupyter notebook provided in the supplementary materials. For model fitting and forest plots, we used the Metafor package, version 2.4-0 (Viechtbauer, 2010).
Acknowledgements
MM was funded by the Wellcome Trust through a Sir Henry Wellcome Postdoctoral Fellowship [213722/Z/18/Z].
Appendix
Search keywords
(myelin[Title/Abstract] AND ((magnetic[Title/Abstract] AND resonance[Title/Abstract])
OR mr[Title/Abstract] OR mri[Title/Abstract])) AND (histology[Title/Abstract] OR
histopathology[Title/Abstract] OR microscopy[Title/Abstract] OR
immunohistochemistry[Title/Abstract] OR histological[Title/Abstract] OR
histologically[Title/Abstract] OR histologic[Title/Abstract] OR
histopathological[Title/Abstract] OR histopathologically[Title/Abstract] OR
histopathologic[Title/Abstract])
Results obtained from the Medline database: 688 (03/06/2020)

PRISMA flowchart for the meta-analysis.
Footnotes
Links to interactive figures and PRISMA checklist have been added.
Abbreviations and mathematical symbols
- AD
- axial diffusivity
- AK
- axial kurtosis
- AWF
- axonal water fraction
- FA
- fraction anisotropy
- ihMTR
- inhomogeneous magnetization transfer ratio
- k_fm
- free water-macromolecular exchange rate
- k_mf
- macromolecular-free water exchange rate
- M0m
- macromolecular pool magnetization fraction
- MD
- mean diffusivity
- MK
- mean kurtosis
- MPF
- macromolecular pool fraction
- MT
- magnetization transfer
- MTR
- magnetization transfer ratio
- MTR-UTE
- magnetization transfer ratio (using ultra-short echo time)
- MTV
- macromolecular tissue volume
- MVF-MT
- myelin volume fraction (estimated from MT)
- MVF-T2
- myelin volume fraction (estimated from T2)
- MWF
- myelin water fraction
- PD
- proton density
- PN
- peripheral nerve
- PRISMA
- Preferred Reporting Items for Systematic Reviews and Meta-Analyses
- QSM
- quantitative susceptibility mapping
- R1f
- free water pool longitudinal relaxation rate
- R2*
- apparent transverse relaxation rate
- RAFF
- relaxation along a fictitious field
- RD
- radial diffusivity
- RD-DBSI
- radial diffusivity (from diffusion basis spectrum imaging)
- RDe
- extra-cellular compartment radial diffusivity
- RK
- radial kurtosis
- rSPF
- relative semi-solid proton fraction
- SC
- spinal cord
- T1
- longitudinal relaxation time
- T1p
- adiabatic longitudinal relaxation time
- T1sat
- longitudinal relaxation time under magnetization transfer irradiation
- T2
- transverse relaxation time
- T2f
- free water pool transverse relaxation time
- T2int
- transverse relaxation intermediate component
- T2m
- macromolecular pool transverse relaxation rate
- T2p
- adiabatic transverse relaxation time
References


