

Abstract
In some mammals and many social insects, highly cooperative societies are characterized by reproductive division of labor, in which breeders and nonbreeders become behaviorally and morphologically distinct. While differences in behavior and growth between breeders and nonbreeders have been extensively described, little is known of their molecular underpinnings. Here, we investigate the consequences of breeding for skeletal morphology and gene regulation in highly cooperative Damaraland mole-rats. By experimentally assigning dominant breeding ‘queen’ status versus nonbreeder status to paired littermates, we confirm that queens experience vertebral growth that likely confers advantages to fecundity. However, they also up-regulate bone resorption pathways and show reductions in femoral mass, which predicts increased vulnerability to fracture. Together, our results show that, as in eusocial insects, reproductive division of labor in mole-rats leads to gene regulatory rewiring and extensive morphological plasticity. However, in mole-rats, concentrated reproduction is also accompanied by costs to bone strength.
Introduction
A hallmark of highly cooperative societies is reproductive division of labor. This phenomenon is best understood in eusocial insects, where environmental cues lead to reproductively and morphologically specialized castes, including one or few highly fecund “queens”1. These changes help support the reproductive role of queens by differentiating them from nonbreeding colony members, who forage, care for young, and engage in colony defense1,2. Queens are frequently much larger than their sterile colony mates (e.g., twice as large in honey bees and Pharaoh ants3,4), reflecting dramatically altered growth and development programs that are explained by changes in gene regulation5. Social insects thus exemplify the link between reproductive division of labor, cooperative behavior, and extreme morphological plasticity.
Systems in which breeding is restricted to a single female supported by multiple nonbreeding helpers are also observed in vertebrates, including birds and mammals6. Here, breeding status is not determined during early development, but instead occurs in adulthood, for those individuals who have the opportunity to transition into a reproductive role. In some species, new breeders undergo a period of accelerated growth, which may be important either for maintaining dominance or for supporting high fecundity7–12. While substantial gene regulatory divergence with breeding status has been described for the brain and some peripheral organs13–15, we know little about the gene regulatory shifts responsible for breeder-associated growth patterns. These processes are key to understanding both the basis for, and limits of, status-driven differences in growth and development.
Here, we investigate the morphological and molecular consequences of experimental transitions to breeding status in female Damaraland mole-rats (Fukomys damarensis). Like naked mole-rats, Damaraland mole-rats are frequently classified as ‘eusocial’16–18, and female helpers who transition to queens experience accelerated vertebral growth associated with increases in fecundity9,11. However, no study has yet profiled gene regulation in mole-rat breeders and helpers in skeletal tissue, investigated their consequences for skeletal growth potential and integrity, or determined whether they extend beyond the vertebrae. To do so here, we randomly assigned littermate sisters in captive colonies to become queens or remain as nonbreeders and evaluated gene regulatory and morphological changes induced by the transition to queen status. Our results indicate that queens not only experience lengthening of their lumbar vertebrae, but also show reductions in the growth potential and structural integrity of their long bones. These changes result from increased rates of bone resorption that may increase the risk of fracture, indicating that the presence of helpers does not annul the costs of reproduction to queens. As in eusocial insects, females that acquire breeding status experience substantial morphological remodeling, associated with pathway-specific changes in gene regulation.
Results
Adaptive plasticity in the skeleton of Damaraland mole-rat queens
We randomly assigned female Damaraland mole-rats (16 sets of littermates; mean age = 19.0 ± 3.8 s.d. months at assignment; Supplementary Table 1) to either transition to queen status in a newly founded colony (n = 12) or remain as nonbreeders for the duration of the experiment (n = 18) (Figure 1A). Nonbreeders were either kept in their natal colonies as helpers or placed into solitary housing, which recapitulates extended periods of dispersal in this species18 (n = 10 helpers and n = 8 solitaires). Six non-experimental animals (1 queen and 5 nonbreeders) were also included in the sample, resulting in a total sample size of 13 breeders and 23 nonbreeders (Supplementary Table 1).

(a) Experimental design: nonbreeding adult female  littermates were randomly assigned to transition to queen status (purple
  ) by being paired with an unrelated male (♂), or to remain in a nonbreeding treatment (cyan). Duration of treatment ranged from 12 – 22 months. (b) Queens show more rapid growth in lumbar vertebra 5 (LV5) in the first four months of the experiment, relative to nonbreeders (treatment by time point interaction: β = 0.078, n = 49, p = 3.47 × 10⁻³). Dots show means +/- standard errors (bars). (c) At the start of the experiment (0 months, left panel), the lumbar vertebrae of breeders do not differ from those of nonbreeders (unpaired t-tests, all p > 0.05). However, at 12 months (right panel), queens have longer lumbar vertebrae relative to nonbreeders (unpaired t-tests, * indicates p < 0.05). Dots show means +/- standard errors (bars). Lengths of lumbar vertebrae above the plots are scaled to indicate the mean lengths of queens (top) and nonbreeders (bottom) at each time point; vertebrae highlighted in purple are significantly longer in queens relative to nonbreeders. (d) Litter size is positively correlated with maternal body length in the Damaraland mole-rat colony (β = 0.353, n = 328 litters, p = 1.35 × 10⁻³).
Females assigned to the queen treatment were each transferred to a new tunnel system containing only an unrelated adult male, simulating the natural process of dispersal and new colony formation in the wild18. Pairing with an unrelated male leads to rapid activation of the reproductive axis, including initiation of ovulation, sexual activity, and the potential for conception19,20. At the start of experimental treatment, animals assigned to the queen treatment and to the nonbreeding treatment did not significantly differ in body mass (unpaired t-test, t = 0.894, df = 16.828, p = 0.384; means = 116.3 and 110.9 grams), age (unpaired t-test, t = 0.746, df = 22.137, p = 0.466; means = 628 and 580 days), or vertebral length (as measured by lumbar vertebra 5 [LV5] following11; unpaired t-test, t = −1.053, df = 20.131, p = 0.305; means = 5.0 and 5.13 mm). Queens gave birth to a mean of 6.92 ± 5.57 s.d. live offspring during the 12 – 22 month follow up period, produced in a mean of 2.85 ± 1.75 s.d. litters (Supplementary Table 1).
As previously described11, queens showed rapid growth in the lumbar vertebrae in the first 12 months post-pairing, relative to nonbreeders (Figure 1B). In contrast to naked mole-rats, where the lumbar vertebrae at the cranial end exhibit the most growth in queens21, the lumbar vertebrae toward the caudal end (LV5 and LV6) were most responsive to breeding status in our experiment, suggesting potential convergent evolution of the vertebral lengthening phenotype. Based on longitudinal measurements, most of this differential growth was concentrated soon after the breeding status transition, concordant with findings in naked mole-rats22. Specifically, we observed a significant interaction between breeding status (queen versus nonbreeder) and post-pairing time point in the first four months of the experiment (Figure 1B; β = 0.0784, p = 3.47 × 10; n = 49 x-rays from 28 animals), but not for x-rays taken in later time point intervals (4 months versus 8 months; 8 versus 12 months, all p > 0.05). However, due to the early increased growth in queens, size differences persisted, such that the absolute length of LV5 in queens was, on average, 4.8% longer than nonbreeders after 12 months (Figure 1C; LV5: unpaired t-test, t = 2.509, df = 21.095, p = 0.020), and the absolute length of the lumbar vertebral column in queens relative to nonbreeders was 3.5% longer, although the latter difference was not significant (unpaired t-test, t = 1.945, df = 22.49, p = 0.064). Differences between queens and nonbreeders were even more apparent if lumbar vertebrae measures were scaled by zygomatic arch (head) width, as done in previous studies9,11,22 (LV5: 9.3% longer, unpaired t-test, t = 4.12, df = 15.135, p = 8.87 × 10⁻⁴; lumbar vertebral column length: 7.9% longer, unpaired t-test, t = 4.34, df = 15.37, p = 5.58 × 10⁻⁴). This difference highlights changes in allometry across the queen skeleton due to the combination of lumbar vertebral growth and narrower zygomatic arch width in queens (4% narrower at 12 months, unpaired t-test, t = −2.448, df = 24.126, p = 0.022).
Consistent with previous results11, queens in the colony with longer bodies (which correlates with longer lumbar vertebrae, Pearson’s r = 0.856, p = 5.99 × 10−59; Supplementary Figure 1) had more pups per litter (Figure 1D; Supplementary Table 2; β = 0.353, p = 1.35 × 10⁻³, n = 328 litters from all breeding groups maintained in the same breeding facility). Controlling for litter size, longer queens also had larger pups: for every additional centimeter of maternal body length, pup body mass increased by 2.9% (β = 0.28, p = 0.032, n = 971 pups). Thus, the elongated queen phenotype is a strong candidate for adaptive plasticity that supports increased fertility in queen mole-rats.

Pearson correlations between the length of each lumbar vertebra and body length from mole-rat x-ray data. Narrower ovals with darker shades of red indicate larger Pearson correlations; correlation values are also given in the lower left triangle.
Breeding status induces gene regulatory changes in the queen mole-rat skeleton
To identify the gene regulatory changes associated with skeletal plasticity, we cultured cells enriched for bone marrow-derived mesenchymal stromal cells (bMSCs) isolated from the lumbar vertebrae (pooled LV1-LV5) of both queens and nonbreeders (n = 5 queens, 11 nonbreeders). bMSC cultures include multipotent skeletal stem cells, the precursor of the osteoblast and chondrocyte lineages responsible for bone growth. In parallel, we cultured cells enriched for bMSCs from the pooled long bones (humerus, ulna, radius, left femur, and left tibia) of the same animals, which do not show increased elongation in queens (for both tibia length and femur length, all p > 0.05 for interactions between breeding status and time intervals [0 months versus 4 months, 4 months versus 8 months, 8 months versus 12 months]; femur at 12 months: unpaired t-test, t = −0.202, df = 19.326, p = 0.842; tibia at 12 months: unpaired t-test, t = −0.860, df = 16.759, p = 0.402). To evaluate the potential role of sex steroid hormone signaling on bone growth, we treated cells from each bone sample for 24 hours with either 10 nM estradiol or vehicle control, resulting in 47 total samples. We then performed RNA-seq on each sample to screen for genes that were systematically differentially expressed in the bone cells of queens versus nonbreeders.
Of 10,817 detectably expressed genes, 171 genes showed a significant effect of breeding status at a false discovery rate (FDR) threshold of 10% in the long bones (329 at an FDR of 20%; Supplementary Table 3). Surprisingly, no genes showed a significant effect of breeding status in the lumbar vertebrae at either FDR threshold. However, effect sizes were highly correlated between bone types overall (R2 = 0.75, p = 4.60 × 10−53), with more pronounced effects of breeding status in the long bone samples than in the lumbar vertebrae (paired t-test on breeding status effects in long bone versus vertebrae: t = 3.97, df = 317.67, p = 8.73 × 10⁻⁵). Importantly, breeding status-related differences were not readily attributable to differences in bone cell composition. Based on both canonical markers of bMSC lineage cells and deconvolution of the RNA-seq data using data from 27 mesenchymal or hematopoietic lineage mouse cell types, the majority cell type in both queen and nonbreeder samples was most similar to cells from the bMSC lineage23–25 (Supplementary Figures 2 and 3). Additionally, estimated cell type proportions (as summarized by the top three principal components) did not differ between queens and nonbreeders (all FDR > 0.1, Supplementary Table 4), and we identified no cases in which the effects of breeding status on gene expression were significantly mediated by the first principal component of cell composition (p > 0.05 for all 171 queen-associated genes at 10% FDR; Supplementary Table 5). Because we observed no significant effect of estradiol treatment on gene expression in either bone type (all FDR > 10%), we did not evaluate the effects of estradiol further.

Clustering was performed using Ward’s hierarchical clustering method on Euclidean distances of the quantile normalized expression of the seven bMSC markers (out of 11 described23) that were quantified in both the mole-rat and reference mouse24 data sets. The black box indicates mole-rat samples, and the blue box indicates mouse osteoblasts, a bMSC lineage cell type.

Each box represents the interquartile range, with the median value depicted as a horizontal bar. Whiskers extend to the most extreme estimates within 1.5x the interquartile range. Cell proportions were estimated with CIBERSORT25, based on reference gene expression levels for 412 marker genes in 27 purified mouse cell types24. The predicted predominant cell type in the mole-rat samples is most similar to early stage osteoblasts, which are cells from the bMSC lineage.
The majority of breeding status-associated genes were up-regulated in queens (151 of 171 genes, 88%). In support of their role in skeletal plasticity, up-regulated genes were enriched for “bone remodeling” (log2[OR] = 4.07, p = 5.07 × 10⁻⁶), a process that involves the balanced cycle between bone formation by osteoblasts and bone resorption by osteoclasts26 (Figure 2). Surprisingly, however, enriched terms were specifically concentrated in pathways and processes related to bone resorption, not formation (Supplementary Table 6), including “positive regulation of bone resorption” (Figure 2A, C; log2[OR] = 6.51, p = 1.55 × 10⁻⁶) and “superoxide anion generation” (Figure 2A, C; log2[OR] = 5.29, p = 1.4 × 10⁻⁵), which is involved in osteoclast activity and degradation of bone matrix27–30. Differentially expressed genes were also enriched for immune-related processes (e.g., “cytokine secretion”, “chemotaxis”, “leukocyte activation involved in immune response”; Supplementary Table 6). These observations suggest that transitions to queen status also involve changes in immunoregulatory signaling (osteoclast cells, like macrophages, are derived from monocytes). Omni-ATAC-seq profiling of open chromatin regions further supports a central role for bone resorption and osteoclast activity in the queen skeleton (n = 8; Supplementary Table 7). Specifically, transcription factor binding motifs (TFBMs) located in accessible chromatin near queen up-regulated genes were enriched for PU.1 and MITF, two transcription factors that are essential for osteoclast differentiation31 (Figure 2B, C; PU.1 log2[OR] = 1.041, p = 2.84 × 10⁻⁴; MITF log2[OR] = 0.707, p = 7.36 × 10⁻³; see Supplementary Table 7 for complete list of enriched TFBMs). MITF was also among the 151 genes that were differentially expressed between queens and nonbreeders and up-regulated in both queen long bones and lumbar vertebrae.

(a) Gene Ontology (GO) terms enriched in queen up-regulated genes, relative to the background set of all genes tested. Bars represent 95% confidence intervals. Processes highlighted in purple are also depicted in (c). Highest-level (most general) terms are shown; for full GO enrichment results, see Supplementary Table 6. (b) Accessible transcription factor binding site motifs enriched near queen up-regulated genes, relative to all genes tested. Bars represent 95% confidence intervals. Transcription factors highlighted in purple are also depicted in (c). (c) Schematic of the balance between bone formation and bone resorption, showing key regulators and markers for mesenchymal stem cell differentiation into osteoblasts and hematopoietic stem cell differentiation into osteoclasts26,31. Queen up-regulated genes or proteins are highlighted as purple ovals (FDR < 10%) and transcription factors with binding motifs enriched near queen up-regulated genes are highlighted as purple hexagons. Inset for osteoclasts shows the NADPH oxidase system, which generates superoxide radicals (O2-) necessary for bone resorption and is highly enriched for queen up-regulated genes (purple ovals).
Extensive skeletal remodeling in queen mole-rats
The gene expression data suggest that queen status-driven changes to the skeleton extend beyond the lumbar vertebrae to the long bones. Further, they suggest that bone resorption—an important counterpoint to bone formation that is required for normal skeletal maintenance—also distinguishes breeding and nonbreeding females. To investigate this possibility, we performed high-resolution micro-computed tomography (μCT) scanning to generate 3D reconstructions of LV6, LV7, right femur, and right tibia of queens and female nonbreeders (n = 140 bones from 36 animals; Figure 3A; Supplementary Figure 4). This approach substantially increases the level of resolution for investigating breeding status-linked differences in skeletal morphology, as previous studies relied on x-ray data alone9,11.

(a) μCT scan of LV7 of a female Damaraland mole-rat. The boxes indicate the locations of the caudal and cranial growth plates. (b) The number of offspring produced by queens does not significantly predict growth plate fusion (quantified as the average of the caudal and cranial growth plates; β = 2.745 × 10⁻⁴, p = 0.970, n = 12, controlling for age) or chondrocyte proliferation within the remaining growth plate (β = −0.033, p = 0.293, n = 12, controlling for age). Each box represents the interquartile range, with the median value depicted as a horizontal bar. Whiskers extend to the most extreme values within 1.5x of the interquartile range. Dots represent individual animals, and shading indicates each animal’s total offspring number.

(a) μCT scans of female Damaraland mole-rat tibias. Boxes indicate the location of the proximal growth plate, which is either unfused (left) or fully fused (right). (b) Example Safranin-O stained histological sections of the proximal tibia, in which the growth plate is unfused (top), partially fused (middle), or fully fused (bottom). Values in the top left of each box indicate percent growth plate fusion across the width of the bone. The cartilaginous growth plate is stained deep pink and calcified bone is stained green. (c) Queens, and specifically queens that gave birth to more offspring, show increased growth plate fusion (β = 0.050, p = 4.51 × 10⁻³, n = 12, controlling for age) and (d) decreased number of chondrocyte columns within the remaining growth plate (β = −0.132, p = 0.020, n = 12, controlling for age). Each box represents the interquartile range, with the median value depicted as a horizontal bar. Whiskers extend to the most extreme values within 1.5x of the interquartile range. In (c) and (d), dots represent individual animals, and shading indicates each animal’s total offspring number. Ages of queens and nonbreeders do not significantly differ (unpaired t-test, t = 0.489, n = 12, p = 0.644).
We first asked whether breeding status could be predicted from morphological differences in the 3D reconstructions. We found that it could for the lumbar vertebra, but not for the femur: by applying the smooth Euler characteristic transform32, we were able to predict queen versus nonbreeder status in LV6 (77.8% accuracy, p = 0.01, n = 36), but not the femur (52.8% accuracy, p = 0.53, n = 36). Including only highly fecund queens (≥6 total offspring) improved predictive accuracy in the femur (70% accuracy, p = 0.12, n = 30). Although these predictions did not reach statistical significance, they raised the possibility that morphological changes in femurs become enhanced with increasing reproductive effort.
We next tested whether the transition to queen status affects the ability to continue bone lengthening. Lengthening requires the presence of a growth plate, a region of cartilage in the bone where longitudinal growth occurs through proliferation of cartilage cells (chondrocytes) (Figure 3A-B; Supplementary Figure 4). Closure of the growth plate, which indicates that bone lengthening potential has terminated, typically occurs in mammals after reaching sexual maturation, when energy begins to be invested in reproduction instead of growth. To test whether the transition to queen status alters bone lengthening potential, we performed Safranin-O staining on sections of the right tibia and LV7 to visualize growth plates (Figure 3B). In the proximal tibia but not LV7, queens were less likely to have open growth plates (Figure 3C; Supplementary Figure 4; Supplementary table 8; tibia: two-sided binomial test, p = 0.019; LV7: two-sided binomial test, p = 0.422). The increased probability of growth plate closure in the tibia of queens is linked to the number of offspring a female has produced: females with more offspring showed a higher expanse of closure across the growth plate (β = 0.050, p = 4.51 × 10⁻³, n = 12, controlling for age). This pattern may be due in part to reduced chondrocyte proliferation, as females that produced more offspring had fewer chondrocyte columns in the remaining growth plate (Figure 3D; β = −0.132, p = 0.020, n = 12, controlling for age). Thus, offspring production in queens is associated with loss of the ability to lengthen the long bones, but not the lumbar vertebrae, consistent with the importance of abdominal lengthening for supporting larger litters.
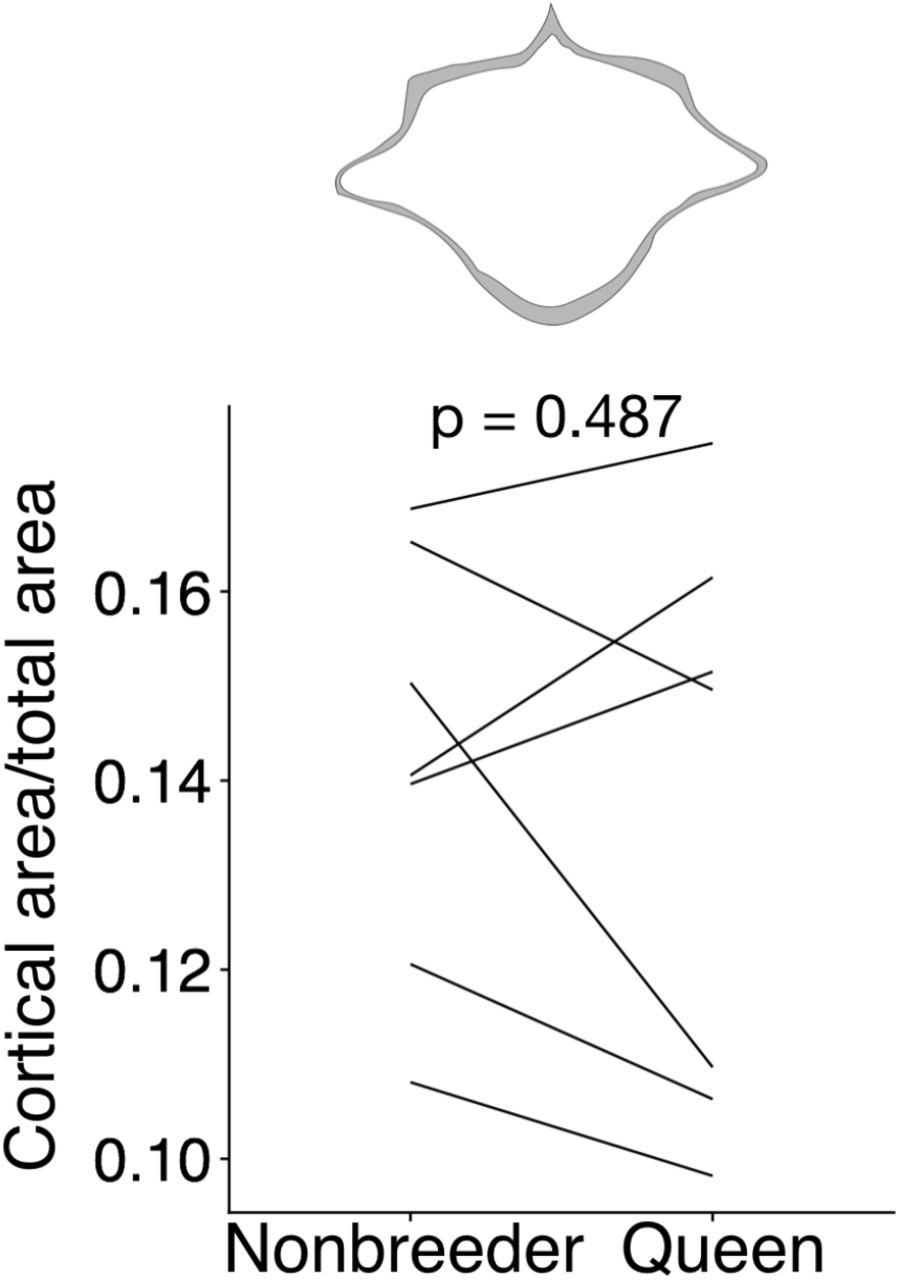
A major demand on reproductively active female mammals is a high requirement for calcium, particularly during lactation when mothers support rapid offspring bone growth. Maternal skeletons are remodeled to meet this demand, although in most mammals, these changes are not permanent (reviewed in 34). Because of the particularly intense reproductive investment made by cooperatively breeding mole-rat queens, we therefore also evaluated the effect of queen status on trabecular and cortical bone volumes, which are thought to be important in satisfying short-term and long-term calcium demands, respectively. We found no effect of queen status on the amount of trabecular bone in the femur, tibia, LV6, or LV7 (all p > 0.05 for bone volume/total volume). However, we found that cortical bone was significantly thinner at the femoral midshaft, but not in the lumbar vertebrae, in queens compared to their nonbreeding sisters (Figure 4A; Supplementary Figure 5; femur: paired t-test of cortical area/total area, t = - 4.067, df = 8, p = 3.60 × 10⁻³; LV6: paired t-test of cortical area/total area, t = −0.741, df = 6, p = 0.487). Cortical thinning in queens appears to be specifically due to increased bone resorption, which typically occurs on the endosteal (internal) surface of long bones in the marrow cavity. Indeed, queens had a larger marrow cavity (paired t-test, t = 5.355, df = 8, p = 6.82 × 10⁻⁴; Figure 4B) but showed no difference in periosteal area compared to their nonbreeding sisters (paired t-test, t = 1.539, df = 8, p = 0.162; Figure 4C).

At top, cross-section with area highlighted in gray shows the measure represented in the plot. Each line represents an age-matched nonbreeder and queen littermate pair. Queens and nonbreeders show no difference in cortical area/total area at the LV6 midsection (paired t-test of cortical area/total area, t = −0.741, df = 6, p = 0.487).

Femoral cross-sections with area highlighted in gray show the measures represented in the corresponding plots below. Each line represents an age-matched, nonbreeder and queen littermate pair. (a) Queens have less cortical bone (relative to the total area of the femoral midshaft cross-section), compared to their paired nonbreeding littermates (paired t-test of cortical area/total area, t = −4.07, df = 8, p = 3.60 × 10⁻³). (b) Queens also have enlarged marrow cavities (paired t-test, t = 5.36, df = 8, p = 6.82 × 10⁻⁴), where bone resorption typically occurs, but (c) show no difference in overall periosteal area (paired t-test, t = 1.54, df = 8, p = 0.162).
Because changes in cortical bone are thought to reflect accumulated demands over long time frames, we hypothesized that cortical thinning in queens is a consequence of repeated cycles of pregnancy and lactation over time, which can occur simultaneously in Damaraland mole-rat queens. In support of this idea, we found that, within queens, the relative amount of cortical bone is not predicted by the number of pups in a queen’s most recent litter (β = −0.024, n = 13, p = 0.287), but instead by the total number of pups she produced in her lifetime. Specifically, queens who had more live births had reduced cortical bone thickness along the entire shaft of the femur (Figure 5 and Supplementary Table 9; across decile sections of the femur: all p < 0.05, controlling for mother’s litter as a random effect; at midsection: β = −0.011, n = 13, p = 0.031). Thus, cortical thinning does not commence with the transition to queen status per se (i.e., it is not a correlate of achieving breeder status), but instead appears to be a consequence of repeated investment in pregnancy and lactation. Notably, thinning is particularly marked in queens who had at least six offspring, which usually occurs by 14 months after a breeding status transition (i.e., by the third litter; Supplementary Table 9). Given that wild Damaraland mole-rat queens can maintain their status for many years35, our results suggest that long-lived queens may experience substantial morphological change.

(a) Queens (top row) relative to their same-aged nonbreeding littermates (bottom row) present thinner cortical bone across the femur, particularly in females that have many offspring (top right). Number of offspring is indicated above each femur, and vertical arrows indicate littermate pairs. (b) Within each decile section across the femoral shaft, number of offspring is negatively correlated with average cortical thickness (linear mixed model with littermate pair as random effect). Full results are presented in Supplementary Table 9. Asterisk indicates p < 0.05.
Skeletal remodeling predicts increased risk of femur breakage in queens
In humans, accelerated bone resorption is a central cause of osteoporosis-related bone fragility36. We therefore hypothesized that cortical thinning in queen mole-rat femurs would be linked to decreased bone strength. To test this hypothesis, we calculated two key indicators of femoral structural integrity: cortical area (CA) and the minimum moment of inertia (Imin, a predictor of resistance to bending). In nonbreeders, both are positively correlated with body mass (Imin: R2 = 0.368, n = 24, p = 9.92 × 10⁻⁴; CA: R2 = 0.407, n = 24, p = 4.80 × 10⁻⁴). However, in queens, Imin is not significantly predicted by body mass (R2 = 0.088, n = 13, p = 0.17), but is instead a function of number of offspring produced (R2 = 0.283, p = 0.035). Queen CA is predicted by both offspring number and body mass, but offspring number explains almost twice the variance (offspring number R2 = 0.634, p = 6.83 × 10⁻⁴; body mass R2 = 0.385, p = 0.014).
To evaluate the effects of reproductive activity on the risk of bone failure, we drew on data on the relationship between CA and bone mechanical failure in a large data set of mouse femurs37. In this data set, CA is the best predictor of maximum load (the maximum force a bone can withstand prior to failure), and, crucially, the CA-max load relationship is highly linear (Supplementary Figure 6; R2 = 0.88, p = 6.64 × 10−38). Scaling the mole-rat CA data to mouse suggests that transitions to queen significantly increase the risk of bone failure (Figure 6A; hazard ratio (95% confidence interval) = 2.67 (1.20, 5.93), n = 36, p = 0.016). Similar to growth potential and cortical thinning, this effect is driven by highly fertile queens, such that those who had at least six offspring showed the highest predicted risk of bone failure (Figure 6B; queens with ≥ 6 offspring relative to nonbreeders: HR = 3.81 (1.47, 9.83), n = 30, p = 0.006). The risk of bone failure is thus predicted to increase by 21% for each additional pup (HR = 1.21 (1.10, 1.33), n = 36, p = 8.85 × 10⁻⁵).

Max load shows a highly linear relationship with cortical area across mouse femurs (R2 = 0.88, p = 6.64 × 10−38). Each dot represents a single mouse femur. Solid line indicates the best fit line. Data are from 37.

(a) Survival curves for femurs from queens versus nonbreeders, based on predictions from the midshaft cortical area and data from 37 (Wald test, p = 0.02, n = 36; see Methods). (b) Survival curves for femurs from queens with ≥ 6 offspring versus nonbreeders (Wald test, p = 0.006, n = 30). Vertical dashed lines indicate group medians, with the median failure time for nonbreeders fixed at a value of 1.
Discussion
Our results demonstrate that transitions to breeding status in Damaraland mole-rat queens drive widespread skeletal remodeling linked to shifts in gene regulation. In addition to previously described vertebral growth11, queen Damaraland mole-rats up-regulate bone resorption-related pathways, lose bone lengthening potential in the long bones, and develop thinner femurs that are predicted to be more prone to mechanical failure. While vertebral growth is triggered immediately after transition to queen status, these other changes are a function of repeated offspring production. Thus, queens quickly progress from traits typically associated with pre-reproductive and pubertal growth in mammals (e.g., body elongation), to traits typically linked to aging (e.g., marrow cavity expansion and cortical thinning). This progression is supported by the signature of bone resorption rather than bone growth at the time of sampling, which occurred 1 - 2 years post-transition. Combined, these results suggest some key differences between Damaraland mole-rats and eusocial insects. Specifically, while abdominal lengthening allows queen mole-rats to increase fecundity per reproductive effort, loss of cortical bone in the femur is unlikely to directly benefit either fertility or survival. Instead, it reflects the cumulative burden of continuous cycles of pregnancy and lactation34. Thus, unlike eusocial insect queens38,39, Damaraland mole-rat queens incur morphological costs to concentrated reproduction in addition to morphological changes that facilitate increased fitness.
The typical mammalian pattern of bone remodeling, in which bone mineral density decreases during pregnancy and lactation but recovers after offspring are weaned34, may explain bone thinning in Damaraland mole-rats queens: queens often lactate for one litter while gestating another, leaving little to no time for recovery. One possible reason that this fast rate of breeding is achievable is that queens in colonies with more helpers work less and rest more40, consistent with studies in other cooperative mammals that show that helpers alleviate breeding-associated loss of condition in queens41. However, the extent to which helpers reduce the costs of breeding to queens may differ between species depending on the relative numbers of helpers to breeders. For example, in eusocial insects, large colonies and the high ratio of helpers to queens reduce the costs of reproduction to queens to low levels1,2. Similarly, in naked mole-rats (where colonies can include hundreds of animals, compared to up to dozens in Damaraland mole-rat colonies17,18,43), a small sample of queens (n = 6) suggests increased rather than decreased femoral cortical thickness relative to age-matched nonbreeders44. Testing how the costs and benefits of reproduction are resolved across different levels of cooperativity, including the molecular mechanisms that mediate these differences, is an important next step towards understanding the evolution of cooperative breeding in mammals.
Author Contributions
Conceptualization, R.A.J., T.C.B., and J.T.; Investigation, R.A.J., Ja.T., P.V., H.K., L.S., S.M., C.K., T.C.B., and J.T. Formal Analysis, R.A.J., H.K., S.M.; Writing–Original Draft, R.A.J. and J.T.; Writing-Reviewing & Editing, R.A.J., P.V., Ja.T., H.K., L.S., S.M., C.K., T.C.B., and J.T. Funding Acquisition, J.T. and T.C.B. Supervision, T.C.B. and J.T.
Competing Interests
The authors declare no competing interests.
Methods
Study system and experimental design
Damaraland mole-rats (Fukomys damarensis) were maintained in a captive colony at the Kuruman River Reserve in the Northern Cape Province of South Africa, within the species’ natural range. Only animals born in captivity, with known birthdates and litter composition, were used in this study. Animals were maintained in artificial tunnel systems built from PVC pipes with compartments for a nest-box and waste-box and transparent windows to allow behavioral observation. Animals were fed ad libitum with sweet potatoes and cucumbers.
Adult females were randomly assigned to be either nonbreeders or queens, such that females assigned to queen status had matched siblings who were assigned to the nonbreeding condition (age-matched littermates where possible). Nonbreeders were either maintained in their natal colony as helpers or maintained alone, which models the social condition experienced by dispersing females. Females assigned to the breeder condition were transferred to a new tunnel system with an unrelated male from a separate social group. Ten new breeding colonies, with corresponding age-matched nonbreeding littermates where possible (6 helper and 8 solitaire age-matched littermates, and 4 non-littermate helpers), were set up in December 2015-June 201711. With one exception (G10F026), animals maintained their breeding status for 14-22 months before sample collection. Breeding females were at different stages of pregnancy at time of sacrifice. An additional 4 breeding colonies (with 4 matched littermate helpers) were formed in October 2017 and followed for 11-12 months (Supplementary Table 1). One queen died before sample collection, and one non-experimental helper was euthanized during the course of the study and included in sample collection. The final sample size included 13 breeders, 15 helpers, and 8 solitaire females.
X-ray data
For a subset of study subjects, full body X-rays were taken every two months during the first 12 months of the experiment and at the time of sacrifice. From these X-rays, an experimenter blind to animal breeding status measured the length of each lumbar vertebra from vertebra 1 to 7, the right femur, the right tibia, body length, and the width of the zygomatic arch using ImageJ45. The caudal-most lumbar vertebra was labeled as LV7. We tested for an effect of breeding status on LV5 using a linear mixed model in which post-pairing time point, breeding status, and the interaction of time point by breeding status were modeled as fixed effects and animal ID as a random effect.
Effects of queen body length on fertility
To test the effect of maternal body length on litter size and pup size, we used body length measurements obtained during routine colony monitoring of all queens maintained in the captive colony (i.e., not restricted to experimental animals). Following 11, we used body length measurements obtained nearest to, and no more than 90 days from, the date of parturition. The resulting dataset included 328 litters (971 pups) from 76 mothers (a 76% increase from the data set in Thorley et al, 2018). We fit two linear mixed effects models. In the first model, we modeled litter size as a function of maternal body length, controlling for whether the litter was the female’s first litter, and included maternal ID as a random effect. In the second model, we modeled pup mass as a function of maternal body length, controlling for litter size and whether the litter was the female’s first litter as fixed effects, and maternal ID and litter ID as random effects.
Sample collection and cell culture from lumbar vertebrae and long bones
Animals were deeply anesthetized with isoflurane and sacrificed with decapitation following USGS National Wildlife Health Center guidelines and under approval from the Animal Ethics Committee of the University of Pretoria. Immediately upon sacrifice, the lumbar vertebrae and long bones were dissected, and attached muscle tissue was removed with forceps. Lumbar vertebrae 6 and 7 and the right femur and tibia were collected into 50% ethanol for 24 hours, then transferred to 70% ethanol and stored at 4° C for μCT scans and histochemistry.
To isolate bone cells for culture, lumbar vertebrae 1-5 were incubated in 2% Collagenase P (Roche, Switzerland) for 30 minutes at 30° C. Each bone was then cut in half and transferred to a 1.5 ml microcentrifuge tube containing a G-Tube microcentrifuge tube (VWR, Radnor, PA, USA) that had been punctured at the bottom with a 15 gauge needle. Tubes were spun at 3,000 RCF for 5 seconds, allowing the marrow to collect into the 1.5 mL microcentrifuge tube. Cell pellets were resuspended in red blood cell lysis buffer, pooled, and incubated for 3 minutes at room temperature. 10 ml bMSC media (MEM-alpha [ThermoFisher, Waltham, MA, USA] + 15% fetal bovine serum [Hyclone, Logan, UT, USA] + 1% penicillin/streptomycin + 2 ng/ml recombinant human fibroblast growth factor-basic [Biocam, Centurion, Gauteng, South Africa] + 10 nM ROCK inhibitor Y-27632 [RI; Cayman Chemical, Ann Arbor, MI, USA]) was added to stop lysis, and the tubes were spun for 5 minutes at 300 RCF. The cell pellet was resuspended in 1 ml bMSC media and strained through a 70 μm cell strainer. Cells were plated at 1.6 × 10⁵ cells per cm2. The long bones (excluding right femur and tibia) were processed to enrich for bMSCs following the same procedure, but without incubation in Collagenase P. Cells were cultured at 37° C and 5% CO2. Twenty-four hours post plating, plates were carefully washed three times with 1x PBS and supplied with fresh media to remove non-adherent cells. Once bMSC clusters were visible (2-9 days post plating), plates were fed bMSC media without RI or fed bMSC media without RI + 10 nM estradiol (E2). Twenty-four hours later, cells were collected into buffer RLT and stored at −80° C. Samples were shipped on dry ice to Duke University for RNA extraction using the Qiagen RNeasy Micro Kit. RNA-Seq libraries were generated using the NEBNext Single Cell/Low Input RNA Library Prep Kit for Illumina.
Gene expression analysis
RNA-Seq libraries were sequenced on an Illumina HiSeq 4000 (100 base pair single end reads) to a mean coverage of 16.1 ± 3.9 s.d. million reads. Reads were trimmed with cutadapt version 2.346 (parameters: -q 20 -e 0.2 --times 5 --overlap 2 -a AGATCGGAAGAGC -a “T” -- minimum-length=20). Trimmed reads were then mapped to the Damaraland mole-rat v1.0 genome47 (DMR_v1.0) using two pass mapping with STAR48. Only uniquely mapped reads were retained. HTseq49 was used to quantify read counts mapping to genes (using the v1.0.92 gtf file from Ensembl; we extended the genomic coordinates of the SERPINE1 gene by 2000 basepairs in both directions due to very high expression directly adjacent to the annotated coordinates). We transformed read counts to transcripts per million (TPM)50, and retained only genes with TPM ≥ 2 in at least 25% of samples. We performed voom normalization51 on the raw counts, using normalization factors produced by the trimmed mean of M-values (TMM) method52 in DESeq53. We used the limma54 function lmFit to regress out the proportion of uniquely mapped reads in genes (which controls for efficiency of mRNA selection during RNA-Seq library preparation) and animal natal colony (which controls for littermate sets and date of sacrifice) to obtain normalized, batch-corrected gene expression values for downstream analysis. We used the mixed effects model approach in emmreml55 to estimate, for each gene, the effect of breeding status on gene expression within lumbar vertebrae and within long bones using the following model:
 where y is the vector of gene expression levels for n = 47 samples (indexed by i); μ is the intercept; d is the number of days in culture and β1 its effect size; b is bone type (i.e., long bones or lumbar vertebrae) and β2 its effect size; and q is a 0/1 variable representing breeder status and β3 and β4 its effect size in long bones and lumbar vertebrae, respectively. I is an indicator variable for bone type (0 = long bone; 1 = lumbar vertebrae). s is a 0/1 variable representing whether the cells were cultured with estradiol and β5 and β6 are its effect sizes in long bones and lumbar vertebrae, respectively. Z is an incidence matrix that maps samples to animal ID to take into account repeated sampling from the same individual, and u is a random effect term that controls for relatedness. K is an m by m matrix of pairwise relatedness estimates (derived from the genotype data described below) between all m animals. ε is the residual error,
  is the genetic variance component, and
  is the environmental variance component. To control for multiple testing, we calculated the false discovery rate following Storey and Tibshirani56 using an empirical null distribution derived from 100 permutations of each variable of interest.
We used g:profiler57 to perform gene ontology enrichment analysis of the genes up-regulated with queen status in lumbar vertebrae and long bones (151 of 171 genes significantly associated with queen status at a 10% FDR). All genes in the original analysis set were used as the background gene set. We set both the minimum size of the functional category and the minimum size of the query/term intersection to 3. Finally, we retained categories that passed a Bonferroni corrected p-value of 0.05.
Genotyping to estimate relatedness
To control for relatedness when modeling the gene expression data, we performed single nucleotide polymorphism (SNP) genotyping of the RNA-Seq data using the Genome Analysis Toolkit58 (GATK). We used the SplitNCigarReads function on the trimmed, uniquely mapped reads and performed GATK indel realignment. Base recalibration was performed by using all SNPs with GQ ≥ 4 in an initial UnifiedGenotyper run on the full data set as a reference. Genotypes were called on the recalibrated bam files using HaplotypeCaller. Variants were filtered with the following GATK VariantFiltration parameters: QUAL < 100.0, QD < 2.0, MQ < 35, FS > 30, HaplotypeScore > 13, MQRankSum < −12.5, ReadPosRankSum < −8. Variants were further filtered with vcftools59 to only retain biallelic SNPs in Hardy-Weinberg equilibrium (p > 0.05) with minor allele frequency ≥ 0.1, minimum mean depth of 5, max missing count of 2, and minimum GQ of 99. Finally, SNPs were thinned to a distance of 10 kb basepairs, resulting in a final dataset of 1,965 stringently filtered biallelic SNPs. Missing values were imputed using beagle60, and the resulting vcf file was used to create a kinship matrix using vcftools59. Values of the kinship matrix were confirmed to be higher in known siblings compared to non-siblings (unpaired t-test, t = 27.939, p = 2.23 × 10⁻¹²; means = 0.513 and −0.097). Two pairs of siblings were found to have different fathers (G1F022 and G1F025; G4F020 and G4F019).
Cell type heterogeneity
Although selection for adherent cells from bone marrow enriches for bMSCs, other cell types are also present61. To assess whether cell type heterogeneity accounts for queen-associated differential expression, we used CIBERSORT to deconvolve the proportion of component cell types from the RNA-Seq data25. We trained CIBERSORT on a data set of quantile normalized gene expression values from mouse purified primary cell populations24. Specifically, we subset the training data to 27 purified cell populations of mesenchymal or hematopoietic origin (Supplementary Figure 3) and to genes that were included in our mole-rat gene expression dataset. We then predicted the composition of the cells that contributed to the mole-rat quantile normalized gene expression data set, for each sample.
To test whether cell type heterogeneity was significantly explained by queen status, we also modeled cell type proportion (as summarized by the first principal component of CIBERSORT-estimated proportions for all 27 potential cell types; PC1 explains 50.9% of the overall variation) following the same method used for gene-by-gene expression analysis but with PC1 included as an explanatory variable. We then performed mediation analysis on each of the 171 genes that showed a significant effect of breeding status at FDR < 10%. To do so, we first estimated the indirect effect of breeding status on gene expression through the mediating variable (CIBERSORT PC1). The indirect effect of breeding status through CIBERSORT PC1 was estimated by calculating the difference in the effect of breeding status between two models: one model that did not include the mediator (i.e., β3 and β4 from equation 1 above) and the same model with the addition of the mediating variable. We performed 1000 iterations of bootstrap resampling to obtain the 95% confidence interval for the indirect effect, and considered an indirect effect for a gene significant if the 95% interval did not overlap 0.
ATAC-seq data and transcription factor binding site analysis
To investigate whether differentially expressed genes were associated with accessible binding motifs for specific transcription factors, we generated Omni-ATAC-seq data to profile regions of open chromatin62,63. We performed Omni-ATAC-seq on both lumbar vertebrae bMSCs and long bone bMSCs from two female nonbreeding and two queen mole-rats (n = 8 libraries total), following the published protocol63 with the following modifications: 5,000 cells were centrifuged at 500 RCF for 5 minutes at 4°C. The pellet was resuspended in 50 ul transposition mix (25 ul 2xTD buffer, 16.5 ul PBS, 6.75 ul water, 1 ul 10% NP40, 1 ul 10% Tween-20, 1 ul 1% digitonin, and 0.25 ul Tn5 transposase). The reaction was incubated at 37°C for 30 minutes without mixing, followed by a 1.5x Ampure bead cleanup. Omni-ATAC libraries were sequenced on a NovaSeq 6000 as 100 basepair paired-end reads to a mean coverage (± SD) of 26.9 (±4.4) million reads (range: 16.8-38.3). Reads were trimmed with Trim Galore!64 to remove adapter sequence and low quality basepairs (Phred score < 20; reads ≥ 25 bp). Read pairs were mapped to the DMR_v1.0 genome using bwa-mem65 with default settings. Only uniquely mapped reads were retained. The alignment bam files for each treatment (breeding or nonbreeding) were merged, and open chromatin regions were identified using MACS2 v2.1.266 with the following parameters: “-nomodel -keep-dup all -q 0.05”. We combined open chromatin peaks with regions in the DMRv1.0 genome that match sequences of vertebrate transcription factor binding site motifs, using motifs defined in the HOMER database67. We used Fisher’s exact tests (using a p-value threshold of 0.01) to test if transcription factor binding motifs belonging to the same transcription factor were enriched in open chromatin regions within 2,000 bp of the 5’ most transcription start site of queen up-regulated genes.
Micro-CT scans and analysis
We performed μCT scans of LV6, LV7, right femur, and right tibia using a VivaCT 80 scanner (Scanco Medical AG, Brüttisellen, Switzerland) set at 55 kVp and 145 μA, with voxel size 10.4 μm. Trabecular bone was quantified from the 100 μCT slices below the proximal tibia growth plate, the 100 μCT slices above the distal femur growth plate, and the 100 μCT slices medial to the caudal growth plate of LV6. To obtain midshaft cross-sections of the femur, tibia, and LV6, we first reduced each bone mesh to 100,000 faces using Avizo Lite version 9.7.0. Mesh files from the same bone type were auto-aligned using Auto3dgm68 in Matlab. Aligned mesh files were then back scaled to their original sizes in Matlab, and the midshaft cross-section was generated using Rhinoceros version 6. The MomentMacro plugin in ImageJ was used to calculate bone area and moment of inertia.
Classification of breeding status from bone shape
To predict breeding status from bone shape, we first applied the smooth Euler characteristic transform32 to the aligned right femur and LV6. We then performed leave-one-out predictions, running each bone type separately, using the linear kernel and c-classification with the support vector machine (SVM) implemented by the R package e107169. The SVM classifier was equipped with 1:100,000 weighting to achieve class balanced predictions. The empirical p-values were estimated for each bone type by running 100 permutations of the queen/nonbreeder labels70.
Histochemistry
For a subset of individuals (Supplementary Table 8), the tibia and LV7 were plasticized, sectioned, and stained with Safranin O by the Washington University Musculoskeletal Research Center. The proportion of the tibia proximal growth plate that was fused, and the mean proportion of the LV7 cranial and caudal growth plates that were fused, were measured in ImageJ from Safranin O stained sections. To quantify growth plate activity, we calculated the number of chondrocyte columns (defined as linear stacks of at least three chondrocytes) controlling for length of open growth plate. For each bone type (tibia and LV7), we ran two models: proportion growth plate fusion or chondrocyte columns per mm growth plate as the dependent variable, and number offspring born and age as the independent variables.
Cortical thickness across the femur
We used Stradview71,72 on dicom images from the μCT scans to measure and visualize, in an automated manner, cortical thickness across the surface of the femur. Bone surface was defined in Stradview by thresholding pixel intensity and contouring the bone at every 14 sections, with the following parameters: resolution = medium, smoothing = standard, strength = very low, contour accuracy = 6. To measure cortical thickness, we used the auto threshold method in Stradview, with line width set to 5, smooth set to 1, and line length set to 3 mm. The smoothed thickness values of each femur were then registered (i.e., mapped) to a single “canonical” femur surface (mole-rat GRF002) using wxRegSurf v18 (http://mi.eng.cam.ac.uk/~ahg/wxRegSurf/). We sectioned the cortical thickness values into deciles according to location along the length of the femur. The top and bottom deciles were removed, because cortical and trabecular bone towards the ends of the femur could not be easily differentiated by the automated method. Deciles were then recreated for the remaining length of the bone (i.e., the central 80%). From each bone decile, we estimated cortical thickness as the mean of all cortical thickness measures within that interval. For each decile across animals, we used a linear mixed model to model cortical thickness as a function of breeding status and number offspring, with litter pair as a random effect.
Modeling the probability of bone failure
Previous research on mechanical properties of rodent femurs found that, among several morphological and compositional traits measured in eight morphologically varying mouse strains, cortical area (CA) at the midshaft was the best predictor of maximum load (defined as the greatest force attained prior to bone failure, measured via four-point bending; published Pearson’s r = 0.95)37. We therefore used cortical area at the femoral midshaft to predict max load of Damaraland mole-rat femurs. To do so, we first fit a linear model of max load as a function of cortical area (unadjusted for body weight) using published mouse data (R2 = 0.877, n = 81, p = 6.64 × 10−38)37. We extrapolated from this linear fit to predict max load from cortical area at the midshaft of Damaraland mole-rat femurs. Predicted max loads were then used as input for Cox proportional hazards models, comparing either all queens to nonbreeders or queens with ≥ 6 offspring to nonbreeders. Models were fit using the R function coxph, and were confirmed to meet the proportional hazards assumption using the cox.zph function in the R package survival73. Because max load was not directly measured in the Damaraland mole-rats, we used the Cox proportional hazards models to specifically evaluate the relative hazard of bone failure depending on queen status/number of offspring. We therefore report the results in Figure 6 based on relative force (with the median predicted failure value for nonbreeders set to 1) instead of absolute force in Newtons.
Data Availability
All RNA sequencing data generated during this study are available in the NCBI Gene Expression Omnibus (series accession GSE152659). ATAC-Seq data are available in the NCBI Sequence Read Archive (BioProject accession number PRJNA649596). μCT data from this study are available on MorphoSource (http://www.morphosource.org, project 1056).
Acknowledgements
We thank Tim Vink, Dave Gaynor, and the mole-rat house staff and volunteers for their tremendous contributions to the Kalahari Mole-rat Project. We also thank Irene Garcia, Mari Cobb, Brianna Bowman, Anna Luiza Wolf, Alice Zhou, Yilin Yu, B.J. Nielsen, and Tawni Voyles for their contributions to sample collection and data generation, Graham Treece for guidance on quantifying bone thickness with Stradview, Karl Jepsen for sharing data on mouse femurs, Lou DeFrate for guidance on estimating bone strength, and members of the Tung lab for feedback on earlier versions of this manuscript. Support for this work was provided by the European Research Council (Grants 294494 and 742808 to T.C.B), the Human Frontier Science Program (RGP0051-2017 to J.T., S.M., and T.C.B.), the National Science Foundation (IOS-7801004 to J.T.), the National Institutes of Health (F32HD095616 to R.A.J.), a Sloan Foundation Early Career Research Fellowship to J.T., a Foerster-Bernstein Postdoctoral Fellowship to R.A.J., and a Natural Environmental Research Council Doctoral Training Program to Ja.T. High-performance computing resources were supported by the North Carolina Biotechnology Center (Grant Number 2016-IDG-1013).
References


