

Abstract
Ectopic induction of optogenetic actuators, such as channelrhodopsin, is a promising approach to restore vision in the degenerating retina. However, the cell type-specific response of ectopic photoreception has not been well understood. It is not easy to obtain efficient gene expression in a specifically targeted cell population by a transgenic approach. In the present study, we established retinal ganglion cell (RGC)- and amacrine cell gene induction in a murine model with high efficiency using an improved tetracycline transactivator-operator bipartite system (KENGE-tet system). To investigate the cell type-specific visual restoration effect, we expressed the channel rhodopsin gene into RGCs and amacrine cells using this system. Then, enhancement of the visual restoration effect was observed by gene transfer not only to RGCs but also to starburst amacrine cells. It was suggested that photoresponse from amacrine cells enhanced the maintained response of ganglion cells and furthered the visual restoration effect.
Introduction
Inherited retinal degeneration is one of the major causes of vision loss. More than 2 million people worldwide are blind due to this disease 1, and there is still almost no effective treatment. Previous studies have reported visual restoration effects in animal models using various molecules as optogenetic actuators 2–9. In addition, clinical trials have also started using channelrhodopsin 2 (RST-001, ClinicalTrials.gov Identifier: NCT01648452), and Chrimson R (GS-030, ClinicalTrials.gov Identifier: NCT03326336), with gene transduction into RGCs by intravitreal injection of recombinant adeno-associated virus (rAAV). Although the visual reconstruction effects by optogenetic gene transfer, such as channelrhodopsin-2 into RGCs 10 and ON-bipolar cells 3,5,6,8,11, have been shown, interactions between other types of cells in the retinal neural circuits in optogenetic visual restoration have not between well understood. Channelrhodopsin 2 conductance was reported to be 50–250 fS 12, indicating the need for sufficient gene expression to control the membrane potential. In this study, we employed a tetracycline-controllable gene expression system (tet system) 13 in which the amount of gene expression has been much improved (KENGE-tet system) 14, and we established sufficient gene induction in RGCs and amacrine cells simultaneously. To investigate cell type-specific visual restoration effects, channelrhodopsin2(E123T/T159C) was ectopically expressed into these cells by this system. Then, we revealed that amacrine cells played a role in retinal neuronal circuits via gap junctions to enhance the optogenetic visual restoration effect.
Results
Gene induction of RGCs and SACs in M4-YC and RGCs in 5B-YC
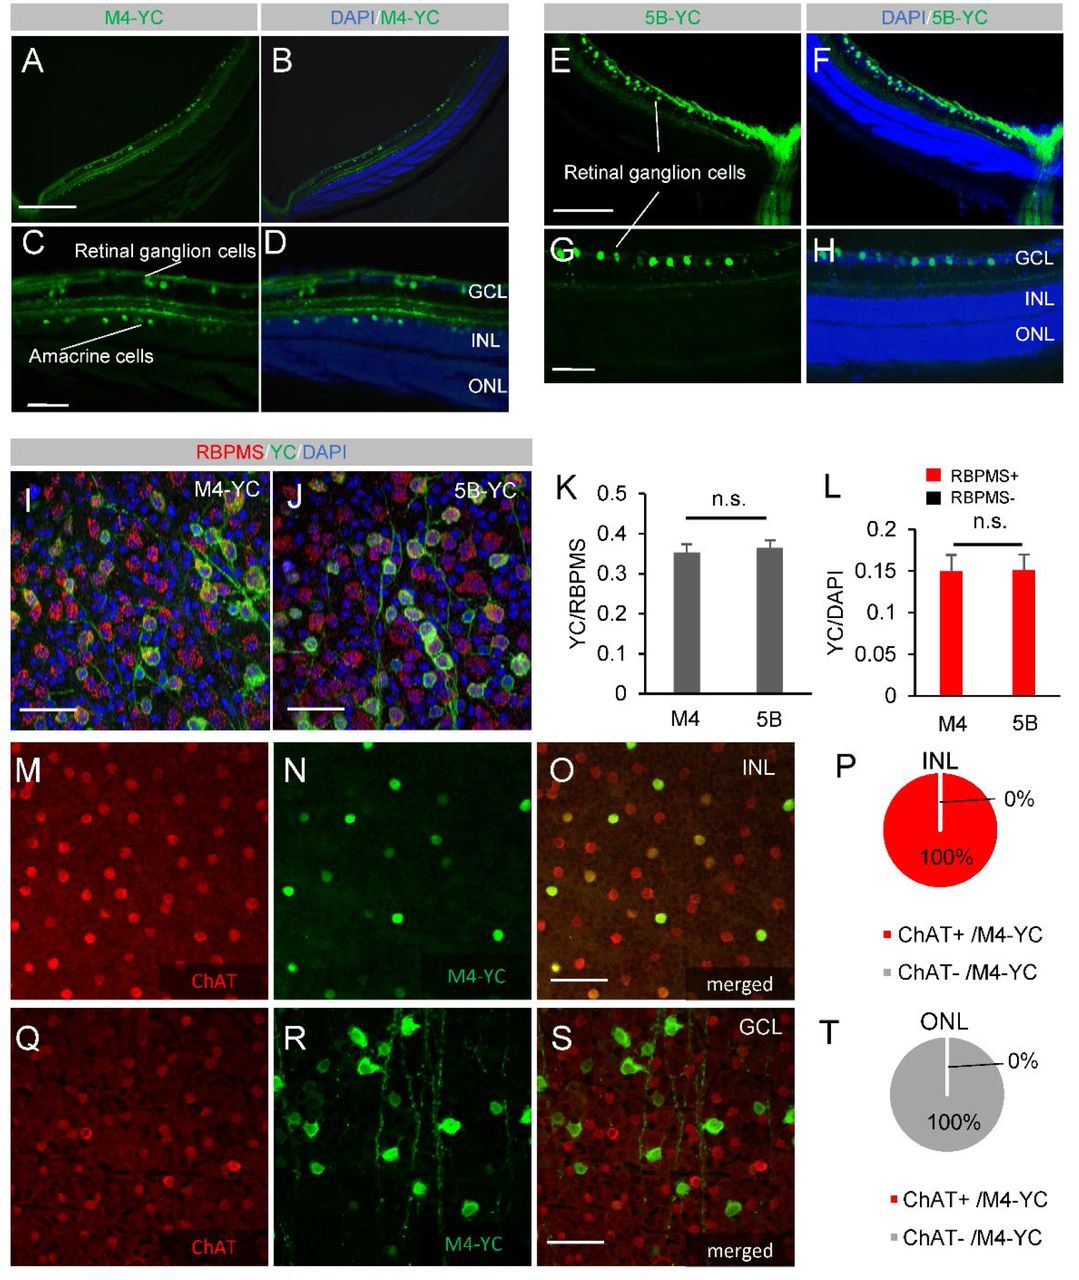
We employed two different mouse lines that express the gene encoding the tetracycline transactivation (tTA) protein under the control of a cell-type-specific promoter, muscarinic acetylcholine receptor 4 (Chrm4)15 or 5-hydroxytryptamine (5-HT, serotonin) 5B receptor (Htr5b)14 control region: Chrm4-tTA or Htr5b-tTA. These mice were further crossed with another transgenic mouse line containing the yellow Cameleon-Nano 50 (YC) fluorescent gene connected into the downstream of the tet operator (tetO) promoter 16. The YC gene expression was induced only by the presence of tTA protein in the double transgenic mice (Chrm4-tTA::tetO-YC (M4-YC) or Htr5b-tTA::tetO-YC (5B-YC)) (Figure S1A, B). The expression of YC was observed in the double transgenic mouse retina with a fluorescence microscope. In the M4-YC mouse retina, we identified the expression of YC in RGCs (Figure 1A-D, Figure S2A-E) and amacrine cells (Figure 1A-D, Figure S1E-F) with in vivo fluorescence microscopy and in sections. In the 5B-YC mouse retina, we identified the expression of YC in RGCs (Figure 1E-H) and the corneal stromal layer (Figure S2G-M) with in vivo fluorescence microscopy and in sections. In both lines, no expression was found in displaced amacrine cells, only RGCs were labeled in the ganglion cell layer, and the percentage of YC-positive cells in RGC marker RBPMS 17-positive cells was 35.4% (n=5) in M4-YC and 36.5% (n=5) in 5B-YC from RGCs, which were equivalent (Figure 1I-L, O-R, Figure S2M-Q). All of the amacrine cell expression in the M4 line was choline acetyltransferase (ChAT) staining-positive and consisted of starburst amacrine cells (SACs) (Figure 1M-T, Figure S3 A-L).

In the M4-YC mouse retina, we identified the expression of YC (green) in RGCs and amacrine cells within sections (A-D). In the 5B-YC mouse retina, we identified the expression of YC (green) in RGCs in sections (E-H). Coexpression of the RGC marker RBPMS in flat mounted retinas of M4-YC(I) and 5B-YC(J). Percentage of YC-positive cells in RBPMS-positive (K) or DAPI-positive cells (L) and RBPMS-positive cells in YC-positive cells (L) in both lines from confocal flat mounted GCL (n = 3 retinas each). Regions were chosen in each quadrant, and we obtained RBPMS, DAPI-positive, YC-positive, and co-labeled cells. Coexpression of the starburst amacrine cell marker ChAT in flat mounted retinas of M4-YC in INL (M-O) and GCL (Q-S). Percentage of ChAT-positive cells in YC-positive cells in M4-YC mice from INL (P) and GCL (R) (n = 3 retinas each). Error bars represent the SEMs. INL, inner nuclear layer; GCL, ganglion cell layer, ONL, outer nuclear layer.
Scale bar: 50 μm in (E). 100 μm in (B-D), (H), (I), (K), (M), (Q) and (R). 400 μm in (N). 500 μm in (F), (G), (O) and (P).
As a visual restoration model, the Chrm4-tTA and Htr5b-tTA line were crossed with tetO-channelrhodopsin2(E123T/T159C) (tetO-ChR2) mice 18 (Figure S1C). Chrm4-tTA::tetO-ChR2 (M4-ChR2) drove ChR2 expression in both RGCs and amacrine cells and Htr5b - tTA::tetO-ChR2 (5B-ChR2) only in RGCs in the retina. In the retinas of these double transgenic mice, photoreceptor degeneration was induced by intraperitoneal injection of N-methyl-N-nitrosourea (MNU) 19. MNU is an alkylating agent that causes DNA methylation in the O6 position of guanine, resulting in apoptosis, and it has been widely used to induce a pharmacological animal model of retinitis pigmentosa (RP). Two weeks after 75 mg/kg MNU administration into the mice at the age of 8 weeks, the outer nuclear layer containing photoreceptors was largely absent (Figure S4A, B), and the light-evoked response from photoreceptors was not detected by electroretinography (ERG) (Figure S4C).
M4-ChR2 mouse shows higher visual restoration effect
To evaluate the function of the channelrhodopsin ectopically induced in the transgenic mouse retinas, we performed multi-electrode array (MEA) recording, which can record extracellular potentials of RGCs (Figure S4D). As a result of photoreceptor degeneration induced with MNU treatment, the control retina without channel-rhodopsin expression (tetO-ChR2) showed no response from RGCs detected by MEA (Figure 2A). In contrast, the M4-ChR2 (Figure 2B) and 5B-ChR2 (Figure 2C) retinas showed obvious light-induced responses. After filtering with the Gaussian function (Figure 2D, E), the maintained response after the peak was significantly greater in M4-ChR2 mice than in 5B-ChR2 mice (Figure 2F), indicating that the light-evoked ON response in RGCs could be modified through the response from amacrine cells.

(A-C) Raster plots and peri-stimulus time histogram (PSTH) of light stimulation from MNU-treated tetO-ChR, M4-ChR2 and 5B-ChR2 mice. Light intensity was 13.6 log photons/cm2/s, and the duration was 1.0 second. (D, E) The averaged rate histogram after filtering with the Gaussian function from M4-ChR2 and 5B-ChR2 mice. The gray areas around the averaged traces represent the SEM. (F) Maintained-to-peak ratio of the spiking responses recorded. Maintained time frame is 0.4 to 1.0 seconds from light stimulation as shown in H (n = 7 retinas, 164 cells in MNU-treated M4-ChR2 mice, and n = 4 retinas, 127 cells in MNU-treated 5B-ChR2 mice). Error bars represent SEMs. ***p < 0.001. Student’s 2-tailed t-test. (G) Schematic image of VEP measurement. (H) Representative VEP traces from MNU-injected and control mice. (I) The average amplitude of the VEPs in the control tetO-ChR mice (n = 4), MNU-treated tetO-ChR mice (n = 8), M4-ChR2 mice (n = 14), and 5B-ChR2 mice (n = 12) at 10 weeks of age. It was stimulated with 100-ms pulses of white LED 4,000 cds/m2 light stimulus intensity. Signals were low-pass filtered at 300 Hz and averaged over the 60 trials. (J) Schematic image of the LDT. Mice were tested in a 30 × 45 × 30-cm box, containing equally sized bright (200 lx at ground level) and dark chambers connected by a 5 × 5-cm opening via, across which the mice could move freely. Visible mice feel uneasy in bright places, so staying time in the bright half gets shorter. (K) % time in bright half at 10 min of control (tetO-ChR2 mice) (n = 4), MNU-injected tetO-ChR2 mice (n = 8), MNU injected M4-ChR2 mice (n = 15), and MNU-injected 5B-ChR2 mice (n = 8) measured from LDT. All error bars represent the SEMs. *p < 0.05, **p < 0.01, ***p < 0.001. One-way ANOVA testing.
To investigate whether light reception on the retina is transmitted to the visual cortex, we then examined visual evoked potentials (VEPs) from the visual cortex (Figure 2G). The output from the retinal ganglion cells is sent through the axons of the retinal ganglion cells (optic nerve) to the lateral geniculate nucleus (LGN) of the thalamus, which is a region of the mesencephalon, from the LGN to the primary visual cortex (V1) in the occipital lobe of the cerebral cortex. VEPs were not detected in the control tetO-ChR2 mice with MNU treatment (Figure 2H, I). In contrast, VEPs were observed in both M4-ChR2 and 5B-ChR2 mice treated with MNU (Figure 2H, I). In response to the light stimulus at 4000 cds/m2, the average of the VEP amplitude in MNU-treated M4-ChR2 mice was significantly higher (143.6 μV; n=12, P=0.03) than in MNU-treated 5B-ChR2 (79.6 mV; n = 12) and the same level as in the mice without MNU treatment (155 μV; n=4). However, the shapes of the waveforms were irregular in both models compared to controls, and their physiological roles are unknown. Thus, there is a limitation in this direct comparison.
To validate the model system, we examined the MEA, ERG and VEP of M4-ChR2 and 5B-ChR2 in the absence of retinal degeneration (no MNU treatment and no mutation) as well. As a result of MEA, the peak response was significantly reduced in both lines and was further significantly reduced with MNU treatment (Figure S4E). A similar trend was observed for the maintained response, whereas it was maintained in the M4 line (Figure S4F). This finding suggests that channelrhodopsin gene induction into healthy RGCs interferes with the physiological retinal light response. In addition, in the control mice, not only the ON response but also the OFF response was confirmed. In contrast, the OFF response was significantly lost in the M4 line (Figure S4H). It is known that SACs in the INL are connected to off bipolar cells 20, which might be related to this change. As a result of ERG and VEP, both lines tended to have shorter latencies, especially in photopic examinations (Figure S5E, I, L, O), likely because of the channelrhodopsin response to strong light 9 and its photoreception in RGCs resulting in short latency 21. Although the amplitude of both ERG and VEP tended to be small in the 5B line (Figure S5C, G, M, N), these measurements were not significant, and there was no significant change in the shape of the waveforms.
Next, light-dark transition testing (LDT) was performed to investigate whether ectopic expression of channelrhodopsin in degenerative retinas leads to behavioral changes according to visual restoration. Rodents tend to stay in dark places according to their visual function since they are nocturnal and feel uneasy in bright environments (Figure 2J), while the visually disturbing MNU-treatment (Figure 2K) resulted in almost half of the staying time in bright and dark places (ratio in bright half at 10 min was closer to 0.5). In contrast, both the M4-ChR2 and 5B-ChR2 mouse lines with each MNU-treatment showed decreased staying time in bright places, indicating that visual restoration was confirmed in these models. Furthermore, M4-ChR2 mice showed significantly higher visual restoration effects than 5B-ChR2 mice (Figure 2K).
We also examined the optokinetic response (OKR) to investigate whether light receptivity in the retina restored by ectopic channelrhodopsin expression led to central reflex movement output. In OKR, a rotating striped pattern was displayed to the head-fixed mice to induce eye movements, and the velocity was measured to evaluate the integrity of the subcortical reflex circuitry of the mice (Figure S6A). OKR was not detected in the mice with MNU administration except for the M4 line (4.80 deg/sec, n=6) (Figure S6B).
This outcome seems to be due to lack of ChR2 expression in SACs, which play a key role in OKR 22, in the retinas of 5B-ChR2 mice. We also examined rd1 mice as a genetic animal model of RP. These mice have a nonsense mutation in the Pde6b gene leading to rapid degeneration of rod, photoreceptors followed by loss of cones 23,24. We used blind rd1 mutation mice at the age of 10-12 weeks for the following experiments. In the cases of rd1 mutant mice, no detectable OKR was observed in any combinations with each transgenic line, including M4-ChR2. To investigate the dissociation of OKR between the MNU-treatment and rd1 models, the retinal thickness was compared under the conditions used for the experiment. As a result, the total retinal thickness of rd1 mice (78.3 μm; n=9) was significantly thinner than that of MNU-treated mice (97.2 μm; n=10) evaluated on optical coherence tomography (OCT) (Figure S6C, D). This outcome was thought to be because the inner retinal layer was thinner of the rd1 mouse (Figure S6E). Indeed, the inner nuclear layer of the rd1, rd1;5B-ChR2 and rd1;M4-ChR2 mice was significantly thinner than that of the MNU-treated mice (Figure S6F), suggesting that SACs in the inner layer were degenerated. This result suggests that residual INL thickness and its durability might be potential limitations of optogenetic gene therapy in inherited retinal disease patients clinically.
Acetylcholine and gap junctions were involved in the maintained response
The M4-ChR2 mouse line, which showed transgene expression in amacrine cells in addition to RGCs, showed a higher maintained response and more effective visual restoration (Figure 2) than the 5B-ChR2 mice. Therefore, we investigated the neurocircuit pathway responsible for the enhanced response due to amacrine cells using neurotransmitter blockers on the MEA recording. Administration L-2-amino-4-phosphonobutyric acid (L-AP4), which is an agonist for group III metabotropic glutamate receptors, including mGluR6 working as a blocker of retinal ON-bipolar cells, did not show significant changes in either MNU-treated M4-ChR2 (Figure 3A-C) or 5B-ChR2 (Figure 3D-F) retinas, indicating that the photoresponse was not derived from photoreceptors. In contrast, administration of mefenamic acid (MFA) or carbenoxolone, an inhibitor of gap junctions, induced a significant decrease in the maintained response but not the peak of the response in the MNU-treated M4-ChR2 retina (Figure 3G-I, Figure S7A-C). This change was recovered after washout and not observed in the 5B-ChR2 retina (Figure S7D-F). SACs release GABA and acetylcholine 25. Thus, we also examined an inhibitor of GABA receptor (1,2,5,6-tetrahydropyridin-4-yl) methylphosphinic acid (TPMPA), and a cholinergic antagonist, atropine. As a result, no significant change was observed with administration of TPMPA (Figure S7G-I), but atropine administration showed a similar decrease in maintained response and in peak response in the MNU-treated M4-ChR2 mice (Figure 3J-L). In addition, to determine whether this change occurred via bipolar cells, an AMPA receptor antagonist, 6-cyano-7-nitro-quinoxaline-2,3-dione (CNQX), and an NMDA receptor antagonist, D(-)-2-amino-5-phosphonopentanoic acid (D-AP5), were administered. As a result, no statistically significant difference was observed, although there was a tendency toward a decrease in the maintained response (Figure S7J-L). SACs form synapses with bipolar cells, RGCs, and other amacrine cells 25–27. It is also known that amacrine cells are directly connected with RGCs through gap junctions 28,29, regulating neural circuits in the retina 30. Therefore, these results indicated that SACs enhanced the maintained response of RGCs directly or indirectly through acetylcholine and gap junctions.

(A, D, G, J) Mean ± SEM of exemplar cell response firing rate recorded during normal Ames’ medium superfusion (left), in synaptic block (middle), and after washout (right). MNU-treated M4-ChR2 mice with L-AP4 block (n = 3 retinas, 47 cells) (A), MNU-treated 5B-ChR2 mice with L-AP4 block (n = 3 retinas, 45 cells) (D), MNU-treated M4-ChR2 mice with MFA block (n = 3 retinas, 85 cells) (G), MNU-treated M4-ChR2 mice with atropine block (n = 3 retinas, 33 cells) (J). The gray areas around the averaged traces represent the SEM. (B, C, E, F, H, I, K, L) Averaged normalized peak firing rate and maintained rate. Maintained time frame is 0.4 to 1.0 seconds from light stimulation. Light intensity was 13.6 log photons/cm2/s.
All error bars represent the SEM. ***p < 0.001. One-way ANOVA and Tukey’s test.
MEA showed a visual restoration effect induced by ectopic ChR2 expression in the degenerative retina (Figure 2). These photoresponses obtained from MEA were all ON responses, as previously reported 10,31,32,33. Several slow photoresponses obtained from RGCs were considered to have an ipRGC origin 34, and they were excluded from the data. The MNU-treated M4-ChR2 retina showed a significant larger response in the maintained time phase compared to 5B-ChR2. As a result of a neurotransmitter blocking test (Figure 4), inhibition of acetylcholine and gap junctions decreased the maintained response of only M4-ChR2 retinas. The difference between M4-ChR2 and 5B-ChR2 was the presence or absence of ChR2 gene expression in SACs. Therefore, it was suggested that photoresponse from SACs enhanced the maintained response of RGCs, enhancing the visual restoration effect via acetylcholine and gap junctions.

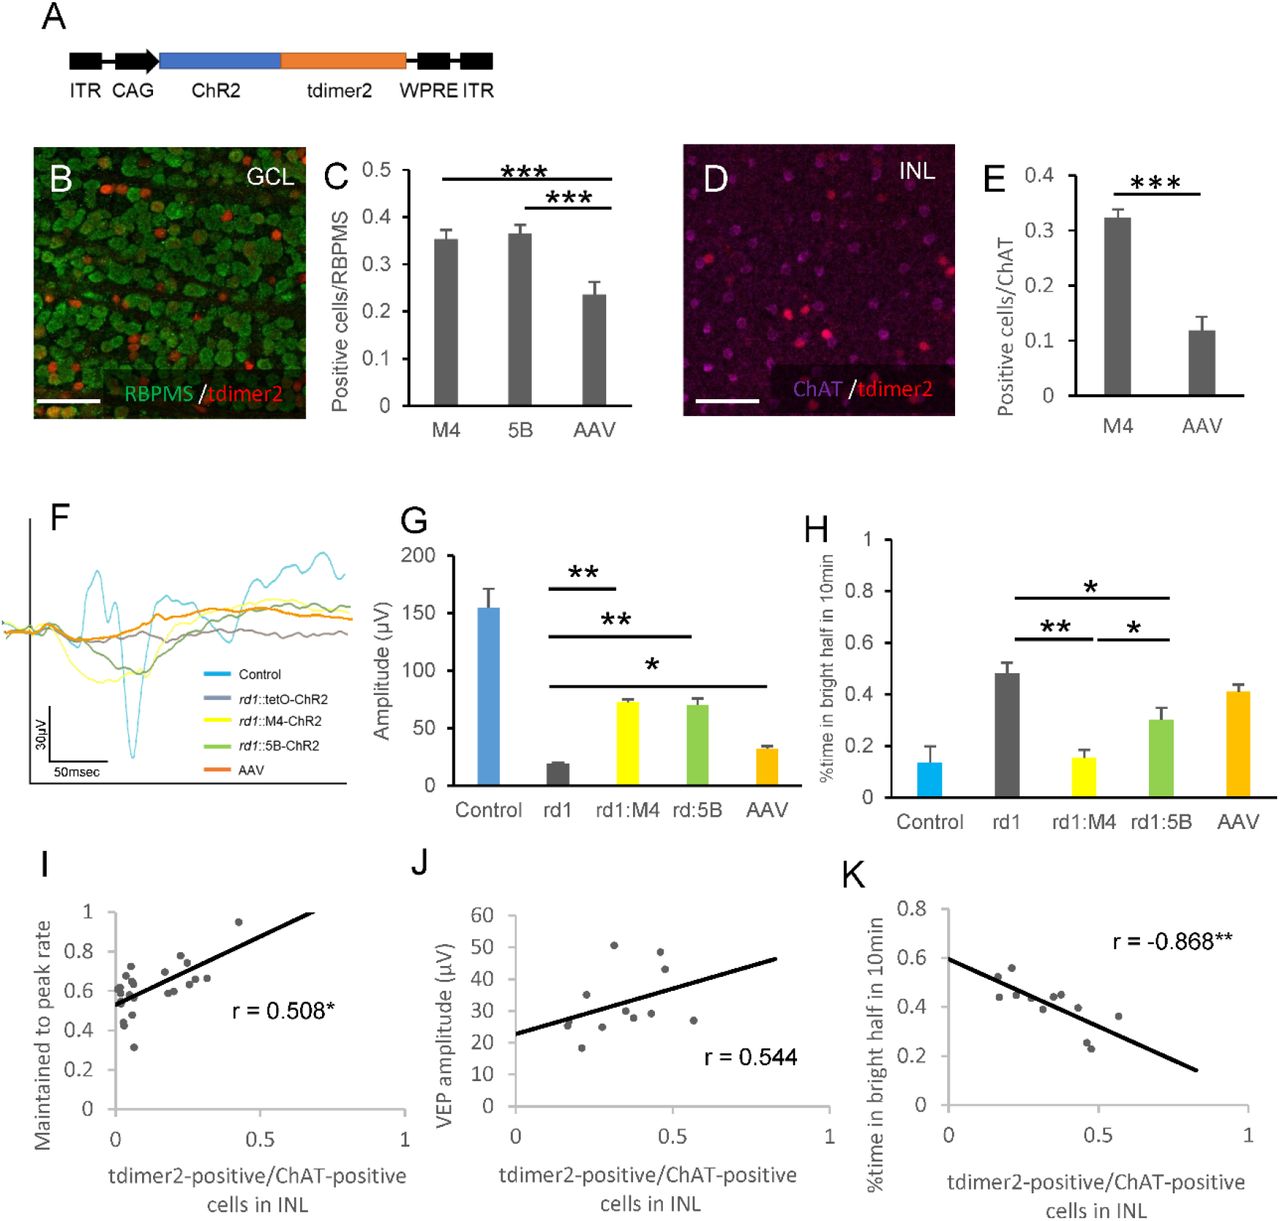
(A) The rAAV2–CAG-ChR2–tdimer2–WPRE expression cassette: ITR, inverted terminal repeat; WPRE, woodchuck hepatitis virus posttranscriptional regulatory element. (B-E) Coexpression of the RGC marker RBPMS (B) and starburst amacrine cell marker ChAT (D) and tdimer2 in flat mounted retinas of rAAV2–CAG–tdimer2–WPRE treated retinas in rd1 mice. (C, E) Percentage of YC-positive cells in M4-YC and 5B-YC mice and tdimer2-positive cells in rAAV-treated mice in RBPMS-positive (C) or ChAT-positive cells (E) from confocal flat mounted retina (n = 3 retinas each). Regions were chosen in each quadrant, and we obtained RBPMS, ChAT-positive, YC/tdimer2-positive, and co-labeled cells. (F, G) Average VEP traces (F) and quantification of its amplitudes (G) from control (tetO-ChR2) (n = 3), rd1::tetO-ChR2 (n = 6), rd1;M4-ChR2 (n = 12), rd1;5B-ChR2 (n = 12) and rAAV treated rd1::tetO-ChR2 mice (n = 12) at 10 weeks of age. It was stimulated with 100-ms pulses of white LED 4,000 cds/m2 light stimulus intensity. Signals were low-pass filtered at 300 Hz and averaged over the 60 trials. (H) % time in bright half at 10 min in control (tetO-ChR2) (n = 3), rd1::tetO-ChR2 (n = 6), rd1;M4-ChR2 (n = 12), rd1;5B-ChR2 (n = 12) and rAAV-treated rd1::tetO-ChR2 mice (n = 12) measured from LDT. (I-K) Correlation between transfection efficiency into SACs (tdimer2-positive cells/ChAT-positive cells in INL) and maintained to peak rate (I) (n = 24), VEP amplitude (J) (n = 24) and % time in bright half in LDT (K) (n = 12).
All error bars represent the SEMs. INL, inner nuclear layer; GCL, ganglion cell layer. Scale bars, 50 μm in (B), (D), n.s.: not significant, *p < 0.05, **p < 0.01, ***p < 0.001. unpaired t-test (E), Games-Howell test (C, G, H), Pearson’s correlation coefficient (I-K).
Induction efficiency into SACs tended to affect visual restoration
Finally, to investigate its clinical applicability, the effect of SACs on visual restoration was examined using rAAV2, which is already approved for gene therapy 35. We injected rAAV2-CAG-ChR2-tdimer2 intravitreally into rd1 mice and performed MEA, VEP, and LDT (Figure 4A, Figure S8A, B). In addition, we counted the number of transfected RGCs and SACs and analyzed their relevance to visual restoration effects. As a result of immunohistochemical labeling using RBPMS, the infection efficiency to RGCs was 24%, which was equivalent to previous reports (21-23%) 10,36,37, and significantly less than those of our transgenic mice (Figure 4B, C). The efficiency to SACs was 12%, which was also less than that of transgenic mice (Figure 4D, E). As a result of MEA recording, the peak response in the rAAV model was equivalent to that of both transgenic lines (Figure S8C), and the maintained response and its rate were equal to that of the M4 line (Figure S8D, E), perhaps because the input from various cell types other than SACs is also included in the rAAV model. This outcome suggests that the increase in the maintained response is not specific to gene transfer in SACs. Each average of the VEP amplitude in the rd1;M4-ChR2, rd1;5B-ChR2, and rAAV-treated rd1 mice in response to the light stimulus at 4000 cds/m2 was 72.7 μV (n=10), 70.4 μV (n=12) and 32.2 μV (n=12), respectively. These responses were significantly higher than those in rd1;tetO-ChR2 mice (19.1 mV; n=8) but smaller than those in the 8-week-old wild-type C57BL/6J mice (155 μV; n=4) (Figure 4F, G). There was no significant difference between rd1;5B-ChR2 and rd1;M4-ChR2 mice, and the VEPs of rAAV treated rd1 mice were smaller than those of them (Figure 4F, G). Even in the LDT results, the restoration effect of rAAV-treated rd1 mice tended to be lower than that of transgenic mice (Figure 4H), perhaps due to its infection efficiency, or the higher maintained response might not lead directly and simply to better visual restoration. In addition, the correlation between the infection efficiency of SACs in each rAAV-treated rd1 mouse and the visual restoration effect was investigated. The results showed a significant, positive correlation between the number of transfected SACs in the inner nuclear layer (INL) and the maintained to peak ratio in MEA (Figure 4I), a positive correlation between the VEP amplitude (Figure 4J) and a significant, negative correlation between the time spent in the bright half in LDT (Figure 4K). This outcome suggests that the maintained response in MEA is derived from SACs and that, clinically, including not only RGCs but also SACs is more effective for visual restoration. Although there is a limitation because infection efficiency is a confounding factor, there was no correlation between the number of transfected RGCs in GCL and the maintained to peak ratio in MEA (Figure S8F), and the correlation of the number of transfected SACs in the inner nuclear layer (INL) with the VEP amplitude (Figure 4J) and the time spent in the bright half in LDT (Figure 4K) was stronger than that with infection efficiency into RGCs (Figure S8G, H).
Discussion
In this study, we established transgenic mouse lines inducing gene induction in specific retinal cells using the tet-system (Figure S1). We identified that gene induction occurred in RGCs and SACs under the control of a muscarinic acetylcholine receptor Chrm4 promoter, whereas a serotonin (5-HT) Htr5b receptor control region led to induction only in RGCs in the retina (Figure 2). Among acetylcholine receptors expressed by all types of neurons in the retina 38–43, the Chrm4 muscarinic receptor is expressed in RGCs and amacrine cells 38,44. All of the amacrine cell expression in the M4 line was consisted of type-a SACs (Figure 1M-T, Figure S3 A-L). There are two subytpes of SACs, type-a and type-b (displaced SACs)45,46. This would be the first report of a transgenic line specific to only type-a but not type-b SACs.The 5-HT Htr5b receptor is expressed in rodents but not in humans 47. Although several types of 5HT receptors are expressed in the mouse retina 48, the retinal distribution of Htr5b receptor has not been previously described to our knowledge. We found that these gene inductions in both mouse retinas indicated that these strain are useful for examining the functions of RGCs and SACs.
Accumulating data have shown that the visual restoration strategy induced by optogenetic genes is a promising therapy for degenerative retinal diseases. Most of the amacrine cells are inhibitory neurons in the vertebrate retina, which have not been regarded much in the elementary visual restoration target. The results of this study showed that SACs increase the maintained response through gap junctions and contribute to enhancing the visual restoration effect. In particular, since the restoration effect of LDT and OKR was more significant than that of VEP, it might contribute to sustained behavior and direction recognition rather than transient response, consistent with the role of the maintained response in RGCs 49. Including the results using rAAV, in the current situation, viral delivery in primates is limited 31, and gene transfer involving amacrine cells, for example, using ubiquitous promoters, might be more effective in visual restoration than limiting RGCs in the clinical setting.
Methods
Key Resources Table


Animals
Transgenic mice used for the experiments and their genotyping protocols were generated as previously reported14. Mice homozygous for the retinal degeneration alleles Pde6brdl (C3H/HeJJcl, rd1) and WT C57BL/6J were obtained from CLEA Japan, Inc. Animals were maintained under 12-h light:12-h-dark conditions. For animals bred in house, littermates of the same sex were randomized to experimental groups. Mice used for the experiments were heterozygous for the tTA and tetO genes and homozygous for the rd1 gene. All of the animal experiments were conducted in accordance with protocols approved by Institutional Animal Care and Use Committee of Keio University School of Medicine.
tetO-YC (RBRC09550), tetO-ChR2 (RBRC05843), Chrm4-tTA (RBRC09551), and Htr5b-tTA (RBRC05445) are available from RIKEN Bioresource Center in Japan.
Study approval: All of the animal experiments were conducted in accordance with protocols approved by Institutional Animal Care and Use Committee of Keio University School of Medicine (#2808).
Immunohistochemistry
The protocol for immunohistochemistry was previously described. The retinas were incubated in PBS with 1% Triton X-100 and 0.5% Tween 20 for 1 h at room temperature and in 4% BSA for 1 h at room temperature and then incubated overnight at 4 °C with primary antibodies: RBPMS (1:500, Abcam, Cambridge, UK), ChAT (1:100, Abcam), VGLUT2 (1:100, Frontier Institute, Hokkaido, Japan), syntaxin (1:100, Abcam), tyrosine hydroxylase (1:100, Abcam) and Prox1 (1:100, AngioBio, San Diego, CA, USA) in blocking buffer. Secondary anti-rabbit, mouse and goat IgG, conjugated with Alexa TM488, TM594 and 633, respectively (1:1000; Molecular Probes), were applied for 1 h at room temperature. The retinas then were flat mounted, and the sections were mounted on slide glass.
Vector production and purification
pAAV-CAG–ChR2(E123T/T159C)-tdimer2–WPRE (Addgene, Watertown, MA) was used. Type 2 serotypes of rAAV vectors were prepared using the AAV Helper Free Packaging System (Cell Biolabs, San Diego, CA, USA). The serotypes were produced in HEK 293 cells using a helper virus-free system and were purified using two CsCl2 density gradients and titrated by quantitative polymerase chain reaction. Final preparations were dialyzed against phosphate-buffered saline (PBS) and stored at −80°C.
Virus injection
The mice were anesthetized with a combination of midazolam, medetomidine and butorphanol tartrate at doses of 4 mg/kg, 0.75 mg/kg and 5 mg/kg of body weight and placed on a heating pad that maintained their body temperatures at 35–36°C throughout the experiments. An aperture was made next to the limbus through the sclera with a 30-gauge disposable needle, and a 33-gauge unbeveled blunt-tip needle on a Hamilton syringe was introduced through the scleral opening into the vitreous space for intravitreal injections and introduced through the scleral opening along the scleral interior wall into the subretinal space for subretinal injections. Each eye received 1 μl of vehicle (PBS) or vector at a titer of 2.0 × 10¹¹ vg/ml.
Multielectrode array recordings
All of the procedures were performed under dim red light. The mice were anesthetized and euthanized by quick cervical dislocation. Following enucleation, the retina was dissected at room temperature in Ames’ medium bubbled with 95% O2/5% CO2 (A 1420; Sigma-Aldrich). The separated retina was placed on a cellulose membrane, and RGC was directed to the electrode and was gently contacted against MEA (MEA2100-Systems; Multi Channel Systems, Reutlingen, Germany) under suction pressure. During the experiment, the retinas were continuously perfused with Ames’ medium bubbling at 34 ° C. at a rate of 1-2 ml/min. Recorded signals were collected, amplified, and digitized using MC Rack software (Multi Channel Systems). Retinas were perfused for 30 min in darkness before recording responses. A 470-nm blue LED light at 1.0 × 10¹⁶ photons·cm−2·s−1 stimulus was used. L-(+)-2-amino-4-phosphonobutyric acid (L-AP4, ab120002; Abcam), (1,2,5,6-tetrahydropyridin-4-yl) methylphosphinic acid (TPMPA, Cat. No. 1040; Tocris Bio-Science), meclofenamic acid sodium salt (MFA, M4531; Sigma-Aldrich), atropine (A0132; MERCK) and carbenoxolone (C4790; MERCK) were newly diluted to 20 μM, 20 μM, 100 μM, 20 μM and 100 μM respectively. Stimulation was presented for 1 seconds at 60-second intervals. Signals were filtered between 200 Hz (low cutoff) and 20 kHz (high cutoff). A threshold of 40 μV was used to detect action potentials, and action potentials from individual neurons were determined via a standard expectation–maximization algorithm using Off-line Sorter software (Plexon, Dallas, TX, USA). The results were plotted using NeuroExplorer software (Nex Technologies Colorado Springs, CO, USA). Maintained-to-peak amplitude ratio was calculated by dividing the maintained response amplitude in maintaining time frame (0.4 to 1.0 seconds after light stimulation) by the peak amplitude (this ratio quantifies the sustenance of the response).
ERG analyses
Scotopic ERGs were recorded according to a previous report 50. Animals were dark-adapted for 12 h and prepared under dim red illumination. The mice were anesthetized with a combination of midazolam, medetomidine and butorphanol tartrate at doses of 4 mg/kg, 0.75 mg/kg and 5 mg/kg of body weight, respectively and were placed on a heating pad that maintained their body temperature at 35–36°C throughout the experiments. The pupils were dilated with a mixed solution of 0.5% tropicamide and 0.5% phenylephrine (Mydrin-P; Santen, Osaka, Japan). The ground electrode was a subcutaneous needle in the tail, and the reference electrode was placed subcutaneously between the eyes. The active contact lens electrodes (Mayo, Inazawa, Japan) were placed on the corneas. Recordings were performed with a PuREC acquisition system (Mayo). Responses were filtered through a bandpass filter ranging from 0.3 to 500 Hz to yield a- and b-waves. White LED light stimulations of 10.0 log cd-s/m2 were delivered via a Hemisphere LS-100 Stimulator (Mayo).
VEP analyses
The measuring electrodes were placed more than one week before the measurement. The mice were anesthetized with a combination of midazolam, medetomidine and butorphanol tartrate at doses of 4 mg/kg, 0.75 mg/kg and 5 mg/kg of body weight, respectively. The animals were placed in a stereotaxic holder. A stainless-steel screw (M1.0×6.0 mm) inserted through the skull into the both visual cortex (1.5 mm laterally to the midline, 1.5 mm anterior to the lambda), penetrating the cortex to approximately 1 mm, served as a measuring electrode.
At the time of the measurement, the mice were anesthetized again with the same doses. Visual stimuli were generated by a white LED placed 3 cm from the eye. It was stimulated with 100-ms pulses of white LED 4000 cds/m2 light stimulus intensity. Signals were acquired and analyzed with a PuREC acquisition system (Mayo). Signals were low-pass filtered at 300 Hz and averaged over the 60 trials.
OKR recording system
Protocols for eye movement recording and visual stimulation were previously described 51,52. Eye movements were recorded from both eyes of each animal separately. During the recording, the contralateral eye was covered by aluminum foil. The head of the mouse was fixed to an experimental steel board by the head-mounted stick for the LIM lens frames. The reflected images through a hot mirror (43957-J, Edmund) were recorded using an infrared CCD camera (BS-GV200, Libraly Inc., Tokyo, Japan). The images of the eye movements were processed and analyzed using software (Move-tr/2D, Libraly Inc., Tokyo, Japan). The sampling rate of the image was 200 Hz. The center of the pupil was detected by software. We calculated the speed of the eye movements on two-dimensional images and converted them to angular speeds using the AL of each eye. The spatial frequency was set as 0.125 cycles/degree, and the temporal frequency of the visual stimulus was 1.5 Hz. The motion onset delay (MOD) was set as 333 msec. Continuing the MOD, sinusoidal grating started to move clockwise in 5 sec. The intervals of visual stimulus were 60 sec. Eye movements were recorded three times for each experiment to exclude shaking images due to excessive body movements. Average velocities of the eye movements were calculated in the slow speed phase of their nystagmus.
LDT recording
Mice were tested in a 30 × 45 × 30-cm box, containing equally sized light and dark chambers connected by a 5 × 5-cm opening via which mice could move freely. The bright half of the box was illuminated from above by a white fluorescent light with intensity of 200 lux measured at the floor level. The animals were placed in the bright half and movement recorded (HD Pro Webcam C920, Logitech, Lausanne, Switzerland). A trial lasted 10 min, and then the testing apparatus was dismantled and cleaned with 70% ethanol. Videos were analyzed using ANY-maze tracking software and were validated by comparison with manual analysis. Time spent in the bright half was recorded.
Preparation of whole-mount samples and cryosections of retinas
Enucleated eyes were fixed for 20 min in 4% paraformaldehyde (PFA) in PBS and then dissected as previously described 53. The obtained tissues were post-fixed overnight in 4% PFA in PBS and stored in methanol at −20°C. Cryosections of retinas (12 mm) were prepared as previously described 54, after the eyeballs were immersed overnight in 4% PFA. Retinal sections were observed using a confocal microscope (LSM710; Carl Zeiss, Jena, Germany).
OCT Imaging
The thickness of the retina was analyzed by an SD-OCT system (Envisu R4310; Leica, Wetzlar, Germany) tuned for mice. The imaging protocol entailed a 3 mm×3 mm perimeter square scan sequence producing a single en-face image of the retina through a 50-degrees field of view from the mouse lens, following mydriasis. The en-face image consisted of 100 B-scan tomograms with each B-scan consisting of 1000 A-scans. The retinal thickness of 150 μm from the optic disc of each quadrant was measured.
Quantification and Statistical Analysis
All of the results are expressed as the mean ± SEM. The averaged variables were compared using the Student’s 2-tailed t-test and the Kruskal Wallis one-way ANOVA test. P-values of less than 0.05 were considered statistically significant.
Data and Software Availability
Raw MEA spike data were sorted offline to identify single units using Offline Sorter software (version 4.4.0)(Plexon). Spike-sorted data were analyzed with NeuroExplorer 5 software (version 5.115) (Nex Technologies).
Author Contribution
Y.K. and T.K. designed the research, wrote the manuscript, and performed the retinal histology, MEA, ERG and VEP recordings, and LDT experiments. K.K. performed AAV production. Y.K. and H.K. performed OKR recording. Y.K. performed data processing and analysis. H.O and T.K. made critical revisions of the manuscript. T.K. supervised the research.
Declaration of Interests
The authors declare no competing interests.
Acknowledgements
We would like to thank Prof. Amane Koizumi for critical comments to the manuscript. Y.K. is supported by grants from the Keio University Doctorate Student Grant-in-Aid Program. T.K. is supported by Grants-in-Aid from Takeda Science Foundation and the Keio University Medical Science Fund.
References


