

Abstract
Oxylipins are potent mediators requiring strict control. How they are removed en masse during infection/inflammation is unknown. Herein, lipopolysaccharide (LPS) dynamically increased their mitochondrial β-oxidation, impacting leukocyte bioactivity. Genetic/pharmacological targeting of CPT1 showed <50 oxylipins were robustly removed by macrophage mitochondria during inflammation in vitros and in vivo. Stable isotope-lipidomics demonstrated secretion-reuptake recycling for 12-HETE and its intermediate metabolites. Oxylipin β-oxidation was uncoupled from oxidative phosphorylation. Transcriptional interrogation of human neonatal sepsis revealed significant upregulation of many candidates, encoding proteins for mitochondrial uptake and β-oxidation of long-chain fatty acyls (ACSL1,3,4, ACADVL, CPT1B, CPT2, HADHB). ACSL1/Acsl1 upregulation was a signature in multiple human/murine macrophage datasets. In summary, mitochondrial β-oxidation is a regulatory metabolic checkpoint for oxylipins during infection. This has implications for patients with CPT1 deficiency, at higher risk of mortality during respiratory infections. We propose that mitochondrial β-oxidation capacity to remove oxylipins during infection may directly influence development of inflammation.
Introduction
Oxygenated polyunsaturated fatty acids (oxylipins), including eicosanoids and prostaglandins, are essential bioactive lipid mediators during inflammation/infection. There are generated by cyclooxygenases (COX), lipoxygenases (LOX) or cytochrome P450s (CYP), expressed in a variety of tissues [1–10]. They signal through binding and activation of G protein-coupled receptors at sub nM concentrations [1, 5–16]. Oxylipins require deactivation, however our understanding of how this is regulated during infection is poor. Systemic pathways for individual oxylipins, including thromboxane, prostacyclin and hydroxyeicosatetraenoic acids (HETEs) were uncovered in healthy humans decades ago [17–20]. There, infusion of exogenous labelled lipids enabled determination of half-life and metabolites, some of which appear immediately, slowly disappearing over several minutes [21]. Urinary metabolite analysis became the gold standard for whole body oxylipin analysis. Separately, peroxisomal β-oxidation of individual eicosanoids was explored using liver microsomes. There, partial β-oxidation revealed truncated products termed dinors (minus 2C) and tetranors (minus 4C). These were identified as stable intermediates in tissue, plasma and urine [21].
Aside from peroxisomes, mitochondria contain fully competent β-oxidation machinery, used for the first steps of FA-dependent energy metabolism, FA oxidation (FAO) [22, 23]. Here, FA are converted to acetyl-CoA which enters the tricarboxylic cycle (TCA) providing substrates for oxidative phosphorylation (OxPhos) [24]. Although mediated by distinct enzymes to peroxisomes, mitochondrial β-oxidation also involves sequential removal of 2-carbon fragments from the carboxyl terminus. More recently, significant interest in how mitochondrial FAO supports immunity has developed, particularly relating to T cells and macrophages[25, 26]. Saturated FA such as palmitate or stearate are considered the main substrates, however oxylipins generated abundantly during inflammation, have not been considered [19]. We recently showed that endogenously-generated platelet oxylipins are removed by carnitine palmitoyltransferase-1 (CPT1), the mitochondrial import protein for FAs [27]. However, it is not known whether mitochondria also remove oxylipins in macrophages, nor how this might be regulated by inflammation/infection, if this impacts lipid signaling, and if it supplies acetyl-CoA to OxPhos. These are important questions, since macrophages generate large amounts of diverse oxylipins during inflammation/infection, as well as being exposed to them from inflamed stroma. Currently there is significant interest in how mitochondrial respond to inflammation, and their role in immunometabolism[26, 28, 29]. The traditional view is that M1(LPS) mitochondrial OxPhos is shut down in favor of increased glycolysis, along with increased synthesis of FA [30].
In this study, oxylipin uptake into macrophage mitochondria was revealed as a dynamic process stimulated by inflammation (LPS +/−IFNγ) operating independently of OxPhos and reducing extracellular oxylipin secretion. Using 12-HETE and transcriptional data from multiple sources, a metabolic β-oxidation network for the parent and two tetranor metabolites was revealed. Importantly, modulating oxylipin levels was sufficient to impact on their signaling. Thus, we reveal how oxylipins are consumed by macrophage mitochondria, suggesting that targeting this could represent a route to regulate inflammation. Furthermore, oxylipin levels may be impacted if mitochondrial function is compromised during infection, directly contributing to ensuing damaging host inflammatory responses. Our findings also have implications for humans with the rare genetic disorder CPT1 deficiency, where affected children are at elevated risk of hospitalization and death during respiratory infectious episodes[31–33].
Results
Inhibition of CPT1 prevents secretion of diverse peritoneal oxylipins in vivo
Mitochondrial β-oxidation of native long chain FA requires uptake of their FA-CoA derivatives via the outer membrane transporter, carnitine palmitoyltransferase-1 (CPT1), of which there are three isoforms, a,b,c. However, whether oxylipin species can be imported via CPT1 in macrophages is unknown. To test this in vivo, the pan CPT1 inhibitor etomoxir was injected IP into wild type C57BL/6 mice alone or with the bacterial lipid lipopolysaccharide (LPS 1 μg), then peritoneal lavage harvested after 6 hrs, and analyzed using LC/MS/MS. A large number of oxylipins were detected in cell-free supernatant with several showing strong elevations in response to LPS alone (Figure 1). These are broadly categorized into lipids from 12/15-LOX, COX-1/2 or CYP450, although some are from more than one pathway (Supplementary Table 1). Specialist pro-resolving mediators (SPM) such as resolvins or protectins were not conclusively detected. For maresin1 (7R,14S-diHDOHE), two peaks were seen with one having the same retention time as the authentic standard (Supplementary Figure 1 A). However, it wasn’t possible to generate a convincing MS/MS spectrum from tissues, that matched standard. The presence of two isomers suggests diastereomers of 7,14-di-HDOHE, and the peaks may also contain co-eluting stereoisomers. Thus, this lipid is named 7,14-diHDOHE.

Wild type mice (female, 7-9 weeks) were injected ip with vehicle (PBS), etomoxir (100 μ-g) or LPS (1 μg). After 6 hrs, lavage was harvested and lipids extracted using SPE then analyzed using LC/MS/MS as outlined in Methods. Panel A. Lipidomics reveals the impact of CPT1 on oxylipin metabolism. A heatmap was generated using Pheatmap as described in Methods, with data as log10 ng/total mouse lavage for all oxylipins (n = 10, * p<0.05, Students T-test, black: significant elevation, green: significant reduction). Panel B. Box and whisker plots for individual lipids showing that inhibition of CPT1 enhances oxylipin levels, with a bigger impact during inflammatory challenge with LPS. A series of example lipids from 12/15-LOX, COX and CYP450 are shown (n = 10, * p < 0.05, ** p< 0.01, *** p < 0.005, Students T-test, for with/without etomoxir), outliers are shown in red.
Etomoxir stimulated small increases in several oxylipins, however when included with LPS, a far stronger impact was seen, and many lipids were effectively doubled (Figure 1 A,B). This suggests that peritoneal mitochondria actively metabolize bioactive oxylipins in health, but following an acute infectious stimulus, their role is significantly enhanced (Figure 1 A,B).
CPT1 regulates metabolism of endogenously-generated oxylipins by peritoneal macrophages
In vivo, peritoneal oxylipins could be metabolized by mitochondria in resident macrophages, B cells and/or peritoneal membrane (mesothelium). Naïve resident macrophages, which express COX-1 and 12/15-LOX (Alox15), are likely to be the primary basal source [34]. Thus, naïve peritoneal macrophages from wild type or Alox15−/− mice were assessed for mitochondrial removal of endogenously oxylipins. We focused on secreted forms, since most are released to activate GPCRs extracellularly. No serum was present, since this contains significant amounts of oxylipins. LPS (24 hrs) robustly stimulated prostaglandin and thromboxane secretion by naïve resident peritoneal macrophages, consistent with COX-2 induction (Figure 2 A-C,E). Although 12/15-LOX is highly expressed in naïve peritoneal macrophages, its loss in culture leads to relatively low generation of monohydroxy FA (12-HETE and 12/15-HEPEs), with these being absent in Alox15−/− macrophages (Figure 2 D) [35]. Overall, oxylipin species generated by peritoneal macrophages were similar to those in lavage, although the total number/diversity was less with fewer CYP-derived species and no SPMs detected (Figures 1,2).

Peritoneal macrophages were isolated as described in Methods, then cultured in serum-free medium in the presence of etomoxir (25 μ-M) with/without LPS (100 ng/ml). After 24 hrs, supernatant was harvested and lipids extracted using SPE, then analyzed using LC/MS/MS. Panel A. Heatmap shows that many lipids are elevated when CPT1 is inhibited. A heatmap was generated using Pheatmap as described in Methods, with data as log10 ng/106 for all oxylipins (n = 3, * p<0.05, Students T-test, black: significant elevation, green: significant reduction). Panels B-E Bar charts for individual lipids showing impact of etomoxir +/−LPS on oxylipin release by peritoneal macrophages in vitro. A series of lipids based on enzymatic origin are shown, n = 3 per sample, mean +/−SEM, * p < 0.05, ** p< 0.01, *** p < 0.005, Students T-test, for with/without etomoxir.
Etomoxir significantly increased macrophage secretion of several mono-hydroxy lipids and COX-2 products (Figure 2 B-E). This indicates that both their formation and removal is increased by inflammation, similar to in vivo (Figure 1). Alox15 deletion did not impact COX-2 product levels indicating lack of substrate competition between LOX and COX (Figure 2 B,C,E). 12-HETE, 12-HEPE and 15-HEPE increased with etomoxir in WT cells but were suppressed by LPS likely due to inflammation-associated loss of 12/15-LOX during the 24 hr culture (Figure 2 D) Importantly, in vivo or in vitro, COX-2 and 12/15-LOX products were consistently increased by CPT1 inhibition.
Several mono- and di-hydroxy oxylipins were only detected when CPT1 was blocked indicating that their mitochondrial metabolism exceeds their generation (Figure 2 F,G). Thus, CPT1 prevents their secretion under basal and inflammatory conditions. On the contrary, during LPS challenge, the eicosapentaenoic acid (EPA) product 17,18-diHETE, generated by soluble epoxide hydrolase oxidation of CYP-derived 17,18-EET, was suppressed by etomoxir (Supplementary Figure 1 B). Overall, these data indicate that peritoneal macrophage oxylipin generation by 12/15-LOX or COX-2 is dynamically counterbalanced by CPT1-mediated uptake into mitochondria, dampening their extracellular secretion. However, CYP-derived lipids show the opposite, requiring CPT1 for their formation. Potential reasons could include that β-oxidation generates essential substrates for FA synthase (FAS)/elongase activities required for oxylipin polyunsaturated FA (PUFA) substrate generation (see discussion).
Bone marrow derived macrophages consume diverse oxylipins from serum
Macrophages are exposed to oxylipins from other immune or stromal cells during inflammation. Serum contains numerous oxylipins from 12-LOX and COX-1, primarily mono-hydroxy isoforms and thromboxane, generated by white cells and platelets, but few prostaglandins (PGs). It is a physiological biofluid formed during innate immunity thus metabolism of serum oxylipins could impact their signaling at local or systemic sites. To examine this, we tested primary murine bone marrow-derived cells differentiated to macrophages, then then treated with M-CSF, LPS/IFNγ or IL-4 (henceforth referred to as M0, M1 and M2) respectively as in vitro of models for macrophage inflammation [36]. All macrophage phenotypes consumed significant amounts of exogenous mono-hydroxy oxylipins from 10 % serum-containing medium, including 12-HETE/12-HEPE (12-LOX, generated by platelets), 5-HETE/5-HEPE (5-LOX, generated by neutrophils) and 9-/13-HODEs (Figure 3 A-C). 11-HETE/11-HEPE and 15-HETE/15-HEPE were removed by M0(M-CSF) and M2(IL-4) cells, however they appeared higher or unchanged for M1(LPS/IFNγ, since they were simultaneously generated by COX-2, induced by LPS/IFNγ(Figure 3 A,B). Furthermore, M1(LPS/IFNγ cells secreted large amounts of PGs and thromboxane due to COX-2, causing a net increase in their extracellular levels. (Figure 3 D-E). Thus, the overall pattern was consumption of serum oxylipins by all macrophage populations, coupled with simultaneous generation of COX-2 PGs by M1(LPS/IFNγ. Last, low dose etomoxir (25 μ-M) significantly increased PGs released by M1(LPS/IFNγ cells (Figure 3 F). Overall, this demonstrates that mitochondrial uptake of PGs suppresses their secretion from classic inflammatory BMDM cells (M1(LPS/IFNγ), in the same manner as seen with naïve peritoneal macrophages and in vivo with LPS peritonitis, while all BMDM cell types consume significant amounts of HETEs and HEPEs.
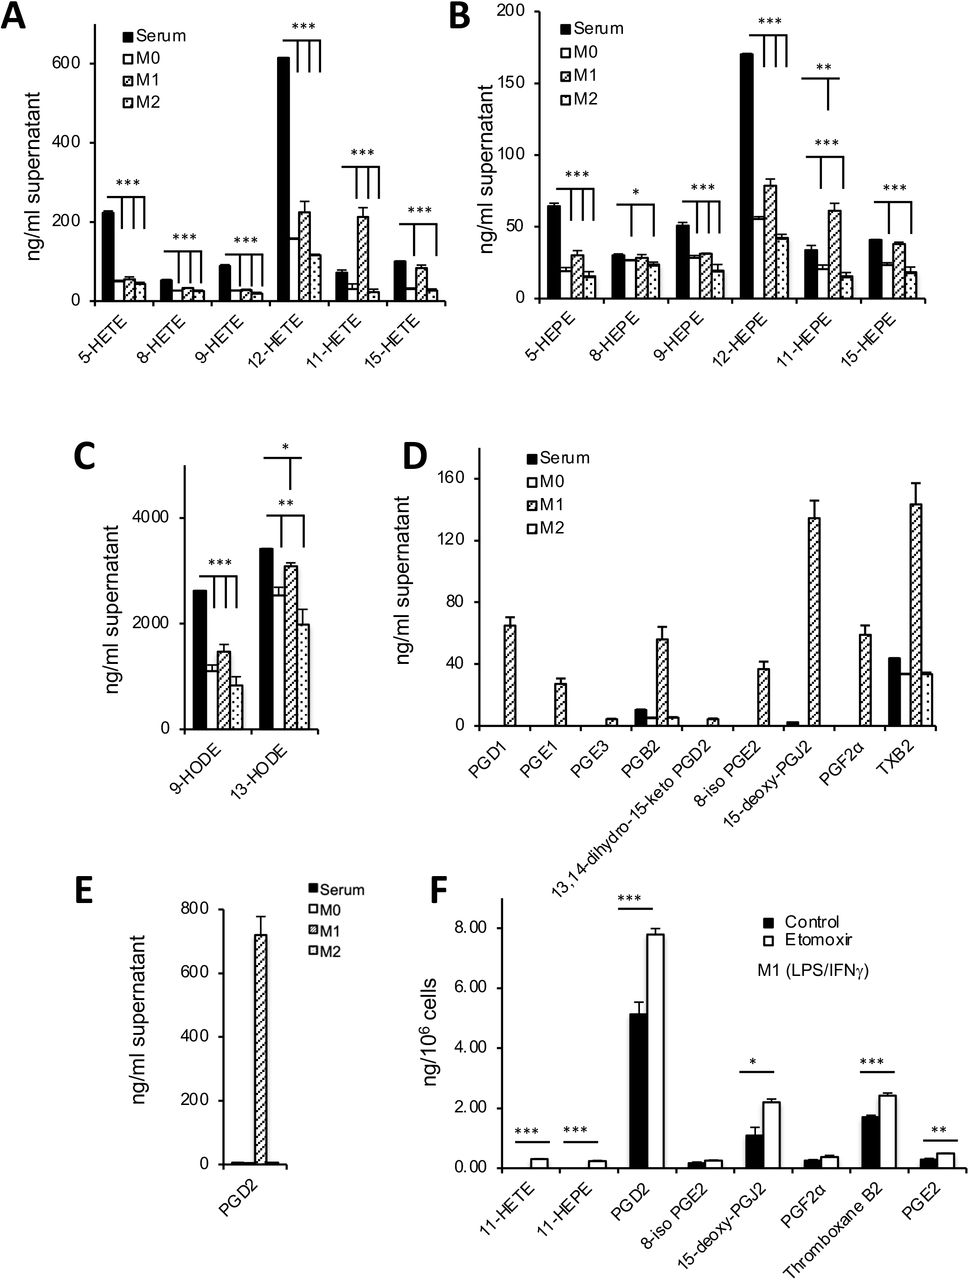
Panels A-C. Serum derived mono-hydroxy oxylipins are metabolized by M0, M1 and M2 cells. BMDM-derived M0, M1, and M2 cells were derived during a 24 hr culture in medium containing 10 % FCS, as described in Methods, then supernatant extracted and analyzed for mono-hydroxy oxylipins using LC/MS/MS as described in Methods (n = 3, mean +/−SEM. * p < 0.05, ** p < 0.01, *** p < 0.005, Students T test, cells versus media). Panels D,E. M1 cells robustly generate prostaglandins and related oxylipins, that are low abundance in serum. BMDM-derived cells were treated as in Panel A, and supernatants analyzed for prostaglandins. (n = 3, mean +/−SEM). Panel F. M1 cell secretion of prostaglandins is increased by CPT1 inhibition. BMDM-derived M1 cells were treated in the absence (control) or presence (etomoxir) of etomoxir (25 μM) for 24hr. Here, FCS-free medium was used to avoid contaminating oxylipins from serum (n = 3, mean +/−SEM. * p < 0.05, *** p < 0.005 with/without etomoxir, Students T test).
Dynamic control of oxylipins by CPT1 during inflammatory challenge in RAW macrophages
Next, we switched to RAW cells, a model for macrophage inflammatory responses in vitro, highly amenable to genetic modification. RAW cells do not express 12/15-LOX, therefore cells stably overexpressing Alox15 (RAWAlox15) were generated. Basally, neither RAW or RAWAlox15 cells secreted many oxylipins, with only 9/13-HODE, two PGs, and two di-hydroxy products of CYP released in low amounts (Figure 4 A). LPS (24 hrs, 100 ng/ml) stimulated robust secretion of many oxylipins including several PGs (COX-2) 9/13-HODEs, and 11- and 15-HETEs, HETrEs and HEPEs (likely COX-2) (Figure 4 A). The primary 12/15-LOX products 12-HETE and 14-HDOHE were only detected in RAWAlox15 cells, and their generation was increased by LPS (Figure 4 A.B).

Panel A. A heatmap was generated using Pheatmap as described in Methods. Rawmock and RawAlox12 cells were cultured with etomoxir (25 μ-M) and/or LPS (100 ng/ml) for 24 hr before harvest and SPE extraction of supernatant for oxylipin analysis using LC/MS/MS. Data are shown as log10 ng/106 values for all oxylipins. (n = 6, * p < 0.05, Students T test, black: significant elevation, green: significant reduction). Panels B-F. Blockade of CPT1 leads to significant elevation of 12/15-LOX-derived oxylipins in Raw cells. Bar charts showing how oxylipins from 12/15-LOX are impacted by etomoxir (n = 6, mean +/−SEM). Panels G-H. Etomoxir reduces secretion of COX-2 derived oxylipins in RAW cells (n = 6, mean +/−SEM). * p < 0.05, ** p < 0.01, *** p < 0.005 for with/without etomoxir, Students T test.
CPT1 inhibition had little impact on basal oxylipin secretion (Figure 4 A). However, it significantly elevated LPS-dependent generation of mono-hydroxy FA (HETEs, HDOHEs, HETrEs and HODEs) from RAWAlox15 cells (Figure 4 B-F). These data indicate that secreted oxylipins normally represent only a fraction of the overall amounts made by 12/15-LOX, with large amounts dynamically removed by mitochondria. Thus, LPS increases CPT1-mediated removal of 12/15-LOX products, similar to in vivo and peritoneal macrophages (Figures 1,2). Here, many are primary 12/15-LOX products (12-HETE, 14-HDOHE), while others (9-HOTrE, 9-HODE), may be biproducts of secondary propagation reactions. In etomoxir/LPS-treated RAWAlox15 (but not RAW cells), a lipid suggestive of resolvinD5 (7S,17S-diHDOHE) was seen, however of the two peaks detected, only one matched the retention time of the authentic standard (Supplementary Figure 1 C,D). The lipid was very low abundance, and it was not possible to generate a reliable MS/MS spectrum from cell supernatants. As there were two peaks, they may represent diastereomers of 7,17-di-HDOHE, and the individual peaks may also contain co-eluting stereoisomers. Thus, we labelled this 7,17-diHDOHE and suggest it arises from non-enzymatic oxidation. No SPMs were detected in any other samples from RAW or RAWAlox15 cells.
Several COX-2 derived PGs and 17,18-diHETE (CYP) were significantly decreased by etomoxir (Figure 4 G,H, Supplementary Figure 1 E). This mirrored the impact of CPT1 inhibition on peritoneal macrophage 17,18-diHETE (Supplementary Figure 1 B). Overall, LOX products were consistently elevated by etomoxir in RAW cells or all primary macrophages tested, however for RAW cells both COX and CYP-derived lipids were instead suppressed.
Exogenous 12-HETE is metabolized to diene and triene tetranor metabolites via mitochondrial and non-mitochondrial β-oxidation in RAW cells
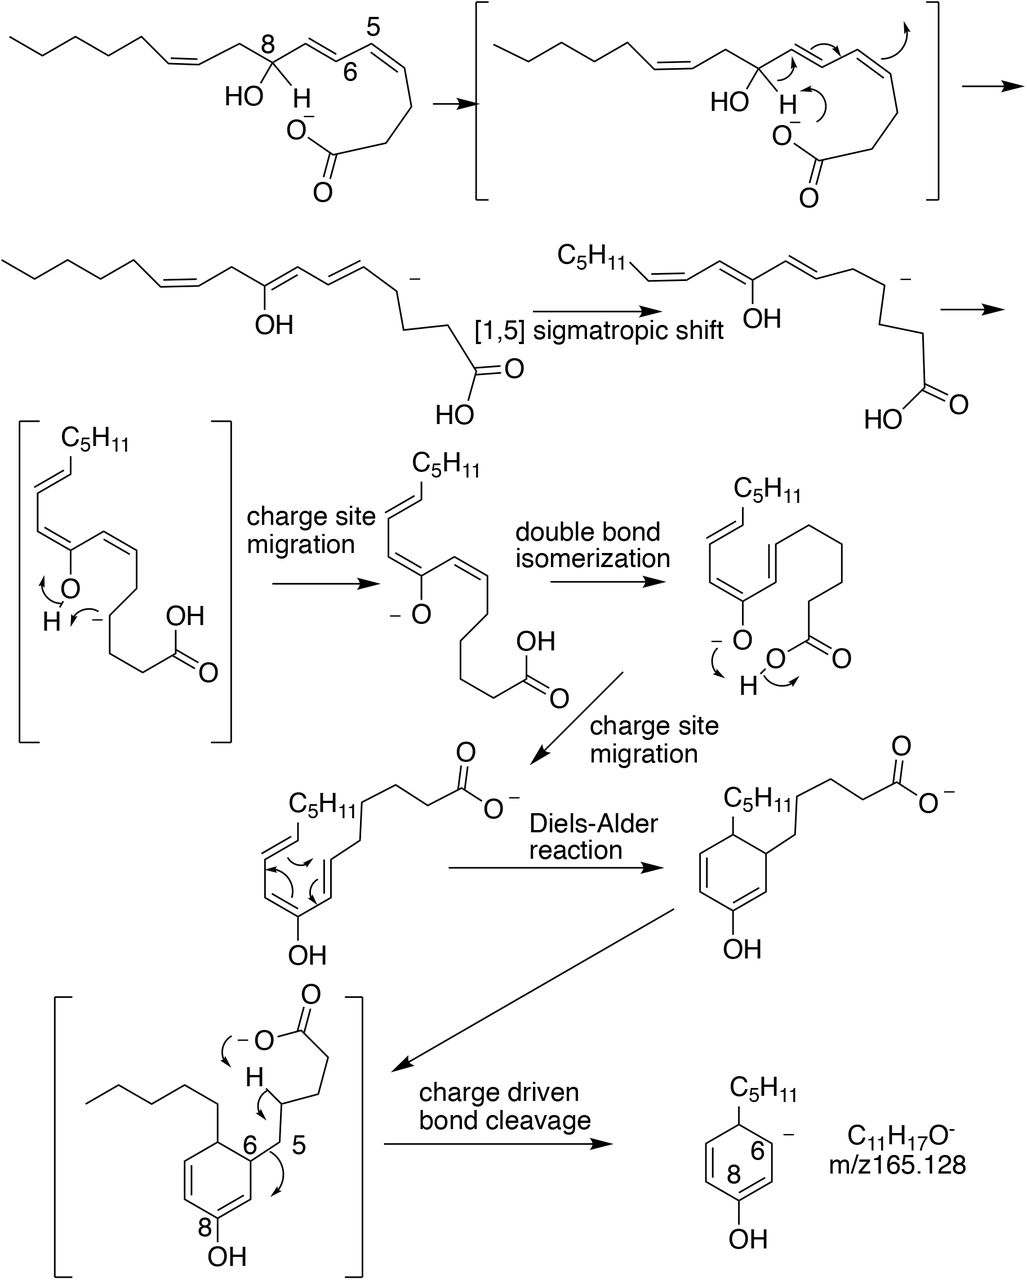
To determine the fate of oxylipins removed by CPT1, we examined metabolism of exogenous 12-HETE by RAW macrophages. 12(S)-HETE was rapidly removed following LPS-stimulation, coinciding with formation and subsequent metabolism of two tetranor 12-HETEs (Figure 5 A-C). These were confirmed by MS/MS as a triene, 8-hydroxy-4Z,6E,10Z-hexadecatrienoic acid (comparison with authentic standard), and a diene, proposed as 8-hydroxy-6,10-hexadecadienoic acid (through comparison with [37]) (Supplementary Figure 2 A-C). Both will be 8(S) since they originate from 12(S)-HETE. As confirmation, 12(S)-HETE-d8 was added to RAW cells (3 hrs), and a deuterated diene was detected (Supplementary Figure 2 D,E). The MS/MS fragmentation of these lipids is shown (Schemes 1-3). For the tetranor diene, fragmentation matched expected gas phase chemistry of hydroxylated FAs, where cleavage occurs next to the hydroxyl group (Schemes 2,3). For the triene, a daughter ion at m/z 165.1 was seen, with high resolution MS/MS of the standard confirming this as C11H17O (Supplementary Figure 3 A,B, Scheme 1). NMR for the triene is shown in Supplementary Figure 4. Almost all triene and diene was detected extracellularly, and over 4-8 hrs, both disappeared from supernatant and cell pellets (Figure 5 B,C). This reveals that macrophages generate and secrete primary and secondary metabolites of HETEs, but then re-internalize them for further metabolism. We next incubated triene tetranor 12(S)-HETE with RAW macrophages, and after 3 hrs, the diene was detected extracellularly (Supplementary Figure 3 B). This indicates that diene forms via saturation of the triene, confirming the structure as 8(S)-hydroxy-6E,10Z-hexadecadienoic acid.

Panel A. 12-HETE is rapidly consumed and converted to two tetranor 12-HETE metabolites by RAW cells. RAW cells were cultured for up to 12 hr in serum free medium with 1.4 μg 12(S)-HETE added per 106 cells. At varying timepoints, samples were harvested and lipids extracted and analyzed using LC/MS/MS as described in Methods. Panels D-I. CPT1 inhibition prevents metabolism of 12(S), 12(R)-HETEs and their tetranor triene and diene metabolites. Panels D,F,H. Etomoxir prevents metabolism of 12(S)-HETE and its metabolites. Cells were supplemented with 1.5 μg 12(S)-HETE/106 cells were added for 3 hrs with/without etomoxir (25 μ-M), then supernatants and cells were analyzed for levels of 12-HETE and its triene and diene tetranor products. Panels E,G,I. Etomoxir prevents metabolism of 12(R)-HETE and its metabolites. Cells were supplemented with 1.5 μg 12(R)-HETE/106 cells for 3 hrs with/without etomoxir (25 μ-M), then supernatants and cells were analyzed for levels of 12-HETE and its triene and diene tetranor products (n = 4, mean +/−SEM. * p < 0.05, *** p < 0.005 with/without etomoxir, Students T test).
Next the impact of CPT1 inhibition on metabolism of exogenous 12-HETE was tested. Both 12(S) and 12(R) isomers were used to determine the impact of chirality. For 12(R)-HETE, the tetranors will be 8(R)-hydroxy. 12-HETE was rapidly removed by LPS-stimulated RAW cells, with around 0.15% or 0.4% remaining after 3 hrs for S or R enantiomers respectively (Figure 5 D,E). Cellular and supernatant 12(S)- and (R)-HETEs were increased by CPT1 inhibition, although the primary removal appeared to be non-mitochondrial since only a small amount was recovered (Figure 5 D,E). As before, most 12-HETE was extracellular, although intracellular and supernatant levels were both increased by etomoxir. 12-HETE was efficiently converted to tetranor trienes and dienes, which were detected mainly outside (Figure 5 F-I). These were around 5-8-fold increased by CPT1 blockade, confirming that they are also dynamically metabolized by mitochondria in LPS-stimulated macrophages
CPT1a gene silencing confirms dysregulation of oxylipin secretion in RAW cells
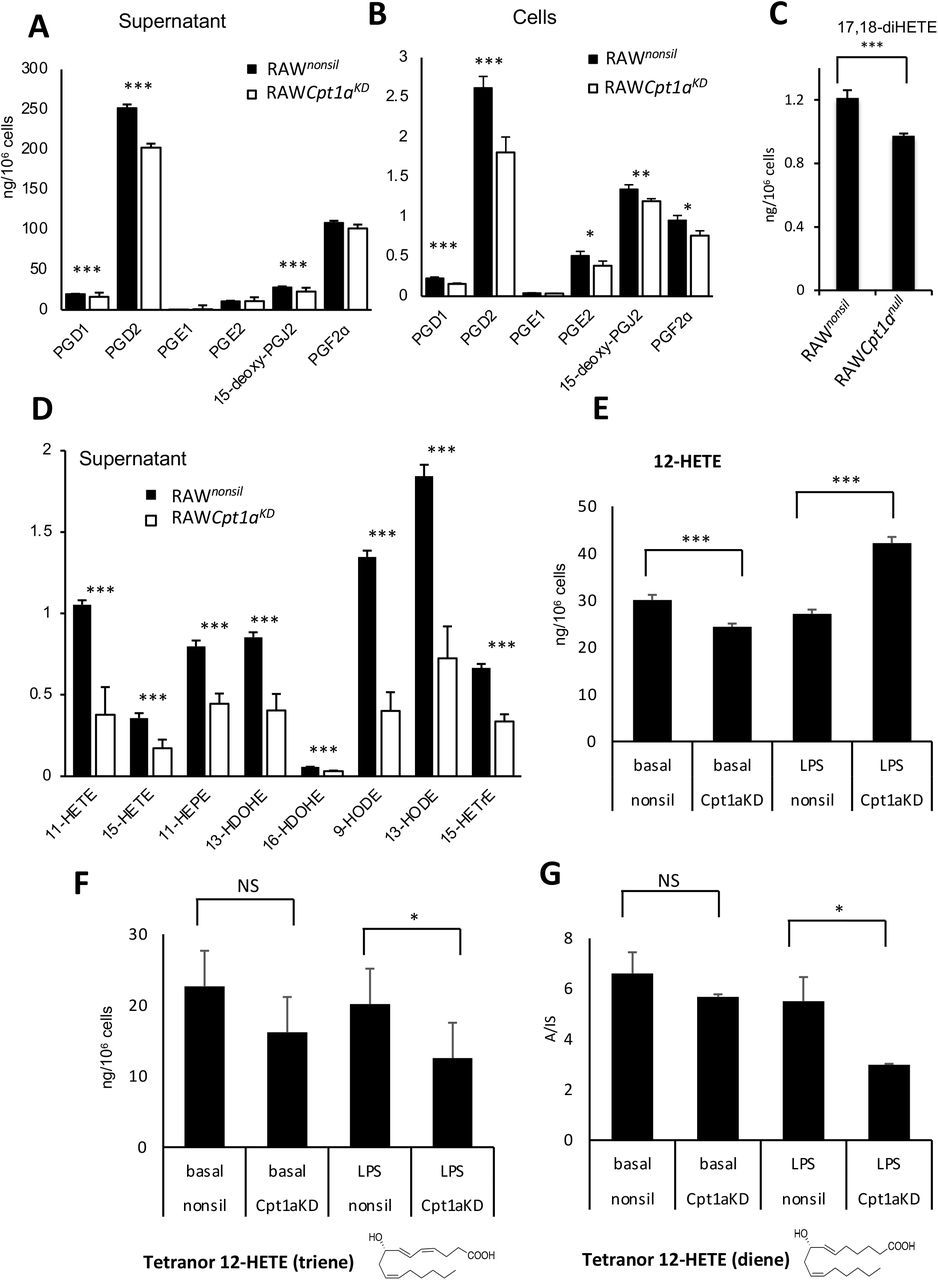
Considerably higher amounts of etomoxir than used here (~10-fold higher) can have off-target effects due to an impact on adenine nucleotide translocase and CoA [38, 39]. To rule this out, we targeted CPT1a using a lentiviral approach. Silencing to around 14 % control levels was achieved in RAW264.7 macrophages, stably expressing shRNA that targets Cpt1a (RAWCpt1aKD), but not those expressing a non-silencing control (RAWnonsil) (Supplementary Figure 5 A). CPT1 maintains mitochondrial health since it imports FAs to maintain cardiolipin and phospholipid pools inside mitochondria[40]. Thus, CPT1-deficient cells do not proliferate normally and may alter their bioenergetic and lipid metabolism profiles. The balance between mitochondrial and peroxisomal β-oxidation and their ability to support FAS/elongase activities required to generate PUFA for oxylipin synthesis may have adapted. Similar to low dose etomoxir, the overall impact on endogenous LPS-stimulated PG synthesis in RAW cells was suppression of supernatant and cell levels (Figure 6 A,B). Furthermore, the most abundant CYP450 product (17,18-diHETE) was suppressed, as also seen for etomoxir with naïve peritoneal macrophages and RAW cells (Figure 6 C). Endogenous generation of several monohydroxy eicosanoids was suppressed by silencing of Cpt1a (Figure 6 D). This data further confirms the dual role of CPT1 in both generation and removal of oxylipins depending on their enzymatic source and cell type.

Panels A-D Cpt1a knockdown prevents secretion of PGs from RAW cells. RAW cells expressing either the non-silencing (RAWnonsil) or Cpt1a knockdown siRNA (RAWCpt1aKD) were treated with LPS (100 ng/ml) for 24 hr and secretion of PGs, 17,18-diHETE or monohydroxy oxylipins measured using LC/MS/MS as in methods. (n = 6, mean +/−SEM) *** p < 0.005 control vs knockdown, Students T test. Panel E-G Cpt1a knockdown impacts on removal of 12-HETE and secreted levels of tetranor diene and triene metabolites by RAW cells. RAW cells were incubated +/−LPS (100 ng/ml, for 4 hr) with 12-HETE (2.34 μg/ml) added after the first hour (thus added for 3 hr). Supernatants and cells were harvested, then lipids extracted and analyzed for 12-HETE and metabolites using LC/MS/MS as described in Methods. Data (n = 5-6 per group) represents two independent experiments.
RAW cells do not generate 12-HETE, thus its metabolism when exogenously added was tested. This also allowed mitochondrial oxylipin removal to be determined in isolation. In basal RAW cells, Cpt1 knockdown did not prevent metabolism of 12-HETE, instead there was a non-significant increase, presumably by compensatory peroxisomal or other pathways (Figure 6 E). In contrast, 12-HETE removal by LPS-stimulated RAW cells was significantly inhibited by Cpt1 knockdown (Figure 6 E). Furthermore, the triene and diene tetranor metabolites were significantly reduced by Cpt1 knockdown in LPS-treated but not basal RAW cells (Figure 6 F,G). This indicated that following Cpt1 knockdown, RAW cells showed reduced mitochondrial metabolism of 12-HETE coupled with lower formation of its tetranor products following LPS stimulation.
Inflammation accelerates 12-HETE conversion to triene tetranor 12-HETE via mitochondrial β-oxidation in vivo
Earlier, in vivo inhibition of CPT1 was seen to significantly elevate many oxylipins in the peritoneal cavity following LPS challenge. To examine β-oxidation of oxylipins via mitochondria in vivo, the formation of tetranor metabolites was next measured. The diene metabolite was absent, however tetranor 12-HETE triene was significantly elevated on CPT1 blockade, but only during inflammatory stimulation (Figure 7 A). This confirms that inflammation in vivo not only increases formation and mitochondrial uptake of oxylipins (shown in Figure 1), but also their metabolism to tetranors (Figure 7 A).

Panel A. Tetranor triene 12-HETE is increased in vivo during inflammation with CPT1 inhibition. Wild type mice (female, 7-9 weeks) were injected ip with vehicle (PBS), etomoxir (100 μg) and/or LPS (1 μg). After 6 hrs, lavage was harvested and lipids extracted and analyzed using LC/MS/MS as outlined in Methods (n = 10, * p < 0.05, ** p< 0.01, *** p < 0.005, Students T-test, for with/without etomoxir). Outliers are shown as red, or with values. Panel B. LPS treatment of RAW or naïve peritoneal macrophages reduces mitochondrial OxPhos. RAW, RAWAlox15, or naïve peritoneal macrophages from wild type or Alox15−/− mice were treated with LPS (100 ng/ml) for 24 hrs. Mitochondrial function was assessed as described in Methods (n = 3-6 mean +/−SEM). Panels C,D. LPS doesn’t alter mitochondrial DNA or lesion frequency in RAW macrophages. RAW and RAWAlox15 cells were mock treated or treated with CQ (40 nM) or LPS (100 ng/ml) for 24 hr. Subsequently their DNA was isolated and used to assess the mtDNA to gDNA ratio (C) and the frequency of lesions in mtDNA (D) using qPCR (three independent experiments with n = 3, one-way ANOVA with Tukeys correction, no data were significantly different from RAW samples, except RAW+CQ, as expected for lesion frequency only, acting as a positive control). Panels E-H Oxylipin levels detected in vivo promote neutrophil ROS generation. Whole blood was incubated with oxylipin mixtures (Supplementary Table 2), and then ROS generation in response to stimulation using opsonized S. epidermidis determined by APF fluorescence as indicated in Methods. Three individual donor samples were separately tested in triplicate. Monocytes and neutrophils were analyzed using gating strategy as outlined in Methods. Panels E,F. Response to high or low oxylipin doses were expressed either as %APF+ cells or %increase over the vehicle (ethanol) response. The average value from each donor is shown separately. Panels G,H Bar chart for one representative donor, showing comparison with unstimulated blood. Neutrophils (C), monocytes (D) (n = 3, mean +/−SEM). Data was analyzed by two-way ANOVA with Sidaks post hoc tests indicated (* = p<0.05, ** = p<0.01, *** = p<0.001). ANOVA values were (E-pairing P <0.001, cell type P=0.018, lipid and interaction p<0.001; F-pairing P <0.001, cell type P=0.009, lipid P=0.008 and interaction P=0.002; G-interaction, bacteria and lipid p<0.001; H-interaction P=0.47, bacteria p<0.001, lipid P=0.39). Data shows the mean average numbers from one donor but represents the results from three donors from two independent experiments.
Oxylipin metabolism by mitochondria is not sustaining oxidative phosphorylation (OxPhos)
Mitochondrial β-oxidation of FA is linked with OxPhos through several checkpoints. It forms acetyl-CoA, a substrate for the TCA cycle as well as NADH and FADH2, substrates for complexes I and II, and also electrons transfer to flavoprotein-ubiquinone oxidoreductase (ETF-QO)[41]. Thus, oxylipins could contribute to OxPhos. However, LPS suppresses mitochondrial respiration, through multiple mechanisms including aconitase inhibition and nitric oxide binding to complex IV making this unlikely[28]. Indeed, here LPS treatment profoundly decreased cellular respiration consistent with previous data (Figure 7 B,C) [42, 43]. Importantly, LPS did not impact mitochondrial DNA (mtDNA), or cause organelle damage as measured by DNA lesion frequency (Figure 7 D,E). Thus, mitochondria are still present in LPS-treated cells, although β-oxidation of FAs is largely uncoupled from OxPhos.
Oxylipin elevation following CPT1 inhibition enhances neutrophil phagocytosis
In vivo inhibition of CPT1 doubled many oxylipins detected in inflammatory peritonitis, thus mitochondrial β-oxidation might impact their signaling (Figure 1). To address this, human phagocyte responses to oxylipins were determined. Here, ROS production elicited by S. epidermidis, a common pathogen in human peritonitis was measured by APF fluorescence of whole blood leukocytes [44]. Two concentrations were used that represented amounts of 52 individual oxylipins detected in vivo, in the presence or absence of etomoxir (with LPS) (Figure 1, Supplementary Table 2). Here, ROS generation by neutrophils was consistently enhanced by higher or lower oxylipin levels. However, there was a significant concentration-dependent impact in three individual donors (Figure 7 E,G). Thus, the higher amount, consistent with levels detected during CPT1 inhibition, was significantly more potent at activating neutrophils. Monocyte ROS generation was unaffected at either dose (Figure 7 F,H). These data support the concept that oxylipin removal by mitochondria during inflammation can regulate cellular innate immune responses.
Transcriptional analysis of human neonatal bacterial sepsis identifies gene candidates responsible for mitochondrial oxylipin metabolism
The enzymes that import oxylipins into mitochondria are currently unknown, but it is very likely that those importing long chain FA are involved. These include five acyl-CoA synthetase long-chain family members (ACSL1,3-6), as well as CPT1a, 1b, 1c, and CPT2. These mediate formation of-CoA and then-carnitine derivatives that are required for long chain FA uptake across mitochondrial membranes (Figure 8, Supplementary Table 3). Next, enzymes form the mitochondrial β-oxidation pathway for long chain FA mediating sequential removal of 2C fragments to generate acetyl-CoA, and chain shortened metabolites. These include HADHA, HADHB, ECI1, DECR1 and ACADVL (Figure 8, Scheme 4, Supplementary Table 3) [22]. A set of 32 genes were compiled including also those isoforms with preference for medium or shorter chain FA. Their expression during human infection in vivo was tested using a microarray from human neonatal whole blood cells (35 cases, 26 controls). Here, infants suspected of infection had blood cultures conducted, and a diagnosis of bacterial sepsis obtained[45]. Out of the genes tested, 22 were significantly different with 9 up- and 13 down-regulated in sepsis (Supplementary Table 3). Notably, several upregulated genes were involved in generation of long chain FA-CoAs and their interconversion to acyl-carnitines in mitochondria. For the most relevant, 7 were significantly upregulated (ACSL1,3,4, CPT1b, CPT2, ACADVL, HADHB) while 3 were downregulated (ACSL5, ECI1, HADHA) (Figure 9 A,B). This indicates a high degree of egulation during complex bacterial infection in seriously ill humans, suggesting the specific isoforms that maybe involved in oxylipin removal. We also tested the gene set in murine bacterial peritonitis, induced using cell-free supernatant from a clinical isolate of Staphylococcus epidermidis (SES) [46]. Here, there was overall upregulation, showing a similar trend to the human bacterial dataset (Figure 9 C,D). Although most individual genes were not statistically significant, Cpt1a showed around 2-fold induction significant 6 hrs post infection (Figure 9 C,D).


Panel A. Human transcriptomics data shows significant upregulation of several genes including ACSL and CPT isoforms. Gene expression (log2 expression data) from 35 controls and 26 bacterial confirmed sepsis cases published in [45] were compared for expression of 32 genes putatively involved in import and β-oxidation of oxylipins, based on known metabolic pathways for long chain native FA. Raw data are provided in Supplementary Table 6. Panel B. Box and whisker plots for the 8 significantly upregulated genes are shown. n = 35 and 26 for infection and controls, respectively. * p < 0.05, *** p < 0.005, Students T-test, then adjusted using Benjamini-Hochberg test. Panel C. Transcriptomics of mouse peritonitis shows significant upregulation of Cpt1a at 6 hrs. Gene expression data from peritoneal membranes harvested post SES challenge was analyzed for expression of 32 genes as for Panel A, above (n = 3 per group) * p < 0.05, Students T-test, adjusted using Benjamini-Hochberg test.
A consistent upregulation of ACSL1 is revealed across multiple human and murine macrophage datasets
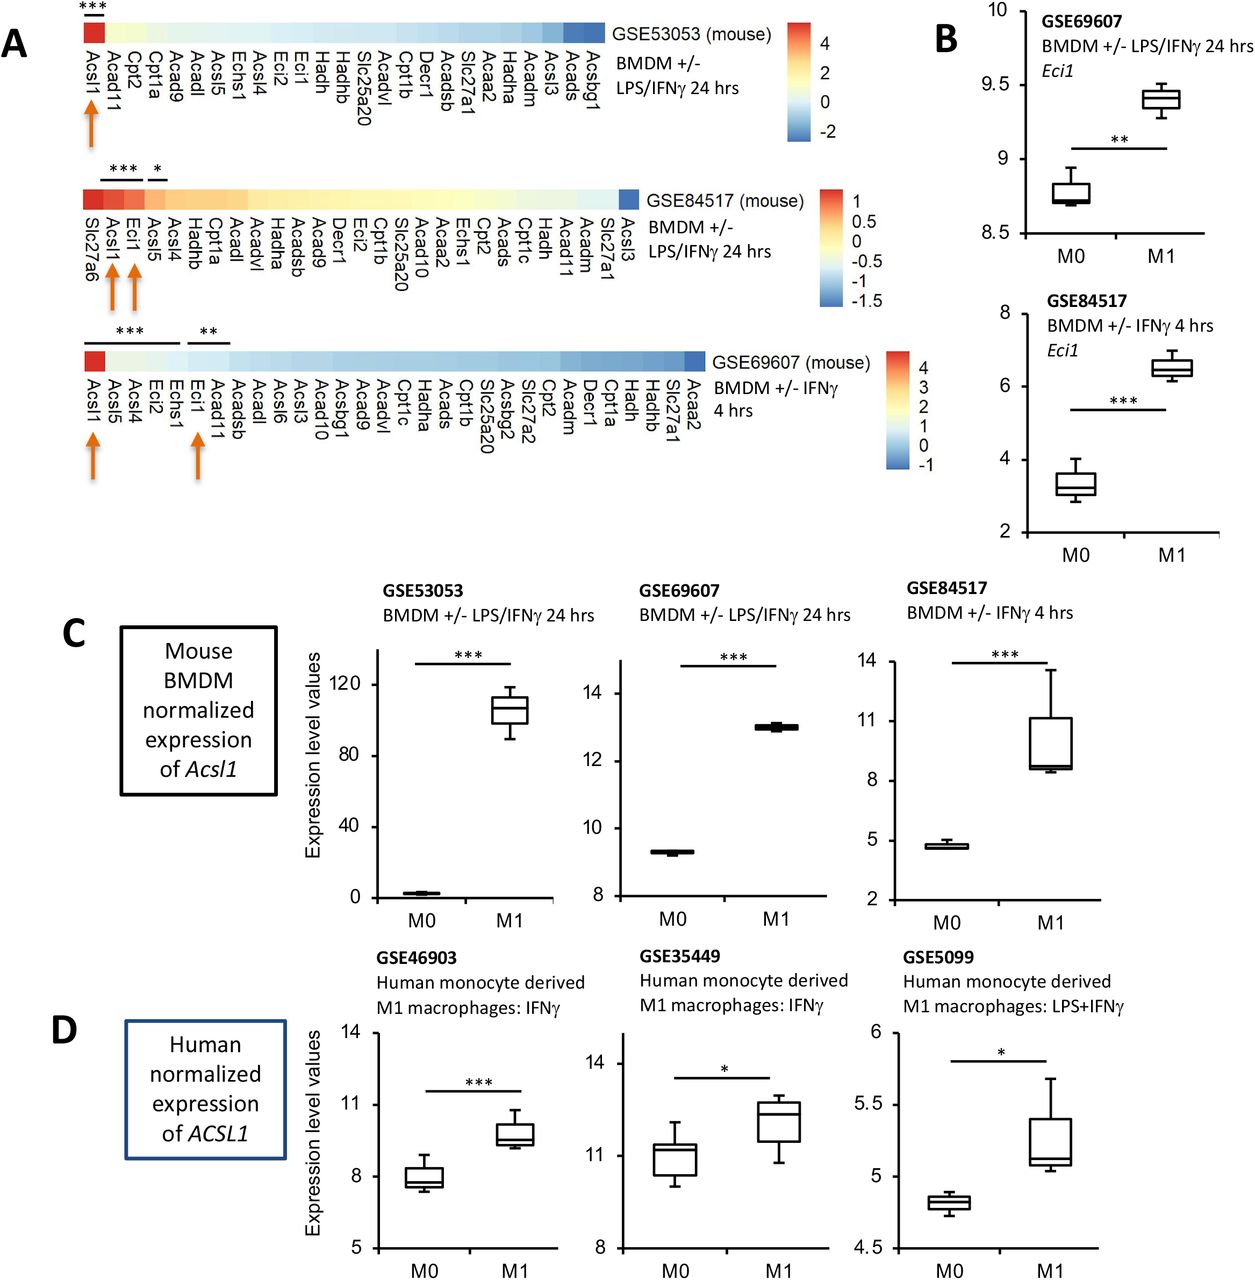
Next, data from 3 mouse BMDM or 3 human PBMCs studies were downloaded from GEO [47–52]. For BMDM, Acsl1 was consistently significantly induced on stimulation using either LPS/IFNγor IFNγalone (Figure 10 A,C). Two of the mouse BMDM datasets also indicated significant increases in Eci1, encoding 3,2-enoyl-CoA isomerase (Scheme 4, Figure 10 B). In human studies, ACSL1 was also induced by LPS/IFNγor IFNγ(Figure 10 D).

Panels A,B. Transcriptomics reveals Ascl1 to be highly upregulated in response to LPS/IFNμ in murine BMDM. Transcriptomics data obtained from GEO database was analyzed as outlined in Methods for expression of 34 genes selected for potential or known involvement in mitochondrial β-oxidation. Samples were BMDM treated with either LPS/IFNγor IFNγalone as indicated. For all genes, the log2fold change was calculated and plotted using Pheatmap in R. Panel C shows box and whisker plots for normalized expression of Acsl1 in the mouse datasets, with n = 3 for all groups except for GSE53053 M0 (n = 2) *** p < 0.005, Students T-test, then adjusted using Benjamini-Hochberg test. Panel D. ACSL1 is strongly induced in human M1 macrophages. Human transcriptomics data for ACSL1 expression was downloaded from GEO and normalized expression level plotted (n = 3-12 per group). * p < 0.05, *** p < 0.005, Students T-test.
Discussion
Oxylipins are soluble mediators generated during inflammation and infection that link lipid metabolism with immunity. Dynamically controlling their removal is essential to dampen inappropriate inflammation. Here we show that blocking the mitochondrial enzyme carnitine palmitoyltransferase1 (CPT1), effectively doubles secreted levels of endogenously-generated oxylipins in vivo during inflammatory challenge. Using exogenous 12-HETE, we establish a paradigm in which macrophage removal of oxylipins and their metabolites involves repeated cycles of secretion and re-internalization of partially-oxidized tetranor intermediates, followed by further mitochondrial metabolism (Figure 8). Extending previous studies, we found high levels of secreted free acid tetranors in vitro and in vivo, thus regardless of whether formed in peroxisomes or mitochondria, these lipids appear to undergo repeated cycles of acylation/de-acylation (to CoA and carnitine forms, via ACSLs and CPT) facilitating their rapid secretion, re-internalization and further β-oxidation[37, 53]. This demonstrates a complex cellular metabolism for tetranors, and raises questions as to why they are secreted, instead of being simply metabolized to terminal end products.
Our finding that oxylipin metabolism is strongly stimulated by LPS has implications for the rare genetic disorder, CPT1 deficiency, where symptomatic episodes and death are triggered by acute infection[31]. Also, rates of hospitalization and deaths in infants with the CPT1a variant p.P479L are higher for homozygotes with respiratory, dental and aural infections[32, 33]. This variant reduces CPT1a activity around 50% [32, 33]. The observation that infection causes severe symptoms indicates that mitochondrial β-oxidation is a protective response to pathogen challenge. This is fully in line with our findings that CPT1-dependent oxylipin removal is elevated by the bacterial product LPS, and suggests that this maybe an important part of the physiological response to infection, functioning as an “off-switch” for pathologic signaling. Whether oxylipin levels are elevated in patients with CPT1a deficiency is not known, and future studies to examine this are warranted.
Mitochondrial uptake of short/medium chain native FAs is independent of carrier proteins, however long chain native FA require first activation to acyl-CoA derivatives by acyl-CoA synthetases (ACSL), then conversion to acyl-carnitines, via CPT1 (Figure 8). Following import into mitochondria via an inner membrane transporter, FA are re-converted to acyl-CoAs by CPT2. These are used for mitochondrial β-oxidation, with sequential removal of two C fragments, and generation of acetyl-CoA. Using a human sepsis cohort and multiple human and murine in vitro models, we propose a biochemical pathway for oxylipin uptake and mitochondrial metabolism during infection (Scheme 4). A consistent pattern across all studies was upregulation of ACSL1/Acsl1. This isoform is well known to shuttle FAs to mitochondria for β-oxidation and lipid synthetic pathways [54–60]. As yet, the specific ACSLs that acylate oxylipins are not known, although Klett found that all 6 isoforms are active in vitro [61]. ACSL1 is known to be critical for shuttling FA into mitochondria for β-oxidation in heart, skeletal muscle and adipose tissues [54–58]. Furthermore, in liver, ACSL1 and CPT1 were shown to be physically associated [59, 60]. Thus, ACSL/CPT1 may be a critical checkpoint enabling higher rates of oxylipin metabolism during infection. Indeed, a critical role for ACSL1 in sepsis outcome has been proposed [62]. Two other long chain metabolizing ACSLs (3,4) were induced in human sepsis, indicating multiple complex mechanisms of isoform regulation. Regulating import of long chain FAs into the mitochondrial matrix, we found increased CPT1a or b, dependent on the model, along with CPT2 induction in human sepsis. Murine BMDM stimulated with IFNγalso upregulated Eci1. This encodes DCI, which converts 3-cis or trans-enoyl-CoA to 2-trans-enoyl-CoA during mitochondrial β-oxidation and was previously shown to be induced during HCV infection and required for virus replication [63, 64]. Last, upregulation of the β-subunit of the mitochondrial trifunctional protein (HADHB) and very long chain acyl-CoA dehydrogenase (ACADVL) are also fully consistent with their proposed role in oxylipin β-oxidation (Scheme 4).
Macrophages rely primarily on glycolysis for energy when stimulated with LPS/IFNγ, and conversely use FAO to supply OxPhos with substrates, when exposed to “anti-inflammatory” stimuli such as IL-4[26]. However, recent studies have uncovered a significant role for lipid metabolism in “M1” cells even in the absence of OxPhos, with FA synthetic pathways (FAS) being upregulated by LPS[26]. This anabolic event is proposed to supply inflammatory activated cells with lipids for processes such as proliferation (sphingolipids, glycerolipids, phospholipids, etc), and generation of oxylipins[26]. Here, we focused down on inflammatory activated macrophages that generate oxylipins, where metabolism will favor glycolysis and FAS, and reduced OxPhos. We show for the first time that CPT1 mediates exogenous and endogenously-generated oxylipin β-oxidation by macrophages, that is elevated during inflammation. The impact of blocking CPT1 varied by sub-family of oxylipins, based on either:
Cell type. Etomoxir consistently elevated LOX-derived oxylipins and various other mono-hydroxy-oxylipins, while suppressing CYP/sEH metabolites in all macrophages (Figures 2–4). However, COX-derived PGs increased in vivo and in primary macrophages, but were suppressed in RAW cells (Figures 1–4).
How CPT1 was targeted. In RAW cells, etomoxir or gene silencing suppressed COX-derived PGs and CYP/sEH oxylipins. In contrast, monohydroxy oxylipins were increased by etomoxir but suppressed by CPT1 knockdown in RAW cells (Figure 4). Etomoxir was used at 25 μ-M, well below that found to induce off target effects on adenine nucleotide translocase [38, 39]. Indeed, previous studies using high levels led to FAO being incorrectly proposed as required for alternative activation of M2 macrophages (100-200 μ-M)[65]. Nowadays, lower concentrations are recommended that block ~90% of β-oxidation without side-effects (e.g. 10-25 μ-M)[40]. As a second approach, shRNA knockdown stably reduced expression of CPT1a. However, this causes adaptive changes to the metabolic status of macrophage mitochondria, beyond acute inhibition of CPT1. Recent publications implicate CPT1 in maintaining mitochondrial health due to its requirement for importing FAs for maintaining mitochondrial cardiolipin and phospholipid pools [40]. Thus, cells lacking CPT1 do not proliferate normally and may have adapted to a deficiency in OxPhos through alterations in other lipid and energy metabolism pathways. Thus, constitutive knockdown may directly impact the balance between mitochondrial and peroxisomal β-oxidation and the ability to support FAS/elongase activities in the cells. Nevertheless, both inhibitory approaches caused significant changes to oxylipin secretion, both for PGs, 12-HETE and its two tetranor metabolites, supporting the hypothesis that mitochondria can be a significant site of oxylipin regulation in macrophages.
Our data reveal complex modulation of oxylipin removal and formation by CPT1 as follows:
Removal: Oxylipins and their metabolites can be degraded by two separate β-oxidation pathways, with only mitochondrial enzymes relying on CPT1. However, peroxisomes and mitochondria display metabolic interplay where FA degradation intermediates are transferred for metabolism between the organelles[66]. Thus, stable knockdown of CPT1 may require compensatory increases in peroxisomal β-oxidation. It has been proposed that truncated unsaturated FA metabolites may need to transfer to mitochondria for complete metabolism[66]. Indeed, 12-HETE-triene was suggested as the terminal peroxisomal metabolite for 12-HETE, with further metabolism proposed to require mitochondria[18]. Our data provide direct evidence for this interplay between organelles, since blockade of CPT1 had a far greater impact on metabolism of tetranor metabolites than exogenous 12-HETE in LPS stimulated cells (Figure 5). Thus, 12-HETE can be metabolized in either organelle, but peroxisomal-generated tetranors are then shuttled to mitochondria, with their oxidation significantly stimulated by inflammation.
Generation: FA synthesis was proposed to be required for oxylipin generation in LPS-stimulated cells[67]. This is because FAS and FA elongases require TCA intermediates (malate, citrate, acetate), which themselves depend at least in part on CPT1 for formation. Thus, while both synthesis and degradation of oxylipins simultaneously occur in macrophages, steady state levels will depend on the cells’ metabolic status, and whether CPT1 is mainly supporting degradation (by β-oxidation) or synthesis (by supplying TCA intermediates) of individual oxylipins. Thus, CPT1 could either increase or decrease levels of oxylipins and their metabolites concurrently, as seen in our study. A detailed flux analysis of this phenomenon is required to further our understanding.
Here, we show that mitochondrial oxylipin removal takes place during inflammation on a background of reduced OxPhos, a well-known response to LPS stimulation by macrophages [28]. However, β-oxidation requires a basal level of OxPhos both to regenerate NAD+ and oxidized flavin cofactors in the electron transferring flavoprotein complex, that reduces ubiquinone directly. While OxPhos was suppressed, there was a low residual activity remaining in both RAW and peritoneal cells that appeared sufficient to sustain β-oxidation, observed by formation/metabolism of oxylipins and HETE tetranors. Our experiments using exogenous 12-HETE suggest that non-mitochondrial oxidation is probably responsible for removing most. This agrees with previous studies where exogenous 12-HETE added to mammalian cells was removed by peroxisomes forming a series of metabolites, down to C12:1 [18, 37, 68, 69]. However, these studies did not consider the impact of inflammation and the focused was exclusively on exogenous 12-HETE, not endogenous oxylipins generated by the cells. Here, we extend this to the whole range of oxylipins generated by macrophages, and reveal that during LPS-inflammation, mitochondria (via CPT1) effectively halve secreted amounts of oxylipins en masse, and are a key site for removing peroxisomal metabolites of 12-HETE. We demonstrate that this alters the outcome of leukocyte activation, suggesting that mitochondrial β-oxidation may act as a brake for dampening host inflammatory responses in vivo during infection. The potential implications for humans with CPT1a deficiency, relating to severely augmented inflammation during infection should be considered and studies initiated to test this idea. Also, whether this phenomenon contributes to infection-associated host inflammation in general, in cases where mitochondrial health is compromised, should be considered.
Methods
Mouse peritonitis model
All mouse experiments were performed in accordance with the United Kingdom Home Office Animals (Scientific Procedures) Act of 1986 (P05K6A456). Wild-type (WT) female C57BL/6 mice were purchased from Charles River Laboratories. Mouse breeders were housed in isolators and experimental mice in individually ventilated cages with 12-h light/dark cycles and controlled temperature (20-22 °C). Access to water and standard chow was ad libitum. Alox15 deficient mice were as previously described, but backcrossed to F11[70]. Female C57BL/6 mice wild type or Alox15−/− mice (7-9 weeks) were injected intraperitoneally with etomoxir (100 μg, Sigma Aldrich) and/or LPS (1 μg, E.Coli 0111.B4, Sigma-Aldrich) or vehicle (PBS) per mouse. After 6 hr, mice were peritoneally lavaged using 5 ml ice cold PBS (with 5 mM EDTA). Eicosanoid internal standard mix was added to the lavage solution (7.5 ml per 5 ml lavage solution, Supplementary Table 4). Cells were removed by centrifugation and resuspended in 1 ml PBS. Supernatant and cells were frozen at −80 °C until lipid extraction using solid phase as described below.
Isolation and treatment of resident peritoneal macrophages
Wild type and Alox15−/− mice (female, 9-13 weeks) were lavaged with PBS supplemented with 5 mM EDTA, and peritoneal cells from 4-5 mice pooled together. A small amount was labelled with F4/80 (BD Horizon, BV421 Rat Anti-Mouse F4/80, Clone T45-2342, Cat.: 565411) and CD11b-allophycocyanin antibodies (BD Pharmingen, Clone M1/70, PE Rat Anti-Mouse, Cat 557397), both 0.2 μg/ml final concentration, to determine macrophage numbers. Cells were first blocked for non-specific antigen binding (incubating for 20 min at RT with 2 μg/ml CD16/CD32 Rat anti-Mouse, unlabeled, Clone: 2.4G2, BD) then antibodies were added without washing off the blocking solution, and cells were incubated for further 20 min at RT. Cells were then centrifuged for 5 min at 1500 rpm, 4C, supernatant discarded and cells resuspended in 150 μl PBS and % macrophages determined using flow cytometry. Peritoneal cells were seeded at 106 macrophages/well of a 6-well plate and cultured in DMEM (with 10 % heat inactivated FCS and pen/strep), for 2 hours at 37 °C, 5 % CO2, 99 % humidity. Nonadherent cells were removed by washing with media, and the remaining cells cultured in serum free RPMI, with/without LPS (100 ng/ml) and/or etomoxir (25 μ-M). After 24 h, cells and supernatants were harvested separately, with supernatant first centrifuged (1500 rpm, 5 min, 4 °C), and cells scraped quickly into 1 ml RPMI and stored at −80 °C, prior to lipid extraction and analysis.
Generation and culture of RAW264.7 cell lines stably overexpressing Alox15, or expressing shRNA targeting Cpt1a
Alox15 overexpressing RAW264.7 cells were generated by retroviral transduction using the pMX-IP retroviral vector, which is based on the Moloney Murine Leukemia Virus (MMLV) [71]. Briefly, mRNA was extracted from C57BL/6 peritoneal cells, and Alox15 was PCR amplified with the following primer sequences:
Alox15-Fw TCCTGCAGGCCTCGAGCCACCATGGGTGTCTACCGCATCC
Alox15-Rv: CGCGCCGGCCCTCGAGTCATATGGCCACGCTGTTTT
The In-fusion cloning kit (Takara Bio) was utilized to insert Alox15 into the Xho I site of the pMXs MMLV retroviral plasmid. Retroviral particles were generated after transfection of HEK293T cells with the viral plasmid. RAW264.7 cells were spin-infected with packaged retrovirus (Alox15 or empty vector control pMXs-IP). Positive infections were selected by resistance to 3 μ-M puromycin, screened for positive Alox15 expression by PCR (Supplementary Figure 5 B). Separately, RAW264.7 cells were infected with lentiviral vectors to generate Cpt1a knockdown or non-silencing control cell lines, as described [72]. Alterations from the published method were different lentiviral plasmids (pSMART mEF1a/TurboGFP (Cpt1a targeting shRNA [V3SVMM03-13316872] and non-targeting control)-Dharmacon). Briefly, lentiviral particles were created by transfecting HEK293T cells (lentiviral plasmid plus helper constructs (pCMV-Δ8.91 (Gag/Pol, Tat and Rev) and pMD2.G (VSV-G coat)) using the Effectene transfection reagent (Qiagen). Lentivirus was concentrated 48 h after transfection from 0.45 μm filtered supernatants layered on top of 1/6th volume of 0.584 M sucrose using a Beckman Coulter Ultracentrifuge (100,000 x g, 90 min, 4 °C). Lentiviral particles concentrated from 20 ml of supernatant were added to a ~10% confluent RAW264.7 cells in a T-175 flask for 3 days. After another 4 days of subsequent cell expansion positively infected cells were sorted using GFP expression on a BD FACS Aria cell sorter (100 μm nozzle size) (Supplementary Figure 5 C,D. Knockdown was validated by real-time PCR. Mature Cpt1a mRNA target sequence: CAGTGGTATTTGAAGCTAA, the sequence of the non-targeting control was not disclosed by Dharmacon but is validated to have minimal targeting to known mouse genes. To confirm knockdown, RNA was extracted using the PureLink RNA extraction kit, cDNA was created using the high capacity reverse transcription kit (Life Technologies). Real-time PCR was performed using the Taqman assay (Applied Biosystems) on a Stratagene MX3000P real-time PCR instrument. Data was analyzed using the ΔΔCt method, normalizing Cpt1a (probe spans exons 13-14: Mm01231183_m1) gene expression to the housekeeping gene Hprt (probe spans exons 2-3: Mm03024075_m1) (Supplementary Figure 5 A). RAW cells were cultured in DMEM with 10 % FCS and pen/strep. Cells were passaged at ~80 % confluency using PBS with 5 mM EDTA and 27.7 mM lidocaine for ~5 min at 37 °C. Cells were cultured with/without 100 ng/ml LPS, with/without 25 μ-M etomoxir for 24 h in serum free RPMI medium. Then cells and supernatants were harvested separately and stored at −80°C until lipid extraction and analysis using LC/MS/MS.
Bone marrow derived macrophages (BMDM) isolation and differentiation
Bone marrow cells were harvested from femurs and tibias of mice (8-10 weeks old, female C57BL/6) using syringe flushing. After centrifugation and washing twice with PBS cells were plated at 2 × 10⁵/ml in DMEM (10% FCS, +/−5 % horse serum, pen/strep, L-glutamine, +/−Hepes). MCSF was added at final concentration 20 ng/ml. On day 3, cells were refed using media and MCSF. On day 7-8, cells were washed with PBS, then lifted with lidocaine/EDTA or ACCUTASE™ (Sigma-Aldrich), plated at 1-2 × 10⁶ per well of a 6-well plate and rested for 24 h. Cells were washed and then refed with DMEM (as above, with MCSF) and cytokines as follows: M0: medium only, M1: LPS (100 ng/ml)/IFNγ(20 ng/ml), M2: IL-4 (20 ng/ml). For some experiments, FCS was omitted. Etomoxir (25 μM) was added in some experiments. After 24 hrs supernatant was recovered and frozen at −80 °C. Cells were washed and then recovered in 1 mL of PBS using rapid scraping on ice, and the cell suspension immediately quenched in liquid N2 prior to storage at −80 °C.
Samples were analyzed for phenotype confirmation (cytokine production, mRNA gene expression by real time PCR) and lipid composition, as described. CCL5, TNFα and IL-6 in supernatants were measured using ELISAs (Mouse TNFα Mouse CCL5; Mouse IL-6, R&D Systems) according to the manufacturer’s protocols. Confirmation of phenotype is shown in Supplementary Figure 6 A,B. Total RNA was recovered using the RNeasy Mini Kit (QIAGEN) according to the manufacturer’s instructions. RNA concentration and purity were determined using a Nanodrop spectrophotometer. cDNA was prepared from 1 μg of RNA. RNA was reverse-transcribed using superscript III reverse transcriptase (Invitrogen) in a total volume of 20 μL for 1 h at 50 °C, and the reaction was terminated at 70 °C for 15 min. Power SYBR® Green PCR Master Mix (Thermo Fisher scientific) was used for real-time PCR. The Master Mix (10 μL) was added to dH2O (7.5 μL), and 1 μl primer mix (0.5 μg/mL each primer) to make a gene specific master mix; cDNA (1.5 μL) from each sample was added to the reaction mix (17.5 μL) in a 96-well plate well. The plate was inserted into a QuantStudio 3 Real-Time PCR system and the PCR amplification started as per instrument instruction: 50°C-2 min; 95°C-10 min; 95°C-15 s; 60 °C-1 min; Repeat 3-4 for 40 cycles; 95 °C-15 s; 4 °C end. Primers used for real-time PCR were designed to be intron-spanning, and to have a melting temperature 55-65 °C. The intron-spanning aspect ensured that only mRNA and not genomic DNA were amplified. All primers and oligonucleotides were obtained (Sigma, Gillingham UK) as salt free purified lyophilized DNA. The sequences of the real time PCR primers used were:
Metabolism of exogenous 12-HETE and 12-HETE-d8 by RAW cells
RAW cells (2 × 10⁶/ml media) were supplemented with 9 μM 12(S)-HETE, 12(S)-HETE-d8, 12(R)-HETE tetranor 12(S)-HETE (from Cayman Chemical) for up to 12 hrs in serum free RPMI, with 100 ng/ml LPS, with/without 25 μM etomoxir. Amounts supplemented were (per 106 cells): 12h LPS: 12(S)-HETE: 1.44 μg, 3 h LPS + Etomoxir: 12(S)-HETE/12(R)-HETE: 1.515 μg, 12(S)-HETE d8: 1.47 μg, Tetranor 12(S)-HETE triene: 1.198 μg. Cells and supernatants were harvested separately, and stored at −80 °C. Lipids were extracted as described above, using solid phase C18 columns, resuspended in small volumes of methanol and stored at −80 °C until analysis using LC/MS/MS.
Lipid extraction
Internal standard mixture (see eicosanoid assay for details, Supplementary Table 4) was added to each sample before extraction. Oxylipins were extracted from cells by adding 2.5 ml of solvent mixture (1M acetic acid/2-isopropanol/hexane (2:20:30, v/v/v) to 1 ml of sample, followed by vortexing for 60 s, and then adding 2.5 ml of hexane. The mixture was vortexed again for 60 s, centrifuged at 500 g, 4 °C for 5 min, and lipids recovered in the upper organic solvent layer. The lipids were reextracted by adding another 2.5 ml of hexane, followed again by vortexing and centrifugation. The lipids were again recovered in the upper organic solvent layer. The combined hexane layers were dried by vacuum and resuspended in methanol. Oxylipins were extracted from supernatants using solid phase extraction (SPE) using C18 columns (Sep-Pak C18, Waters). Columns were activated using 12 ml methanol, followed by 6 ml acidified water (0.4 % glacial acetic acid in HPLC water) followed by loading the sample (all samples were in 85 % aqueous, 15 % methanol, pH 3.0), and washing with 6 ml of hexane. The columns were left to dry for 15-20 min followed by eluting the lipids with 8 ml methyl formate. The lipids were vacuum dried, resuspended in methanol and stored at −80 °C. Lipids from supernatants were extracted by solid phase extraction, following the procedure outlined above.
LC-MS/MS targeted analysis of oxylipins
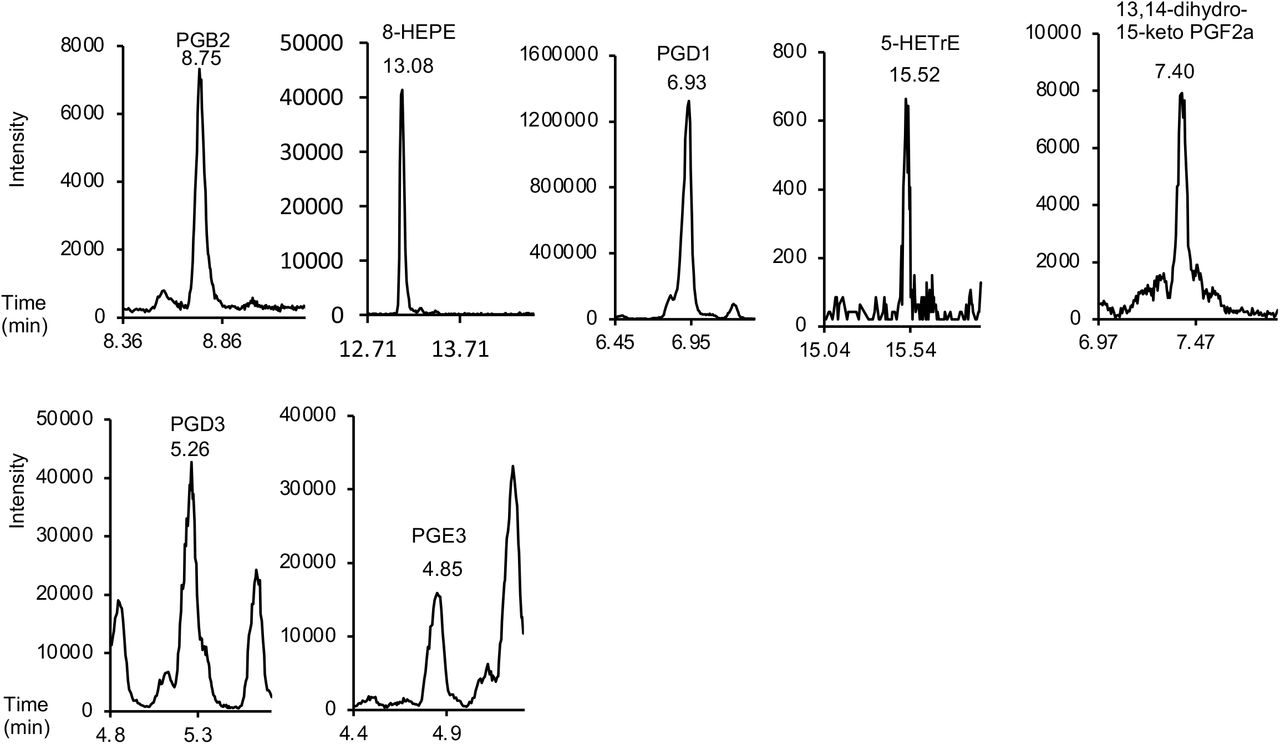
Targeted lipidomics analysis of 93 oxylipins was performed on a Nexera liquid chromatography system (Nexera X2, Shimadzu) coupled to a 6500 QTrap mass spectrometer (AB Sciex) as described, with minor adaptations[73]. Briefly, liquid chromatography was performed at 45 °C using a Zorbax Eclipse Plus C18 (Agilent Technologies) reversed phase column (150 × 2.1 mm, 1.8 μm) at a flow rate of 0.5 mL/min over 22.5 min. Mobile phase A was (95 % HPLC water/5 % mobile phase B; v/v and 0.1 % acetic acid) and mobile phase B was acetonitrile/methanol (800 ml + 150 ml; and 0.1 % acetic acid). The following linear gradient for mobile phase B was applied: 30 % for 1 min, 30-35 % from 1 to 4 min, 35-67.5 % from 4 to 12.5 min, 67.5-100 % from 12.5 to 17.5 min and held at 100 % for 3.5 min, followed by 1.5 min at initial condition for column re-equilibration. Injection volume was 5 μL. Lipids were analyzed in scheduled multiple reaction monitoring (MRM) mode with a detection window of 55 s for each analyte. Ionization was performed using electrospray ionization in the negative ion mode with the following MS parameters: temperature 475 °C, N2 gas, GS1 60 psi, GS2 60 psi, curtain gas 35 psi, ESI voltage-4.5 kV. Cycle time was 0.4 s. Peak areas for lipids were integrated and normalized for deuterated internal standards and quantification was performed using external calibration curves with authentic standards for all investigated oxylipins. Data integration and quantification was performed using MultiQuant software (version 3.0.2, AB Sciex Framingham, MA, U.S.A.). A full list of the internal standards and oxylipins is provided in Supplementary Table 4 along with limit of quantification (LOQ), calibration range, MRM transitions and corresponding MS parameters (collision energy, declustering potential). In this assay, identification is based on retention time comparison with authentic standards and the presence of a diagnostic precursor and product ion pair, however stereochemistry is not established and in the case of lower abundance lipids, is often unclear. For that reason, chirality has been removed. Limit of quantitation (LOQ) for each lipid was set at the primary standard value closest to a minimum value of 5:1 for signal:noise, and all chromatograms from tissue/cell samples were manually checked for peak quality and excluded from analysis if they fell below limit of detection (LOD) of 3:1, signal:noise. Example chromatograms for all lipids analyzed are provided in Supplementary Figure 7.
Targeted lipidomics analysis of 12(S)-HETE, 12(R)-HETE, 12(S)-HETE d8 or tetranor 12(S)-HETE metabolites was performed on a Nexera LC coupled to a 4000 QTrap (AB Sciex). Briefly, liquid chromatography was performed at 40 °C using a Spherisorb ODS2 C18 column (4.6 × 150 mm, 5 μm, Waters) at a flow rate of 1 ml/min over 30 min. Mobile phase A was (75 % HPLC water/ 25 % acetonitrile; v/v and 0.1 % acetic acid) and mobile phase B was 60 % methanol/ 40 % acetonitrile; v/v and 0.1 % acetic acid. The following gradient for mobile phase B was applied: 50-90% B over 20 mins, then held at 90% B for 5 mins, followed by re-equilibration to 50% B from 25-30 mins. Injection volume was 10 μL. Ionization was performed using electrospray ionization in the negative ion mode with the following MS parameters: temperature 650 °C, N2 gas, GS1 60 psi, GS2 30 psi, curtain gas 35 psi, ESI voltage −4.5 kV. Cycle time was 1.46 s. Peak areas for lipids were integrated and quantification was performed using external calibration curve with 15-HETE-d8 as standard for all investigated compounds. Data integration and quantification was performed using MultiQuant software (version 3.0.2, AB Sciex Framingham, MA, U.S.A.). MRM transitions and corresponding MS parameters (collision energy and declustering potential) for each analyzed lipid is provided in Supplementary Table 5.
Mitochondrial stress test
Oxygen consumption rate (OCR) was measured using Seahorse XFe96 analyzer (Agilent) and the Seahorse XFe96 FluxPak according to the manufacturer’s protocols. Briefly, RAW/RAWAlox15 cells were seeded at 2.5 × 10⁵ cells/well and peritoneal macrophages were seeded at 5 × 10⁵ cells/well (and incubated with LPS (100 ng/ml). Mitochondrial function was assessed using inhibitors (all from Sigma) injected in the following order: oligomycin (1μM), FCCP (Carbonyl cyanide 4-(trifluoromethoxy)phenylhydrazone, 2 μM or 4 μM final concentration for peritoneal macrophages or RAW cells respectively), rotenone (1 μM), antimycin A (10 μ-M for peritoneal macrophages; 1 μM for RAW/RAWAlox15 cells).
Heatmap method
For generation of heatmaps, amounts (ng/106 cells) of each lipid were averaged, then log10 was applied to the mean value. Heatmaps were generated using Pheatmap in R. The Euclidean metric was chosen to establish the treatments’ relationships depicted as clusters[74]. The clusters are aggregated following the “shortest distance” rule. Lipids are color-coded by putative enzymatic origin (Supplementary Table 1).
Determination of reactive oxygen species generation by peripheral blood cells
Human blood from healthy workplace volunteers was obtained with ethical approval from School of Medicine (SMREC 16/02) with informed consent. Whole blood (5 ml) was drawn using a butterfly syringe into 50 μL heparin sodium; 12 μl of this was then placed in a microcentrifuge tube and 1 ml cold PBS added. Following centrifugation (350 x g, 5 min, 4°C) the cell pellet was recovered and resuspended, then stained with anti-CD15 BV510 (1:50 in 0.5 ml PBS, W6D3, Becton Dickinson) for 30 min on ice. Cells were centrifuged (350 x g, 5 min, 4 °C) and resuspended in DMEM media (+2 mM glutamine) containing amino-phenyl fluorescein (APF) (1:1000, cell concentration = cells from 5 μl blood per ml of APF media). S. epidermidis bacteria (clinical isolate)[44] were killed by incubation at 65 °C for 20 min, then washed by centrifugation and resuspended in PBS three times (12,000 x g, min). Bacteria were counted by flow cytometry using an Attune NXT; bacteria were excluded from other particles by size (Forward-scatter vs Side-scatter). Bacteria were first added to blood cells at varying doses, to determine optimal reactivity per donor isolate (ranging from 1.37 × 10⁵ −2.75 × 10⁶ bacteria per ml of APF media containing cells from 5 μl blood). For this, cells+bacteria were incubated for 20 min at 37 °C, then tubes place on ice. Cells were washed three times with ACK red blood cell lysing buffer (350 x g, 5 min, 4 °C) then analyzed by flow cytometry. Cell gating strategies are shown in Supplementary Figure 1C-E. This included forward-vs side-scatter profile (FSC vs SSC) that distinguishes neutrophils and monocytes from lymphocytes. Neutrophils were further separated from eosinophils and monocytes via their high expression of CD15 (Supplementary Figure 2 C-E). The bacterial dose was selected based on a neutrophil APF+ response of between 10-40 % APF+ve cells. Once this was optimized, the experiment was repeated in triplicate for each donor, and using three individual donors, using a fresh aliquot of blood. The additional step following APF addition, was that lipids or ethanol vehicle (1:100) were added and samples incubated at 37 °C for 10 min before the bacteria addition step. Lipids used and final concentrations are provided in Supplementary Table 2. Calculations assumed a 100 μl peritoneal volume in vivo (Supplementary Table 2) [75]. Next, bacteria were added, cells were incubated for 20 min at 37 °C, then tubes place on ice, washed, and analyzed using flow cytometry for APF+ve neutrophils or monocytes. Means for each donor were calculated separately and compared using two-way ANOVA with Sidaks post-test, where p < 0.05 was considered significant.
Assessment of mitochondrial DNA in LPS treated cells
RAW cells were seeded in 6 well plates at a density of 1×10⁶ cells/well and grown in DMEM (Lonza), supplemented with 10% FCS (Thermo Fisher Scientific), 2mM glutamine (Lonza) and 100 U/ml of penicillin/streptomycin (Lonza), 24 h prior to treatment. After 24 hrs, the medium was aspirated, and cells treated with LPS (100 ng/ml) or chloroquine (40 nM) and incubated for 24 hours. Total DNA was extracted from cells with PureLink Genomic DNA kit (Fisher Scientific, cat. No. 10053293) according to the manufacturer’s instructions and quantified using a Nanodrop (Thermo Scientific). Assessment of mtDNA copy numbers, relative to genomic DNA (gDNA), was done as previously described (PMID: 29677567). Briefly, quantitative PCR (qPCR) analysis was performed using PerfeCta™ SYBR® Green FastMix™, low ROX™ (Quanta Biosciences) and primers specific for mouse mtDNA (mouse mtDNA forward: 5’-CCCCAGCCATAACACAGTATCAAAC-3’, mouse mtDNA reverse: 5’-GCCCAAAGAATCAGAACAGATGC-3’) or the genomic 18S ribosome gene (mouse 18S forward: 5’-AAACGGCTACCACATCCAAG-3’, mouse 18S reverse: CAATTACAGGGCCTCGAAAG-3’) (Merck KGaA). Primers specific for mtDNA gives rise to a 201bp product, while primers specific for the 18S ribosomal gene gives a product that is 112 bp large. Quantitative PCR analysis was performed in a Stratagene MX3000P machine (Stratagene California, San Diego, CA, USA) using 96-well Non-Skirted, White PCR Plates (ABgene, UK) and MicroAmp Optical Caps (Applied Biosystems, UK). For qPCR, each sample reaction was performed on 25 ng of diluted total DNA in a total reaction volume of 20 μL, under the following conditions: 95°C for 2 minutes; 95°C for 15 seconds, 60°C for 1 minute, repeated 40 cycles; 95 °C for 1 minute, 55 °C for 30 s, 95°C for 30 s. To assess the mtDNA copy numbers, the ratio of mtDNA/gDNA was generated by normalizing the quantified mtDNA values to the quantified 18S DNA values.
To calculate mtDNA damage based on Lesion frequency, the DNA of the cells was isolated as described above and Assessment of mtDNA damage was done as previously described (PMID: 29677567). Using quantitative PCR (qPCR) analysis s describe above. A common reverse primer used (mouse mtDNA reverse: 5’-GCCCAAAGAATCAGAACAGATGC-3’) in combination with a forward primer called, short PCR primer (mouse short PCR primer 5’-GCAAATCCATATTCATCCTTCTCAAC-3’) or a forward primer called forward long PCR primer (long PCR primer 5’-CCCAGCTACTACCATCATTCAAGTAG-3’). The reverse primer with the short forward primer gives rise to a 16.2 kb product, while in combination with the long PCR primer give rise to a 80 bp product. The lesion frequency of the mtDNA s calculate using the equation below [76].

Transcriptional analysis of GEO datasets
A set of genes relevant to mitochondrial β-oxidation were collated, and then examined for differential gene expression (Supplementary Table 3). Published transcriptome data (NCBI Geo DataSets Accession numbers GSE53053; GSE69607; GSE84517; GSE46903; GSE35449 and GSE5099) regarding different macrophage phenotypes (M0 or M1 from both murine and human origin) generated using similar experimental conditions to those in the current study, were downloaded. All datasets were processed in R and using packages from Bioconductor. Affymetrix microarray data (GSE69607, GSE5099) were normalized and processed using Limma and Oligo Bioconductor packages[77, 78]. Illumina beadchip microarray data (GSE46903, GSE35449) were normalized and processed using Limma and lumi Bioconductor packages [77, 79]. Paired-end reads from Illumina sequencing (GSE53053, GSE84517) were trimmed with Trim Galore and assessed for quality using FastQC, using default parameters [80, 81]. Reads were mapped to the reference sequence (human GRCh38 or mouse GRCm38) reference genome using STAR and counts were assigned to transcripts using featureCounts with the Ensembl gene build GTF (GRCh38.96 or GRCm38.84)[82, 83]. Both the reference genome and GTF were downloaded from the Ensembl FTP site (http://www.ensembl.org/info/data/ftp/index.html/). Differential gene expression analyses used the DESeq2 package[84]. Genes were discarded from the analysis differential expression failed to be significant (significance: adj.pval < 0.05, Benjamini-Hochberg correction for multiple testing).
Analysis of human microarray data
Data from a published study was obtained[45]. Here, whole blood was analyzed using Illumina Human Whole-Genome Expression BeadChip HT12v3 microarrays comprising 48,802 features (human gene probes) from neonates with proven microbiological evidence of infection from a usually sterile body site (35 controls, 26 bacterial confirmed sepsis cases). These patients also demonstrated significantly elevated expression markers which form part of the published classifier for sepsis[45]. Log2 expression data for the set of relevant genes (Supplementary Table 3) was compared, Students t-test, significance: adj.pval < 0.05, Benjamini-Hochberg correction for multiple testing.
Analysis of mouse in vivo bacterial peritonitis gene expression
The SES model was carried out and lavage harvested at 3 or 6 hrs as described[46]. 8-12 weeks old WT C57Bl/6 mice were from Charles River. C57Bl/6 interleukin-6 (Il6−/−) mice were bred in house (UK Home Office PPL 30/2938, PPL P05D6A456). Parietal peritoneal tissue was extracted at 3 and 6 h post SES administration, collected using aseptic techniques. Two sections of lining were immediately snap frozen in liquid N2 and stored at −80 °C prior to total RNA extraction. For this, peritoneal membrane sections (80 mg) were dissociated in 1 ml buffer RLT (QIAGEN) supplemented with β-mercaptoethanol (1:100 v:v) using a handheld electric homogenizer (Benchmark Scientific). Lysate was diluted 1:3 in distilled water and digested in 0.2 mg/ml proteinase-K (Invitrogen; 25530049) for 10 min at 55 °C. Lysate was cleared and RNA precipitated in 70 % ethanol. Total RNA was extracted using the RNeasy minikit (QIAGEN; 24136) in accordance with the manufacturer’s instructions. RNA was eluted in 50 μl RNase-free water and quantified using a nanodrop 2000. The integrity and quality of RNA preparations was assessed using an Agilent 2100 bioanalyzer. Samples with an RNA integrity number (RIN) exceeding 8 were used for library preparation (2-4 μg input). Cytoplasmic, mitochondrial, and ribosomal RNA was depleted using the Ribominus transcriptome isolation kit (Ambion; K155001). Libraries were prepared using the RNA-seq kit v2 (Life technologies; 4475936) and sequencing on an ion torrent (Thermo Fisher). Raw data was mapped using Torrent Suite™ (STAR and Bowie2 aligners) using mm10 as the reference genome. Library quality was assessed using FastQC (Babraham Institute) and Github. Differential gene expression analysis was completed with DEseq2 (Bioconductor). For the specific genes tested (Supplementary Table 3), Students t-test was used, significance: adj.pval < 0.05, Benjamini-Hochberg correction for multiple testing.
Scheme 1. Proposed MS/MS for 8S-hydroxy-4Z,6E,10Z-hexadecatrienoic acid.

Scheme 2. Proposed MS/MS for 8S-hydroxy-6E,10Z-hexadecadienoic acid.

Scheme 3. Proposed MS/MS for D6-8S-hydroxy-6E,10Z-hexadecadienoic acid.

Scheme 4. Proposed biochemical mechanism of β-oxidation for 12-HETE.


Panel A. LC/MS/MS of lipid extract from peritoneal lavage (mouse treated with etomoxir and LPS). A lipid with same retention time as Mar1 was detected in lavage from mice treated with etomoxir and LPS in vivo, labelled herein as 7,14-diHDOHE, standard is shown in left panel, mouse lipid in right panel. Panels B. The impact of LPS and etomoxir on generation of 17,18-diHETE, measured by LC/MS/MS, in wild type and Alox15−/− (KO) naïve peritoneal macrophages. Supernatant from peritoneal macrophages was analyzed for oxylipins following culture of macrophages as outlined in methods, for 24 hrs with LPS (100 ng/ml) +/−etomoxir (25 μ-M). Panel C,D. Supernatant from RAWAlox15 cells treated with LPS/etomoxir contains isomers of 7,17-di-HDOHE. Cells were cultured with LPS/etomoxir for 24 hrs as in Methods, then supernatant was analyzed for the presence of RvD5 using LC/MS/MS/MS (Panel D). Authentic standard is shown for comparison (Panel C). Panel E. Etomoxir reduces generation of 17,18-diHETE from RAW cells. RAW cells were cultured for 24 hr with/without etomoxir (dose) and LPS (dose) before supernatant was harvested and analyzed using LC/MS/MS as in Methods. (n = 6, mean +/−SEM). *** p < 0.005 for with/without etomoxir, Students T test.

12(S)-HETE or 12-HETE-d8 (2.8 μg) were incubated with RAW cells for 3 hrs and then supernatants harvested for LC/MS/MS. Panels A,B. Formation of tetranor diene and triene 12-HETEs. A representative sample is shown for each, including chromatogram and MS/MS spectrum, with control (dotted line) and 12(S)-HETE-supplemented (solid line) samples overlaid. Panel C. MS/MS of the tetranor triene 12-HETE standard. Panels D,E. Formation of the 12(S)-HETE-d8 tetranor diene, following supplementation of 12(S)-HETE-d8 to RAW cells, showing a representative chromatogram (D) and MS/MS spectrum (E).

Panel A. Extracted Ion chromatogram, high resolution MS spectrum, and MS/MS spectrum of the tetranor-12(S)-HETE triene standard. Panel B. Addition of tetranor triene 12(S)-HETE leads to formation and secretion of the diene isomer. 2.8 μg triene standard was incubated with 106 RAW cells for 3 hr, then supernatants harvested and analyzed using LC/MS/MS.

1H (Panel A) and 1H-1H COSY (Panel B) NMR demonstrates that the H11 vinyl proton at 5.60 ppm is connected to the methylene H12 protons at 2.05 ppm, which itself is connected back to the alkyl protons at 1.33 ppm. This identifies the 5.60 ppm signal as H11, which correlates with one of the protons that overlap at 5.4 ppm (area of two protons). This 5.4 ppm signal must then be the H10 proton as well as the H4 vinyl proton (which correlates with the H5 vinyl proton and H3 methylene protons).

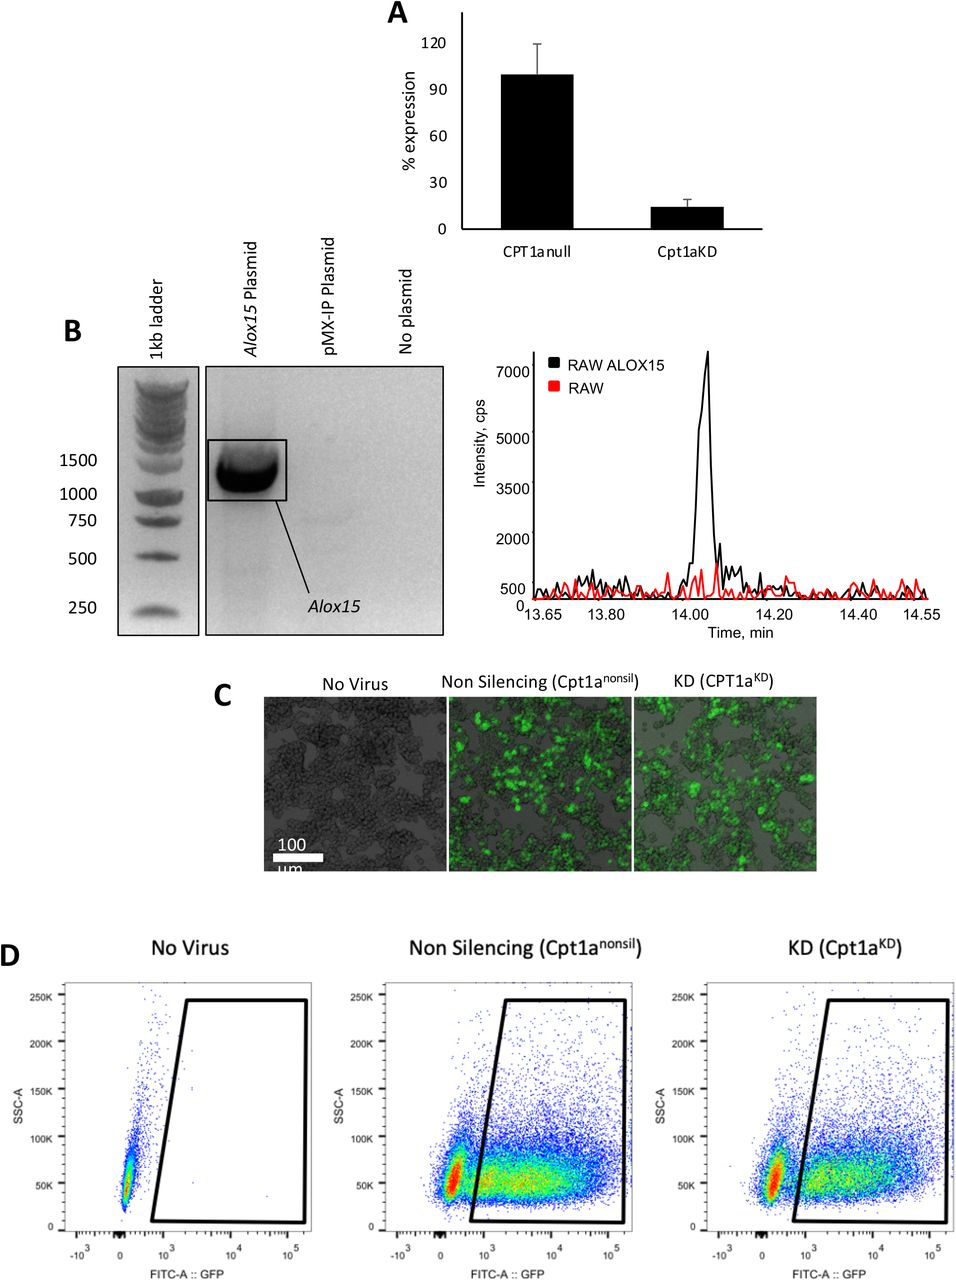
Panel A. Images of RAW264 cells infected with viruses (purified by 2.5 μg/ml puromycin) taken on a 10x objective lens using an EVOS microscope (Life Technologies). Image shows transmitted brightfield overlaid with Green fluorescent GFP. Panel B. Representative images showing GFP expression and sort gates for RAW264 cells infected with viruses using the BD FACS Aria II flow cytometer. Panel C. Cpt1a expression is suppressed in Cpt1aKD cells versus Cpt1anull. Bar graph showing the effect of Cpt1a knockdown shRNA on Cpt1a gene expression in RAW264 macrophages. Data was recorded by measured by real-time PCR. Data (n = 3 per group) represents at least two independent experiments related to Figure 6. Panel D. Expression of Alox15 in RAW cells. RNA was isolated from the RAWAlox15−/− and pMX-IP control cell lines, then converted to cDNA and PCR was performed using primers to amplify Alox15. Amplified PCR products were run on a 10% agarose gel and showed that Alox15 was amplified from the Alox15 plasmid, but not from the pMX-IP cDNA (plasmid) control, or the no DNA (no plasmid) control, thereby confirming expression as expected. Chromatogram shows generation of 12-HETE in RAWAlox15 cells only, but not mock transfected controls.
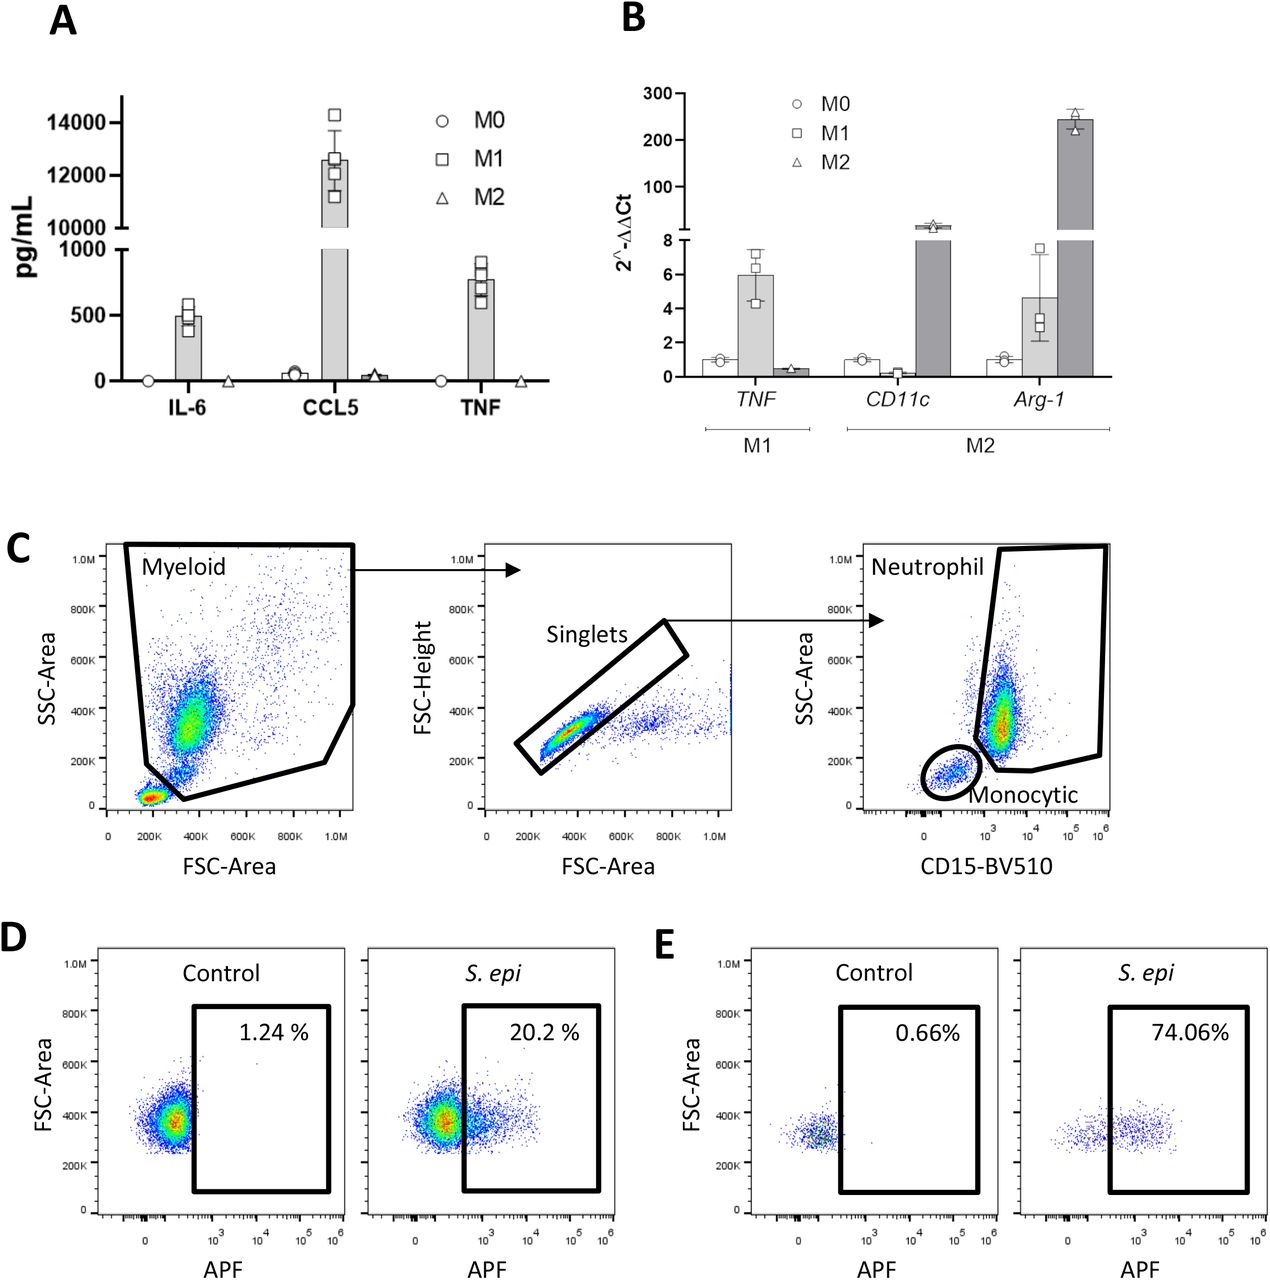
Panel A. M1 macrophages secrete typical cytokines. Cytokine production of typical M1 phenotype markers (IL-65, CCL5 and TNF) were determined by ELISA analyses of supernatants post differentiation as described in Methods. Panel B. Confirmation of classical and alternative activation in BMDM. RNA was isolated from activated BMDM, converted to cDNA and then analyzed by real time PCR as described in Methods section. Probes for typical phenotype markers are indicated inset, mean +/−SD. Panels C-E. APF flow cytometric gating strategy. Representative flow cytometry plots showing the gating strategy for neutrophils and monocytic cells, with a distinctive forward-vs side-scatter profile (FSC vs SSC) that distinguishes them from lymphocytes (Panel C). Neutrophils were further distinguished from eosinophils and monocytes via high expression of CD15. Representative gating for Aminophenyl fluorescein (APF) positive neutrophils (Panel D) and monocytes (Panel E) is depicted in the presence or absence of Staphylococcus epidermidis (S. epi).


Acknowledgements
Funding from Wellcome Trust (094143/Z/10/Z) and European Research Foundation (LipidArrays) is gratefully acknowledged (VBO). VBO is a Royal Society Wolfson Research Merit Award Holder and acknowledges funding for LIPID MAPS from Wellcome Trust (203014/Z/16/Z). Ser Cymru Project Sepsis grant funded by WG/EU-ERDF (PG, VBO). PRT is funded by a Wellcome Trust Investigator Award (107964/Z/15/Z) and the UK Dementia Research Institute. VDU acknowledges The Nathan Shock Center P30 AG05088. Kidney Research UK (Reference RP-024-20160304 awarded to SAJ), Versus Arthritis (Reference 20770 awarded to SAJ, VOD). We gratefully acknowledge expert input from Alan Brash, Vanderbilt University, relating to lipid structural elucidation, James Burston for supporting analysis of mitochondrial function, Widad Dantoft for provision of the human sepsis dataset, and our colleague Javier Uceda Fernandez (deceased), Cardiff University for the murine transcriptomics dataset.
References
- 1.↵
- 2.
- 3.
- 4.
- 5.↵
- 6.
- 7.
- 8.
- 9.
- 10.↵
- 11.
- 12.
- 13.
- 14.
- 15.
- 16.↵
- 17.↵
- 18.↵
- 19.↵
- 20.↵
- 21.↵
- 22.↵
- 23.↵
- 24.↵
- 25.↵
- 26.↵
- 27.↵
- 28.↵
- 29.↵
- 30.↵
- 31.↵
- 32.↵
- 33.↵
- 34.↵
- 35.↵
- 36.↵
- 37.↵
- 38.↵
- 39.↵
- 40.↵
- 41.↵
- 42.↵
- 43.↵
- 44.↵
- 45.↵
- 46.↵
- 47.↵
- 48.
- 49.
- 50.
- 51.
- 52.↵
- 53.↵
- 54.↵
- 55.
- 56.
- 57.
- 58.↵
- 59.↵
- 60.↵
- 61.↵
- 62.↵
- 63.↵
- 64.↵
- 65.↵
- 66.↵
- 67.↵
- 68.↵
- 69.↵
- 70.↵
- 71.↵
- 72.↵
- 73.↵
- 74.↵
- 75.↵
- 76.↵
- 77.↵
- 78.↵
- 79.↵
- 80.↵
- 81.↵
- 82.↵
- 83.↵
- 84.↵


