

Abstract
How does the brain change during learning? Functional magnetic resonance imaging studies have used both pattern analysis and repetition suppression (RS) to detect changes in neuronal representations. In the context of motor sequence learning, the two techniques have provided discrepant findings. Specifically, pattern analysis showed that only premotor and parietal regions, but not primary motor cortex (M1), develop a representation of trained sequences. In contrast, RS suggested trained sequence representations in all these regions. Here we applied both analysis techniques to data from a 5-week finger sequence training study, in which participants executed each sequence twice before switching to a different sequence. While we replicated both previously reported findings in the same paradigm, a more fine-grained analysis revealed that the RS effect in M1 and parietal areas reflect fundamentally different processes. On the first execution, M1 represents especially the first finger of each sequence, which might reflect preparatory processes, and this effect dramatically reduces during the second execution. In contrast, parietal areas represent the identity of a sequence, and this representation stays relatively stable on the second execution, only reducing proportionally to the reduction in overall activity. These results suggest that the RS effect in M1 does not reflect trained sequence representation, but rather the altered communication with higher-order areas. More generally, our study demonstrates that RS can reflect different representational changes in the underlying neuronal population code across regions, emphasizing the importance of combining pattern analysis and RS techniques.
Introduction
The ability to learn and produce complex sequences of movements is essential for many everyday activities, from tying laces to riding a bicycle and playing instruments. When learning such motor skills, behavioural improvements are readily observable. In contrast, the neural substrates underlying these changes have remained more elusive. Searching for where the newly acquired skills are represented in the brain has been one of the central questions in motor neuroscience (1).
One central issue in this debate is whether skilful sequence execution relies on representations in premotor and supplementary motor areas, or whether the sequences are learnt and represented in the primary motor cortex (M1) itself (2–10; for reviews see 11,12). Functional magnetic resonance imaging (fMRI) studies that investigated finger sequence learning have provided conflicting evidence to this question. A recent longitudinal 5-week training study from our lab (13) showed no overall activity changes with learning in M1, and no changes in the sequence-specific activity patterns in this region. In contrast, clear learning-related changes in both overall activity and fine-grained activity patterns were observed in premotor and parietal areas. Other recent studies suggest that M1 represents only movement elements of a sequence, but not the sequence itself (8,10,14). Together, these results reinforce the idea that M1, as measured at the spatio-temporal resolution of fMRI, does not represent learnt motor sequences.
Using the technique of repetition suppression, however, Wymbs and Grafton (15) provided evidence for the representation of skilled sequences in M1. Repetition suppression (RS) refers to the observation that a stimulus repetition evokes reduced neuronal activity compared to its initial presentation (16). This technique has been commonly used as a tool for investigating brain representation (17–24) following the logic that if, on average, regional activation reduces upon repetition, then the underlying neuronal population must represent at least one of the repeated aspects of the stimulus. Based on this, stronger RS effects are commonly interpreted as more robust representations (18). Wymbs and Grafton (15) found learning-related changes in RS across several regions, including premotor and parietal areas. Critically, RS also increased in M1, suggesting that M1 might represent trained sequences. This stands in stark contrast to the above-mentioned studies that used pattern dissimilarity analyses and found no evidence of sequential representation in M1.
We reasoned that this discrepancy may reflect the fact that RS can be caused by a range of changes in the neuronal population code, and hence may reflect different changes in brain computation (18,25). To understand RS effects in more detail, we need to know what aspects of the underlying representations reduces from the first to the second repetition of a stimulus or movement. We, therefore, designed a paradigm that allowed us to investigate changes in RS and changes in multivariate activity patterns within the same study.
We trained healthy volunteers to produce motor sequences over 5 weeks and tested their performance during high-field (7 Tesla) fMRI scanning. In the scanner, participants performed trained and untrained sequences. Changes in overall activity and multivariate patterns have been reported in a previous paper (13). Each sequence was executed twice in a row, allowing us to conduct both pattern and RS analysis on the same data. We first replicate the discrepancy in the literature, with RS indicating that M1 develops a sequence representation with training, and multivariate analysis indicating the opposite. Using pattern analysis, we then decompose the activation patterns in the first and second repetition to determine which representational aspects underlie the RS effects in the different regions.
Results
Learning paradigm
We trained 26 participants to execute six 9-digit finger sequences with their right hand (Fig 1a), over a period of 5 weeks (Fig 1b). Over the 14 days of training, the average MT decreased by 62%. Participants also underwent scanning (using 7T MRI) while executing the 6 trained and 6 untrained sequences. In this paper we focus on results from week 1, i.e., before training, and week 5, i.e., after training (Fig. 1c; see Methods for details). The design also included 2 more sessions throughout training, which are reported in a previous paper (13). The trials in the scanning sessions were structured so that the same sequence was always executed twice in a row (Fig 1d). This design choice allowed us to contrast brain responses during the first execution to that of the second execution to examine repetition effects.

a) Experimental setup – finger sequences composed of 9 digits were executed on a keyboard device. Participants received visual feedback on correctness of their presses – digits turned green for correct presses, red for incorrect presses. b) Group-averaged performance on trained sequences over the 5-week behavioural training protocol. Red shade indicates the standard error of the group mean. c) Group-averaged performance during the pre-training and post-training scanning sessions paper. Trained sequences are in red, untrained in blue. Dark colour indicates first execution, light second execution. White bars indicate the group mean performance. d) Experimental paradigm inside the scanner. Each sequence was presented twice in a row. Trials started with a 1s preparation time in which the 9-digit sequence was presented, followed by a 3.5s period of sequence execution and 0.5s of inter-trial interval (ITI). Periods of rest were intermixed between trials to allow for an estimate of resting baseline activation. Yellow and purple indicate two different motor sequences. Darker shades indicate first execution, lighter shades second execution.
Changes in repetition suppression and pattern dissimilarities with learning
To examine learning-related changes in repetition suppression and pattern analysis, we calculated both metrics on fMRI activation patterns in the pre-learning session (i.e. week 1), and in the post-learning session (week 5). Relative to rest, sequence execution activated the primary motor cortex (M1), the primary somatosensory cortex (S1), premotor dorsal and ventral regions, supplementary motor cortex and the superior parietal lobules (SPL; Fig 2a-b). Activity was higher for the first than for the second execution. The amount of repetition suppression was calculated as the difference in the elicited activation between the two executions of the same sequence (exe 2 – exe 1). Negative values indicate a relative reduction in activation with repetition, i.e., repetition suppression (RS). Already in week 1, prior to learning, RS was observed in nearly all regions displaying task-evoked activation (Fig 2b-c). In regions that showed de-activation during task performance (blue shades in Fig 2a), we observed positive difference values between the executions (areas in red shades in Fig 2c). This indicates that, both the amount of activation, as well as the amount of deactivation reduced with repetition.

a) Group-averaged evoked activation, measured as percent signal change over resting baseline in week 1, averaged across all sequences and projected to an inflated representation of the left hemisphere. b) Group-averaged activation for each execution (Exe1, Exe2), in the baseline session (Week 1) and after training (Week 5) represented on a flattened representation of the left hemisphere. CS stands for the central sulcus. c) The difference in evoked activation between the two executions. Blue represents relative suppression of activation on the second, relative to the first, execution. Regions of interest: primary motor cortex (M1), dorsal premotor cortex (PMd), anterior superior parietal lobule (SPLa). d) Average dissimilarity between evoked patterns for all pairs of sequences, in week 1, averaged across the group. Pattern dissimilarity was computed using a searchlight approach, by calculating the average Crossnobis dissimilarity of activation patterns between all sequence pairs in each searchlight. The mean dissimilarity of a searchlight was assigned to its centre (see Methods). e) Average dissimilarity between activation patterns of different sequence pairs in weeks 1 and 4. f) Repetition suppression in the predefined regions of interest. Repetition suppression is calculated as the difference in group-averaged activation between the two executions for trained (red) and untrained (blue) sequences. Error bars reflect the standard error of the group. More negative values indicate more suppression during second execution, relative to the first. * signals p<.05. g) Dissimilarities between trained (red) and untrained (blue) sequence patterns, across weeks 1 and 5. Error bars reflect the standard error of the group. * signals p<.05.
Next, we examined whether the regions that exhibited RS also displayed distinct activity patterns for different sequences (i.e., sequence-specific representations). Pattern dissimilarities were calculated as the average crossvalidated Mahalanobis dissimilarity (i.e., Crossnobis dissimilarity) between activation patterns of all possible sequence pairs (see Methods for more details). Overall, regions with dissimilar activity patterns for the different sequences corresponded to regions which also exhibited RS effects (Fig 2c-e). Additionally, both metrics (RS and pattern dissimilarities) increased with from week 1 to week 5, with the effect particularly pronounced in the parietal cortex (Fig 2c, e). Thus, based on visual inspection, RS and pattern dissimilarity metrics seem to provide consistent evidence for the development of sequence-specific representations with learning in an overlapping set of regions.
However, a more detailed inspection reveals some important differences between these two metrics. To show this, we focussed on a set of predefined regions of interest: the anterior SPL (SPLa), the dorsal premotor cortex (PMd), and M1. In SPLa and PMd, pattern dissimilarities increased specifically for the trained sequences (Fig 2g), as quantified by a significant interaction in a week x sequence type ANOVA (SPLa: F(1,25)=4.80; p=.038, PMd: F(1,25)=5.29, p=.030). The RS effects in the same regions paralleled those of pattern dissimilarities, with bigger increase in RS for trained than untrained sequences (Fig 2f; SPLa: F(1,25)=17.44; p=3.1e−4, PMd: F(1,25)=7.27, p=1.1e−6). Furthermore, the observed change in RS across weeks replicated a previously reported finding (15; see supporting figure S1). Thus, in PMd and SPLa, trained sequences exhibited more dissimilar activity patterns and a stronger RS, together suggesting these regions develop a dedicated representation of the trained sequences with learning.

Activation elicited on the first (x-axis) and second (y-axis) execution for trained (red) and untrained (blue) sequences across weeks 1, 2 and 5, in sessions using paced performance. Regions: anterior superior parietal lobule (SPLa), dorsal premotor cortex (PMd), primary motor cortex (M1). Ellipses reflect the standard error of the group. Dots below the diagonal line indicate activation was lower on second execution.
In contrast, the two metrics diverged in M1. Here, pattern dissimilarities did not change with learning, i.e., the week by sequence type interaction was not significant (Fig 2g;F(1,25)=2.13, p=.16). In contrast, RS increased more for trained than untrained sequences with learning (Fig 2f; F(1,25)=25.09; p=3.6e−4). These results, thus, replicate the previously reported discrepancy in findings showing increased RS in M1 with learning (15), yet no change in pattern dissimilarities (13), within the same dataset.
Pattern dissimilarities reduce with repetition
Pattern analysis and RS therefore provide conflicting evidence on the nature of learning-related change in M1. While the increase in pattern dissimilarities (Fig 2f), as well as direct evidence for cross-session pattern changes (13), clearly argue that sequence-specific learning occurs in premotor and parietal areas and not in M1, RS provides evidence for the development of sequence-specific representations in both parietal / premotor regions and M1.
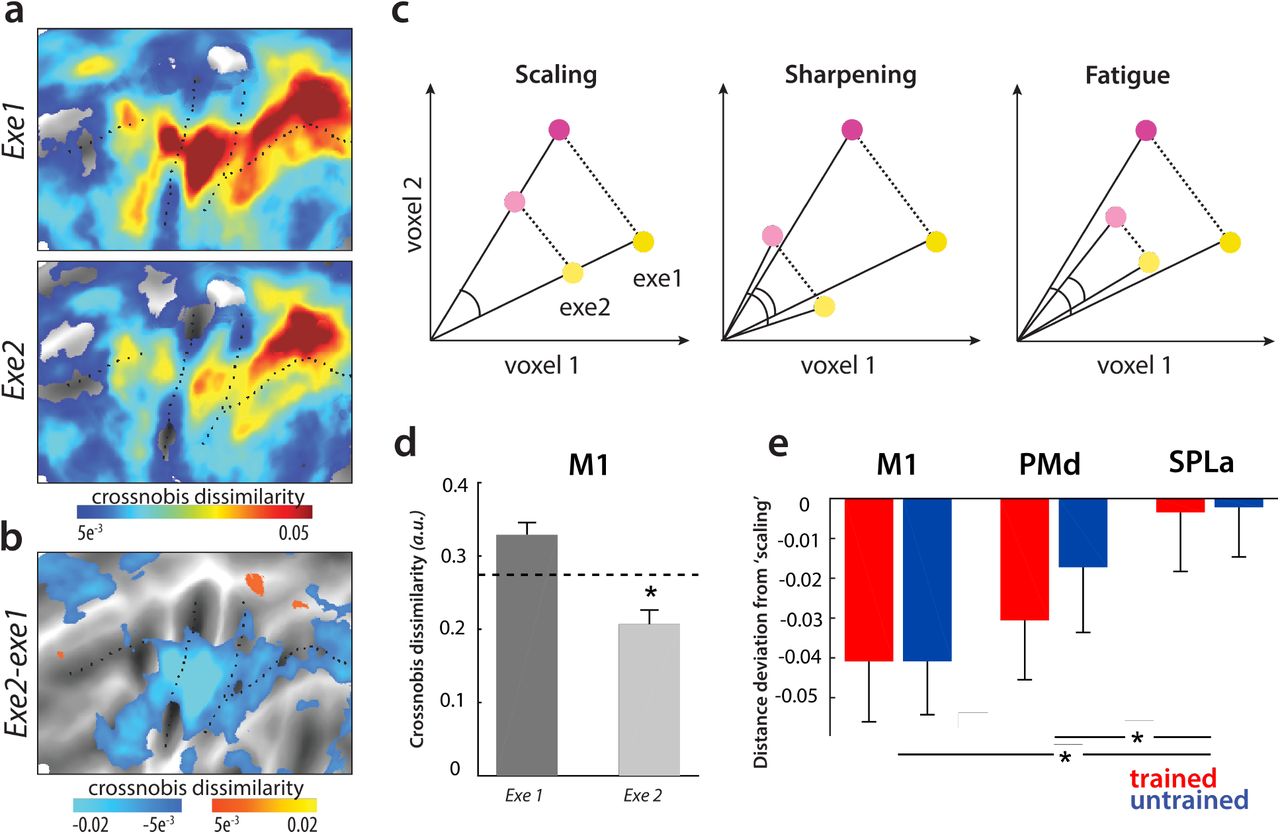
How can this discrepancy be explained? To resolve this question, we need to understand how the representations in each area during skilled performance change from the first to the second execution. We first inspected pattern dissimilarities for each of the two executions separately (execution 1, execution 2) in the trained state (Week 5). We observed that, on average, pattern dissimilarities in week 5 decreased with repetition in most cortical regions (Fig 3a). This decrease was particularly pronounced in M1 (Fig 3b).

a) Dissimilarities between pairs of sequences in week 5 (post-training), split by first and second executions. b) Difference in pattern dissimilarities between executions 1 and 2. Blue hues reflect relatively lower dissimilarities on the second execution. c) Different possible accounts of representational change with repetition. Yellow and purple indicate two different conditions, i.e. motor sequences in our paradigm. Darker shades indicate first execution, lighter shades second execution. Scaling: dissimilarities scale proportionally to activation reduction with repetition. Sharpening: dissimilarities on the second execution are relatively higher than during the first execution, after accounting for activation reduction. Fatigue: Dissimilarities reduce on repetition more than expected from the reduction in activation. d) Average Crossnobis dissimilarity between pairs of evoked sequence-specific patterns in week 5 in the primary motor cortex (M1), split by execution. Dashed line depicts expected dissimilarities if distances scaled proportionally with reduction of activation on repetition. The difference between dissimilarities on execution 2 and dashed line is plotted in e). * denotes p<.05 for comparison between the observed dissimilarities on execution 2 and the expected ones under scaling. e) Difference between the expected dissimilarity under scaling of activation and the observed dissimilarities on the second for trained (red) and untrained (blue) activity patterns. Regions: M1, dorsal premotor cortex (PMd), anterior superior parietal lobule (SPLa). Zero indicates proportional scaling with activation. * denotes p<.05.
The relationship between the reduction in overall activity with repetition and the reduction of pattern dissimilarity provides a way of distinguishing three different accounts of RS (Fig 3c; 17). According to one hypothesis (the scaling account), all of the involved voxels scale their activation with repetition, proportional to the initial activity in the first instance. This account predicts that dissimilarities reduce proportionally, i.e. scale, to the decrease in activation. Alternatively (following the sharpening account), representation could sharpen with repetition – this would occur if the neuronal population most sensitive to different motor sequences would still be active on repetition, but the less selective neurons (i.e., background noise) would decrease their activation. As a third option (the fatigue account), the most active and selective neurons would decrease their firing the most on repetition, resulting in a representational fatigue, which predicts that dissimilarities reduce more than the reduction in overall activity.
Given this set of competing accounts, we first investigated how overall dissimilarities within a region change across the two executions relative to changes in activation within the same region. We quantified the amount of activation as the length of the average activity vector relative to rest, separately for each execution (length of lines in Fig 3c, see Methods for details). We then calculated the ratio of the activity during the second execution over the activity during the first. This ratio was applied to the observed dissimilarities on the first execution (dashed line in Fig 3d), yielding a prediction of what dissimilarities would be expected for the second execution, if representation scaled with activation. Relative to this expected dissimilarity, the observed dissimilarities of M1 patterns were significantly lower during the second execution (Fig 3d; t(25)=3.87, p=6.9e−4). This indicates that M1’s representational change is more in line with the representational fatigue account, which proposes that the neuronal populations most tuned to performed sequences on the first execution reduce their firing the most with repetition.
In contrast to M1, PMd and SPLa’s dissimilarities on the second execution were closer to the expected dissimilarities under scaling (Fig 3e; also see supporting figure S2 for a depiction of distance deviation from scaling across the cortical sheet). To quantify whether the representational nature of repetition differed qualitatively across regions, we performed a region x sequence type ANOVA. The main effect of region was significant (F(2,50)=7.42, p=1.5e−3). Post-hoc t-tests revealed that this was driven by a significantly larger deviation from scaling in M1 as compared to SPLa (t(25)=3.55, p=1.56e−3). M1 and PMd did not differ from one another (t(25)=1.25, p=.22). There was a significant difference between PMd and SPLa (t(25)=2.65, p=.013), indicating a more ‘scaling-like’ representation in SPLa. There was no main effect of sequence type (F(1,25)=1.35, p=.26), nor a region x sequence type interaction (F(2,50)=2.10, p=.14). Altogether this indicates that representational change with repetition differed across regions: proportional scaling of representation in parietal regions, and much more pronounced decrease of dissimilarities in M1, similar to the fatigue account.

This was calculated for each of the regularly tessellated regions. Blue depicts lower dissimilarities than expected under the scaling account, yellow higher dissimilarities than predicted under scaling of activation.
Decomposing representations across executions 1 and 2
Analysis of average dissimilarities across executions revealed bigger compression of representation in M1 than in parietal regions. This analysis, however, does not reveal which aspects of the representations are responsible for this regional difference. To investigate exactly how the representation changed, we decomposed the representations during each execution into several underlying representational components. Differences in activity patterns can reflect differences in various characteristics, or features, of the performed sequences (Fig 4a). Specifically, based on previous results (10,14), we hypothesized that the covariance (or similarity) between activity patterns can be explained with the following 5 components (Fig 4b, see Methods for details): 1) first finger: the pattern is determined by the starting finger, 2) all fingers: the pattern reflects a linear mixture of finger-specific patterns, 3) sequence type: trained and untrained sequences have different average patterns, 4) trained sequence identity: the trained sequences differ amongst each other, 5) untrained sequence identity: the untrained sequences (7-12) differ amongst each other. Using pattern component modelling framework (26), we constructed a model family out of these components, which consisted of all possible combinations of those 5 components, totalling 25 models (see supporting figure S3a). These models were then fit to the observed regional covariance structure (second moment matrices; Fig 4c), separately for executions 1 and 2. The crossvalidated log Bayes factor relative to null model (i.e. no component present), and relative to the noise ceiling, is shown in supporting figure S3 for each of the combination models. To integrate the results across models, we then used Bayesian model averaging and estimated how much pattern variance was accounted for by each of these components (see Methods for details).

a) Construction of a model family from the five components. All possible combinations of five components were used to construct models, resulting in 32 (25) models. The first model is a ‘null’ model (no component) and the last is a full model (all components). White squares indicate presence of the component in each model. b) Evidence for all models across regional activation, separately examined for the first and second sequence execution (left, right column). Regions: primary motor cortex (M1), dorsal premotor cortex (PMd), anterior superior parietal lobule (SPLa). The 32 evaluated models are presented on the x-axis. Model fits were assessed with a type-II log-likelihood. The difference in log-likelihood between each model and the null model was calculated; this can be interpreted as a log-Bayes factor (Log-BF) and is plotted on the y-axis. The grey shaded area represents the mean noise ceiling ± standard error of the group mean. The bar with a star is the best performing model. All models in red performed within the noise ceiling and did not differ from one another. Bars in dark blue depict models which hit the noise ceiling, but performed significantly worse than the best performing model. Bars in light blue did not reach the noise ceiling performance.

a) Executed 9-digit sequences. Trained sequences of group 1 (presented here) were untrained for group 2, and vice versa. b) Candidate component models used to assess regional representations across first and second executions. Each row and column indicate a specific sequence, and values in the matrices reflect the correspondence across sequences on that component, with yellow indicating higher correspondence. c) Regional representations during the first execution of sequences, as assessed by the crossvalidated second moment matrix, averaged across subjects of group 1. Similar as for models, each row and column reflect an activation pattern for an individual sequence. Regions: primary motor cortex (M1) and anterior superior parietal lobule (SPLa). d) Variance explained by candidate model components on executions 1 (black) and 2 (grey) in M1, PMd (dorsal premotor cortex) and SPLa. See also supporting figure S3 for performance of all models in model family. e) Relative contribution of variance explained in d) across the different components. The total variance explained across the different components (i.e. sum of the bars in d) was normalized across the two executions to display the relative shift of importance of different representational components.
In M1, the regional representation on the first execution was accounted for by the individual movement elements (fingers), with especially high weight on the first finger (Fig 4d). This replicates the recent finding that M1’s representation during sequence production tasks can be fully explained by the starting finger, but does not reflect differences later in the sequence (10,14). In the current study, we did not match the sequences in terms of the number of times each of the five fingers was pressed. Thus, subsequent finger presses, encoded in the ‘all finger’ component, also accounted for substantial variance, independent of the exact ordering of these movements.
To statistically quantify these effects, we calculated component Bayes factors for individual components. The Bayes factors were significant for both first and all finger factors (first finger: BF=13.3, t(25)=3.1, p=4.8e−3; all fingers: BF=19.6, t(25)=4.1, p=3.4e−4). In contrast, the component Bayes factors were not significant for any sequence-related feature – neither sequence type (BF=3.2, t=1.9, p=.07), nor sequence identity: of trained sequences (BF=1.6, t(25)=1.5, p=.16) or untrained sequences (BF=0, t(25)=−0.2, p=.85). Thus, the pattern analysis clearly shows that activity patterns during the first execution in M1 can be explained by a superposition of individual movements, without clear evidence of a sequence representation.
In SPLa and PMd, the variance explained during the first execution was well accounted for by sequence type (SPLa: BF=48.0, t(25)=5.85, p=4.22e−6, PMd: BF=55.2, t(25)=4.97, p=4.0e−4), and trained sequence identity (SPLa: BF=7.2, t(25)=3.03, p=5.6e−3; PMd: BF=6.0, t(25)=2.5, p=.019). There was no significant evidence for representation of untrained sequence identity in either of the regions (SPLa: BF=0.8, PMd: BF=0; t(25)<=1.1, p>=.28). In comparison to M1, the variance related on individual movements – either the first finger or all fingers were weaker across PMd and M1. In PMd the first finger still accounted for some variance (BF=4.1), but this was further reduced in SPLa (BF=0.5).
With repetition, the pattern component related to the first finger drastically reduced, in M1 by 93% (Fig 4d). The reduction in variance explained by the first finger component was larger than for the all finger component, which reduced by 75% (paired t-test: t(25)=9.03, p=2.4e−9). This indicates that the drastic reduction of average dissimilarities in M1 with repetition is mostly due a pronounced first-finger effect during the first execution that almost vanishes on the second execution. Large reductions in first finger effect were also observed in PMd (by 81%) and SPLa (by 83%). In contrast, the representation of sequence type and trained sequence identity in these areas clearly reduced less (PMd: sequence type: 44%, trained sequence: 64%; SPLa: sequence type: 49%, trained sequence: 55%). The statistical significance of these effects was confirmed using a paired t-test, comparing the % reduction of the first finger and trained sequence factors within each region (PMd: t(25)=7.96, p=2.6−8; SPLa: t(25)=12.8, p=1.7e−12).
In summary, SPLa’s regional activation patterns were better accounted for by components related to the sequence identity than to the first finger, which also reduced much less with repetition. This likely explains why the average dissimilarities did not compress with repetition in SPLa regions as much as in M1. PMd’s representation was in-between those of M1 and SPLa – more variance was accounted for by the first finger than in SPLa, but less than in M1. With repetition, the proportion of different components to overall regional representation remained relatively stable in PMd and SPLa (Fig 4e), but changed substantially in M1 in that the dominant first-finger representation on the first execution nearly disappeared on the second execution.
Discussion
In the present study, we examined how brain representations of motor sequences evolve with training using a combination of pattern analysis and repetition suppression. Both pattern analysis and RS are commonly used to examine brain representations (18,27–30). The two methods often provide convergent results about the representational content of brain regions (24,17) – but sometimes there are discrepancies between the two. Specifically, in the context of motor sequence learning, previous studies using pattern analysis have reported no evidence of M1 representing trained motor sequences with learning (9,10,13). In contrast, one study (15) has reported learning-related increases in RS even for M1, which suggests a representation of the trained sequences in this region.
We first replicated the discrepancy between these two metrics in M1 in the same experiment. Closer examination of this discrepancy revealed that, with repetition, pattern dissimilarities decreased, particularly in M1. When decomposing regional representations into different underlying components, we observed that M1 mainly represents the first finger in a sequence. This component diminishes dramatically on a repetition. In contrast, the representation of sequence type and identity, which accounted for most of the variance in premotor and parietal areas, remained more stable across the two executions. This suggests that RS acts differently on different components of neuronal representations; thus it’s interpretation also varies across regions which differ in their regional code.
Our findings suggest a new model of the interaction between parietal/premotor areas and M1 during the execution of skilled motor sequences. During the first execution, premotor and parietal regions contain information about the specific sequence that needs to be executed (Fig 5). Additionally, premotor regions also reflect the starting finger of the sequence. These regions send signals to M1, pre-activating the neural circuits for the movement of the first finger. This replicates a previous finding that the difference between M1’s activation patterns is explained by the starting finger, rather than reflecting true sequence representation (10). The finding is also consistent with results from neurophysiology (31) and magneto-encephalography (MEG; 32), showing the first action in a sequence is most highly activated in premotor and motor areas during the preparatory period. Since M1 does not contain representation of sequence identity, continuous signals from higher-order regions provide it with the sequential context needed throughout the sequence production (8,33).

Different dots represent activation patterns for different finger sequences. Regions: anterior superior parietal lobule (SPLa), dorsal premotor cortex (PMd), primary motor cortex (M1). Arrows depict communication between higher-order areas and M1. Activation levels of three hypothetical voxels are indicated across the 3 axes.
Upon repetition of the same sequence, activation reduces across all regions (Fig 5). This effect is already present before training, but its strength increases with training. The global reduction in activation likely indicates that the initial volley of inter-regional communication is established the first time, and does not need to be re-initialised (18). The analysis of the regional representations in terms of their components indicates that this reduction is most pronounced in the pre-activation of the first finger. In contrast, the information about sequence identity in premotor and parietal regions reduces only moderately, but otherwise remains similar to the first execution. This suggests that the sequence representation is always necessary for successfully guiding M1 through the correct sequences of actions, whereas the first finger does not need to be pre-activated for a successful second execution.
Overall, our results suggest that M1 does not represent individual trained sequences with learning, despite increased RS. Instead, its representation is characterized by combinations of finger presses. If this is true, why was RS in M1 stronger for trained than for untrained sequences? Since fMRI activation reflects the driving input into the area (34), this effect may reflect changes in the communication between higher-order areas and M1, which may become more efficient with repetition of trained sequences. Some support for this idea comes from a recent study demonstrating layer-specific effects in M1 (35). By measuring changes in cerebral blood volume across layers, the authors demonstrated that superficial M1 layers (which reflect inputs into M1) show RS, whereas deep layers’ activation (which is more indicative of M1’s outputs) is enhanced during repetition. Since the blood-oxygenated level depend signal (BOLD) is biased towards the superficial vascular signals, our activation results more likely reflect inputs into M1.
An alternative explanation for M1’s increased RS for trained sequences is that M1 does contain sequence information, albeit at a spatial scale which cannot be detected by pattern analyses. In line with this idea, a prior electrophysiology study reported differential M1’s responses to trained relative to random sequences (7). This study, however, only reflected an overall difference between trained and random sequences, but not M1’s differential activation for different trained sequences, thus no sequence representation as defined here. More recent electrophysiological studies have shown that M1 only represents the ongoing movement, and does not represent the sequential context (8,33). Altogether, this makes M1 representing individual trained sequences a less likely explanation of our results.
There are a number of limitations of the current study which merit future experimentation. First, our study did not differentiate between repetition suppression and expectation suppression (36,37). Expectation of repetition has been shown to modulate RS. We suspect that our observed effects would likely be weaker had the sequence repetition been less predictable, although we would not expect qualitatively different patterns of results. Second, the RS accounts tested here are by no means an exhaustive list. Other studies have examined additional models of RS (25,38). Some of those can only be tested with measurements providing better temporal resolution than that afforded by fMRI. For instance, a facilitation model predicts a faster start and finish of neuronal responses with repetition (22,39), which we are unable to assess using the sluggish temporal resolution of fMRI. Similarly, differences in neural synchronization across regions have been discussed as a mechanism of RS (40). MEG (41,42) or electrocorticography approaches (43) are more appropriate to test those accounts, and may provide important insights into the dynamics of parietal-premotor-M1 interactions.
Nevertheless, with the RS accounts employed here, we demonstrated that RS can reflect very different representational changes from the first to the second execution depending on the regions. During the repetition of skilled motor sequences, associative cortical regions represent the sequence itself in a stable fashion, while the activation in M1 changes qualitatively, with a reduced activation of the beginning of the sequence. These results emphasize that employing RS only using the average regional activation sometimes provides incomplete, and possibly misleading, insights into regional representation. Instead, RS should be combined with pattern analyses to determine how the representations change with repetition, to ultimately provide a deeper understanding of brain circuits and their function.
Materials and Methods
Participants
Twenty-seven participants took part in the experiment. Data of one participant were excluded because their fieldmap was distorted in one of the four scans, resulting in 26 participants whose data was analysed (17 females, 9 males). Their mean age was 22.2 years (SD = 3.3 years). Criteria for study inclusion were right-handedness and no prior history of psychiatric or neurological disorders. They provided written informed consent to all procedures and data usage before the study started. The experimental procedures were approved by the Ethics Committee at Western University.
Apparatus
Finger sequences were performed using a right-hand MRI-compatible keyboard device (Fig. 1a). The keys of the device had a groove for each fingertip, with keys numbered 1-5 for thumb-little finger. The keys were not depressible, so participants performed isometric finger presses. The force of the presses was measured by the force transducers underneath each finger groove (FSG-15N1A, Sensing and Control, Honeywell; dynamic range 0-25 N; update rate 2 ms; sampling 200 Hz). For the key to be recognized as pressed, the applied force had to exceed 1 N.
Learning paradigm
Participants were trained over a five-week time period to perform six 9-digit finger sequences. They were split into two groups, with trained sequences of one group being the untrained sequences of the second group, and vice versa (see Fig. 4b for all of the chosen sequences). The chosen sequences for both groups were matched as closely as possible on several features: starting finger, number of repetitions per finger, and first-order finger transitions. The decision to split participants into two groups was made to ensure that none of the observed effects could be due to the specific set of sequences chosen.
On day 1 of the study, participants were acquainted with the apparatus and the task performed in the scanner. To ensure no sequence-specific learning would take place prior to scan 1, we used finger sequences different from the trained and untrained sets which participants did not encounter at any later stage of the experiment.
During the behavioral training sessions, participants were trained to perform the six sequences. Each training session was split into several blocks with 24 trials in each block (i.e. 4 repetitions of each of the 6 sequences). Participants received visual feedback on the correctness of their presses online with digits turning green for correct presses and red for incorrect presses (Fig. 1a). They were instructed to perform the sequences as fast as possible, while keeping the overall accuracy within each block <15% error rate. To encourage fast and accurate performance throughout the training, participants received 0, 1 or 3 points after each trial completion based on correctness and movement time (MT) – time from the first press until the last release in the sequence. Specifically, they received 1 point for correct presses performed at their median MT, 3 points for correct presses executed at least 20% faster than their median speed until that point. If they made a mistake on any of the presses or the MT in the trial was lower than their median MT, they received 0 points. The median MT threshold was dynamically adjusted across blocks every time a block was completed with an error rate <15% and the median MT faster than previous threshold. Overall, their MT decreased across the five weeks of training (Fig. 1b).
We included several other design features in the behavioural training, such as behavioural test sessions comparing participants’ performance of trained sequences to random sequences, and their performance using the left hand. Those sessions were not assessed for this paper, and have been described elsewhere (13).
Experimental design during scanning
Participants underwent a total of 4 MRI scanning sessions (Fig. 1c) while executing trained and untrained sequences. The first session served as a baseline prior to the start of the training protocol (in week 1), where the “trained” and “untrained” sequences were both untrained and seen for equivalent amount. The second session was conducted after a week (in week 2), and the last two after training protocol was completed – in week 5. In scanning sessions 1-3, participants’ performance inside the scanner was paced with a metronome, whereas in session 4, they performed as fast as possible. For the purpose of this paper, data of scanning session 1 (prior to training) and 4 (fully skilled performance) were analysed (Fig. 1c). Session 4 allows for the closest comparison to the previous RS study (15) which also employed a full-speed performance design. Pattern analyses of sessions 2 and 3 are reported in (13).
Each scanning session consisted of eight functional runs with event-related design randomly intermixing trials containing the 6 trained and the 6 untrained sequences (totalling 72 trials per functional run). Each sequence was executed for two trials in a row (Fig. 1d). The trial started with a 1 second preparation time with nine digits of the sequence presented on the screen. A ‘go’ signal was presented afterwards. In scans 1-3, a pink line appeared underneath the sequence and started expanding, indicating the pace at which participants were to press. In scan 4, participants executed the sequence as fast as possible after the go cue. After execution, they received feedback on their overall performance – 3 points for correct and 0 for incorrect performance. Each trial lasted for 5 s total (Fig. 1d), with a 0.5 s inter-trial interval. Five periods of 10 s rests were added throughout each functional run to provide a better estimate of baseline activation. These rests were added randomly, but never between the first and second execution of the same sequence. In total, each scanning session lasted for approximately 75 minutes.
Image acquisition
Data were acquired on a 7-Tesla Siemens Magnetom MRI scanner with a 32-receive channel head coil (8-channel parallel transmit). At the beginning of the first scan, we acquired anatomical T1-weighted scan for each participant. This was obtained using a magnetization-prepared rapid gradient echo sequence (MPRAGE) with voxel size of 0.75×0.75×0.75 mm isotropic (field of view = 208 × 157 × 110 mm [A-P; R-L; F-H], encoding direction coronal). Data during functional runs were acquired using the following sequence parameters: GRAPPA 3, multi-band acceleration factor 2, repetition time [TR] = 1.0 s, echo time [TE] = 20 ms, flip angle [FA] = 30 deg, slice number: 44, voxel size: 2×2×2 mm isotropic. To estimate magnetic field inhomogeneities, we acquired a gradient echo field map with the following parameters: transversal orientation, field of view: 210 × 210 × 160 mm, 64 slices, 2.5 mm thickness, TR = 475 ms, TE = 4.08 ms, FA = 35 deg.
Preprocessing and first level analysis
Data preprocessing was carried out using SPM12 and custom MATLAB code. Preprocessing of functional data included correcting for geometric distortions using the acquired fieldmap data (Hutton et al., 2002), and head motion correction (3 translations: x, y, z; 3 rotations: pitch, roll yaw). The data across sessions were all aligned to the first run of the first session, and then co-registered to the anatomical scan.
Preprocessed data were analysed using a general linear model (GLM; 44). We defined a regressor for each of the performed 12 sequences (6 trained, 6 untrained), separately for their first and second execution – resulting in a total of 24 regressors per run. The regressor was a boxcar function defined for each trial, and convolved with a two-gamma canonical hemodynamic response function (time to peak: 5.5 s, time to undershoot: 12.5 s). All instances of sequence execution were included into estimating regressors, regardless of whether the execution was correct or erroneous. This analysis choice was also taken by (15), thus allowing a more direct comparison of repetition suppression results. Even when the error trials were excluded (i.e. removing all error trials as well as second execution trials when the first execution was erroneous), our results remained unchanged. Ultimately, the first level analysis resulted in activation images (beta maps) for each of the 24 conditions per run, for each of the four scanning sessions.
Surface reconstruction and regions of interest
Individual subject’s cortical surfaces were reconstructed using FreeSurfer (45), and aligned to the FreeSurfer’s Left-Right symmetric template (Workbench’s 164 nodes template) via spherical registration. For our regions of interest (ROI), we defined areas covering the primary motor cortex and secondary associative regions. The primary motor cortex (M1) was defined using probabilistic cytoarchitectonic map (46) by including nodes with the highest probability of belonging to Brodmann area (BA) 4 which in addition corresponded to the hand knob area (47). The dorsal premotor cortex (PMd) was included as the lateral part of the middle frontal gyrus. The anterior part of the superior parietal lobule (SPLa) was defined to include anterior, medial and ventral intraparietal sulcus.
Evoked activation and repetition suppression
We calculated the percent signal change for execution of each sequence relative to the baseline activation for each voxel. The calculation was split between the first and second execution. To calculate repetition suppression, the activation during the first execution was subtracted from the elicited activation during the second execution. Thus, negative values of this difference contrast represented relative suppression of activation on the second execution, i.e. repetition suppression. For most subsequent analyses, the obtained values of activation and repetition suppression were averaged separately for trained and the untrained sequences. For ROI analysis, the volume maps were averaged across the predefined regions (M1, PMd, SPLa) in the native volume space of each subject. Additionally, for visualization the volume maps were projected to the surface for each subject, and averaged across the group in Workbench space.
Dissimilarities between activity patterns for different sequences
To evaluate which regions displayed sequence-specific representation, we calculated Crossnobis dissimilarities between the evoked beta patterns of individual sequences. To do so, we first multivariately prewhitened the beta values – i.e. we standardized them by voxels’ residuals and weighted by the voxel noise covariance matrix. Prewhitening has previously been found to increase the reliability of dissimilarity estimates (48). Next, we calculated the crossvalidated squared Mahalanobis dissimilarities (i.e. the Crossnobis dissimilarities) between evoked regional patterns of different pairs of sequences, resulting in a total of 66 dissimilarities. This was performed twice: once by combining the activation patterns across the two executions and second time by separately obtaining dissimilarities between evoked patterns split per execution. The obtained dissimilarities were then averaged overall, as well as separately within the pairs of trained sequences, and the untrained sequences.
The multivariate analysis was conducted separately for each ROI and then repeated using a surface searchlight approach (49). For each surface node, a circular region of 120 voxels was defined and Crossnobis dissimilarities were calculated amongst those voxels, with the resulting dissimilarities values assigned to the centre of the searchlight. The searchlight was then moved across the cortical sheet in a continuous manner.
Assessing accounts of repetition suppression
We examined several proposed accounts of RS – scaling, sharpening and fatigue (Fig 3c), by relating the observed changes in pattern dissimilarities with repetition to activation changes with repetition. Activation pattern for each sequence can be characterized as a point in a high-dimensional space, with each axis referring to the activation of a voxel. As a measure of the overall activation, we used the length of the activity vector from the origin (rest), and as dissimilarities the lengths of the vectors between different dots (Fig 3c). Unbiased estimates of the length of activity vectors relative to rest were derived from the crossvalidated second-moment matrix. The square root of each diagonal element (variance of evoked pattern) indicates the length of the activity vector, relative to rest. The square root of Crossnobis dissimilarity (variance – covariance between patterns) is the length of the vector between the two patterns (50). These measures were averaged across the 6 trained, and 6 untrained conditions, separately for executions 1 and 2.
For each subject and region, we then computed the decrease in activation as activity length for 2nd execution divided by activity length for the 1st execution. If dissimilarities decreased proportional to changes in activation, we would expect the ratio of dissimilarities between the two executions to equal the ratio obtained from activity vector lengths. Likewise, the dissimilarities expected under the scaling account can be computed as:  . This expected dissimilarity value was compared to the observed dissimilarities on the second execution. Higher value of the observed relative to expected dissimilarity would be in line with the ‘sharpening’ account, lower value would be in support of the ‘fatigue’ account, while a value that wouldn’t differ from the expected dissimilarities would support the ‘scaling’ account of RS for that region.
Pattern component analyses: modelling representational components
The analysis on dissimilarities between sequence-specific activity patterns is sensitive to any possible difference between patterns of different sequences. To decompose what specific features of stimuli might be driving these differences, we used pattern component modelling (PCM; 26,51). PCM models the covariance structure (second moment matrix) of regional activity patterns according to different representational hypotheses. In our experiment based on presented sequences, we defined five representational components.
First finger
Both trained and untrained sequences started with 3 possible fingers: thumb, middle finger and pinky finger. The first finger feature characterizes activity pattern as different for sequences starting with different first finger, and indistinguishable for sequences starting with the same first finger. The model component was weighted by the natural statistics of hand movement (52).
All fingers
The chosen sequences had slight differences in terms of how many times different fingers were executed in the sequence. Thus, the ‘all fingers’ feature characterized number of repetitions across fingers and how correspondent different sequences were in finger repetitions. Also this model component was weighted by the natural statistics of hand movement (52).
Sequence type
This component split the performed sequences based on whether they were trained or not, predicting different regional representations between trained and untrained sequences, but indistinguishable patterns within each of the two groups.
Trained sequence identity
This component assumes that each of the trained sequences is associated with unique activity patterns.
Untrained sequence identity
Similar as the trained sequence identity component, this component assumes unique activity patterns for different untrained sequences.
The overall predicted second moment matrix (G) was then a convex combination of the component matrices (Gc):

The construction of the models was split between the two groups of participants, as different sequences constituted ‘trained’ or ‘untrained’ sequences for the two groups. The subsequent steps of model fitting and evaluation were carried together for all subjects.
We formulated a family of models containing all possible combinations of the five chosen components. This resulted in 32 combinations (Fig. S3a), also containing the ‘null’ model without any component, which predicted no differences amongst any of the sequence patterns. We then evaluated all of the 32 models using a crossvalidated leave-one-subject-out scheme, estimating the likelihood of the observed regional second moment data under each model. The resultant cross-validated likelihoods were used as evidence of the model. The difference between the log-likelihood of each model and the null model results in a log-Bayes factor representing the relative model evidence over a null model.
In addition to the model family of the chosen components, we also fit a ‘noise-ceiling’ model to assess the maximal explainable information present in each region’s representation across participants (26,53). For each of the two groups, we predicted the second moment matrix of a left-out subject based on n-1 subjects in the same group. This metric of inter-subject consistency was then combined across the subjects of the two groups.
To integrate the results across models, we used model averaging to determine the amount of pattern variance accounted for by each component in the context of all the other components. Prior to fitting, we normalized the trace of each model component to be 12 (number of conditions). Thus, the fitted component weight exp (Θi) can be taken as the amount of variance accounted for by the component in the context of that model. Assuming a uniform prior probability across models, we compute a posterior probability of each model i (from 1 to 32) directly from their Bayes factors:

The model-averaged amount of variance accounted for by each component c is then given by:

Important to note is that this variance calculation always results in positive estimates.
Data availability
The dataset used for these analyses is publicly available on OpenNeuro (doi: 10.18112/openneuro.ds002776.v1.0.2).
Acknowledgments
The work was supported by an Ontario Trillium Scholarship to EB, an NSERC Discovery Grant (RGPIN-2016-04890) to JD, and the Canada First Research Excellence Fund (BrainsCAN). We thank Giacomo Ariani for helpful comments on an earlier version of the manuscript.
References


