

Abstract
Vagus nerve stimulation (VNS) is widely used to treat drug-resistant epilepsy and depression. While the precise mechanisms mediating its long-term therapeutic effects are not fully resolved, they likely involve Locus Coeruleus (LC) stimulation via the nucleus of the solitary tract (NTS) that receives afferent vagal inputs. In rats, VNS elevates LC firing and forebrain noradrenaline (NE) levels, whereas LC lesions suppress VNS therapeutic efficacy. Non-invasive transcutaneous VNS (tVNS) employs electrical stimulation targeting the auricular branch of the vagus nerve at the Cymba Conchae of the ear, but it remains unclear to what extent tVNS mimics VNS. Here, we investigated the short-term effects of tVNS in healthy human male volunteers (n=24) using high-density EEG and pupillometry during visual fixation at rest, comparing short (3.4s) trials of tVNS to sham electrical stimulation at the earlobe (far from the vagus nerve branch) to control for somatosensory stimulation. Although tVNS and sham stimulation did not differ in subjective intensity ratings, tVNS led to robust pupil dilation (peaking 4-5s after trial onset) that was significantly higher than following sham stimulation. We further quantified how tVNS modulates idle occipital alpha (8-13Hz) activity, identified in each participant using parallel factor analysis. We found that tVNS attenuates alpha oscillations to a greater extent than does sham stimulation. Thus, tVNS reliably induces pupillary and EEG markers of arousal beyond the effects of somatosensory stimulation, supporting the hypothesis that it elevates noradrenaline and acetylcholine signaling and mimics invasive VNS.
Significance statement Current non-invasive brain stimulation techniques are mostly confined to modulating cortical activity, as is typically the case with transcranial magnetic or transcranial direct/alternating-current electrical stimulation. tVNS has been proposed to stimulate brainstem arousal nuclei, but previous studies yielded inconsistent results. Here we show that short (3.4s) tVNS pulses in naïve healthy participants induce transient pupil dilation and attenuation of occipital alpha oscillations. These markers of brain arousal are in line with the established effects of invasive VNS on LC-NE signaling, and support the notion that tVNS mimics VNS. Therefore, tVNS can be used as a tool for studying how endogenous neuromodulation (NE/ACh) signaling affects human cognition including perception, attention, memory, and decision-making, as well as for developing novel clinical applications.
Introduction
Vagus nerve stimulation (VNS) has been successfully used to reduce epileptic seizures in patients with drug-resistant epilepsy since 1988 (Krahl and Clark, 2012) and is clinically effective for many patients treated with invasive VNS (Boon et al., 2018; Kwon et al., 2018). In addition, it is applied as a treatment for drug resistant major depression (e.g Nemeroff et al., 2006).
VNS modulates vagal afferent inputs to the brainstem Nucleus Tractus Solitaris that then activates the LC-NE system. Indeed, in rats VNS increases LC neuronal discharges (Takigawa and Mogenson, 1977; Groves et al., 2005; Hulsey et al., 2017) and elevates NE levels in hippocampus and cortex (Dorr and Debonnel, 2006; Roosevelt et al., 2006). The effects of VNS on LC-NE are considered key to reducing seizures, since a strong positive correlation is found between the noradrenergic and anticonvulsive effects of VNS (Raedt et al., 2011), and chemical lesions of the LC eliminate these anticonvulsive effects (Krahl et al., 1998). VNS also modulates activity in other subcortical neuromodulatory systems such as the serotonergic dorsal raphe and cholinergic basal forebrain, serotonergic modulations are mostly secondary, i.e. occur later and mediated through the LC-NE system (Dorr and Debonnel, 2006; Manta et al., 2009). Recent evidence (Mridha et al., 2019) show that VNS induce substatial chonerigic modulations in the basal forebrain, however it is still to be discovered whether these are mediated by the LC.
In human patients, invasive VNS induces markers of brain arousal that are consistent with LC-NE activity such as pupil dilation (Desbeaumes Jodoin et al., 2015) that is tightly linked with LC-NE activity (Joshi et al., 2016; Reimer et al., 2016; Gelbard-Sagiv et al., 2018; Hayat et al., 2020). VNS may also lead to EEG desynchronization, but effects are subtler than pupil dilation, at least with the clinical parameters that typically employ long (30-60s) stimulation epochs. Accordingly, early studies with <10 patients each, did not find VNS effects on spontaneous intracranial EEG (Hammond et al., 1992) or scalp EEG (Salinsky and Burchiel, 1993), whereas a recent study with 19 participants that separated VNS ‘responders’ from ‘non-responders’ observed EEG desynchronization in the alpha and delta bands (Bodin et al., 2015).
Non-invasive transcutaneous vagal nerve stimulation (tVNS) applies electrical current at a high frequency (typically 25Hz) through the left ear, targeting the auricular branch of the vagus nerve at the Cymba Conchae (Figure1) (for anatomic evidence see Van Bockstaele et al., 1999; Bermejo et al., 2017). tVNS has been shown to mimic the anticonvulsive and antidepressant effects of invasive VNS (Stefan et al., 2012; He et al., 2013; Hein et al., 2013; Bauer et al., 2016; Rong et al., 2016; Trevizol et al., 2016) and proved to be safe and tolerable (Redgrave et al., 2018). Beyond its clinical efficacy, there is growing interest in using tVNS in healthy individuals for basic neuroscience research (Van Leusden et al., 2015), but previous studies are inconsistent in determining to what extent tVNS mimics invasive VNS with respect to the effects on EEG or pupil dilation that could suggest LC-NE involvement (Ventura-Bort et al., 2018; Warren et al., 2018; Keute et al., 2019). We suspected that such inconsistencies stem from employing long (e.g. 30sec) stimulation epochs as used clinically, and due to the indirect focus on the P300 component where LC-NE activity is assumed to play a key role.

Legend: (A) Schematic illustration of the rationale of tVNS (B) Stimulation electrode placement – (1) location of tVNS effective location on the Cymba conchae of the left ear (2) location of the sham ineffective location (3) Photo of the commercial stimulation electrode. (C) Experimental design, each experiment started with a ‘method of limits’ procedure in order to adjust stimulation current according to individual subjective pain report (Rating) and increase in 0,2 mA every step until a current matched to a rating of 8 was selected. Then there 8 blocks each of 5min including 11 stimulation trials of 3.4s and stimulation interval of d of 25-27s.
Here, we set out to test if short-term tVNS induces EEG and pupillary markers of arousal, as is the case for VNS-induced activation. We used short (3.4s) stimulation pulses during task-free rest conditions in healthy naïve volunteers (to avoid long-term changes associated with therapeutic effects (Follesa et al., 2007; Manta et al., 2013)). We hypothesized that if indeed tVNS increases LC activity, it should lead to pupil dilation as observed across multiple species (Joshi et al., 2016; Reimer et al., 2016; Hayat et al., 2020). In addition, we hypothesized that tVNS will attenuate alpha oscillations that are anti-correlated with arousal during rest (Torsvall and Akerstedt, 1987a; Drapeau and Carrier, 2004a; Amzica and Lopes da Silva, 2017), and are attenuated by invasive VNS (Bodin et al., 2015). In line with these predictions, we found that tVNS induces pupil dilation and alpha desynchronization above and beyond the effects of sham (somatosensory) stimulation.
Materials and methods
Participants
High-density (256-channel) EEG and pupillometry recording were performed in 25 healthy young male adults (mean age: 28.08 ±5.84 years, 2 left-handed). Written informed consent was obtained from each participant. The study was approved by the Medical Institutional Review Board (IRB) at the Tel Aviv Sourasky Medical Center. Female subjects of child bearing age were not included per guidelines of the approved IRB. Participants reported to be healthy, without history of neuropsychiatric disorders, and indicated their dominant eye for pupillometry. One participant was excluded due to excessive blinking, after which 24 participants remained (mean age: 28.3 ± 1.2). Data from additional three subjects were excluded from EEG analysis due to lack of alpha activity, after which 21 subjects remained for EEG analysis (mean age 28.01±1.3).
Experimental design
Main experiment
After EEG setup (see below), participants performed a short ‘method of limits’ procedure to select tVNS/sham stimulation intensities while sitting. This procedure systematically finds the maximal comfortable stimulation levels for each individual, as in (Kraus et al., 2013; Yakunina et al., 2017; Ventura-Bort et al., 2018). We applied 5s-long stimulation trials, starting at 0.1mA, and increasing in each trial by 0.2mA. After each trial, participants rated the subjective intensity on a scale of 0-9 ([0] = no sensation; [3] = light tingling; [6] = strong tingling; [9] = painful) and we kept increasing the current until reaching a level rated as [9] or a maximal level of 5mA. This procedure was carried out twice for each stimulation location (real tVNS at cymba cochnea vs. sham stimulation at ear lobe), and the selected currents were the average currents corresponding to a subjective rating of [8] (just below painful), for each stimulation location separately. Thus, tVNS intensity was adjusted for each subject and location separately to be above the detection threshold and below the pain threshold, as in clinical settings (Ellrich, 2011). Participants were then instructed to position their heads in a chin-rest apparatus for adjusting and calibrating the eye-tracker (see below). Then, participants were instructed to fixate on a white cross on a background of a gray computer screen (HP model 2311x, positioned 80cm from participants’ eyes) throughout experimental “blocks” lasting 5 minutes, each including 11 trials of 3.4s stimulation epochs (in each trial, tVNS intensity ramped up gradually up to the level defined above), separated by inter-stimulus-intervals of 26s (±1s jitter). We performed two blocks of either tVNS or sham, and then switched to position the stimulating electrode in the alternate location (order counterbalanced), reaching a total of eight blocks altogether per session (Figure 1C). Before changing the electrode location, participants answered questions regarding their subjective experience of stimulation (Table 1). Participants were free to rest between the blocks ad lib. We refer to these rest periods as “breaks”, and data acquired during these times were used to characterize alpha activity in each individual in a manner unbiased with respect to experimental conditions (see below).
Pilot experiment
A similar experiment using the same device with a separate group of 29 male participants (mean age: 26.82 ±1.1 years, 4 left-handed) used the default clinical stimulation mode (30s on, 30s off) during fixation at rest while recording high-density EEG (n=15) and pupillometry (n=29).
Transcutaneous Vagus Nerve Stimulation (tVNS)
tVNS was delivered using NEMOS®, (Cerbomed, Germany, now tVNS technologies; Figure 1B). In the tVNS condition, the electrodes were placed at the left Cymba Conchae, which is heavily innervated by the auricular branch of the vagus nerve (Peuker and Filler, 2002; Safi et al., 2016; Badran et al., 2018) (Figure 1A). In the sham condition, the electrodes were placed at the left earlobe (Figure 1A), which is not expected to induce brainstem or cortical activation (Kraus et al., 2007; Sellaro et al., 2015; Steenbergen et al., 2015). Pulses (200-300μs width) were delivered at a rate of 25Hz (duty cycle of ~7% ON time, see Figure 1) for 3.4s that included a ramping up of intensity (as set by the device) to a level experienced as just-below painful, adjusted for each participant and condition separately (‘method of limits’ procedure above), as often set clinically in patients (Vonck et al., 2014). To achieve 3.4s stimulation trials, we controlled the NEMOS stimulation device using linear actuators (Actounix, Canada) that pressed the ON/OFF button automatically according to programmable times. These actuators were controlled by Arduino mega (Arduino, Italy) directed by Psychopy python package (Peirce, 2007). Two additional measures verified good electrode contact throughout, and consistent effectiveness of stimulation: (i) the NEMOS device stops stimulation automatically whenever good physical contact with the participant’s skin is disrupted, and (ii) the experimenter verified in each participant the presence of a visually-evident 25Hz stimulation artifact in EEG electrodes close to the left ear.
Pupillometry
Data acquisition
Eye movements/gaze and pupil size were recorded monocularly from the dominant eye using infrared video-oculographic system with a chin-rest (Eyelink 1000 Plus, SR Research). Gaze and pupil data were sampled at 500Hz, positions were converted into degrees of visual angle based on a 9-point calibration performed at the beginning of the experiment (on mid-gray background). The experiment was carried out in a room with constant ambient light.
Data analysis
Pupil data were low-passed using a 10Hz 4th order Butterworth filter with zero phase shift and periods of blinks were detected using the manufacturer’s standard algorithms with default settings. The remaining data analyses were performed using custom-made Matlab scripts (The MathWorks). Blinks were removed by linear interpolation of values measured 100ms before and after each identified blink (de Gee et al., 2014). Segmentation of peri-trial data was performed by extracting pupil data [−10s +13.4s] around each stimulation trial. Trials with less than 50% of interpolated data points were excluded (van Steenbergen and Band, 2013). After excluding one participant that had no trials remaining, the process yielded an average of 42.12±1.79 trials (out of 45, range 42-45) in the tVNS condition and 42.16±1.79 fin the sham condition. We used these to calculate percent change values relative to baseline (x-baseline/baseline*100) value in the 10s prior to stimulation: to receive a percent change time-course that allow averaging across subjects with different pupil size and avoiding arbitrary units (For example see Reimer et al., 2016; Liu et al., 2017). There was no significant difference in baseline values between conditions in arbitrary units, though in both conditions, the smaller the pupil is in a specific trial there is more chances to see pupil dilation (more trials show it, R=− 0.27, p<10−20, see discussion).
The resulting pupil time-courses were the mean value across trials for each participant and condition separately, as depicted in Figure 2A (single subject traces were band-pass filtered again between 0.01-10Hz for presentation in Figure 2C). In order to present the individual subject data, we reduced the pupil data for each participant and condition to a scalar value (Figure 2B) by averaging the time-course across trials in the interval between the two points of half maximum (FDHM, 3.2-10.4s) following stimulation onset (see dashed bar in Figure 2A).

Legend: (A) grand average pupil dilation in response to tVNS (red trace) and sham stimulation (black trace), shaded areas around the trace indicate SEM, grey transparent rectangle indicate active current is on, upper red line indicate FDR corrected significance using Wilcoxon rank sum test, dashed black bar indicate time points to compute B. (B) single subject values in both tVNS and Sham condition between the 2 points of half maximum (FDHM, 3.2-10.4s dashed black bar in A). solid black lines indicate tVNS>Sham while dashed grey lines indicate the opposite – I,II refer to the single subject traces in C. (C) Single subjects examples as indicated in B, following the same presentation as in A.
Gaze data and blink rate were also inspected and compared between conditions. Gaze was extracted, interpolated and averaged using the same procedure described above and data points marked as blinks were summed across participants to produce a blink rate time-locked to stimulation onset.
EEG
Data acquisition
High-density EEG was recorded continuously using a 256-channel hydrocel geodesic sensor net (Electrical Geodesics, Inc. [EGI], Eugene OR, USA). Each carbon-fiber electrode consists of a silver chloride carbon fiber pellet, a lead wire, a gold-plated pin, and was injected with conductive gel (Electro-Cap International). Signals were referenced to Cz, amplified via an AC-coupled high-input impedance amplifier with antialiasing analog filter (NetAmps 300, EGI) and digitized at 1000 Hz. Electrode impedance in all sensors was verified to be <50 kΩ before starting the recording.
EEG data analysis
EEG preprocessing was performed in MATLAB (The MathWorks) using custom-written code as well as the FieldTrip toolbox (Oostenveld et al., 2011). First, we used a subsample of 192 electrodes placed directly on the skull (avoiding cheek electrodes with higher muscle artifacts). Continuous data from these electrodes were segmented to 33s epochs, [−15s +18s] around each stimulation onset. First, in order to allow effective visual inspection, data epochs were linearly de-trended, notch-filtered (at 50Hz), and high-pass (>0.1Hz) filtered using a 2nd order Butterworth filter to remove DC shifts. We then visually confirmed that all sham and tVNS trials show 25Hz stimulation artifact around the left ear. Trials without the artifact were excluded. (on average, 14.75%±3.08 of trials were excluded) To focus on alpha oscillations, data were further band-passed filtered between 5-15Hz using a 3rd-order two-pass Butterworth filter as in previous studies applying parallel factor analysis (Barzegaran et al., 2017) as well as an additional notch filter in 25Hz (stimulation frequency) and its harmonics up until 475Hz to remove any residual artifact stemming from stimulation that were not removed by previous filters. Then, we removed the minimal number of channels or trials whose data crossed an absolute amplitude threshold of 100μV in an automatic iterative process – that is, each 3s epoch in each channel had a boolean value [max(abs(x))>100?] – and then in each iteration a channel or a trial was excluded such that a minimal number or channel×trial 3s data epochs are discarded (code is available at: https://github.com/sharomer/eeg_2d_minimal_rejection). This process removed large movement artifacts, but not all blink artifacts, which were separated later using the parallel factor analysis.
This resulted in identifying an average of 18.76±2.86% of bad channels per participant (out of 192, data were interpolated using a linear distance weighted interpolation), and 22±3.42% bad trials per participant (discarded from subsequent analysis). Only then, trials were divided to tVNS or sham trials to avoid any bias in preprocessing. The average number of valid trials in the tVNS condition was 35.61±1.09 and in the Sham condition 35.61±1.09 (out of 44, not significantly different). Next, data of each trial were transformed to the time-frequency domain using the Fast Fourier Transform (FFT) after multiplying by a moving hamming window of 3s, yielding a frequency resolution of 0.33 Hz and temporal resolution of 0.33s.
Parallel factor (PARAFAC) decomposition
We first extracted data from “break” periods (in between stimulation blocks) to identify each participant’s alpha topography and frequency in an unbiased manner with respect to study objectives. These data were segmented to 5s epochs with 1s overlap with its preceding epoch and 1s with the following epoch, band-passed filtered (as for stimulation data, above) and reduced into 3s trials (discarding the overlap) to avoid filtering artifacts at edges. Then, data epochs were cleaned as described for stimulation data, using the same procedure described above (resulting in 117.84±7.15 trials on average per subject, with 175.28±2.71 clean channels on average). These 3s time-frequency epochs were used to identify each participant’s alpha topography and precise frequency range using the parallel factor analysis as implemented in the N-way toolbox (Andersson and Bro, 2000), as presented in Figure 3. The type of constraint for each dimension was set to non-negativity. The proper number of components was determined by using the Core Consistency Diagnostic (CCD) in which number of components is highest when the minimal value of CCD was 55% and 90.60±3.18% on average (Bro and Kiers, 2003).

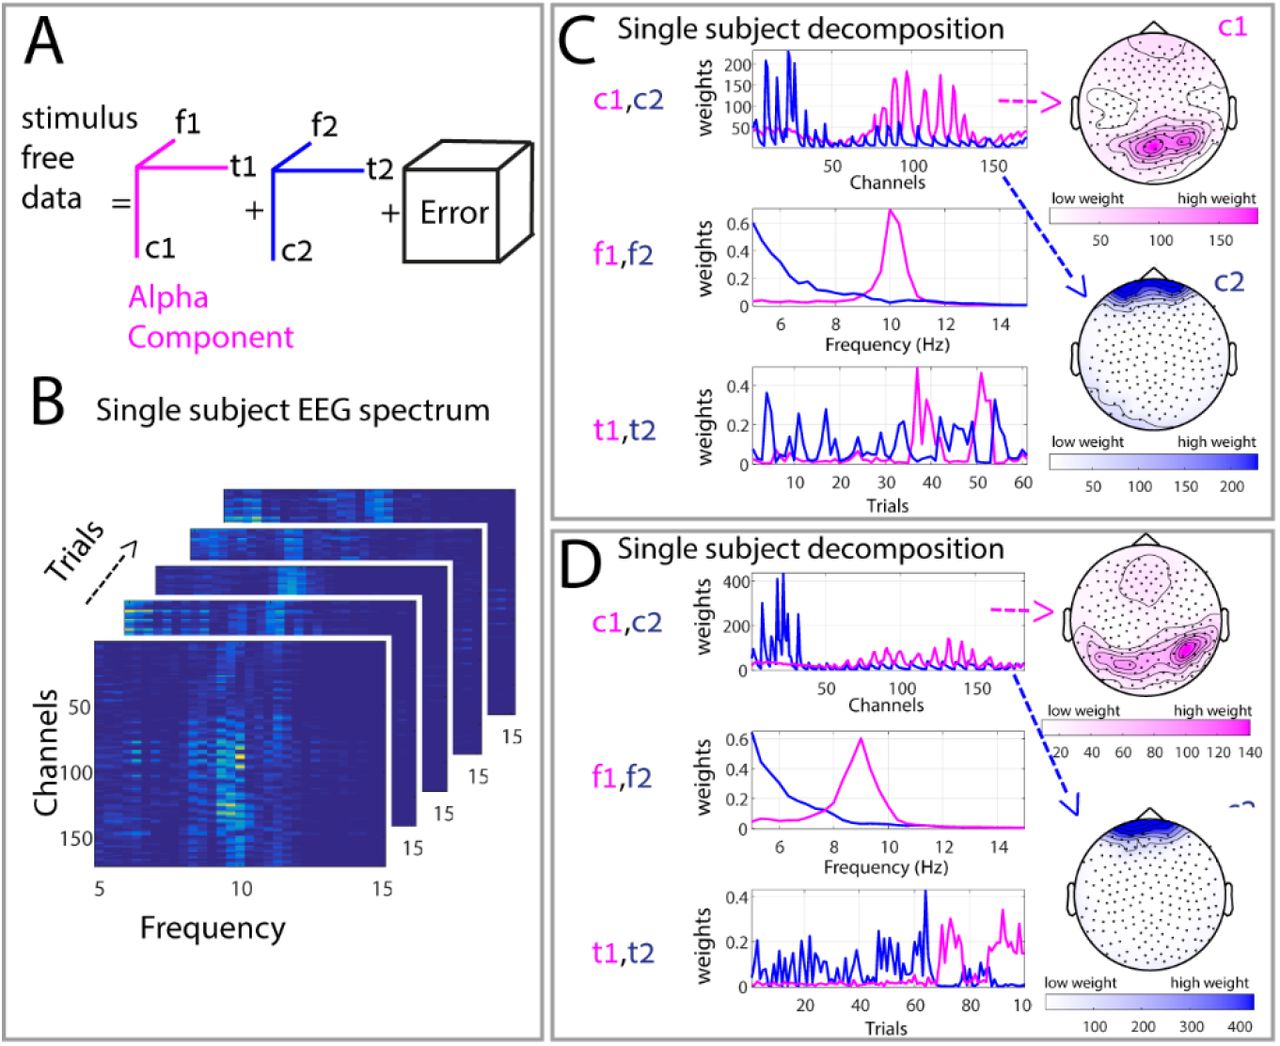
Legend: Graphic illustration of the parallel factor analysis method we used to decompose the stimulus free data (break) and create subject specific topographical and frequency bands of interest. (A) Illustration of the PARAFAC model with two components, where f1 and f2 refer to the frequency features, t1 and t2 indicate temporal features and c1 and c2 represent the spatial features of the components in the channel space. (B) Spectrogram of 5 single 3s “trials” derived from the break, same subject as top left in C (C) Examples of the decomposition result for 2 different subjects. Each panel include both components 1 (red), 2 (blue)) if present in the 3 dimension (c) channel, (f) frequency and (t) trials. The spatial-channel dimension is also presented on the topographies on the right side.
Next, in order to assess the changes in alpha oscillations during stimulation, the individual weights for alpha component topography and frequency (Figure 4A) were derived from the break data, and multiplied by the spectrum of all channels such that a single channel representing the weighted activity was achieved. We then subtracted the mean baseline activity in [−1:0]s relative to stimulation onset for each subject, for each trial, and calculated the mean activity across subjects (N=21) to receive the results depicted in Figure 4C.
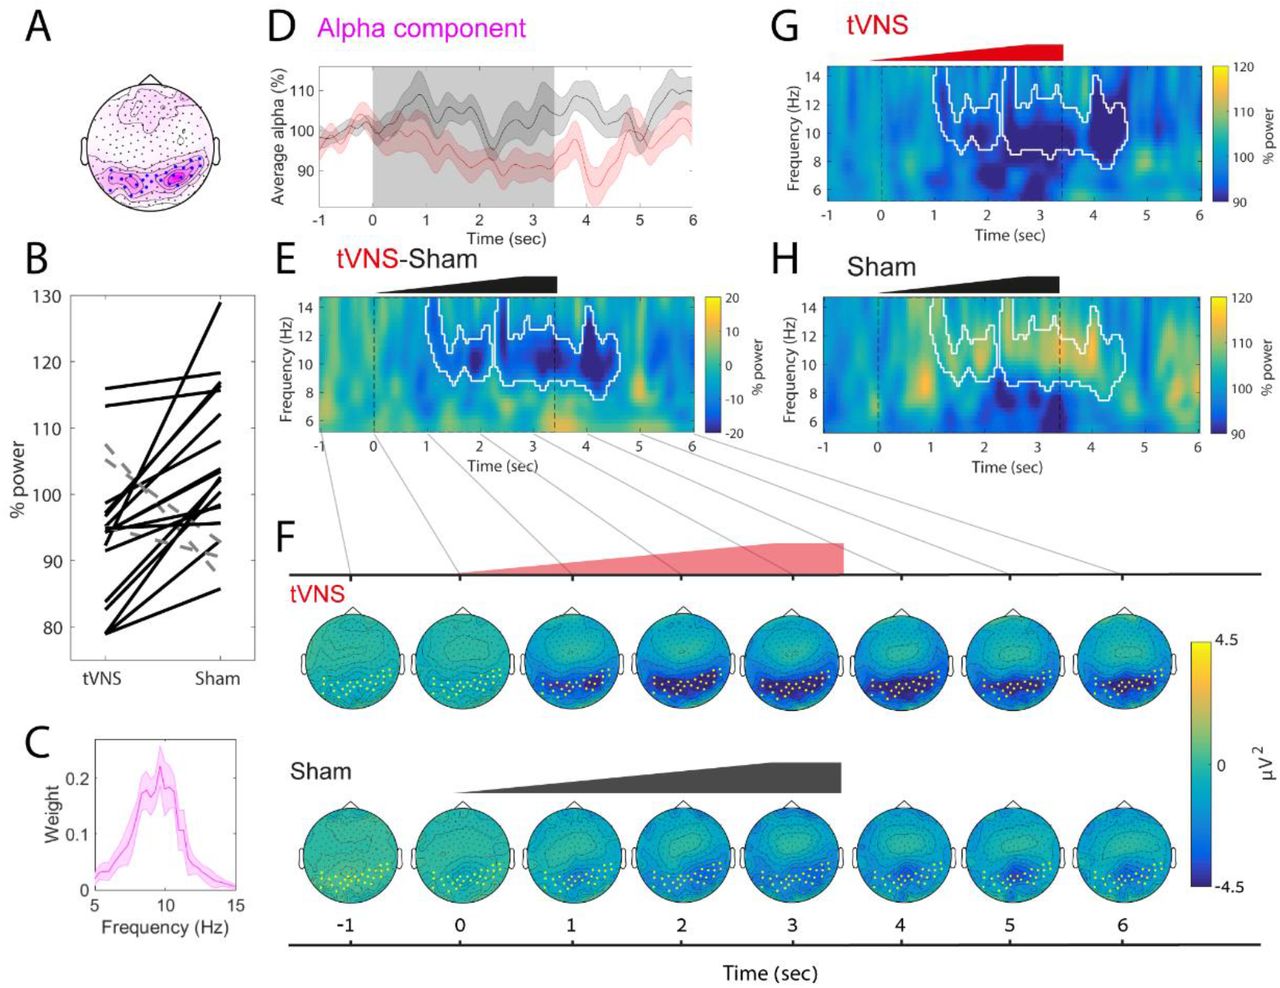
Legend: A) median alpha component topography. Blue points (selected using a threshold on the pink median weights) mark electrodes with strong alpha activity, in order to facilitate visualization in subsequent panel E but they are not used in statistical analyses. B) Alpha attenuation relative to baseline in single subjects data, using the weighted topography in A and spectral profile in C between 0:4sec. Black solid lines mark subjects showing alpha decrease whereas dashed gray lines mark subjects that do not show alpha decrease. (C) The median alpha component spectra profile (D) Average alpha component using both spectral profile depicted in C and topographical profile depicted in (E) Induced difference spectrogram between the conditions tVNS-sham (G-H), white contours marks statistical significance of the cluster comparing the conditions using cluster correction for multiple comparisons. Note that tVNS causes attenuation of alpha oscillation for several seconds (F) Topographical dynamics following stimulation in the tVNS condition in 1s resolution reveals occipital alpha attenuation (upper panel while or sham stimulation does not reveal robust occipital alpha attenuation (lower panel) (G) Average induced spectrogram around tVNS, same white contour from E (H) Same figure for sham.
To assess more carefully the brain activity following stimulation beyond the a-priori electrode- and frequency-band of interest, we (i) rigidly set the alpha topography (to investigate time frequency changes in the entire spectrogram). To this end, we used the topography of interest derived from the PARAFAC decomposition of the break data (Figure 4A, lower panel), ignored the frequency of interest, plotted the entire spectrogram in 5-15Hz in %change relative to the same baseline ([−1:0]s relative to stimulation onset, Figure 4B), and used cluster permutation test (see below). We also confirmed the difference using post-hoc direct comparison using Wilcoxon sign rank tests (Results). Alternatively, we (ii) rigidly set the frequency-band of interest (to investigate changes in all electrodes). To this end, we used the frequency of interest derived from the PARAFAC decomposition of the break data (Figure 4A upper panel) and ignored the topography of interest, and plotted the entire topographical changes in voltage around times of stimulation, while subtracting the activity [−1:0s] prior to stimulation (Figure 4D).
Statistical Analyses
Unless stated otherwise all statistical test were carried using a Wilcoxon sign rank test (Wilcoxon, 1945), including the significance of the pupil time-course that was corrected to multiple comparison using FDR correction (Benjamini and Yekutieli, 2011). The significance for alpha attenuation in the EEG spectrogram was assessed using a cluster permutation test with the Monte Carlo method and a dependent samples T-statistic with 10,000 permutations as implemented in the fieldtrip toolbox (Oostenveld et al., 2011). An alpha of 0.05 was considered significant after FDR correction for clusters (Benjamini and Yekutieli, 2011). In Figure 4, we plotted alpha attenuation at the individual subject level, so the reader could assess effect size across subjects; these per-subject values were tested also using Wilcoxon sign rank test (Figure 4C). Data are expressed as mean ± standard error of the mean throughout, or as median +/− bootstrapped confidence intervals (not necessarily symmetrical, explicitly indicated where relevant)
Results
To investigate the short-term effects of tVNS in naïve humans, we compared pupil dynamics and EEG alpha oscillations in healthy young male volunteers (n=24) induced by multiple trials of short (3.4s) electrical stimulation at the Cymba Conche (tVNS) or at the earlobe (sham) (Figure 1). Stimulation was applied at a frequency of 25Hz with intensity ramping up during the trial up to a maximal value selected per participant and location separately (Methods).
First, we verified that sham and tVNS did not differ subjective averseness. The average currents applied were 2.20±0.24mA in tVNS condition and a stronger 2.79±0.27mA current in the sham condition (p=0.0125,). Importantly, there was no significant difference between tVNS and sham in any subjective reports such as pain or irritation (Table 1, P>0.05 for all comparisons after FDR correction). Therefore, earlobe stimulation provides a good somatosensory control to distill the changes related specifically to tVNS.
Transcutaneous vagus nerve stimulation induces pupil dilation
tVNS led to robust pupil dilation that increased gradually (in line with the ramping up of the stimulation intensity), reaching half maximum at 2.53s after stimulation onset, peaking at 4.25s after stimulation onset, decreasing back to half maximum at 8.17s and returning to baseline levels 9s after stimulation. During peak pupil dilation, pupil area (in pixels) was 4.05±0.92% above baseline (Figure 2A).
By contrast, sham stimulation only led to modest 1.67%+0.63% pupil dilation, peaking around the same time, and this dilation level was significantly weaker than following tVNS (p<0.05 between 2.88-5.96s via repeated Wilcoxon sign rank test sum across all time points, and FDR correction for multiple comparisons). These results were largely consistent across individual subjects (Figure 3B) and evident in most (21 out of 24) participants (Figure 2C).
We found no significant difference between conditions when comparing blink rate or gaze position (p>0.6 for all comparison, using the same statistical procedure). In addition, these results remain significant and robust across single subjects when avoiding blink interpolation and discarding blink data. In order to make sure this effect were not mediated by the objective current difference we calculated correlation between differences in pupil dilation between tVNS and Sham and the difference in current and found no correlation (R=−0.12, p=0.56, Spearman correlation).
In a pilot experiment employing 30s ON / 30s OFF ‘clinical-like’ stimulation we only observed a modest trend for greater pupil dilation for tVNS than sham stimulation (p = 0.053, n=23), and there was no significant difference in pupil size between ON and OFF periods. Thus, short tVNS pulses lead to robust pupil dilation that is significantly greater than following sham stimulation, indicating that it promotes arousal above and beyond somatosensory stimulation at the ear.
Transcutaneous vagus nerve stimulation attenuates alpha oscillations
Alpha oscillations exhibit considerable inter-individual variability in frequency and scalp topography (Haegens et al., 2014). To facilitate a sensitive examination of how tVNS or sham stimulation affect alpha activity, we first identified the frequency and topography of alpha oscillations in each participant separately using parallel factor analysis (PARAFAC; Harshman, 1970). PARAFAC provides a unique solution to decompose the EEG signal to three factors (time, frequency, channel; Figure 3) and may enhance sensitivity. It was previously applied to electrophysiological recordings (Miwakeichi et al., 2004; Yanagawa et al., 2013; Meij et al., 2016), and specifically for assessing individual alpha oscillations (Barzegaran et al., 2017; Knyazeva et al., 2018); for a detailed review of its EEG applications, see Cong et al (2015). We identified the regions and frequencies of interest for alpha oscillations in each participant separately using unbiased “break” data between stimulation blocks. Figure 3C presents the result of this process in representative subjects, and Figure 4A shows the median region and frequency profile of alpha oscillations across all participants. PARAFAC successfully identified alpha activity (see examples in Figure 3C) capturing the subject’s specific alpha frequency around 7-13Hz with the typical occipital topography.
After having identified alpha activity in each individual, we quantified the extent to which alpha activity may be decreased by tVNS or sham stimulation in each subject separately. We found that tVNS attenuated alpha activity (mean: 94.35±2.2% of baseline) to a greater extent than sham stimulation that was not associated with significant alpha attenuation (103.55 ±2.4%of baseline; p=0.0027, Wilcoxon signed rank test) relative to baseline (−1:0, n.s difference between conditions). Greater alpha attenuation following tVNS was evident in most (19/21) single subjects (Figure 4C). We correlated differences in alpha attenuation between the conditions in the single subject level and the differences in applied current, we found negative correlation (R=−0.49. p=0.02), that is subjects with much stronger sham showed less difference in alpha attenuation, but overall the current was actually stronger in sham (p=0.01) in most individual subjects (18/21). Meaning that the alpha attenuation we observed constitute a lower bound while comparing the subjective report and allowing Sham current exceed tVNS current.
tVNS-induced alpha attenuation was not observed in our pilot experiment employing 30s ON / 30s OFF ‘clinical-like’ stimulation (p > 0.05, n=15). In both experiments, we did not find significant correlation between alpha attenuation and subjective (or objective) individual scores of stimulation intensities, or significant correlation between alpha attenuation and pupil dilation at the single subject level (all p≥0.1).
To complement the PARAFAC-based analysis and better understand the precise time-frequency dynamics and topographical changes of alpha attenuation, we used the weighted alpha topography from the break data as a ‘weighted region of interest’ to reduce the data to two dimensions (time and frequency). This approach ignored the frequency-of-interest and inspected the induced power changes in the 5-15Hz frequency range for the (weighted) occipital region derived from the PARAFAC decomposition (Figure 4A, lower panel). In line with the previous results, we found that tVNS significantly attenuated activity in the alpha band (8-12Hz, Figure 4B). Along this line, examining the effects of stimulation on EEG dynamics using cluster based permutation (Maris and Oostenveld, 2007) revealed a significant (p=0.0063, white contour in Figure 4B) cluster around 8-12Hz in the seconds following stimulation onset where mean alpha power was 90.84±2.77% in the tVNS condition, significantly lower than the 106.66%±2.70% observed following sham condition (p<0.0001 in a direct comparison). We also compared the two conditions using the classical alpha frequency range (8-12Hz), during stimulation (0-4s) (Means: 94.41±2.15% in tVNS condition and 105.25±2.41% in the sham condition, p=0.0012 (both in signed rank test).
Finally, we tested to what extent the observed alpha attenuation was specific for occipital electrodes. We inspected the topographical changes in voltage around stimulation relative to baseline (Figure 4D). This analysis was carried out by focusing on the a-priori frequency-band of interest derived from the PARAFAC decomposition (Figure 4A, upper panel) while ignoring the topography-of-interest derived from the break. This analysis revealed that alpha attenuation is specific to occipital areas. Importantly, the regions showing tVNS-induced alpha attenuation overlapped with electrodes showing alpha activity in the independent “break” intervals between stimulation blocks (compare blue dots in Figure 4A lower panel with yellow dots in Figure 4D).
Altogether, the EEG data establish that short tVNS pulses, but not sham stimulation, attenuate individual occipital alpha activity.
Discussion
We examined the effects of short tVNS pulses (and sham stimulation at the ear lobe) on pupil dynamics and EEG alpha activity in naïve healthy subjects. While both objective and subjective stimulation intensities were not significantly different in the two conditions (Table 1), we found that short tVNS pulses induce pupil dilation (Figure 2) and EEG alpha attenuation (Figure 4) to a greater extent than sham stimulation. These effects support the hypothesis that tVNS activates endogenous neuromodulation (LC-NE/Basal Forebrain-Ach), as is known for invasive VNS (Hulsey et al., 2017; Mridha et al., 2019), and therefore suggest that tVNS mimics VNS.
Validity and limitations
Our results were obtained during fixation at rest. Although they may generalize well to other conditions, future studies need to determine the effects of short-pulse tVNS during other states such as specific cognitive tasks or during drowsiness and sleep. For example, high arousal at baseline could create a ceiling effect for pupil dilation (see Results) and alpha attenuation; conversely, during decreased vigilance the EEG effects may attenuate idle activity at different frequency bands (e.g. changing theta/alpha ratio during drowsiness, or suppressing slow wave activity in sleep). Another limitation is that we could only study tVNS in male volunteers. Since there may be sex-specific differences in LC-NE activity (Bangasser et al., 2016), future studies with females are warranted. Lastly, we chose to compare tVNS and sham condition by subjective level and not current – allowing sometimes one conditions current to be stronger. We saw that pupil dilation was not correlated to difference in current but difference in alpha attenuation was correlated. That is, alpha attenuation was somewhat driven by the difference in current, however, the current was stronger in the Sham condition and the almost all subjects – meaning this correlation was mainly driven by subjects with stronger sham current. Therefore these effect constitutes a lower bound.
Previous tVNS studies
Our finding that tVNS attenuates alpha oscillations is compatible with some recent studies (Bodin et al., 2015; Lewine et al., 2019) while other studies reported mixed results or could not reveal EEG effects (Hammond et al., 1992; Salinsky and Burchiel, 1993). Our use of short tVNS pulses likely contributed to our ability to reveal alpha attenuation, but it should also be acknowledged that revealing alpha effects required sensitive analysis that used PARAFAC to identify alpha in each individual, and was observed in many, but not all subjects.
Most other previous tVNS studies did not focus on ongoing EEG or pupillometry as done here, but tried to demonstrate the effectiveness of tVNS by focusing on the EEG P300 or on salivary alpha amylase as readouts. The P300 is a positive deflection with maximal amplitude over centro-parietal midline electrodes, 300-500ms after stimulus onset, whose amplitude is modulated by the probability of stimulus appearance regardless of sensory modality (Desmedt et al., 1965; Sutton et al., 1965). It is hypothesized that the P300 is a marker of LC-NE activity (Nieuwenhuis et al., 2005), because LC neurons are likewise activated by infrequent stimuli independent of sensory modality (Aston-Jones et al., 1991), and deviant stimuli elicit greater pupil dilation than standard stimuli (Murphy et al., 2011). However, the P300 may not constitute a straightforward test of tVNS efficacy since the link between P300 and LC-NE activity is still debated (Nieuwenhuis et al., 2011), and there could be significant contributions to P300 from dopaminergic (Glover et al., 1988) and glutamatergic (Hall et al., 2015) systems. Ventura-Bort et al (2018) demonstrated that tVNS amplifies the parietal component of the P300 effect (P3b), selectively for easy targets in their task. However, this effect was modest and could not be replicated using weaker fixed currents (0.5mA) and simpler classical P300 task (Warren et al., 2018). Another study by Keute et al (2019) capitulated on the difference in pupil dilation between deviant and standard stimuli using a classical auditory oddball task. They used a constant 3mA tVNS in all subjects and found no effect of stimulation on event-related or baseline pupil diameter. One possibility is that 30s tVNS modulates tonic NE levels but does not affect phasic stimulus-evoked NE changes associated with the P300. In agreement with this possibility, using clonidine (an α2 adrenergic receptor agonist that reduces NE signaling), provided similar mixed results (Pineda and Swick, 1992; Halliday et al., 1994; Pineda et al., 1997; Brown et al., 2015). Future studies could use short tVNS pulses as used here to better assess its effects on the P300.
Both Warren et al (Warren et al., 2018) and Ventura-Bort (2018) showed that tVNS increases levels of salivary alpha amylase, a peripheral measure of sympathetic activity associated with LC-NE signaling (Rohleder and Nater, 2009). However, this measure has poor temporal resolution and can only reveal differences between time intervals before vs. after stimulation blocks lasting many minutes. This approach does not leverage the superior temporal resolution of tVNS compared to pharmacological NE manipulations in humans, which are highly effective in studying the effects of slower NE dynamics (Gelbard-Sagiv et al., 2018). By contrast, the transient (within seconds) tVNS-mediated effects revealed here offer significant advantages over slow modulations brought about by NE drugs.
Pupil dilation and alpha attenuation as indices of arousal and LC-NE activity
The pupil was suggested as a proxy for noradrenergic signaling since Aston Jones and Cohen first provided an example of correlated dynamics in simultaneous pupil and LC single-unit activities in a monkey (Aston-Jones and Cohen, 2005; and see a recent review by Joshi and Gold, 2020) This relation was recently established in monkeys (Varazzani et al., 2015; Joshi et al., 2016), rats (Liu et al., 2017; Hayat et al., 2020), and mice (Reimer et al., 2016; Breton-Provencher and Sur, 2019), as well as in human BOLD fMRI (Murphy et al., 2014). The tVNS-induced pupil dilation time-course we observe (Figure 3) resembles the pupil dynamics in response to LC electrical stimulation in monkeys (Joshi et al., 2016) and optogenetic stimulation in rats (Hayat et al., 2020) supporting the hypothesis that tVNS activates the LC, as is established for invasive VNS.
Alpha oscillations are abundant during wakeful detachment from the sensory environment and considered an index of low arousal (Torsvall and Akerstedt, 1987b; Drapeau and Carrier, 2004b). Alpha oscillations are believed to represent an “idling” state of cortical activity (Steriade, 2001; Palva and Palva, 2007) that is expected to be anti-correlated with arousal-promoting activity, such as that of the LC-NE system, and bias sensory perception (Waschke et al., 2019). A recent study that used long 2min tVNS on the neck also found that tVNS attenuates alpha and theta oscillation (Lewine et al., 2019).
LC-NE vs. other neuromodulatory systems
While pupil dilation and EEG alpha attenuation are both compatible with noradrenergic signaling, LC-NE involvement is unlikely to be the only modulatory system at play, given the overlap and redundancy among neuromodulatory systems. Other elements such as the cholinergic system also contribute to brain arousal and are associated with both pupil dilation (Reimer et al., 2016) and with EEG activation (Szerb, 1967). However, cholinergic activation alone is unlikely to drive the effects observed here since during Rapid Eye Movement (REM) sleep, when cholinergic activation occurs without LC-NE activity (Nir and Tononi, 2010), the EEG is activated but pupils remain constricted (Siegel, 2005). Moreover, given that VNS robustly activates the LC and no such relation has been reported for cholinergic nuclei, the most parsimonious interpretation is that the primary neuromodulatory effects of tVNS are noradrenergic, while cholinergic modulation (Mridha et al., 2019) are likely secondary. In addition, tVNS may engage additional subcortical neuromodulatory systems such as the dorsal raphe and ventral tegmental area, as observed with tVNS-induced BOLD fMRI (Frangos et al., 2015). Thus, the possible relation of tVNS to other neuromodulatory systems beyond LC-NE is an important topic for further investigation.
tVNS as a novel tool for transient neuromodulation
There is great interest in investigating the contribution of the LC-NE system to human cognition including perception, learning and memory, decision-making, and in aging and neurodegeneration. In this context, tVNS entails important advantages over existing tools. While important contributions have been made by relying on correlation with pupil dynamics (e.g de Gee et al., 2017), correlated LC-NE activity and pupil dynamics could still reflect hidden factors (such as fluctuations in arousal and attention) that constitute the causal root of the observed correlations (Clewett et al., 2018; Dragone et al., 2018). Previous human studies also employed causal perturbations using NE drugs to study effects on perception (Gelbard-Sagiv et al., 2018), memory (see van Stegeren, 2008 for review), and decision making (Warren et al., 2017). However, systemic delivery of NE drugs is inherently limited to affecting tonic LC-NE activity and has poor temporal resolution, where tVNS has a clear added value.
Using invasive VNS in patients, previous studies reported effects on memory (Clark et al., 1999; Jacobs et al., 2015; for review see Hansen, 2017; Sun et al., 2017). However, such studies are only possible in patients suffering from severe epilepsy or depression. In addition, ongoing daily VNS induces complex long-term plastic changes that make interpretation difficult.
Due to limitations of existing techniques, the potential of tVNS has been recognized and it is being increasingly used to study cognition (Van Leusden et al., 2015). However, to date, the evidence supporting the notion that it is effective in mimicking invasive VNS was mixed. By using short stimulation pulses and maximal possible currents per participant, and by focusing on simple pupillary and ongoing EEG readouts, we show that such stimulation transiently elicits markers of brain arousal that are compatible with endogenous neuromodulation (NE/Ach) activity (supporting the hypothesis that it does mimic invasive VNS) thereby extending the experimental toolkit for non-pharmacological neuromodulation in humans with high temporal resolution. Therefore, it could be used to further investigate how transient neuromodulation contributes to human cognition. Finally, tVNS could be used to further understand the processes mediating the clinical improvements brought about by VNS in epilepsy and depression, for example the role of endogenous neuromodulation (NE/Ach) activity in improving mood in depressed patients (Grimonprez et al., 2015; Liu et al., 2016; Fang et al., 2017; Tu et al., 2018). In particular, tVNS-induced pupillary and EEG effects in individual patients could possibly predict the future clinical efficacy of invasive VNS and help guide triaging patients into either conservative therapy or surgical implantation of VNS stimulation devices.
Software Accessibility
code is available upon request.
Acknowledgements
Supported by ISF 51/11 (I-CORE cognitive sciences) and the Adelis Foundation (YN), The Herczeg Institute on Aging, the TAU global research fund, and the Naomi Foundation (OS). The authors thank Nir lab members for discussions, Leon Deouell and Amit Marmelshtein for their comments on earlier drafts of the manuscript.
Footnotes
Conflict of interest none
References


