

ABSTRACT
Treatment with nicotinamide mononucleotide (NMN) is a prominent strategy to address the age-related decline in nicotinamide adenine dinucleotide (NAD+) levels for maintaining aspects of late-life health. It is assumed that exogenous NMN is directly incorporated into NAD+ in mammals by the canonical recycling pathway, however the need for NAD+ is conserved across evolution, including bacteria in the gut microbiome, which can deamidate NMN to nicotinic acid mononucleotide (NaMN). Here, we use strategic isotope labelling studies to demonstrate a role for the gut microbiome in deamidating orally delivered NMN into NaMN prior to its uptake and incorporation in mammals. Microbiome depletion increased the overall abundance of NAD metabolites, suggesting a competition relationship. Strikingly, treatment with labelled NMN increased the production of unlabelled NAD precursors, with a greater than 3-fold increase in endogenous NR levels in the gut of antibiotics treated animals upon labelled NMN treatment. These data suggest that exogenous NMN impacts the NAD metabolome through indirect means, rather than through its direct incorporation, including through the production of endogenous NR via an as-yet unidentified pathway, and demonstrate an important role for the gut microbiome in the assimilation of orally delivered NMN.
INTRODUCTION
Nicotinamide adenine dinucleotide (NAD+) is an essential redox cofactor central to metabolic processes such as glycolysis, the tricarboxylic (TCA) cycle and fatty acid oxidation (Xiao et al., 2018; Ying, 2008). NAD+ is also consumed by enzymes such as the sirtuins (Imai et al., 2000) and poly(ADP-ribose) polymerase (PARP) enzymes (Kim et al., 2005) which are mediators of genome stability (Haigis and Sinclair, 2010) and DNA repair (de Murcia and de Murcia, 1994). Given the essential role of this metabolite, the decline in NAD+ that occurs during biological ageing (Bertoldo et al., 2020; Braidy et al., 2011; Camacho-Pereira et al., 2016; Clement et al., 2019; Gomes et al., 2013; Massudi et al., 2012) and disease states (Frederick et al., 2016; Jukarainen et al., 2016; Ryu et al., 2016) has gained attention as a target for therapeutic intervention (Rajman et al., 2018). Strategies to boost NAD+ levels through supplementation with NAD precursors such as nicotinamide mononucleotide (NMN) and nicotinamide riboside (NR) are emerging as promising therapeutics (Bertoldo et al., 2020; Cantó et al., 2012; Das et al., 2018; Mills et al., 2016; Okabe et al., 2019; Rajman et al., 2018; Tarantini et al., 2019; Yoshino et al., 2018; Zhang et al., 2016). Historically, dietary supplementation with the NAD precursors nicotinic acid (Na) or nicotinamide (Nam) has been used to prevent chronic NAD deficiency, which causes pellagra. When these micronutrients are replete, the step converting Nam into NMN by the enzyme nicotinamide phosphoribosyltransferase (NAMPT) is rate limiting in NAD synthesis (Revollo et al., 2004), and the use of NAD precursors that occur after this step, namely NMN and NR, have gained prominence as a strategy to raise NAD+.
Oral delivery is the primary route for administration of NMN and NR in rodents (Das et al., 2018; Mills et al., 2016; Trammell et al., 2016; Yoshino et al., 2011) and humans (Martens et al., 2018; Trammell et al., 2016). It is important to understand how orally administered NMN is metabolised. Intravenously—but not orally—administered NR and NMN was shown to be delivered to tissues intact, due to rapid first pass metabolism by the liver, which hydrolysed NMN and NR into free Nam (Liu et al., 2018). Given that the premise of providing NR or NMN rather than Nam is that these metabolites overcome the rate-limiting step of NAMPT (Rajman et al., 2018), it is unclear why oral delivery of these compounds – which are rapidly metabolised to provide free Nam – raises NAD+ levels more than treatment with Nam, which is abundant in dietary sources.
Given the highly conserved requirement for NAD+ across evolution (Gazzaniga et al., 2009), it could be expected that microbial species in the gut microbiome would consume or metabolise NAD precursors obtained from dietary sources or orally delivered bolus doses. This was recently described for Nam, which can undergo deamidation to nicotinic acid Na) in the gut by the bacterial enzyme PncA (Shats et al., 2020). We sought to explore whether the microbiome would play a similar role in the metabolism of orally delivered NMN, by tracing the metabolism of isotope labelled NMN in the intestinal tissue of mice during the context of microbiome ablation. If so, this could help explain the striking appearance of nicotinic acid adenine dinucleotide (NaAD) upon in vivo supplementation with NR (Trammell et al., 2016). In mammals, NR is phosphorylated into NMN by NR kinases (NRK1/2) (Bieganowski and Brenner, 2004; Ratajczak et al., 2016a), and then adenylated into NAD+ by NMNAT enzymes (NMNAT1-3) (Berger et al., 2005; Emanuelli et al., 2001; Garavaglia et al., 2002; Raffaelli et al., 2002; Schweiger et al., 2001; Zhang et al., 2003), effectively bypassing NaAD, which is an intermediate of the Preiss-Handler pathway (i.e., de novo synthesis) (Preiss and Handler, 1958a; Preiss and Handler, 1958b). In contrast, bacteria have a well-characterised NMN deamidase enzyme, PncC (Galeazzi et al., 2011). A simple theory to explain the increased NaAD with NR treatment (Trammell et al., 2016) could be that NMN and NR assimilation follows a non-canonical route that combines steps of both microbial and mammalian processes, whereby NMN is de-amidated into NaMN or NaR prior to its uptake into mammalian tissue, where it is assimilated into NAD+ via the intermediate step of NaAD. This theory could explain the appearance of NaAD following NR supplementation (Trammell et al., 2016).
To determine whether the gut microbiome has a role in NMN metabolism, we designed a stable isotopologue of NMN, which was delivered to animals treated with antibiotics to ablate the gut microbiome. Targeted metabolomics was then used to measure the incorporation of labelled NMN into the NAD metabolome. Here, we present evidence for the deamidation of NMN by the gut microbiome. We further show that ablation of the microbiome by antibiotic treatment increases the uptake and conversion of orally delivered NMN into the NAD metabolome, and that isotope labelled NMN presents in the intestinal tissue overwhelmingly in the form of NR, suggesting that the dephosphorylation of NMN is the primary route for its uptake. Contrary to the assumption that exogenous NMN treatment raises NAD+ levels through its direct incorporation into the NAD metabolome, we show that treatment with isotope labelled NMN results in the upregulation of endogenous, unlabelled NAD metabolites. Overall, our results demonstrate that the gut microbiome plays a role in the assimilation of NMN across the gastrointestinal tissue.
RESULTS
NMN treatment alters the de novo arm of NAD+ synthesis
Previous work described that administration of the amidated NAD precursor NR resulted in the formation of the deamidated metabolites nicotinic acid mononucleotide (NaMN) and nicotinic acid adenine dinucleotide (NaAD) (Trammell et al., 2016), deamidated intermediates in the de novo arm of NAD homeostasis. According to canonical models of mammalian NAD homeostasis, the metabolism of NR into NAD+ does not intersect with the de novo pathway, however bacteria present in the gut microbiome do encode de-amidase enzymes such as PncC, which deamidates NMN into nicotinic acid mononucleotide (NaMN) for metabolism via the de novo pathway (Galeazzi et al., 2011). One possibility is that NR treatment results in the previously described spike in NaMN and NaAD as a result of deamidation by the gut microbiome, followed by phosphorylation into NaMN and adenylation into NaAD by the mammalian enzymes NRK1/2 and NMNAT1-3. Given that NMN is taken up following its extracellular dephosphorylation into NR (Ratajczak et al., 2016a), a similar trend might be expected with NMN treatment. To test this idea in vivo, we used mice that were exposed to a course of antibiotics to ablate the gut microbiome (Supp. Fig. 1). These animals received a bolus of NMN (500 mg/kg) by oral gavage, and four hours later, animals were sacrificed and tissues rapidly preserved for targeted metabolomic analysis (Fig. 1). In agreement with previous work, NMN treatment increased the abundance of the de-amidated metabolites NaR and NaMN in both the GIT (Fig. 1a, b) and liver (Fig. 1d, e), while NaAD was increased in the liver (Fig. 1f) as consistent with previous work (Trammell et al., 2016). Interestingly, this was completely abolished in antibiotic treated animals, where NMN treatment instead led to a spike in the amidated metabolites NR (Fig. 1g, j) and NMN (Fig. 1h, k), and abolished the increase in liver NaAD (Fig. 1f). To highlight the inverse relationship between amidated and de-amidated metabolites during antibiotics treatment, the abundance of each deamidated metabolite was expressed as a ratio of its amidated counterpart (Fig. 1m-r), highlighting a profound role for the microbiome in dictating the roles of the de-amidated and amidated arms of NAD metabolism.

Mice treated with antibiotics (Abx) to ablate the gut microbiome were administered a single dose of unlabelled nicotinamide mononucleotide (NMN) (500 mg/kg, oral gavage). Gastrointestinal tissue (GIT) (a-c) and liver tissue (d-f) were subject to targeted mass spectrometry to quantify the deamidated metabolites (a-f) nicotinic acid riboside (NaR) (a, d), nicotinic acid mononucleotide (NaMN) (b, e) and nicotinic acid adenine dinucleotide (NAAD) (c, f), as well as their amidated counterparts (g-l) nicotinamide riboside (NR) (g, j), NMN (h, k) and nicotinamide adenine dinucleotide (NAD+) (i, l). These data were then expressed as ratios between de-amidated and amidated counterparts in GIT (m-o) and liver (p-r). Data analysed by 2-way ANOVA with Sidak’s post-hoc test, exact p-values and F values in supplementary files. N=4-5 animals per group, *p<0.05, **p<0.01, ***p<0.001, ****p<0.0001.
Strategic isotope tracing of NMN metabolism
While the standard assumption of studies that deliver a bolus of exogenous metabolites such as NR or NMN is that changes in downstream metabolites are due to the direct incorporation of exogenous material, we next sought to carefully test whether this exogenous NMN was indeed undergoing direct deamidation prior to its incorporation into the NAD metabolome using isotope tracing studies. We designed two separate stable isotopologues of NMN that were strategically labelled at positions that would answer our question of whether NMN was incorporated following its deamidation. The first of these, designated as NMN1, was 13C labelled at all five carbon positions of the ribose moiety for an M+5 mass shift, and 15N labelled at the nicotinyl ring for an overall M+6 mass shift (Fig. 2a, Supp. Fig. 2). In the last step of the de novo pathway, the enzyme NAD synthetase (NADS) amidates the carboxylic acid of NaAD using an ammonia intermediate derived from the amide group of glutamine, yielding glutamate (Fig. 2). By delivering the NMN1 (M+6) isotope in the presence of 15N-glutamine (M+1) labelled at the amide position, the presence of M+7 labelled NAD+ with an additional mass shift from the nicotinyl amide would indicate that the original amide N atom had been lost during deamidation and replaced by a 15N atom from 15N-Gln, indicating incorporation of NMN into NAD+ via prior deamidation and the de novo pathway (Fig. 2a). To complement this experiment, we designed a second isotope, designated as NMN2, where all five carbons of the ribose moiety were 13C labelled, and both the nicotinyl ring and amide positions were 15N labelled, for an overall M+7 mass shift (Fig. 2b, Supp. Fig. 2). When delivered in a separate experiment, if NMN2 (M+7) underwent deamidation prior to its incorporation, the 15N amide would be lost and replaced by a 14N atom from the endogenous glutamine pool, resulting in M+6 labelled NAD+. By comparing the ratios of M+7 and M+6 labelled NAD+ in each experiment, we could quantify the proportion of NMN that had been incorporated into NAD+ following deamidation and assimilation by the de novo pathway. This would be supported by comparing the ratios of M+1 and M+2 labelled Nam, which is released by NAD+ consuming enzymes, however this interpretation would be complicated by the recently described role of the bacterial nicotinamide (Nam) deamidase PncA in systemic mammalian NAD+ homeostasis (Shats et al., 2020). By using triple-quad mass spectrometry and multiple reaction monitoring (MRM) for targeted metabolomics, we could further refine these data to determine where mass shifts occurred, including whether Nam was labelled at the base (i.e. nicotinyl ring) or amide positions, and whether M+6 or M+7 labelling of NAD was from the NMN rather than the AMP moiety.

NMN (box on left) was labelled with 13C at all 5 carbon positions of the ribose moiety (highlighted in red) and with 15N at the base (highlighted in blue) and amine (highlighted in orange) of the nicotinamide moiety for a total mass shift of M+7. The expected mass shift for each species is shown, with steps catalyzed by mammalian enzymes in solid black lines, and steps that are only known to be carried out by bacterial enzymes shown with dashed lines.
15N-Gln labelling of NAD+ biosynthesis
To test whether this scheme would lead to labelling of the NAD pool as anticipated, we first used primary rat hepatocytes grown in vitro, to avoid contributions from the microbiome. Hepatocytes were treated for 24 hr with 15N-glutamine (M+1) in the presence or absence of NMN1 (M+6), or with NMN2 (M+7) (Fig. 3). Cell lysates were subject to targeted metabolomic analysis to assess the degree of isotope incorporation into each metabolite (Fig. 3a-e). Delivery of each of these isotopes yielded the expected M+6 and M+7 mass shifts of NMN (Fig. 3b) as well as its de-phosphorylated counterpart NR (Fig. 3a), which is consistent with the indirect transport of NMN (Ratajczak et al., 2016a) (Bieganowski and Brenner, 2004; Ratajczak et al., 2016), though these data do not exclude the direct transport of NMN via the putative transporter SLC12A8 (Grozio et al., 2019) – for this reason, the data in this investigation could be interpreted as evidence for deamidation of NMN and/or NR, rather than NMN alone. To test the strategy of using 15N glutamine to label NAD+ synthesis, we compared the ratio of M+1 (nicotinamide labelled) to M+0 (endogenous) NAD+ (Fig. 3f). As expected, 15N-Gln treatment increased M+1 labelling of endogenous NAD+, with M+1 NAD+ labelling in untreated samples due to baseline levels of naturally occurring isotopes. High levels of M+1 NAD+ labelling (Fig. 3f) were observed in samples treated with NMN1, likely due to recycling of the M+1 labelled Nam moiety (Fig. 3g) following the breakdown of NAD+ (Fig. 2), or by cleavage of the NMN glycosidic bond between the ribose and nicotinamide groups. As expected, treatment with NMN1 (M+6) and NMN2 (M+7) led to M+6 and M+7 labelling of NAD+ (Fig. 3c). While we had hypothesised that in vivo treatment with NMN1 (M+6) and 15N-Gln (M+1) would lead to M+7 labelled NAD+ due to the deamidation of NMN by the gut microbiome, in this culture of primary hepatocytes alone we observed that 15N-Gln co-treatment with NMN1 (M+6) increased the formation of M+7 labelled NAD+, when compared to NMN1 (M+6) alone (Fig. 3h). In line with the expected recycling of labelled Nam from NAD+ (Fig. 2a), this increased formation of M+7 labelled NAD+ during NMN1 (M+6) and 15N-Gln co-treatment was matched by an identical increase in M+2 labelling of free Nam (Fig. 3i), which was incorporated into the nicotinyl moiety of NAD+ (Fig. 3j). 15N-Gln treatment increased M+1 labelling at the amide position of Nam (Fig. 3i), but not the base (i.e. nicotinyl ring) position (Fig. 3k), which does not undergo substitution by NADS, with NMN1 (Fig. 2a) treatment serving as a positive control for labelling at this position. Overall, these data verified our system of labelling, and demonstrated the specificity of our targeted analytical approach, based on triple quadrupole mass spectrometry and MRM targeted metabolomics. While the production of M+7 labelled NAD+ during treatment with NMN1 (M+6) and 15N-Gln (M+1) point to the deamidation of either NMN or NR by mammalian cells in vitro, these data suggest that as a proportion of the overall cellular pool, the canonical recycling pathway dominates as the primary pathway for incorporation of exogenous NMN. As mammals do not encode a known NMN, NR or Nam deamidase enzyme, we next sought to measure the incorporation of labelled NMN into the NAD+ metabolome of bacteria, which encode the NMN deamidase PncC (Galeazzi et al., 2011) and the Nam deamidase PncA (Frothingham et al., 1996).

Primary hepatocytes were treated with NMN1 (M+6) or NMN2 (M+7) isotopes (200 µM) in the presence of unlabelled or amide labelled 15N-glutamine (M+1) (4 mM) for 24 hr, to measure the degree of NAD synthesis and the incorporation of exogenous NMN via the de novo pathway, which incorporates the amide label of 15N-Gln through the enzyme NAD synthetase (NADS). Exogenous NMN1 and NMN2 isotopes in the presence of 15N-Gln led to the expected isotopic labelling of a) NR, b) NMN, c) NAD+ d) Nam and e) Gln. Ratios of f) M+1amide labelled to unlabelled NAD, g) M+7 labelled NAD+, h) M+2 labelled NAD+ and i) M+1amide Nam were consistent with labelling by 15N-Gln, with no change in j) M+1base labelled Nam acting as a negative control, as no change in labelling at the ring position is expected. This resulted in l) M+2 labelled Nam during NMN1 and 15N-Gln treatment. Data analysed by 2-way ANOVA with Sidak’s post-hoc test, n=3 biological replicates.
NMN deamidation by bacteria
Unlike mammals, bacteria rely on an NAD+ dependent DNA ligase that is inhibited by NMN, the product of its own reaction (Chen et al., 2002; Geider, 1972; Zimmerman and Oshinsky, 1969), resulting in the accumulation of intracellular NMN during exponential growth (Olivera and Lehman, 1967). NMN is salvaged through the bacterial NMN deamidase PncC, yielding NaMN as a substrate for NAD+ synthesis by the Preiss-Handler pathway (Galeazzi et al., 2011). To model whether orally delivered NMN would undergo deamidation by bacteria, growth phase E. coli cultures were supplemented with NMN1 (M+6) (Fig. 2a) and subjected to targeted metabolomics of both cell lysates and extracellular culture media (Fig. 4). Consistent with the role of PncC in NMN metabolism in bacteria, treatment with labelled NMN resulted in the rapid incorporation of isotope labels into NaMN, with over 50 times the quantity of labelled NaMN compared to NMN (Fig. 4). A role for the Nam de-amidase PncA is strikingly reflected in the abundance of nicotinic acid (Na) compared to nicotinamide (Nam) in the cell pellet compared to the culture supernatant, where the abundance of Nam and absence of Na in growth media was completely reversed in cell pellets, indicating rapid Nam deamidation. Overall, the rapid and abundant labelling of the deamidated metabolite NaMN by E. coli (Fig. 4) supported our hypothesis that the gut microbiome could contribute to the metabolism of orally administered NAD precursors such as NMN.

Liquid cultures of E. coli OP50 bacteria were supplemented with M+6 labelled NMN1 (0.1 mM) at inoculation of a fresh culture. Samples were taken at time 0 (after NMN), 140, 160 and 180 minutes after NMN supplementation. Following separation of the culture supernatant (top) from the cell lysate (bottom), metabolites were extracted and subjected to targeted LC-MS/MS mass spectrometry to detect the incorporation of the M+6 isotope label into NMN, NR, NaMN and NAD+ as well as M+1 labelling of nicotinamide (Nam) and nicotinic acid (Na) in both the culture supernatant (top) and cell lysates (bottom). Data represents mean ± s.d. (n=3-5 samples per time point).
Antibiotic treatment alters NMN deamidation in vivo
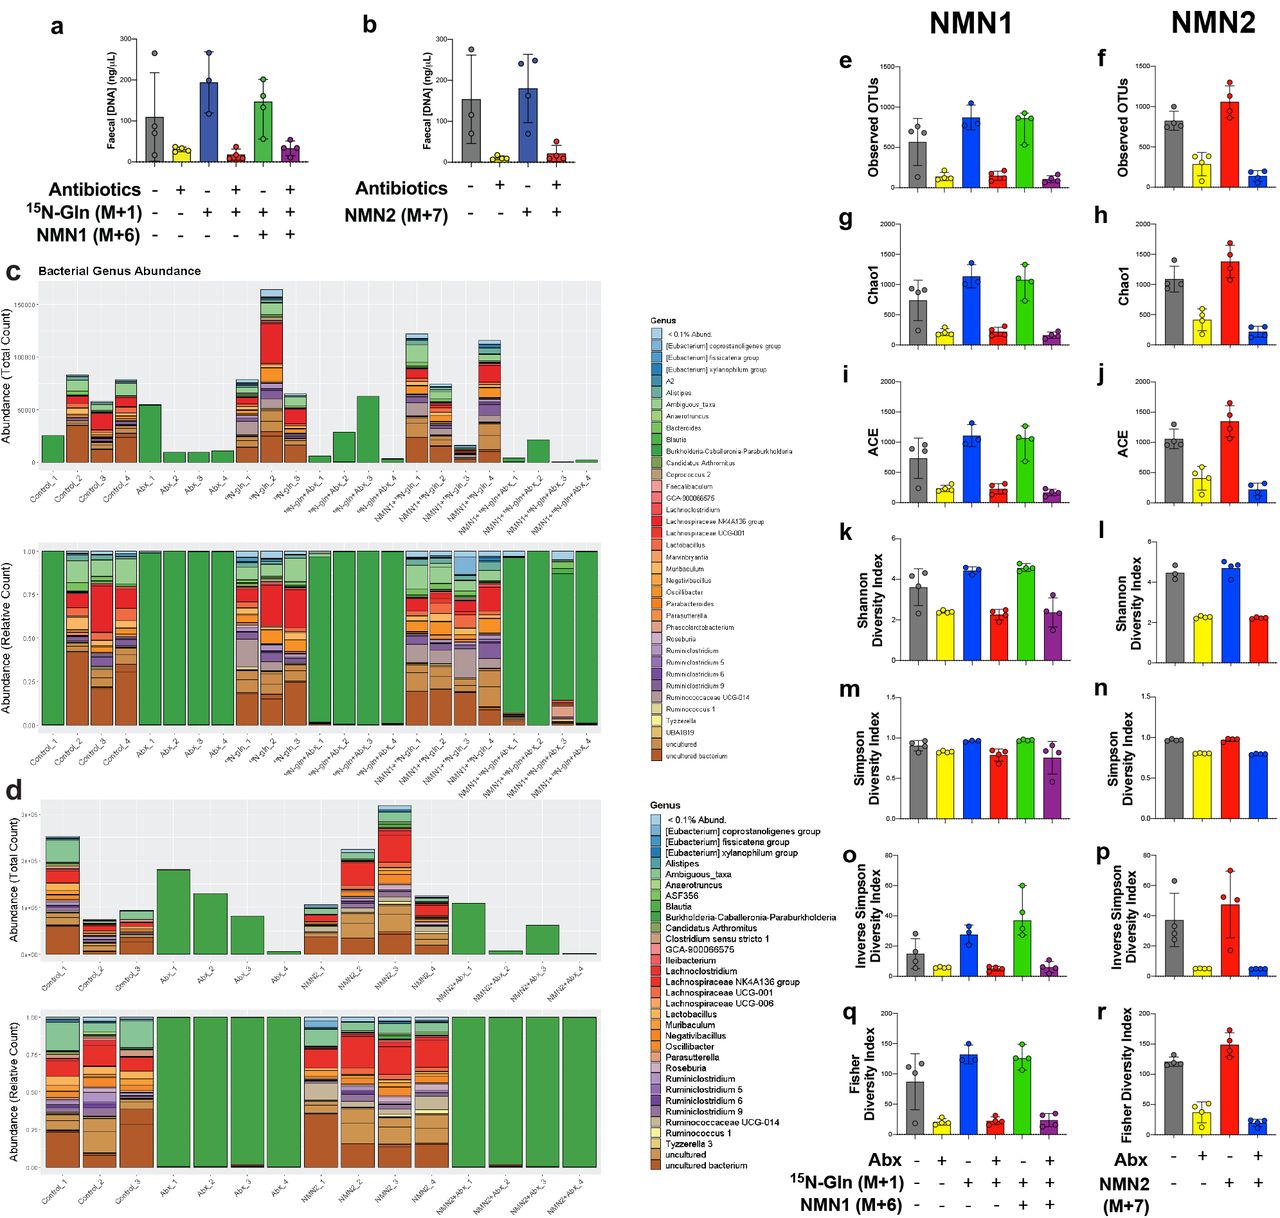
To directly trace whether the increase in de-amidated metabolites following NMN administration (Fig. 1) was indeed due to the direct deamidation and incorporation of these metabolites, we next delivered our strategically designed isotopes into animals that had similarly been treated with antibiotics to deplete the gut microbiome, as confirmed by reductions in faecal DNA concentration (Supp. Fig. 1a), full-length 16S rRNA sequencing (Supp. Fig. 1c) and reduced alpha diversity (Supp. Fig. 1e-r). Following antibiotic treatment, animals received a single oral gavage (50 mg/kg) of the NMN1 (M+6) isotope (Fig. 2a), in parallel with an i.p. bolus of 15N-Gln (M+1). Four hours later, animals were sacrificed and tissues rapidly preserved for targeted metabolomic analysis (Fig. 5, Supp. Fig. 3-5) to measure the formation of M+7 labelled NAD+, which would be indicative of prior deamidation and incorporation via the de novo pathway as described in Fig 1 and Fig. 2. To complement this experiment, a separate cohort of antibiotic treated animals (Supp. Fig. 1b, d) received a bolus of the NMN2 (M+7) isotope (Fig. 2b), following which tissues were similarly collected 4 hr later for targeted metabolomic analysis (Fig. 6, Supp. Fig. 6, 7) to measure the loss of the NMN2 amide label from M+7 to M+6 labelled NAD+, which would also indicate deamidation prior to incorporation.

Animals were treated with antibiotics (Abx) to deplete the microbiome, followed by an oral gavage (50 mg/kg) of NMN1 (M+6) with adjacent i.p. administration of 15N-Gln (735 mg/kg, 10ml/kg body weight). Four hr later, GIT (a-g) and liver (h-n) were rapidly preserved for targeted metabolomics analysis to identify labelling of (a, h) NMN, (b, i) NR, (c, j) NAD+, (d, k) Nam, (e, l) NaMN, (f, m) NaR and (g, n) NaAD. n=3-4 animals per group, data presented as stacked bars of each isotopologue, with raw data points for each isotopologue overlaid on bar charts.
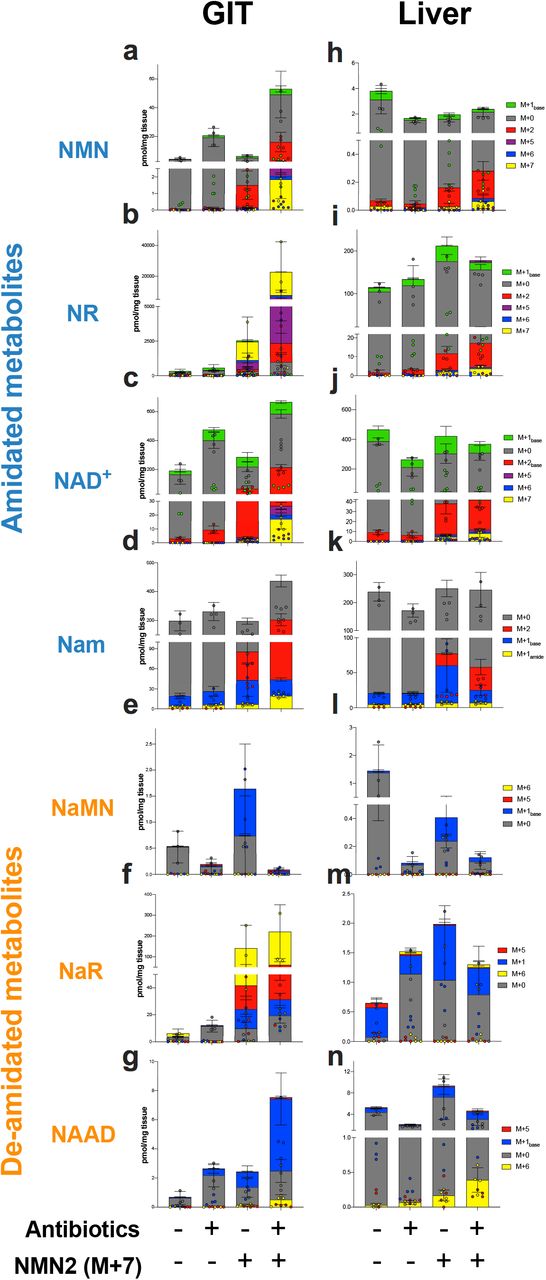
Animals were treated with antibiotics (Abx) to deplete the microbiome, followed by an oral gavage (50 mg/kg) of NMN2 (M+7). Four hr later, GIT (a-g) and liver (h-n) were rapidly preserved for targeted metabolomics analysis to identify labelling of (a, h) NMN, (b, i) NR, (c, j) NAD+, (d, k) Nam, (e, l) NaMN, (f, m) NaR and (g, n) NaAD. n=3-4 animals per group, data presented as stacked bars of each isotopologue, with raw data points for each isotopologue overlaid on bar charts.
In tissues from animals treated with NMN1 (M+6), the deamidation of NMN could be quantified by comparing the ratio of NAD+ that incorporated the expected M+6 labelling, to the proportion of NAD+ that incorporated an extra mass shift from co-treatment with 15N-Gln (M+1), resulting in M+7 NAD+ (Fig. 2a, 7a), with an increased ratio of M+7 to M+6 labelled NAD+ indicating deamidation of NMN. The reason for using these ratios, rather than the overall amounts of each isotope (Fig. 5, Supp. Fig. 4, 5), is that these ratios act as internal controls for differences in bioavailability following antibiotic treatment, as discussed in later sections. From the intact labelling of NAD+ in the GIT from NMN1 treatment, around 13% was M+7 labelled (Fig. 7b, c). Importantly, these data likely underestimates incorporation via the de-amidated route, as this scheme relied on the availability of exogenous 15N-Gln relative to the endogenous pool of unlabelled Gln, with labelled Gln composing only 9-13% of the total plasma Gln pool at the experimental endpoint (Supp. Fig. 3g). Consistent with our hypothesis, the ratio of M+7 to M+6 labelling in the GIT was reduced in antibiotic treated animals (Fig. 7b), suggesting reduced deamidation of orally administered NMN when contributions from the microbiome were reduced. This was reflected by a reduction in the ratio of M+2 to M+1base labelled Nam in both the GIT, liver and plasma (Fig. 7d, e, Supp. Fig. 8h), however this change also likely reflected reduced contributions from the bacterial nicotinamide de-amidase PncA (Frothingham et al., 1996) following antibiotic treatment (Shats et al., 2020). This change in Nam labelling carried into the M+2 or M+1base labelling of NMN (Fig. 7f, g) and M+2 labelling of NAD+ (Fig. 7h, i), with reduced labelling ratios of these recycled isotopes during antibiotic treatment likely reflecting a combination of possible NMN/NR deamidation (Fig. 7a, b), and contributions from the bacterial Nam deamidase PncA (Shats et al., 2020).

Antibiotic treated animals were orally administered with the a) NMN1 (M+6) isotope in the presence or absence of 15N-glutamine (M+1), with the formation of M+7 labelled NAD+ or M+2 labelled Nam reflective of incorporation following deamidation and reamidation by the enzyme NADS. Antibiotic treatment reduced (b, c) M+2 labelling of nicotinamide (Nam), (d, e) M+7 labelling of NAD+ and (f, g) M+2 labelling of NAD+, which reflects the incorporation of recycled Nam. Data are expressed as ratios to M+1base NAM and M+6 or M+1 NAD+, which are the expected isotope products of NMN or NR assimilation. Incorporation of this extra label was limited by the availability of 15N-glutamine (M+1) as h) a proportion of the endogenous glutamine pool. In a separate cohort, animals were treated with i) NMN2 (M+7), where loss of the amide 15N label to form M+6 labelled NAD+ or M+1base labelled Nam would reflect deamidation. Antibiotic treatment protected M+2 NAM (j, k), M+7 NAD+ (l, m) and M+2 NAD+ (n, o) against loss of the NMN2 15N amide compared to untreated animals. Tissues shown in the left column (b, d, f, j, l, n) are gastrointestinal tract (GIT), on the right column (c, e, g, k, m, o) are liver. NMN1 and NMN2 experiments were run in separate cohorts of animals, each measurement represents tissue from a separate animal. Comparisons of isotope treated groups with or without antibiotic treatment were analysed by Mann-Whitney U-test, *p=0.0286, n=4 animals per group.
To complement this approach, in the NMN2 (M+7) experiment (Fig. 2b), we would anticipate that deamidation by the microbiome would result in loss of the 15N amide label, resulting in the formation of M+6 NAD+ at the expense of M+7 NAD+ (Fig. 2b, 7j). In contrast to the previous NMN1 experiment, the ratios of M+7 to M+6 NAD+ would instead decrease as the rate of deamidation increased. Further, interpretation of deamidation in this NMN2 experiment was not limited by the availability of exogenous 15N-Gln relative to a large, endogenous pool of Gln, as was the case with the NMN1 experiment (Fig. 7a, Supp. Fig. 3). In this experiment, the ratio of M+7 to M+6 NAD+ was around 3:1 (Fig. 7k, l), suggesting that around 25% of orally administered NMN undergoes deamidation prior to its intact incorporation into NAD+. In support of a role for the microbiome in NMN deamidation, the ratio of M+7 to M+6 labelled NAD+ was increased in the GIT and liver of antibiotic treated animals (Fig. 7k, l). This was similarly matched by an increased ratio of M+2 to M+1base labelled Nam in the GIT (Fig. 7m), liver (Fig. 7n) and plasma (Supp. Fig. 8i) of antibiotic treated animals, reflecting decreased incorporation following deamidation, though this could instead be due the deamidation of Nam rather than NMN. As in the previous experiment, these labels were recycled into M+2 labelled NMN (Fig. 7o, p) and NAD+ (Fig. 7q, r). In addition to differences in the isotope labelling of NAD+ (Fig. 7), these experiments replicated the inverse relationship between NaMN and NMN levels following antibiotic treatment (Fig. 5a, e, Fig. 7a, e) observed in our earlier experiment with unlabelled NMN (Fig. 1b, h, n). Overall, these data from two complementary approaches support the concept that orally delivered NMN or NR can undergo deamidation prior to incorporation, and a role for the microbiome in mediating this. While these data could in part explain the spike in the de-amidated metabolites NaMN and NaAD following treatment with the amidated precursors NR (Trammell et al., 2016) or NMN (Fig. 1), it is important to note that when measured as a proportion of the overall NAD+ pool, the contribution of both M+7 and M+6 intact labelled NAD+ was small. Partially labelled NAD+ (M+2) was around 10-fold more abundant than intact labelled NAD+ (M+7) (Fig. 5c, 6c, Supp. Fig. 4-7), indicating either cleavage of the labile glycosidic bond of NMN, or rapid recycling of NAD+, as described previously (Liu et al., 2018). Following cleavage of the glycosidic bond to release free Nam, its deamidation in the GIT (Shimoyama et al., 1971; Tanigawa et al., 1970) by the bacterial enzyme PncA (Shats et al., 2020) also likely contributes to these changes.
Exogenous NMN boosts the endogenous NAD+ metabolome
The abundance of partially labelled NAD+ at the Nam position only is consistent with previous findings (Liu et al., 2018) that orally delivered NMN and NR undergo cleavage at the glycosidic bond to release free Nam, with only a small proportion of orally delivered material being incorporated into tissues intact. Given that NMN and NR are overwhelmingly incorporated in the form of free Nam, why do the downstream biological effects of NR or NMN differ from the delivery of free Nam (Trammell et al., 2016), a widely available nutrient present in dietary sources? One basic assumption is that exogenous NAD+ precursors increase levels of NAD and other metabolites due to their direct incorporation, as expected by classic mass-balance models. Our data complicates this assumption, as delivery with exogenous NMN that was 100% isotope labelled (M+6 or M+7, Supp. Fig. 2) also increased the levels of unlabelled (M+0), endogenous metabolites. For example, treatment with NMN1 or NMN2 in antibiotics treated animals increased levels of unlabelled NaR (Fig. 5f, 6f, Supp. Fig. 4f, 6f) in the GIT, and increased unlabelled NR (Fig. 5b, 6b Supp. Fig. 4b, 6b) and NaAD (Fig. 5n, 6n, Supp. Fig. 5g, 7g) in the liver. Notably, treatment with labelled NMN in antibiotic treated animals increased the production of unlabelled NR in the GIT by over an order of magnitude (Fig. 5b, 6b, Supp. Fig. 4b, 6b).
Host-microbe interactions in the bioavailability of orally delivered NAD+ precursors
Another unexpected aspect of these data was the overall increase in levels of these metabolites as a result of antibiotic treatment alone, which more than doubled the labelling of the metabolites NMN, NR, NAD+ and Nam (Fig. 1g-i, 5a-d, 6a-d, Supp. Fig. 4h-k, 5h-k, 6h-k, 7h-k). This increase even occurred in the levels of unlabelled metabolites in animals that did not receive exogenous NMN (Supp. Fig. 4a-d, 6a-d). When the NMN1 (M+6) isotope was delivered, the incorporation of exogenous labels into NAD+ metabolites was vastly increased in antibiotic treated animals, by an order of magnitude for some metabolites such as NR (Fig. 5b, Supp. Fig. 4i), a trend that was precisely recapitulated in a separate cohort of animals receiving the NMN2 (M+7) isotope (Fig. 6b, Supp. Fig. 6i) and in animals that received unlabelled NMN (Fig. 1g). The overwhelming abundance of NR in the GIT during antibiotics treatment is worthy of later investigation, as the abundance of this single metabolite was greater than all other NAD+ metabolites combined, including NAD+ itself.
NMN uptake is facilitated by dephosphorylation into NR
In addition to a role for the microbiome in NMN uptake and deamidation, the design of this study allowed us to shed light around how NMN is transported into cells. This has been described to occur following dephosphorylation of NMN into NR by the cell surface enzyme CD73, prior to uptake by ENT nucleoside transporters and re-phosphorylation into NMN inside the cell by NRK1/2 (Supp. Fig. 9) (Bieganowski and Brenner, 2004; Ratajczak et al., 2016a). Alternatively, the solute carrier protein SLC12A8 has been described as a dedicated NMN transporter (Grozio et al., 2019). As with CD73 and ENT, SLC12A8is located on the apical side of the intestinal tissue. As both mechanisms could co-exist, the question is the degree to which each mechanism contributes to the uptake of NMN.
If the direct route via SLC12A8 prevailed, we would expect to see high levels of labelled (M+7 or M+6) NMN, with lesser uptake of labelled NR. In contrast, if the indirect transport of NMN following its dephosphorylation into NR was dominant, there would be a higher levels of NR labelling. In primary hepatocytes (Fig. 3), NMN1 (M+6) treatment resulted in near complete labelling of the NR pool (Fig. 2b), with slightly lesser labelling of the NMN pool (Fig. 2a). Strikingly, in vivo treatment showed strong labelling of the NR, but not NMN pools (Fig. 5 a, b; Fig. 6 a, b; Supp. Fig. 4a-b, h-i; Supp. Fig. 6a-b, h-i; Supp. Fig. 9). Intact (M+6 or M+7) labelled NR levels (Supp. Fig. 4i, 6i) were five-fold higher than endogenous NR (M+0) (Fig. 5b, 6b, Supp. Fig. 4h, 5h; Supp. Fig. 9), which increased to a ten-fold greater enrichment with antibiotics treatment (Supp. Fig. 9). In stark contrast, only around 5% of the NMN pool was M+7 labelled (Fig. 5a, Fig. 6a; Supp. Fig. 4a, h; Supp. Fig. 7a, h, Supp. Fig. 8). The inability of exogenous NMN to displace the endogenous NMN pool, combined with the surge of labelled NR, suggests that NMN uptake bypasses direct transport, and would instead support the dephosphorylation of NMN into NR to facilitate its intestinal absorption (Supp. Fig. 9). If direct transport of NMN does occur, it is in competition with the microbiome, as even when M+6 or M+7 labelling of NMN was observed at low levels, this only occurred in antibiotic treated animals (Fig. 5b, 6b).
Chronic NMN treatment does not alter microbial diversity
Given the potential role for host-microbiome interactions in the metabolism of orally delivered NMN, it might be expected that NMN treatment would alter the composition of the microbiome. While 16S rRNA sequencing (Supp. Fig. 2) of young animals that received an acute dose of exogenous NMN did not show a change in microbial diversity, this might not be expected in this timeframe and in young animals where NAD+ is already replete. To test whether chronic NMN treatment could impact the composition of the gut microbiome, we treated aged, 97-week old animals with chronic NMN dosing via addition to drinking water (∼400 mg/kg/day) for 8-10 weeks prior to cull (Camacho-Pereira et al., 2016; Clement et al., 2019; Massudi et al., 2012; Schultz and Sinclair, 2016). 16S rRNA long-read sequencing revealed no overall change in diversity of the gut microbiome (Fig. 8), however there were a number of changes among individual species, available in Supplementary File 1.

Aged (97-week old) male and female mice were treated with NMN through addition to drinking water (∼400 mg/kg/day) for 8-10 weeks prior to cull, and faecal microbiome samples subject to long-read 16S rRNA sequencing. (a) Stacked bar plots represent the total reads and relative abundance of bacterial taxa at the genus level for untreated or NMN treated animals, also shown as differential expression by the (b) genus level and (c) by operational taxonomic unit (OTU) level. There was no change in microbiome diversity, shown by the (d) Shannon alpha diversity index.
DISCUSSION
These studies were initially undertaken to address questions of how delivery of the amidated NAD precursors NMN or NR could lead to the surprising observation of a spike in the formation of a deamidated metabolite, NaAD (Trammell et al., 2016). In the canonical model of mammalian NAD+ biosynthesis, the amidated metabolites NMN, NR and Nam do not undergo deamidation into their counterparts nicotinic acid riboside (NaR), nicotinic acid mononucleotide (NaMN) and Na (Fig. 2). These deamidated forms are confined to the de novo and Preiss-Handler pathways, the final step of which involves the amidation of NaAD into NAD+ by the enzyme NAD synthase (Fig. 2). The observation of increased NaAD following NR treatment (Trammell et al., 2016) could potentially be explained by feedback inhibition of further NAD biosynthesis to maintain NAD levels within a tight homeostatic threshold (Hara et al., 2019), resulting in a bottleneck at the enzyme NAD synthase (NADS) and accumulation of its substrate NaAD. Alternatively, bacteria possess deamidase enzymes not present in mammals, such as the NMN deamidase PncC (Galeazzi et al., 2011), which could alternatively contribute to the formation of NaMN and subsequently NaAD. Our NMN tracers were specifically designed to answer these questions, with two independent, complementary approaches (Fig. 2) that would reflect incorporation into NAD+ following its prior deamidation. In contrast to the “bottleneck” idea of NADS inhibition, the formation of M+7 labelled NAD+ following NMN1 (M+6) treatment (Fig. 3h) suggest that NMN can be incorporated via the action of NADS. While some work from over half a century ago suggested the possible existence of a Nam de-amidase in mammalian liver (Petrack et al., 1965) that could account for this result from hepatocytes grown in vitro (Fig. 3), to date there is still no known mammalian NMN, NR or Nam de-amidase. Alternatively, the deamidation observed here could be due to bacterial contamination (Shats et al., 2020) of primary hepatocyte culture, or from non-enzymatic means.
By using our strategically designed NMN isotopes (Fig. 2) in vivo, we provide evidence for the deamidation of orally delivered NMN by the gut microbiome (Fig. 7). This finding is similar to the concept recently shown by Shats and colleagues, who demonstrated a role for bacterial interactions in mammalian NAD+ homeostasis through the deamidation of Nam into Na by the bacterial enzyme PncA (Shats et al., 2020). In agreement with our study, this paper showed that antibiotic treatment increased the uptake of labelled nicotinamide in the colon, small intestine and liver, though a control group of animals treated with antibiotics alone were not used. Similarly, endogenous NMN levels were increased in the colon and endogenous NR was increased in the portal blood of germ-free mice, though no increase in NAD levels was observed with antibiotic treatment, as observed here. This may have been due to differences in tissue sampling or in the antibiotic cocktail used to ablate the microbiome in these studies, or the use of independently sampled sections of the small intestine and the colon, compared to our use of a pooled, heterogenous sample of the entire GIT.
While intravenous delivery of NMN results in intact assimilation into peripheral tissues such as the liver, kidney, brain and muscle, oral delivery of NMN results in cleavage at the glycosidic bond into free nicotinamide (Liu et al., 2018). Our results were in close alignment with those findings (Liu et al., 2018), where the ratio of intact M+7 or M+6 to M+0 unlabelled NAD+ was around 2%, whereas the ratio of M+2 labelled to M+0 unlabelled NAD+, presumably as a result of incorporation of free Nam, was over 10% (Fig. 5c, j, 6c, j). Given this evidence for the decomposition of NMN into free Nam prior to its uptake, a key question is why “later” precursors in NAD+ synthesis such as NMN and NR appear to have different biological effects to Nam alone. A surprising aspect of these results was that treatment with 100% labelled NMN led to a striking increase in unlabelled NAD metabolites. In the case of both NR and NaR, treatment with NMN1 (M+6) or NMN2 (M+7) led to a stark increase in endogenous (M+0) levels (Fig. 5b, f, 6b, f, Supp. Fig. 4b, f, 6b, f). Endogenous (i.e. unlabelled, M+0) levels of other metabolites were also increased by treatment with labelled NMN in both antibiotics treated and untreated animals, though not to the same degree as NR, which was elevated by over an order of magnitude. We also observed the increase in liver NaAD levels (Fig. 1f, 5g, n, 6g, n) that was previously reported with exogenous NR treatment (Trammell et al., 2016), however the majority of this change was from unlabelled NaAD. These results were similar to those of Trammel et al, where isotope tracing showed that over half of the increase in NaAD levels following NR treatment were from NaAD that did not incorporate labels from exogenous NR, with only 8% of the NaAD pool incorporating isotopes from double-labelled NR. In contrast to that study, we argue that these counter-intuitive findings run against the classic mass-balance model, whereby it is assumed that exogenous NAD+ precursors raise NAD+ levels through their direct incorporation into the NAD metabolome. Instead, these results raise the idea that treatment with these exogenous precursors could indirectly trigger endogenous NAD+ biosynthesis. The mechanism for this is not yet clear, though given the profound effect of antibiotic treatment, in particular for the overwhelming abundance of NR in the gut (Fig. 5b, 6b, Supp. Fig. 4b, 6b), are likely to involve interplay with the gut microbiome. Importantly, the increased production of endogenous NAD+ metabolites following exogenous NMN/NR treatment suggests that the benefits of exogenous treatment with NMN or NR could be from indirect signalling, rather than direct incorporation – a finding that has profound importance for therapeutic strategies, in particular the choice of dosing. An important question regarding NR in particular is how its endogenous production can be increased. NR is available from dietary sources (Bieganowski and Brenner, 2004), and is an intermediate in the uptake of extracellular NMN (Belenky et al., 2009; Ratajczak et al., 2016b). NMN accumulation in neurons can trigger cell death through the NADase SARM1 (Gerdts et al., 2015), and disposal of NMN through its adenylation into NAD+ can protect against neuronal death (Sasaki et al., 2016). It is possible that exogenous NMN triggers pathways that degrade endogenous NMN into NR, which could act as a back-up pool for NAD precursors, however the NMN ectonucleotidase that carries this out sits on the extracellular face of the plasma membrane (Belenky et al., 2009; Ratajczak et al., 2016b) rather than the cytosol, and the molar quantity of unlabelled NR that we observed in the gut relative to other metabolites including NMN cannot account for this. NAD+ homeostasis is tightly maintained within a defined range (Hara et al., 2019), and it is possible that a bolus of exogenous NAD precursors trigger the degradation of existing NAD+ to avoid exceeding this range, however an enzyme that would cleave NAD+ to yield NR has not been identified. Another possibility is that rather degrading downstream metabolites into NR, exogenous NMN or NR could trigger a currently undescribed step in mammals that leads to endogenous NR production, suggesting that NR is not merely an exogenous nutrient or intermediate in extracellular NMN uptake. This observation may explain why NR and NMN treatment lead to biological and therapeutic effects that differ from Nam alone, despite their rapid metabolism into free Nam by the liver (Liu et al., 2018) – an observation that was in close alignment our results. We propose the existence of a signalling pathway in the GIT that is sensitive to both exogenous NAD precursors and to microbial metabolites, which can mediate endogenous NAD metabolism. Metabolite sensing members of the G-protein coupled receptor (GPCR) family are obvious candidates for this role, and could include the GPR109a, which acts as a receptor both for nicotinic acid and for butyrate, released from the microbial fermentation of dietary fibre – thus linking the observations of the deamidation of orally derived NAD precursors into their acid equivalents, a role for microbiome depletion in triggering the production of endogenous NAD metabolites, and poor evidence for the incorporation of intact NR or NMN into the NAD+ metabolome.
Study limitations
To consolidate the hypothesis that the gut microbiome plays a role in NAD+ homeostasis, future studies should measure isotope labelling of NAD+ metabolites in faecal contents of mice to determine whether these compounds are being utilised by the microbiome, rather than being excreted via other mechanisms. Further, to rule out a role for the effects of antibiotic treatment on host tissues rather than depletion of the gut microbiome, future studies could use treatment in antibiotic treated animals in which the microbiome has been reconstituted. Regarding the interpretation of indirect transport predominating over direct NMN transport, important limitations are that intestinal segments were combined, causing a loss of functional heterogeneity, including sections of the jejunum and ileum recently reported to express the putative NMN transporter SLC12A8 (Grozio et al., 2019). Further, limited availability of isotope labelled material meant that this study used a single time point, rather than a time course which also encompassed very early timepoints, possibly missing the minute-order kinetics of direct NMN transport, as previously reported (Mills et al., 2016; Yoshino et al., 2011). Finally, one of the most important aspects of this work was the observation that treatment with labelled NMN led to an increase in levels of unlabelled NR, NaR and other metabolites. Further work is needed to understand how this occurs, for example, whether it is due to the acute up-regulation of NAD+ biosynthetic enzymes, the time-scale by which this increase occurs, and a direct comparison of different isotope labelled NAD+ precursors to identify which metabolites trigger the production of endogenous metabolites under normal circumstances and during depletion of the microbiome. Finally, we propose the existence of cell surface receptors and downstream signalling pathways in the gut that are sensitive to both microbial metabolites and exogenous NAD+ precursors – identifying these will be a key goal of testing our hypothesis around the role of exogenous metabolites in endogenous NAD+ metabolism.
STAR Methods
STAR methods are available in Supplementary Material and on our Mendeley data site.
Author contributions
LJK conducted experiments, analysed data, prepared figures, wrote manuscript. TJC conducted microbiome analyses. EWKP, TTC, JW prepared isotope labelled NMN. SPT and DAS provided critical feedback and interpretation. LEQ conducted experiments, extracted and analysed data, wrote manuscript. LEW conceived of and designed study, obtained funding, supervised experiments, analysed data, prepared figures, wrote manuscript.
Declaration of interests
EWKP and JW are employees and shareholders of GeneHarbor Biotechnologies. SPT is the CEO of Jumpstart Fertility, which is developing NAD+ raising compounds for therapeutic use. LEW and DAS are co-founders, shareholders, directors and advisors of Jumpstart Fertility and the Life Biosciences group which includes Jumpstart Fertility, Continuum Biosciences, Senolytic Therapeutics, Selphagy, and Animal Biosciences. LEW and DAS are also advisors to and shareholders in the EdenRoc group of companies, which includes Metro Biotech NSW and Metro International Biotech, Arc-Bio, Dovetail Genomics, Claret, Revere Biosciences, and Liberty Biosecurity. LEW is an advisor and shareholder in Intravital Pty Ltd. DAS is an inventor on a patent application that has been licensed to Elysium Health. Updated affiliation are at https://genetics.med.harvard.edu/sinclair-test/people/sinclair-other.php.
SUPPLEMENTARY MATERIAL

Following antibiotic treatment in the NMN1 and NMN2 mouse cohorts, (a-b) DNA was extracted from faeces to measure changes in DNA concentration. Uniform amounts of DNA were then subject to (c-d) full-length 16S rRNA Nanopore sequencing, with species abundance shown here at the genus level. Sequencing revealed a reduction in (e-f) operational taxonomic units (OTUs), the (g-h) Chao1 and (i-j) ACE species richness indices, and the (k-l) Shannon, (m-n) Simpson, (o-p) Inverse Simpson and (q-r) Fisher diversity indices. Data shown are non-rarefied; rarefication showed identical results (data not shown). Each data point represents samples from a separate animal

The above chromatograms represent individual peaks (ion count) for a) 100µM unlabelled NMN in combined NAD metabolite standard curve mixture, b) M+6 labelled NMN1 and c) M+7 labelled NMN2, as well as d) unlabelled and 15N-amide labelled glutamine.

Animals were treated with antibiotics (Abx) to deplete the microbiome, followed by an oral gavage (50 mg/kg) of NMN1 (M+6) with adjacent i.p. administration of 15N-Gln (735 mg/kg, 10ml/kg body weight). Four hr later, tissues were preserved for metabolomic analysis of (a-c) endogenous (M+0) and (d-e) amide labelled (M+1amide) Gln, (g-i) expressed as a percentage 15N amide glutamine labelling of the overall Gln pool. Tissues subject to analysis are (a, d, g) plasma, (b, e, h) liver and (c, f, i) GIT. n=3-4 animals per group, each data point represents a separate animal, error bars are SD.

As in Figure 4 of main text, animals were treated with antibiotics (Abx) and M+6 isotope labelled NMN1 followed by metabolomics analysis of intestinal tissue as described in Figure 1 of main text. Animals were also intraperitoneally injected with a concurrent bolus of 15N-amide labelled glutamine (735 mg/kg, 10ml/kg body weight). The left column (a-g) represents the abundance of unlabelled, endogenous species, middle column (h-n) represents intact label incorporation, right column (o-u) represents partial labelled species from the recycling of metabolites, as predicted in Fig. 2a. Data analysed by 2-way ANOVA with Sidak’s post-hoc test. n=3-4 animals per group, each data point represents a separate animal, error bars are SD.

As in Figure 4 of main text, animals were treated with antibiotics (Abx) and M+6 isotope labelled NMN1 followed by metabolomics analysis of intestinal tissue as described in Figure 1 of main text. Animals were also intraperitoneally injected with a concurrent bolus of 15N-amide labelled glutamine (735 mg/kg, 10ml/kg body weight). The left column (a-g) represents the abundance of unlabelled, endogenous species, middle column (h-n) represents intact label incorporation, right column (o-u) represents partial labelled species from the recycling of metabolites, as predicted in Fig. 2a. Data analysed by 2-way ANOVA with Sidak’s post-hoc test. n=3-4 animals per group, each data point represents a separate animal, error bars are SD.

Animals were treated with antibiotics (Abx) and M+7 isotope labelled NMN2 followed by metabolomics analysis of GIT tissue as described in Figure 6 of main text. Each data point represents measurements from a different animal. The left column (a-d) represents the abundance of unlabelled, endogenous species, middle column (e-h) represents intact label incorporation, right column (i-l) represents partial labelled species from the recycling of metabolites, as predicted in Fig. 1. Metabolites assayed are nicotinamide riboside (NR), nicotinamide adenine dinucleotide (NAD+), nicotinamide (Nam) and nicotinamide mononucleotide (NMN). Data are analysed by two-way ANOVA with Sidak’s multiple comparisons test. Data are mean ± s.d. (n=3-5 mice per group). *p<0.05, **p<0.01, ***p<0.001, ****p<0.0001, ns=not significant.

Animals were treated with antibiotics (Abx) and M+7 isotope labelled NMN2 followed by metabolomics analysis of liver tissue as described in Figure 6 of main text. Each data point represents measurements from a different animal. The left column (a-d) represents the abundance of unlabelled, endogenous species, middle column (e-h) represents intact label incorporation, right column (i-l) represents partial labelled species from the recycling of metabolites, as predicted in Fig. 1. Metabolites assayed are nicotinamide riboside (NR), nicotinamide adenine dinucleotide (NAD+), nicotinamide (Nam) and nicotinamide mononucleotide (NMN). Data are analysed by two-way ANOVA with Sidak’s multiple comparisons test. Data are mean ± s.d. (n=3-5 mice per group). *p<0.05, **p<0.01, ***p<0.001, ****p<0.0001, ns=not significant.

(a-c) Unlabelled, (d, e) M+1base (i.e. nicotinyl ring 15N), (f, g) M+1amide and (h, i) M+2 labelled Nam in antibiotic (Abx) treated animals receiving (a, d, f, g) NMN1 (M+6), (b, e, g, i) NMN2 (M+7) and (c) unlabelled nicotinamide, as described in main Fig. 1, 5, and 6. Data are analysed by two-way ANOVA with Sidak’s multiple comparisons test.

(a) The two proposed mechanisms for NMN uptake are either directly through the putative NMN transporter SLC12A8, or indirectly by dephosphorylation into NR via the ecto-5’-nucleotidase CD73 which is present on the apical side of intestinal cells. To compare the contributions of either direct or indirect transport mechanisms, the contribution of isotope labelled NMN to the overall pool of each metabolite is shown for the intestinal tissue of the NMN2 cohort (data from Fig. 6). Error bars are s.d., each data point represents tissue from a separate animal.

(a) NMN (b) Nam (c) NAD+ (d) NR (e) Na (f) NaMN (g) NaAD (h) NaR. Standard curves were serially diluted from 50 µM to 0.39 µM. Shown here from 50 µM to 0.39 µM for all metabolites except for NR which is shown from 50 mM to 0.39 µM, due to the unexpectedly high concentrations of NR in the GIT (Fig. 1, 5, 6) and NaR from 100 µM to 0.39 µM.

Above chromatograms represent individual peaks (ion count) from 100µM standard solutions at each respective retention times for (a) NAM, NA, MeNAM, NAD+ and NAAD, (b) NAMN and NMN, (c) NAR and NR.
SUPPLEMENTARY METHODS
Synthesis of isotope labelled NMN
The isotopes used here were generated through a two-step process starting with the custom synthesis of nicotinamide labelled with 15N at the nitrogen base and amide positions. This custom isotope labelled version of nicotinamide was then used with [U5]-13C-ribose which was 13C labelled at all five carbon positions (Cambridge Isotope Laboratories, cat. no. CLM-3652) and ATP in an enzyme-based protocol using recombinant phosphoribosyl synthetase (PRS) and recombinant nicotinamide phosphoribosyl transferase (NAMPT) to synthesise NMN. The two enzymes were added into the reaction buffer that contains 1 mM ribose, 1 mM nicotinamide, 3 mM ATP, 1 mM dithiothreitol, 10 mM MgCl2 and 50 mM Tris-HCl (pH 7.5) and incubated at 37°C for 30 min. The reaction was terminated with the addition of 0.01% Trichloroacetic acid (TCA). The purification was proceeded with size-exclusion columns and ion exchange columns. Isotope labelled NMN samples of >95% purity were concentrated by lyophilization, and labelling confirmed by mass spectrometry (Supp. Fig. 2).
Animal experiments
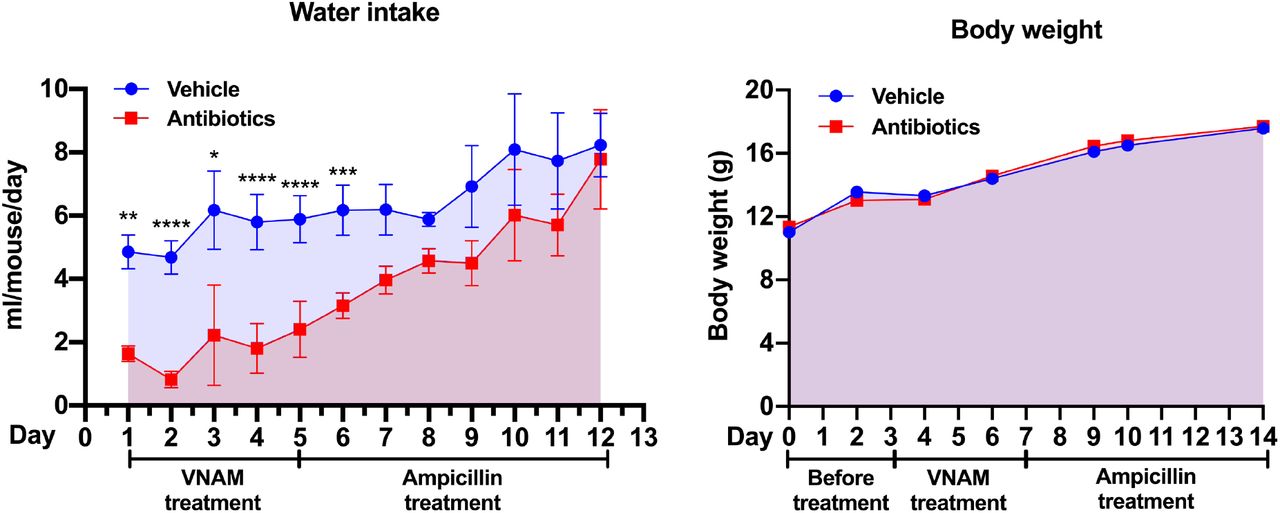
All experiments were performed according to procedures approved by UNSW Animal Care and Ethics Committee (ACEC) under ethics protocol 18/134A. The UNSW ACEC operates under the animal ethics guidelines from the National health and Medical Research Council (NHMRC) of Australia. Mice were fed standard chow ad libitum and housed under a 12-hr light/12-hr dark cycle in a temperature-controlled room (22 ± 1 °C) at 80% humidity in individually ventilated cages. Four-week old female C57BL/6J mice were acclimatised for one week prior to treatment and body weight matched before random assignment into groups. For antibiotic treatment, mice were administered a cocktail of antibiotics consisting of vancomycin (0.5 g/L; Sigma SBR00001), neomycin (1 g/L; Sigma N6386), ampicillin (1 g/L; Sigma A9393) and metronidazole (1 g/L; Sigma, M3761) (VNAM) with addition of sucrose (3 g/L; Bundaberg Sugar) to increase palatability for 4 days, and switched to ampicillin (1 g/L) with sucrose (3 g/L) for an additional week, which can reduce gut bacterial density by 1000-fold (Ubeda et al., 2010). During this treatment period there was a reduction in water consumption in the VNAM group (below), which was the reason for the switch to ampicillin alone.

To maintain consistency, this antibiotic treatment protocol was used for all in vivo experiments (Figs. 1, 5, 6). For NMN treatment, mice received a single oral gavage of NMN1 (Fig. 5) or NMN2 (Fig. 6) isotopes at 50 mg/kg, or for unlabelled NMN (Fig. 1) at 500 mg/kg, with water vehicle used as a control. Four hours later, animals were placed under anaesthesia, and blood was obtained by cardiac puncture, followed by euthanasia by cervical dislocation, and rapid dissection and snap freezing of tissues. Gavages were staggered by 5 mins between mice with alternating treatment groups to avoid any experimental bias. On the day of cull mice were all 5-6 weeks old. Differences in NMN dosing between unlabelled and isotope labelled NMN were due to limited availability of isotope labelled material.
Blood plasma collection and preparation for mass spectrometry
Approximately 1 mL of blood was collected via cardiac puncture in anaesthetised mice (1-2% isoflurane) into 1.5 mL eppendorf tubes prefilled with 10 µL of EDTA (0.5 M) and mixed thoroughly with a pipette to prevent clotting. Blood samples were then spun at 2000 g for 10 min and the top layer was transferred to a new tube and snap frozen immediately in liquid nitrogen. All samples were stored in −80°C until further processing. On the day of sample acquisition plasma samples were thawed on ice and 20 µL of plasma was added to 80 µL of extraction buffer (acetonitrile:methanol) with an internal standard mixture containing MES, CSA and thymine-d4. Samples were vortexed and centrifuged at 16,000g for 10 mins at 4°C and the supernatant was transferred to a new eppendorf tube and dried down completely using a speed vacuum concentrator (Savant SpeedVac ® SPD140DDA, Thermo Scientific). The resulting pellet was then resuspended in 30 µL of LC-MS-grade water and centrifuged as above and the supernatant analysed promptly by LC-MS.
Gastrointestinal and liver tissue collection and preparation for mass spectrometry
Intestinal contents (small intestine and colon without cecum) were resected and flushed with ice cold 1 x phosphate buffered saline (PBS) to clear faecal contents before snap freezing immediately with liquid nitrogen. Livers were resected and weighed before being rinsed in ice cold 1x PBS and snap frozen in liquid nitrogen. All tissue samples were stored in −80 °C until further processing. Frozen tissue samples were crushed using a mortar and pestle on liquid nitrogen and approximately 50 mg was weighed into tubes containing ceramic beads (Precellys, Bertin Technologies, France) to which 500 µl of cold (−30 °C) extraction buffer (acetonitrile:methanol:water, 2:2:1) with internal standard mixture as above was added. All samples were homogenised using an automated tissue homogeniser (Precellys24, Bertin Technologies, France) at 5,000-6,000 rpm for 15 seconds and immediately centrifuged at 16,000g for 10 mins at 4 °C. The supernatant was transferred to a new tube and dried down completely using a speed vacuum concentrator (Savant SpeedVac ® SPD140DDA, Thermo Scientific). All samples were resuspended in 50 µL of LC-MS-grade water, centrifuged as above and the supernatant analysed promptly by LC-MS.
Bacterial culture and NMN treatment
A stab culture of the E. coli strain OP50 was inoculated into sterile Luria-Bertani (LB) broth (10 g/L tryptone, 5 g/L yeast and 10 g/L sodium chloride in deionized water) under aseptic conditions and incubated overnight at 37°C on a shaking platform set at 200 rpm. To measure the growth rate of E. coli, the overnight culture was sub-cultured (1:200) into sterile LB broth in a new flask and the optical density was measured at 600 nm (OD600) every 20 minutes (approximate doubling time) and samples were collected during the early-mid exponential growth phase (OD600 < 0.70), as bacterial enzymes are more active during exponential growth phase than stationary phase (Rahman et al., 2006). For samples, the overnight culture was sub-cultured (1:200) and aliquoted into smaller volumes. The cultures were then supplemented with either vehicle (water) or M+6 labelled NMN (0.1 mM) and OD600 measured at time zero (before NMN), time zero (after NMN), and 140, 160 and 180 minutes after supplementation with NMN. The supernatant of cells was separated from the cells via centrifugation (5000 g for 10 minutes at 4°C) and stored immediately at −30°C. Meanwhile, the cell pellet was resuspended in cold (4°C) saline solution (0.9% NaCl) and centrifuged as above, to rinse away residual media before storage at −30°C. The OD600 was measured for each sample and used to normalise metabolite levels after LC-MS/MS analysis.
Primary hepatocyte culture
Primary hepatocytes were obtained as described previously (Chowdhury et al., 2016). Male Sprague Dawley rats (250 grams, Animal Resources Centre, Perth, WA, Australia) were maintained on a 12:12 h day-night cycle, with water and food supplied ad libitum. Under deep non-recoverable general anaesthesia (75 mg/kg ketamine, 10 mg/kg xylazine, intraperitoneal administration) rats underwent laparotomy. The portal vein was cannulated in situ and the liver perfused initially with carbogen-saturated perfusion media (final: NaCl 138 mM, HEPES 25 mM, D-glucose 5.6 mM, KCl 5.4 mM, Na2HPO4, 0.34 mM, KH2PO4 0.44 mM, NaHCO3 4.17 mM, EDTA 0.5 mM, pH 7.4, 37°C, 25 ml/min flow rate). The inferior vena cava was cut to allow efflux. After 4 mins, the carbogen-saturated perfusion media was changed to the collagenase containing buffer (final: NaCl 138 mM, HEPES 25 mM, D-glucose 5.6 mM, KCl 5.4 mM, Na2HPO4, 0.34 mM, KH2PO4 0.44 mM, NaHCO3 4.17 mM, CaCl2 2 mM, collagenase II (Sigma, 15950-017), pH 7.4, 37°C, 25 ml/min flow rate) for 6 mins. The inferior vena cava was clamped at least 10 times during the collagenase digestion (preventing efflux) resulting in liver swelling that allows a better digestion.
Following the collagenase digestion, the liver was removed and place on ice in 20 ml Williams’ Medium E (Life-technologies, Waltham, MA, USA). The hepatocytes were gently dispersed in the medium and the cells filtered through a 100 µm cell strainer. Hepatocytes were washed and diluted Williams’ Medium E and plated (6-well plates) at 106/2ml/well. After 4 hrs of incubation the culture medium was changed to MOPS buffer (final, NaCl 128 mM, MOPS 23.9 mM, KCl 6 mM, MgSO4.7H2O 1.18 mM, CalCl2 1.29 mM, glucose 5 mM, BSA (FFA) 0.2 %, pH 7.4) and cells incubated overnight. Following overnight incubation, cells were incubated in M199 media without glutamine (Sigma M2154), supplemented with either unlabelled (Sigma) or 15N-amide labelled glutamine (Cambridge Isotope Laboratories NLM-557) at 4 mM, in the presence or absence of NMN1 or NMN2 isotopes at 200 µM for 24 hr, following which samples were preserved for metabolomic analysis (Fig. 3).
Preparation of NAD+ metabolite standards
NAD+ metabolites were serially diluted starting from a concentration of 100 µM to 0.39 µM. The same volume (500 µL) of extraction buffer (acetonitrile:methanol:water) was added and vortexed before centrifuging and transferring to new tube ready to be dried down as above. The subsequent steps were the same as preparing the tissue samples as above. All standards and samples were processed on the same day to reduce any experimental bias or variability. Standard curves used to calculate absolute concentrations are shown in Supp. Fig. 10 and are available in supplementary raw data files.
Mass spectrometry
The LC-MS method was performed using 1260 Infinity LC System (Agilent) coupled to QTRAP 5500 (AB Sciex) mass spectrometer. LC separation by gradient elution was accomplished on an XBridge BEH amide column (100 mm x 2.1 mm, 3.5 µm particle size, Waters Corporation) at room temperature. For the mobile phase, Solvent A is 95%:5% H2O:acetonitrile containing 20 mM ammonium acetate and 20 mM acetic acid, and solvent B is acetonitrile. The flow rate was 200 µL/min, with the percentage of solvent B set at 85% (0 min), 85% (0.1 min), 70% (10 min), 15% (13 min), 15% (17 min), 85% (17.5 min), 85% (30 min) (Supplementary Table 1). Injection volume was 2.5 µL. Ion source was set at 350 °C and 4500 V with polarity switching. Mass isotopologues of metabolites were acquired by MS2, using the unscheduled multiple reaction monitoring (MRM) mode with a dwell time of 40 ms. The MS parameters (declustering potential, collision energy and cell exit potential) (Supplementary Table 2a) and MRM transitions were calibrated based on the monoisotopic mass of chemical standards (Supplementary Figure 11). Data processing was performed using MSConvert (version 3.0.18165-fd93202f5) and in-house MATLAB scripts. Deconvolution scripts were developed to resolve overlapping NAAD-NAD, NAR-NR and NAMN-NMN peaks using MATLAB’s Optimisation Toolbox. Representative chromatograms are shown in Supp. Fig. 11.
Statistical analysis for mass spectrometry
All data are presented as mean ± standard deviation (s.d.). Statistical significance was performed using a two-way ANOVA with a Sidak’s multiple comparisons test to determine differences between groups after removing outliers using the ROUT method (Q=1%). Data in Fig. 7 were analysed by Mann-Whitney U-test between NMN isotope treated groups due to the absence of detection of labelled metabolites in animals that did not receive NMN isotopes. All statistics were performed on GraphPad Prism software (version 8.2.1). P values less than 0.05 were considered statistically significant. All data analyses are available as an .xml file available on our Mendeley data site. For in vivo experiments (Fig. 1, 5-8, Supp. Fig. 4-7), each data point represents tissues from a separate animal, while each data point for in vitro experiments (Fig. 2, 3) represents an independent biological replicate.
DNA extraction from faecal pellets
Solid faecal pellets taken from the colonic and rectal region of the gastrointestinal tract were stored in −80°C until further processing. DNA was extracted from frozen faecal pellets using the QIAamp® PowerFecal® DNA kit (Qiagen, Cat. No. 12830-50) according to the manufacturer’s protocol. DNA concentration was determined using the NanoDrop™ (DeNovix®, DS-11 FX) and the purity of double-stranded DNA (dsDNA) was also determined by measuring the 260/280 ratio. All DNA extracts were stored at −80°C until further processing by 16S rRNA sequencing.
Nanopore 16S Sequencing
Full length 16S rRNA genes were amplified by PCR using the Oxford Nanopore 16S Barcoding Kit (SQK-RAB204; Oxford Nanopore Technologies, Oxford, UK). Briefly, 10 ng genomic DNA, 1 µL 16S Barcode (10 µM) and 25 µL LongAmp Taq 2X Master Mix (New England Biolabs, Ipswich, MA, USA) were combined in a 50 µL reaction for PCR on a Bio-Rad T100TM Thermal Cycler (Bio-Rad Laboratories Pty Ltd, Hercules, CA, USA). PCR cycling condition were as follows; initial denaturation at 95 °C for 1 minute, 25 cycles of denaturation at 95 °C for 20 seconds, annealing at 55 °C for 30 seconds and extension at 65 °C for 2 minutes before a final extension at 65 °C for 5 minutes. PCR products were purified as per Oxford Nanopore Technologies (ONT) protocol using AMPure XP magnetic beads (Beckman Coulter, Indianapolis, IN) and DNA quantified using the NanoDrop™ (DeNovix®, DS-11 FX). Barcodes were pooled to a total of 100 fmol in 10 μL of 10 mM Tris-HCl, pH 8.0 with 50 mM NaCl for library loading. Sequencing was performed using R9.4.1 ONT Flow Cells on the MinIONTM sequencing platform and data acquired using MinKNOW software version 19.10.1 (Oxford Nanopore Technologies).
Data Analysis for 16S sequencing
Full length 16S sequencing reads acquired from MinION runs (i.e. FAST5 data) were base-called to fastq files using Guppy software version 3.4.4 (Oxford Nanopore Technologies). Fastq files were demultiplexed using Porechop (https://github.com/rrwick/Porechop) and trimmed to 1400bp with Trimmomatic version 0.39 (Bolger et al., 2014). Reads were imported to QIIME2 for dereplication and chimeric reads screened and filtered from the dataset. Operational taxonomic unit clustering was completed within QIIME2 version 2019.7.0 (Bolyen et al., 2018) at 85% similarity to account for typical sequencing errors obtained from long-read sequencing. Taxonomy was assigned to reads using a pre-trained classifier on the SILVA 132 16S rRNA representative sequences. Data was imported into R version 3.6.1 with qiime2R version 0.99.13 (https://github.com/jbisanz/qiime2R) for visualisation and alpha diversity analysis using raw and rarefied data with the phyloseq version 1.30.0 (McMurdie and Holmes, 2013) package. Scripts for command line processing and analysis in R available in Supplementary Materials. Sequencing data has been deposited in the NCBI database Sequence Read Archive (SRA) under accession numbers PRJNA635359.
SUPPLEMENTARY TABLES
Buffer A: 95:5 (v/v) HPLC H2O:Acetonitrile (CH3CN) with 20 mM ammonium acetate (NH4OAc) + 20mM acetic acid (CH3COOH), pH 5. Buffer B: 100% Acetonitrile (CH3CN).
MRM transitions and MS parameters of NAD+ metabolites and MRM internal standards (Thymidine d4, CSA, MES). Q1: parent ion, Q3: fragment ion, MRM: multiple reaction monitoring, DP: declustering potential, CE: collision energy, CXP: collision cell exit potential.
Acknowledgements
Funding was from the National Health and Medical Research (NHMRC) of Australia as a Career Development Fellowship APP1122484 to LEW, and sponsored research from Jumpstart Fertility. We wish to thank anonymous donors for philanthropic support.
References


