

Abstract
DNA-assisted identification of historical remains requires the genetic analysis of highly degraded DNA, along with a comparison to DNA from known relatives. This can be achieved by targeting single nucleotide polymorphisms (SNPs) using a hybridization capture and next-generation sequencing approach suitable for degraded skeletal samples. In the present study, two SNP capture panels were designed to target ∼25,000 (25K) and ∼95,000 (95K) autosomal SNPs, respectively, to enable distant kinship estimation (up to 4th degree relatives). Low-coverage SNP data were successfully recovered from 14 skeletal elements 75 years postmortem, with captured DNA having mean insert sizes ranging from 32-170 bp across the 14 samples. SNP comparison with DNA from known family references was performed in the Parabon Fχ Forensic Analysis Platform, which utilizes a likelihood approach for kinship prediction that was optimized for low-coverage sequencing data with DNA damage. The 25K and 95K panels produced 15,000 and 42,000 SNPs on average, respectively allowing for accurate kinship prediction in 17 and 19 of the 21 pairwise comparisons. Whole genome sequencing was not able to produce sufficient SNP data for accurate kinship prediction, demonstrating that hybridization capture is necessary for historical samples. This study provides the groundwork for the expansion of research involving compromised samples to include SNP hybridization capture.
Author Summary Our study evaluates ancient DNA techniques involving SNP capture and Next-Generation Sequencing for use in forensic identification. We utilized bone samples from 14 sets of previously identified historical remains aged 70 years postmortem for low-coverage SNP genotyping and extended kinship analysis. We performed whole genome sequencing and hybridization capture with two SNP panels, one targeting ∼25,000 SNPs and the other targeting ∼95,000 SNPs, to assess SNP recovery and accuracy in kinship estimation. A genotype likelihood approach was utilized for SNP profiling of degraded DNA characterized by cytosine deamination typical of ancient and historical specimens. Family reference samples from known relatives up to 4th degree were genotyped using a SNP microarray. We then utilized the Parabon Fχ Forensic Analysis Platform to perform pairwise comparisons of all bone and reference samples for kinship prediction. The results showed that both capture panels facilitated accurate kinship prediction in more than 80% of the tested relationships without producing false positive matches (or adventitious hits), which were commonly observed in the whole genome sequencing comparisons. We demonstrate that SNP capture can be an effective method for genotyping of historical remains for distant kinship analysis with known relatives, which will support humanitarian efforts and forensic identification.
Introduction
Forensic laboratories are beginning to explore the use of large-scale single nucleotide polymorphism (SNP) panels for human identification in routine casework. The interrogation of a single-base target increases the likelihood of successful genotyping for degraded DNA samples, which is particularly beneficial for cases involving missing persons and historical remains with poor quality DNA. SNPs are known to have a low mutation rate making them valuable for distant kinship analysis (1), empowering kinship comparisons amongst distant relatives and facilitating the expansion of suitable references outside the immediate family members. This is of particular importance in decades-old cases, where generational gaps caused by deficient pedigrees and the passage of time may prevent closely-related references from being obtained.
Recent attention on SNPs in forensics has been primarily driven by the use of next-generation sequencing (NGS), which provides a means of generating massive amounts of data at one time for a large number of SNP loci. Commercially available NGS forensic kits, such as the ForenSeq DNA Signature Prep Kit (Verogen) and the Applied BioSystems Precision ID panels (Thermo Fisher Scientific), incorporate 100-200 SNPs for identity, phenotype and biogeographical ancestry inferences. Yet, the nature of DNA that can be recovered from severely compromised samples (e.g., fragmented, damaged, and low endogenous content) limits the applicability of these amplicon-based tools, and the small number of SNP markers impedes their use for distant kinship inference. To overcome these limitations of amplicon-based assays, Phillips et al. describe a custom SNP panel of ∼1200 SNPs designed for the challenging samples encountered in missing persons efforts (2,3). The International Commission on Missing Persons is working with QIAGEN (Hilden, Germany) to develop and validate this SNP panel as a QIAseq Targeted DNA Custom assay, which employs a single primer extension approach that is amenable to samples with reduced fragment length (<100 bp). This SNP kit will allow for direct comparisons between case samples and family references for distant kinship inference.
Alternatively, high-density genotyping arrays targeting up to a million or more SNPs have been used recently in cold cases to obtain genome-wide data from unknown crime scene samples for investigative genetic genealogy. Upload of these forensic profiles to publicly available genealogy DNA databases, such as GEDmatch (4) and FamilyTreeDNA (5), has facilitated new leads and identified suspects where other lines of investigation have been exhausted (e.g., (6-8)). SNP arrays have therefore provided the key to unlock genetic genealogy as a forensic investigative tool. However, while the SNP arrays utilized for genetic genealogy by direct-to-consumer (DTC) DNA testing companies have been used on a wide variety of forensic case samples, including bone (9), they require high quantities of intact human DNA (≥ 1 ng) and are sensitive to severe degradation and microbial contamination. Thus SNP arrays are not effective for highly degraded and/or environmentally challenged samples. For this reason, scientists are pursuing whole genome sequencing (WGS) as an alternative means to collect genome-wide SNP data from skeletal remains and other challenging samples. In one recently published study, WGS was utilized to generate SNP genotypes from unidentified human remains, providing information to help determine the identity of the unknown victim (10). The drawback to WGS is that it is expensive, especially when sequencing samples with a high percentage of microbial DNA that is co-extracted from the human bone, such as in historical cases and other unidentified skeletal remains (11). Scientists are now applying imputation methods (12-14) to produce complete genotypes from low coverage genomes in forensic cases (15).
Hybridization capture targeting the mitochondrial genome and small (∼1200) SNP sets for identity testing has been successfully applied to forensic casework, including degraded and chemically treated samples (16-19). Yet due to the time and cost involved in hybridization capture, this method is not widely used in forensic casework, which can largely be solved using routine short tandem repeat (STR) typing or SNP arrays for genetic genealogy. Therefore, hybridization capture is, at the time of writing, most often reserved for the poorest quality samples or for those cases involving historical remains. Much broader use of hybridization capture is seen within the field of ancient DNA (aDNA). Such archaeogenomic research has shown the ability to obtain SNP genotypes from aDNA samples using hybridization capture and demonstrated that such data can be used to establish relationships between individuals and groups of individuals (20-22). However, the methods involved in aDNA studies are not easily implemented within regulated forensic laboratories. For example, the SNP probes may be made in-house and are not commercially available, or the software used to perform data analysis is not available to external users. Consequently, the gains made within the field of aDNA to advance SNP capture from skeletal remains are not directly transferrable to forensic practitioners.
The goal of this study was to obtain thousands of SNPs from previously identified historical remains for kinship comparison to known references. Familial relationships ranging from parent/offspring to 4th degree relatives were represented in the 14 cases. The generation of SNP profiles used for this study was achieved via three methods: WGS and two levels of targeted SNP capture (∼25,000 SNPs and ∼95,000 SNPs). Kinship analysis was completed using the Parabon Fχ Forensic Analysis Platform (Parabon NanoLabs; Reston, Virginia) (23). An evaluation of the efficacy of the three SNP approaches to achieve strong kinship support was performed, which would ultimately aid in the identification of unidentified human remains.
Materials and Methods
Non-probative casework samples
Sample selection
Fourteen previously identified, non-probative skeletal samples from the Armed Forces Medical Examiner System’s Armed Forces DNA Identification Laboratory (AFMES-AFDIL) were selected for use in this study (Table 1). These specimens originated from a variety of case contexts, and all were approximately 70 years postmortem. Samples were selected based on the availability of family reference samples (FRS) for kinship comparison.
Sample information and laboratory processing procedures for 14 non-probative casework samples used in this study. Relationship information for 22 family reference samples (FRS) is also listed. Non-probative samples are divided into two sample sets for laboratory processing and sequencing. An example pedigree demonstrating familial relationships is presented in Figure S1.
DNA extraction and repair
DNA was extracted from fragments of bone ranging from 0.2-1.0 g. Samples were first powdered and demineralized overnight at 56°C in a buffer containing 0.5 M EDTA, 1% lauroylsarcosine and 100 µl of 20 mg/ml proteinase K. DNA purification was achieved using either an organic protocol or the QIAquick PCR Purification Kit (QIAGEN, Hilden, Germany) as described in (24). One extraction control (reagent blank; RB) was included in each set (RB1 for set 1 and RB2 for set 2). In one instance (sample 7), previously generated DNA extracts were combined prior to DNA repair due to low volumes in order to maximize the DNA input for downstream processing.
A DNA repair step was performed on all DNA extracts, including RBs, using the NEBNext FFPE DNA Repair Mix (New England BioLabs Inc, NEB; Ipswich MA). Purification of the repaired DNA extract was performed using the QIAGEN MinElute PCR Purification Kit, followed by elution in sterile Tris-EDTA [10 mM Tris, (pH 7.5) 0.1 mM EDTA]. DNA was quantified with the dsDNA High Sensitivity (HS) Assay Kit on the Qubit 2.0 or Qubit 3.0 Fluorometers (all Thermo Fisher Scientific, Waltham, MA) to determine input into NGS library preparation.
Library preparation
The KAPA Hyper Prep Kit (Roche Sequencing, Pleasanton, CA) was used for library preparation. To evaluate the success of the library and capture procedures, a positive control (PC) was initiated at the beginning of library preparation for each sample set (PC1 for set 1 and PC2 for set 2). Adapter ligation was completed using dual-indexed adapters (Integrated DNA Technologies, Coralville, IA) matching sequences used in the Illumina TruSeq HT kits at an adapter concentration of 15 μM. Ten cycles of PCR amplification were completed on a GeneAmp PCR System 9700 thermal cycler (Applied Biosystems, Foster City, CA) following the manufacturer’s recommendations. Samples were eluted in 25 µl of Tris-EDTA following bead-based cleanup. Libraries from all sample sets were quantified on the 2100 BioAnalyzer instrument with the Agilent DNA 7500 Kit (both Agilent Technologies, Santa Clara, CA).
25K and 95K SNP capture panels
Two custom SNP panels were designed to allow overlap with the Infinium CytoSNP-850K v1.1 BeadChip (Illumina, San Diego, CA) for extended kinship comparisons. The first panel contained 24,999 genomic SNPs (Table S1; referred to as the 25K SNP panel) and the second panel included 94,752 genomic SNPs (Table S2; referred to as the 95K SNP panel). A majority of the SNPs chosen were bi-allelic, and while not specifically targeted for their polymorphic status, smaller proportions were tri- and tetra-allelic (Table S3). Criteria for SNP target selection included likelihood to perform well for kinship (i.e. high minor allele frequency in all populations, low FST, and low linkage disequilibrium between SNPs), distribution across the genome, and the GC content of the surrounding genomic region (25-60%). The presence of candidate SNPs in commercially available microarray kits ensured kinship comparison could be performed with samples genotyped using microarray platforms (i.e. high quality FRS).
Hybridization capture of SNP panel targets
Hybridization capture of the 25K and 95K SNP panel targets was facilitated by myBaits Custom DNA-Seq kits (Arbor Biosciences, Ann Arbor, MI). Bait design for the 25K panel consisted of four baits per SNP (100,000 unique RNA baits) and the 95K SNP panel was designed with one or two baits per SNP (180,000 unique RNA baits). The hybridization conditions followed the manufacturer’s recommended protocol (25) with a 24-hour hybridization at 65°C using a Veriti thermal cycler (Thermo Fisher Scientific). An attempt was made to target the maximum recommended DNA input into capture (500 ng). For some samples, capture input was reduced for the 95K panel due to lack of remaining library (Table S4). The captured product was split into two portions and both portions were amplified independently for 19 PCR cycles with KAPA HiFi HotStart ReadyMix (Roche Sequencing). The two amplified capture products for each sample were combined and purified with the MinElute PCR Purification Kit, eluting in 25 µl of Tris-EDTA. Purified capture product was quantified using the 2100 BioAnalyzer instrument with the Agilent DNA 7500 Kit.
Library pooling and sequencing
Each sample set was sequenced separately by pooling an equal volume of captured libraries within the set (excluding the PC). The PCs were not sequenced, as previous studies have shown sequencing of PCs with low quality samples can cause instrument crosstalk and complicate data interpretation (17,26,27). Pool molarity was determined using the Agilent DNA 7500 Kit on the 2100 BioAnalyzer instrument. Pools were loaded for sequencing at 10 pM and spiked with PhiX Sequencing Control v3 (Illumina) at a 2.5% concentration. Sequencing was performed on a MiSeq FGx Forensic Genomic System (Verogen, San Diego, CA) in Research Use Only mode. Paired-end sequencing was completed using 300-cycle MiSeq Reagent Kits v2 (Illumina; 2 x 150 cycles).
WGS was also performed using the same libraries as those enriched using hybridization capture. Libraries for WGS were individually normalized to 2 nM and pooled in equimolar concentration. For the MiSeq runs, the pools were diluted to 10 pM and prepared for sequencing with 2.5% PhiX as described above. Paired-end sequencing was completed using MiSeq v2 Reagent Kits (300-cycle; 2 x 150) on a MiSeq FGx in Research Use Only mode.
Four libraries (95K capture products and WGS libraries for both samples 2 and 5) were sequenced using the Illumina NextSeq 550 in two sequencing runs. Pools were generated as described for the 95K and WGS libraries. The pools were loaded at 1.45 pM (80% of the manufacturer’s 1.8 pM recommended loading concentration) with 1% PhiX control spiked-in as a sequencing control. Paired-end sequencing was completed using NextSeq 500/550 300-cycle High-Output Kits v 2.5 (Illumina; 2 x 150 cycles). High-Output kits sequenced on the NextSeq allow for over 25 times more sequence data to be generated compared to MiSeq v2 sequencing (800M versus 30M paired reads, respectively).
Microarray genotyping
DNA extracts from two additional samples were sent to AKESOgen (Peachtree Corners, GA), a CLIA-certified sequencing laboratory, for microarray genotyping with the Illumina Infinium CytoSNP-850K v1.1 BeadChip. Both unrepaired and repaired DNA extracts were tested using two genotyping protocols. Genotyping was halted after the first four samples failed to generate any usable data (genotyping call rate <50%). A summary of these results is available in Table S5, but no further discussion will be provided below due to the poor quality of the genotyping data.
Family reference samples
Sample selection and DNA extraction
A total of 22 FRS were selected for use in this study based on known relationships to the previously identified case samples (Table 1). An additional 17 FRS with no relation to the case samples were also genotyped, totaling 39 FRS for comparison. All FRS donors provided informed consent for samples to be used in research and quality improvement activities. Reference specimens were saliva samples deposited on either Bode buccal collectors or cotton buccal swabs. The QIAamp DNA Investigator Kit (QIAGEN) was employed for DNA extraction following one of two manufacturer protocols: isolation of total DNA from FTA and Guthrie cards using two punches from Bode buccal collectors, or isolation of total DNA from surface and buccal swabs using one buccal swab. The final elution volume for all samples was 100 µl of Tris-EDTA. DNA was quantified using both the Qubit dsDNA HS Assay Kit on the Qubit 3.0 Fluorometer and the Plexor HY DNA Quantification Kit (Promega Corporation, Madison, WI) prior to submission for microarray genotyping.
Microarray genotyping
FRS were genotyped at AKESOgen using the Infinium CytoSNP-850K v1.1 BeadChip. Genotypes were called using the GenomeStudio Software (Illumina) and the data were reviewed prior uploaded to the Parabon Fχ Forensic Analysis Platform for analysis.
Data analysis
Non-probative case samples
Demultiplexed FASTQ files were generated from the raw data by the MiSeq Reporter software (Illumina) and imported into the Parabon Fχ Forensic Analysis Platform. Reads were aligned to the human reference genome (GRCh38), and duplicate mapped reads were removed. Alignment parameters included penalties for mismatches (4), open gaps (6), extension gaps (1) and unpaired reads (9). Minimum map and base qualities were not required (i.e. set to 0) in order to allow for the maximum number of called SNPs, which are assessed using a probabilistic approach. Specifically, the software implements a genotype likelihood approach for each locus under investigation, which facilitates the use of low coverage SNPs (≥ 1X) and maximizes the use of available information (28). In short, the likelihood of the data under the hypothesis of each possible genotype is calculated given factors such as the number of reads per allele and sequencing quality score. This approach increases the probative power of the analysis and avoids potentially erroneous genotype calls generated using an absolute calling threshold. To account for the effects of DNA damage typical of ancient and historical remains, cytosine deamination was assessed at the time of alignment (29,30). This assessment is performed utilizing a different mapping (than the original alignment described above) as the read pairs are merged and aligned to the GRCh38 as single-end reads. This allows for estimation of the mismatch rate at the end of the fragments, specifically cytosine to thymine error on the 5’ end and guanine to adenine error on the 3’ end, which are indicative of cytosine deamination (29,30). Based upon this assessment (e.g., Figure S2), the user has the option to correct for the observed damage. In addition to the use of the merged-pair mapping, the position within the fragment is incorporated into the likelihood calculations when generating the SNP profile when the damage correction option is selected. SNP genotype likelihood profiles were generated for each captured SNP set using read depth thresholds of 1X, 5X and 10X. Though no enrichment was performed, WGS data were analyzed for the 843,223 SNPs present on the Infinium CytoSNP-850K BeadChip at the 1X, 5X and 10X thresholds. All SNP genotype likelihood profiles were generated with and without damage correction.
Ancestry inference was performed in Fχ for both the unknown and reference samples, which was then used along with self-reported race (for the FRS donors) to determine the appropriate population allele frequency file for kinship calculations. Due to the large number of SNPs recovered in the FRS microarray data, ancestry prediction was possible for seven well-defined global population groups (31). Five populations are represented in the ancestry prediction for the sequenced (WGS and captured) samples, based on the 1000 Genomes Project (32). The Parabon Fχ Forensic Analysis Platform estimates pairwise relatedness using the likelihood formulas derived in (33), adapted for the scenario of testing a specific set of kinship hypotheses by comparing genotype likelihoods to called genotypes from a reference sample. This approach takes into account all possible genotypes for the captured sample, as well as the genotype frequencies of the selected population. Kinship prediction was performed against the entire FRS dataset (Figure S3), and log likelihoods were calculated within the software for each degree of relatedness (DOR) up to 4th degree (from self/monozygotic twin, parent-offspring, full sibling, 2nd degree, 3rd degree, and 4th degree) as well as unrelated. Likelihood ratios (LRs) were generated within the software for the most likely DOR compared to the unrelated category. LRs over 10,000 were considered strong evidence of relatedness, based on previously established forensic guidelines (34).
Family reference samples
FRS SNP genotypes were evaluated for genotyping call rate (i.e. the proportion of SNPs with called genotypes), and those below 70% were removed from further analysis. The remaining FRS SNP genotypes were loaded into the Parabon Fχ software, and each sample’s ancestry proportions were estimated. In addition to kinship comparisons with the case samples, kinship between each FRS pair was predicted and compared to the expected relationships.
Results
Non-probative casework sample assessment
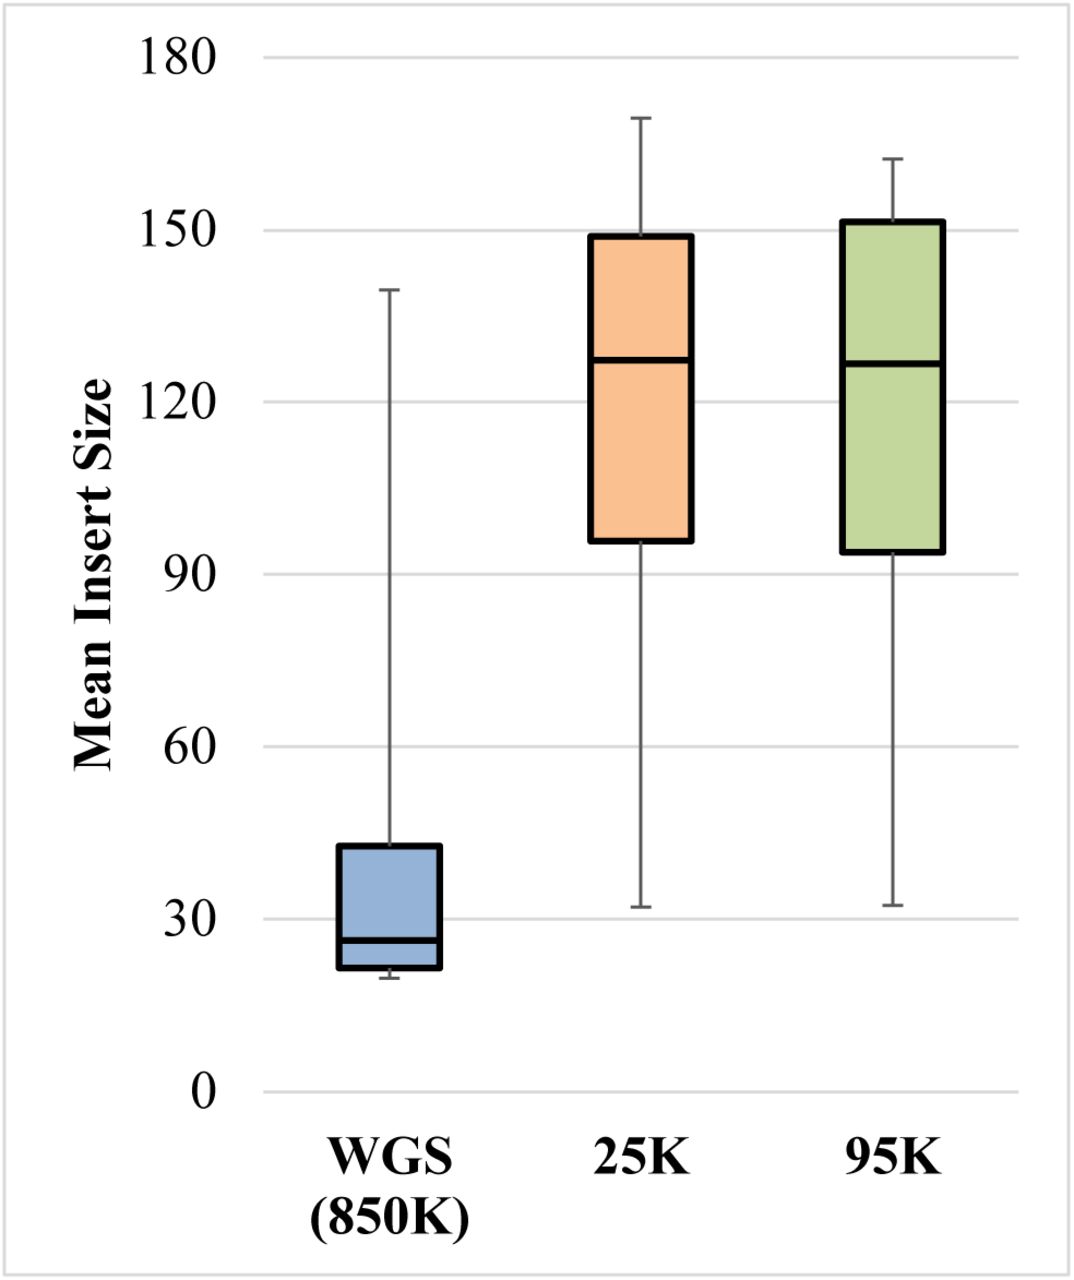
A total of 16 libraries were prepared and sequenced: 14 bone samples and two RBs. Sequence data for all three SNP approaches (i.e. WGS, 25K, and 95K) were generated from each of the 16 libraries. Metrics for each of the nine sequencing runs can be found in Table S6, and alignment and mapping metrics for all samples are presented in Table S7. Average DNA fragment length (or mean insert size in Table S7) was only 40 bp in the WGS data, ranging from 20-140 bp across the 14 case samples (Figure 1). However, the mean insert size after capture was considerably larger, averaging ∼120 bp in the 25K and 95K data. The reason for this discrepancy is likely due to non-specific mapping of off-target, short reads between 20-25 bp. These short reads are visible in the fragment length distributions as high peaks that break with the unimodal distribution of the remaining mapped DNA that is larger in size (Figure 2). Typically, reads <30 bp are excluded from sequence alignments in aDNA research (e.g., (35)), which minimizes the proportion of off-target read mapping. Such short read filtering may also be required for forensic casework involving degraded DNA, and this parameter can be incorporated into future versions of the Parabon Fχ software. The observed short read peaks are much more pronounced in the WGS data than in the capture data, likely due to the effect of targeted enrichment on the proportion of off-target reads causing the non-specific mapping. Therefore the mean insert size indicated in the capture data is likely more accurate to the authentic human DNA present in the case samples, with an average of ∼120 bp. The capture data furthermore show that the fragment length distributions vary by sample, as sample 3 (Figure 2a) has a maximum fragment length exceeding 400 bp, while sample 11 (Figure 2c) contains endogenous human DNA that is altogether <100 bp in length. Despite the skewed fragment length distribution due to the non-specific mapping of off-target short reads, particularly in the WGS data, these samples were shown to exhibit considerable DNA degradation consistent with expectations from ancient and historical remains.

Distribution of the mean insert size of reads mapped to the human genome (GRCh38) across the three SNP sequencing approaches: whole genome sequencing (WGS), 25K SNP capture, and 95K SNP capture.

Fragment length (insert size) distribution for three exemplary samples using whole genome sequencing (WGS), 25K and 95K capture. Samples represent the range of quality observed in this study: a) sample 3, b) sample 1, and c) sample 11. Note the difference in scale between samples for both the x and y axes. Peaks at 20-25 bp are likely due to non-specific mapping of off-target reads.
Despite the inclusion of short, off-target reads in the mapped sequence data that considerably impacted the WGS results by inflating the mapped proportion, the percent of total reads mapped to GRCh38 still increased after capture (25K or 95K) (Figure 3). Therefore capture increased the percent of endogenous human DNA in the library, indicating successful enrichment of the human SNP targets. Regardless of the improvement in endogenous DNA content, the proportion of human DNA in the library after capture remained less than 50% for a majority of the samples (8 out of 14). In other words, even after capture to enrich for human SNPs, many of the historical bone samples tested here contained more environmental DNA than human DNA in the sequenced libraries. To increase the endogenous human DNA proportion, a second round of capture can be performed. However, this adds time and expense to the procedure and should be considered on a case-by-case basis.
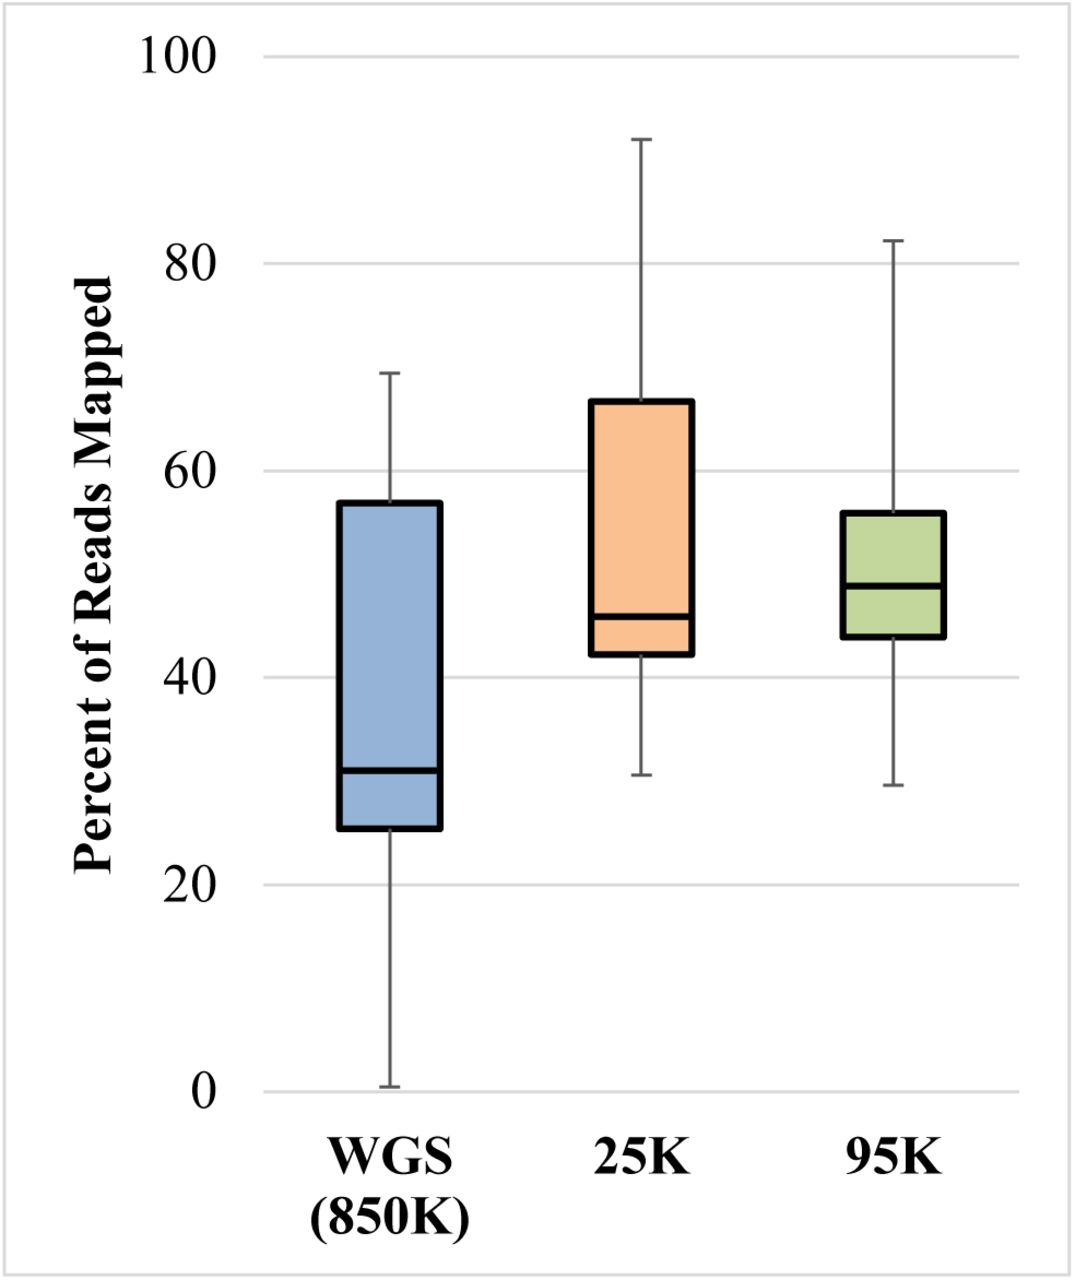
Distribution of the percent of reads mapped to the human genome (GRCh38) across the three SNP sequencing approaches: whole genome sequencing (WGS), 25K SNP capture, and 95K SNP capture.
The generally poor quality of the samples tested in this study is typical of specimens submitted to the AFMES-AFDIL for DNA testing (11,17,36), and likely explains the failed microarray testing. Though other, higher quality forensic casework samples may be amenable to microarray testing (9), severely compromised samples such as those from decades-old missing persons cases may necessitate alternative genotyping methods for SNP recovery such as hybridization capture.
Overall, WGS on the MiSeq was unable to produce adequate coverage of the “targeted” CytoSNP-850K BeadChip SNPs. The percentage of unique reads mapped to the human genome in the WGS data averaged 38.5%, but it ranged considerably between samples (0.49%-68.7%). Sample 14 was an obvious outlier, with only 0.49% of the unique reads mapped to the human genome, whereas the next-lowest sample had 22.9% unique reads that mapped to the human genome. Thus, degree of clonality (i.e. quantity of PCR duplicates) in each sequenced library varied by sample. Despite high read counts with an average of over 1.4 million unique reads in the MiSeq WGS data, only ∼11,000 of these reads on average covered the ∼850,000 SNP targets investigated (0.32%). Approximately 4,000 SNPs on average were covered in each sample at a 1X threshold (0.47%; Figure 4). SNP recovery after WGS on the MiSeq further decreased when damage correction was applied, leaving only one sample with >1,000 SNPs covered (sample 9). The two WGS libraries sequenced on the NextSeq generated significantly more data than those sequenced on the MiSeq. Over 1.1 million WGS reads covered the CytoSNP-850K BeadChip SNPs, and more than 230,000 SNPs were reported for each of the samples sequenced on this higher throughput sequencing platform (Table S7). It is important to note, however, that these samples (2 and 5) represent two of the best performing samples tested in this study. Since these two libraries lacked MiSeq WGS data for comparison, the percent increase in SNP yield when going from a lower throughput to higher throughput sequencer cannot be determined. Regardless, the WGS data, when produced either from a MiSeq or a NextSeq instrument, were insufficient for accurate kinship prediction (discussed below).

Number of SNPs recovered at ≥1X when 14 non-probative sample libraries were sequenced on the MiSeq. WGS libraries for samples 2 and 5 were only sequenced on the NextSeq and are not shown due to scale (281,346 SNPs and 230,616 SNPs, respectively).
Nearly all samples demonstrated an increase in the proportion of reads mapped to targeted SNPs when hybridization capture was performed. The capture data resulted in an average of 4.1% and 4.5% of unique reads covering targeted SNPs in the 25K and 95K panels for an average of over 15,000 and 43,000 SNPs, respectively. Though low, the percentage of unique reads on target in the capture data represent more than a 12-fold increase from the WGS data (0.3%). On an individual sample basis, the SNP capture panels outperformed WGS in regards to overall SNP recovery in all but one sample (sample 11, Figure 4). Sample 11 consistently performed poorly after capture using both panels, generating 159 SNPs from the 25K panel and 625 SNPs from the 95K panel. Presumably, the relative failure of sample 11 is a consequence of the high degree of DNA degradation present as the mean insert size was only 32 bp in the capture data, the smallest of all the samples tested (Figure 2c; Table S7).
When comparing the performance of the 25K and the 95K panels, the raw number of SNPs recovered was greater using the 95K panel in 13 of 14 samples (92.9%). Moreover, ten of the 14 samples (71.4%) produced more than 25,000 SNPs when the 95K assay was used for capture, which is the maximum number of SNPs that could be achieved with the smaller 25K panel. One sample (4) produced fewer SNPs using the 95K capture assay when compared to the 25K capture assay; however, this can be attributed to the reduced DNA input for the 95K capture reaction due to insufficient remaining library volume, rather than panel performance. It is expected that had the maximum library input into capture been attained, increased SNP recovery would have been observed.
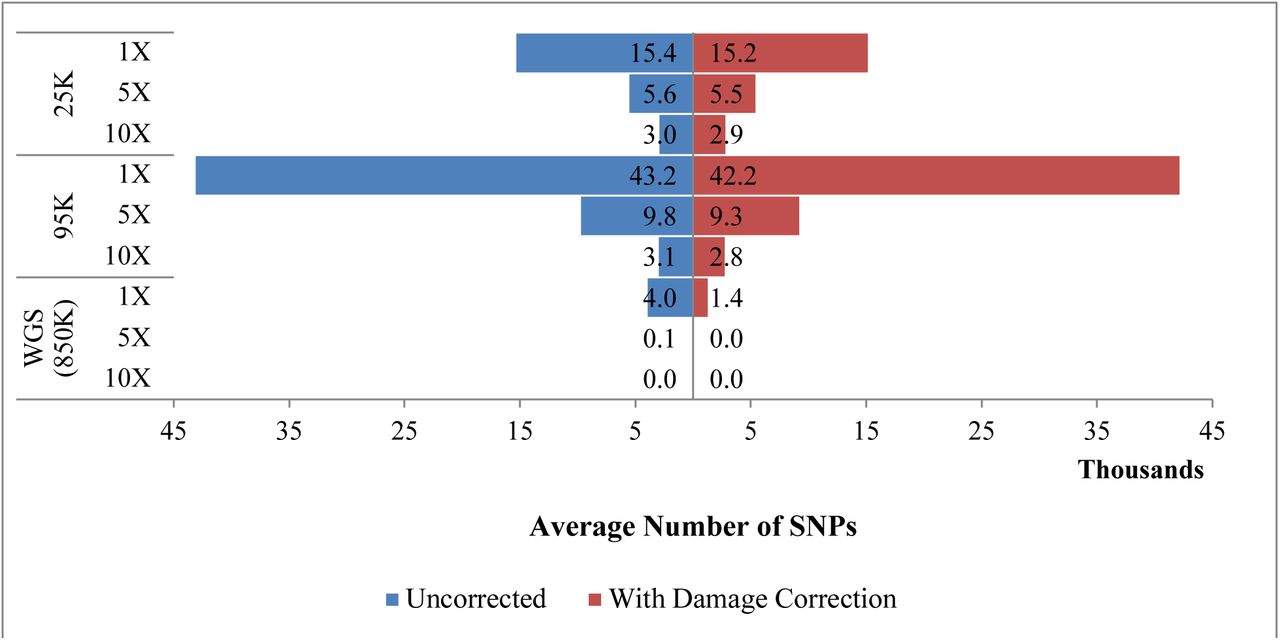
When the coverage threshold was increased from 1X to 5X, the average number of SNPs decreased by more than 60% in the 25K dataset and by 75% in the 95K dataset (Figure 5). When the coverage threshold was increased to 10X, the usable data were decreased by approximately 80-90% in both SNP panels, to approximately 3,000 SNPs. Few, if any, SNPs were obtained in the WGS data when the coverage threshold exceeded 1X.
Average number of SNPs recovered for 14 skeletal samples, both with and without damage correction, using coverage thresholds of 1X, 5X and 10X. Only samples that were sequenced on the MiSeq are included in this comparison.
Incorporation of damage correction resulted in fewer SNPs above the specified coverage thresholds across all SNP approaches. In the merged-pair alignment, which is utilized when damage correction is applied, coverage may be reduced because merged reads with low alignment scores are removed and/or larger fragments fail to merge and thus will not be mapped. Despite this reduction, damage correction is likely to be beneficial for kinship prediction for low quality samples as the modified alignment and genotype likelihood scores take into account DNA damage in order to improve the accuracy of the SNP profile. Even with the applied damage correction, SNP capture successfully generated more than 10,000 SNPs for 82.1% of the non-probative sample libraries (23 of 28) sequenced on the MiSeq (Table S7).
The two captured libraries sequenced on both the NextSeq and MiSeq (95K libraries for samples 2 and 5) yielded a similar percentage of mapped reads on both instruments, yet much smaller proportions were unique in the NextSeq data (Table S7; <21% for the NextSeq and >49% for the MiSeq). Although a majority of the sequencing capacity of the NextSeq is consumed by PCR duplicates, the raw number of unique reads and SNP coverage per sample increased substantially. Therefore, sequencing on a higher throughput instrument may be beneficial for some samples with reduced SNP recovery.
Microarray genotyping of family reference samples (FRS)
DNA quantities for FRS extracts were comparable across quantification methods (Table S8), averaging 1.75 ng/µl for Plexor HY and 1.70 ng/µl for Qubit HS. Overall, 35 of 39 (89.7%) FRS tested were successfully genotyped, yielding SNP call rates >96%. FRS 13-A demonstrated a moderate call rate (74%) but was still utilized in ancestry and kinship estimation. The three FRS with call rates <70% were not included in ancestry or kinship analysis. These four reference samples with call rates <96% yielded the lowest values using the Plexor HY DNA Quantification Kit (<210 pg/µl), indicating human DNA quantities below the recommended input for genotyping arrays. While not performed for this study, it is feasible that FRS could undergo SNP capture following DNA fragmentation and library preparation in order to obtain sufficient reference data. This would allow laboratories to implement a single processing method for SNP genotyping (i.e. capture) for all sample types. Fχ offers capture-to-capture kinship analysis in addition to the capture-to-microarray analysis used for this study.
Parabon Fχ ancestry prediction
Ancestry prediction was performed on the case samples and the FRS within the Fχ software using iAdmix (37), leveraging all reads mapping to targeted SNPs. Ancestry estimates for the 36 FRS with sufficient call rates were determined to be European (Figure S4), consistent with the self-reported race provided. The ancestry of the known references was also used as a basis for the expected ancestry of the non-probative case samples. For all 25K and 95K captured samples, the ancestry predicted by Fχ was European (Figures S6 and S7), consistent with the expected ancestry. However, inconsistent ancestry prediction was obtained in five of 14 WGS samples (Figure S5). In one WGS sample, no ancestry prediction was able to be performed due to no reads being present at the 850K targeted SNPs. Inaccurate ancestry predictions, such as those obtained by the WGS data in this study, could potentially be attributed to bias resulting from few SNPs recovered. Since allele frequencies of the 850K targeted SNPs can vary substantially between population groups, failure to account for population differences in allele frequencies can impact the accuracy of kinship comparisons (38). It is important to note that this study only investigated kinship between individuals of European descent. Expansion of the populations tested, to include individuals of mixed race/ancestry, is needed in future research and validation efforts.
Parabon Fχ kinship prediction
The European allele frequency file was chosen for kinship estimation in all comparisons based on the European ancestry predictions obtained from both the FRS and the SNP capture data of the non-probative case samples. Even though the WGS data did not indicate European ancestry for all samples, the European allele frequency file was chosen since this was the expected ancestry in each instance. Since the majority of the targeted SNPs did not achieve a read depth of 5X or above, kinship comparisons were only performed using the 1X profiles. Kinship comparisons between the non-probative case samples and FRS are presented in Table 2 (21 related FRS) and Table S9 (15 unrelated FRS).
Likelihood ratios (LRs) were calculated for the highest predicted degree of relatedness (DOR) between each unknown and 21 family reference samples (FRS) compared to the two samples being unrelated. LRs greater than 1E+308 were reported as 1E(log LR) due to computational limitations. FRS 6-A, a relative of sample 6, failed genotyping and was excluded from kinship analysis. The remaining 15 unrelated FRS (excluding two failed FRS, 20-A and 21-A) were compared with the unknown samples and are presented in Table S9. Kinship was assessed with and without damage correction (DC) of the unknown genotypes. Analysis was performed with data generated from WGS analyzed for 850K SNP targets (3a and 3b) as well as hybridization capture for the 25K (3c and 3d) and 95K (3e and 3f) panels. Samples are organized horizontally by DOR from closest to furthest (up to 4th degree). LRs above the 10,000 threshold are bolded; true relatives to each sample are designated by a thick border. P/O = Parent/offspring; FS = Full Sibling. Sample 14-WGS yielded no reads at targeted SNPs and was not able to be compared (represented by grey boxes). Color indicates the degree of relatedness with the highest likelihood. Self = purple; P/O = yellow; FS = green; 2nd degree = orange; 3rd degree = blue; 4th degree = pink; unrelated = white
Analysis of the full 850K SNPs from the WGS data yielded few samples in which the relative and DOR were correctly predicted (Tables 2a and 2b). Only one of the 14 (7.1%) samples was predicted to be related to its true FRS at the expected DOR, while also excluding adventitious relationships to other FRS. Eight of the remaining 13 samples had adventitious hits to incorrect FRS, totaling 91 adventitious hits overall (Table 2a; Table S9). When damage correction was applied, 98.9% (90 of 91) of the adventitious hits with LRs >10,000 were removed and an additional case sample was successfully associated to its FRS. Furthermore, after damage correction the two WGS samples sequenced on the NextSeq (samples 2 and 5) enabled the correct FRS to be predicted with strong support (LR>10,000), though the DOR was inaccurate. Therefore four of 14 (28.5%) samples produced the correct relative after damage correction of WGS data, yet only two of 14 samples (14.2%) produced sufficient SNPs for precise kinship prediction indicating both the correct relative and DOR. Damage-corrected profiles produced false negative results in 68% of the 19 pairwise comparisons with known relatives, in that samples and their known relatives were not predicted to be related. Of the 13 false negative results, four (30%) had LRs of 1, including three 4th degree relationships and one of the 3rd degree relationships. The remaining nine of 13 false negatives had LRs between 1 and 10,000, indicating only weak support of relatedness. In seven of these nine samples with weak support for the predicted relationship (LR <10,000), the correct relative had the highest LR across all FRS. Altogether, poor quality WGS samples were shown here to yield weak or false negative results. A WGS approach to SNP genotyping may be sufficient for higher quality historical samples sequenced on a high throughput instrument such as the NextSeq. However, the majority (71.5%) of the skeletal remains tested here failed to generate sufficient data with WGS in order to predict the correct FRS with strong statistical support.
By contrast, in the 25K SNP panel uncorrected and damage-corrected data, 17 of the 21 (81.0%) FRS were correctly predicted to be related to the corresponding case sample with LRs exceeding 10,000 (Tables 2c and 2d). Of these, only two of the 17 were associated to the correct FRS with the incorrect DOR. In other words, precise kinship estimation was possible for more than 70% of the 25K capture samples (15 of 21), regardless of DNA damage correction. The other four of 21 FRS were correctly predicted to be related to the corresponding case sample from the 25K results, but below the 10,000 LR threshold needed to demonstrate strong statistical support for relatedness. The uncorrected 95K data accurately predicted 18 relationships (85.7%), and the application of damage correction to the 95K data further increased the accuracy to 19 of 21 (90.5%) comparisons (Tables 2e and 2f). But again, two of the relationships in the 95K data had incorrectly predicted DOR. The precise kinship prediction rate from the 95K data, in which the related FRS and DOR were accurately predicted, was then 81.0% (17 of 21) of pairwise comparisons. The increased SNP recovery of the 95K panel permitted improved kinship inferences over the 25K panel, producing strong LR values for some of the pairwise comparisons in which the 25K samples yielded LRs below the 10,000 LR threshold. For example, the 95K panel resulted in a kinship association of one set of 4th degree relatives with an LR >10,000 that was not achieved with the 25K panel. Together the 25K and 95K capture data produced zero false positive relationships with LRs >10,000 in all 2,016 pairwise comparisons tested (504 per condition, excluding RBs). This includes pairwise comparisons with FRS that were unrelated to all case samples (Table S9).
As noted above, two of the kinship comparisons (sample 2 / FRS 2-B and sample 13 / FRS 13-A) predicted the correct FRS to be related but the DOR was incorrect. This result was obtained for these two comparisons regardless of the SNP capture profile conditions (25K and 95K panels as well as uncorrected and damage-corrected data). In both cases, the predicted DOR was one degree more distant than the expected relationship. The LRs obtained for these incorrect relationships were exceptionally high (averaging 8.17 × 1088 for sample 2 and FRS 2-B, and 9.99 × 10126 for sample 13 and FRS 13-A). Additionally, samples 2 and 13 both generated sufficient SNP coverage (>24,000 and >13,000 SNPs, respectively, for each of the two panels). In the case of sample 2, FRS 2-B was expected to be a grand-niece (3rd degree relative) of sample 2 but was predicted as a 4th degree relative (e.g., great-grand-niece or first cousin once removed). An incorrect classification of a 3rd degree relative is not unexpected, as the transmission of genetic material is random, and there is variation in the proportion of DNA sharing within pairs of individuals of the same DOR (38). Sample 2 obtained high LRs (averaging 1.31 × 10224) for the correct DOR (3rd degree) with its other FRS included in the study (FRS 2-A). Moreover, the relationship predicted between FRS 2-A and FRS 2-B was 3rd degree, which is consistent with the reported relationship (first cousins) of the two FRS donors (Figure S8). Since the relationships between the sample 2 and FRS 2-A as well as the two FRS were predicted correctly, it is likely that the more distant DOR predicted for sample 2 and FRS 2-B may be the result of low allele sharing in the SNPs recovered rather than an issue with the genealogical record. By contrast, the reason for the incorrect DOR predicted for sample 13 was likely the reduced genotyping call rate of FRS 13-A (74%). In fact, the poorer quality data for FRS 13-A also led to seven adventitious hits to unrelated case samples in the WGS data (Table 2a). It is therefore possible that a genotyping success threshold (e.g., >96%) should be established for FRS microarray data to permit reliable kinship estimation.
Analysis of control samples
Positive controls and RBs were included in each of the sample sets to monitor the library preparation and the SNP capture assays. Although the PCs were not sequenced, they were assessed during several quantification steps for library product as a quality control assessment. RBs were sequenced with unknown samples and analyzed to measure levels of background noise as well as check for possible contamination. Kinship was compared between the RBs and the FRS. Five of the six RB libraries were determined to be clean, with fewer than 100 SNPs covered at the 1X threshold (Table S7), and no SNPs were recovered from any of the RBs at the 5X or 10X thresholds. The 25K captured product of RB1 generated 1,608 SNPs at 1X and required additional investigation. Few SNPs were attributed to RB1 in the 95K and WGS data, indicating a lack of human DNA present and suggesting that the library was not contaminated. It is unlikely that contamination would occur during the capture step of the laboratory procedure, as samples have already been indexed during library preparation. Examination of the BioAnalyzer trace for RB1 showed a high adapter peak with no distinguishable capture product (Figure S9), providing additional support to the conclusion that RB1 is clean. Therefore, sequencing crosstalk is the most probable explanation for the reads attributed to RB1 in the 25K data (17,26,27).
To further investigate the likelihood of crosstalk, a capture-to-capture kinship comparison was performed between the RBs and the unknown samples (Table S10). Matches were obtained between sample 2 and two RBs (RB1-25K and RB2-WGS) with LRs above 10,000 in the uncorrected data; though, no match was observed once damage correction was applied. The damage-corrected profile for RB1-25K matched sample 5 with a LR of 5.23 × 1035, indicating that the sequencing crosstalk likely came from this sample. Sample 5-25K and RB1-25K were run together on the MiSeq instrument. Crosstalk may have been caused by the high cluster density of this MiSeq run (Table S6) coupled with the sequence similarity between the indexes used for RB1 and sample 5 during library preparation (Table S11). A contaminated RB from suspected crosstalk could be resequenced with alternate samples to demonstrate the lack of contamination in the library. However, in routine practice it may be more effective to introduce an analytical threshold for RBs and samples to overcome low coverage background data introduced by minimally multiplexed sequencing of captured samples and associated RBs with high adapter dimers. In this particular instance of likely crosstalk, the total number of SNPs covered in the RB was only 6.4% of the number of SNPs attempted (1608 out of 24,999). Thus, the fractional SNP coverage was low in RB1. Only one case sample (11) dropped below this fractional coverage metric with 0.64% of SNPs covered at 1X in the 25K data, and it correspondingly failed to produce accurate kinship results with strong statistical support using this capture assay. Therefore, it may be worthwhile to evaluate fractional SNP coverage as an analytical threshold of 1X data, perhaps coverage of at least 10% of the SNPs targeted. Despite the fractional coverage in RB1 for the 25K sample set, none of the RBs matched to any of the FRS above the set LR>10,000 threshold under any of the conditions analyzed (Table S10).
Discussion
This study demonstrates that adequate SNP data can reliably be obtained from aged skeletal samples by employing hybridization capture followed by NGS. The SNP recovery in combination with the Parabon Fχ Forensic Analysis Platform were sufficient to permit accurate distant kinship predictions between severely degraded bone samples and known relatives. Though microarray testing will be successful for many forensic-type samples, DNA degradation combined with low endogenous DNA content render aged skeletal remains recalcitrant to this traditional genotyping method. Also, as demonstrated in this study, reference samples may fail to generate reliable microarray data and thus require alternative genotyping methods due to lower DNA quality/quantity. Hybridization capture can be combined with a fragmenting library preparation method for high-quality samples, which would allow a single SNP genotyping method to be implemented for all sample types – lessening the validation burden for the laboratory.
In general, the poor SNP recovery generated from WGS of the library molecules demonstrates the low quantity of human DNA present in historical bone samples, and this reinforces that target enrichment is needed for abundant SNP acquisition. Results from the capture data illustrate that, for most samples, the percentage of reads covering targeted SNPs is remarkably similar between the 25K and 95K panels, despite the difference in the number of probes targeting each SNP (four versus two baits, respectively). SNP recovery is thus proportional to the number of SNPs targeted in the panel. As it is impossible to determine which SNPs may be recovered from sample libraries, it benefits the kinship analysis to probe for the maximum number of SNPs possible. The Parabon Fχ software facilitates this maximal SNP capture approach by implementing a probabilistic SNP genotyping algorithm for low coverage sequence data that is tailored for degraded DNA samples with cytosine deamination. The maximum SNP probe capacity may be determined by factors such as the number of probes that can be effectively put in the capture assay, which must be balanced with cost and sequencing throughput. The present study demonstrates only a moderate (10%) increase in the proportion of precisely predicted relationships when increasing from the 25K to the 95K panel, which is roughly 50% more expensive. Although the cost of a custom capture panel is related to the bait design and number of reactions purchased, in the present study an order for 96 capture reactions would cost $17,760 for the 25K panel (four baits per SNP) versus $26,400 for the 95K panel (two baits per SNP). Laboratories pursuing hybridization capture should weigh the benefits of maximum SNP recovery with other factors including expected DOR, sample type, sequencing throughput, and budget.
A 25K SNP panel generated suitable data to accurately associate up to 3rd degree relatives with the correct DOR prediction and strong statistical support. The recovery of additional SNPs with the 95K SNP panel permitted accurate association of up to 4th degree relatives, the furthest DOR tested. WGS was less successful in obtaining the requisite coverage needed for kinship comparison when sequencing was performed on a MiSeq instrument, as a majority of samples produced false negative results after damage correction was applied. Furthermore, the WGS data, even with damage correction, produced one false positive result / adventitious hit with a LR >10,000 indicating strong statistical support for an incorrect relationship between a case sample and an unrelated FRS. Adventitious hits are expected and likely cannot be avoided, especially in large-scale databases (2) and when dense marker sets are used (39). In the capture data (both 25K and 95K panels), no adventitious hits were generated when using an LR threshold > 10,000. However, false negative results were produced in four of 21 pairwise comparisons due to low LR values (<5,000). It is of larger consequence to misclassify two individuals as related than the alternative. Therefore it is imperative to choose laboratory methods and appropriate interpretation thresholds (e.g., LR, proportion of SNPs recovered) that minimize the number of false positives obtained.
In practice, it may be beneficial for the LR threshold to be based on simulations that determine the maximum expected value from unrelated individuals for a particular DOR. Additionally, the utility of calculating the posterior probability to provide statistical weight to the conclusions should be considered. Incorporation of the posterior probability into the interpretation of the results may be particularly useful in instances where the kinship analysis distinctly indicates relatedness, yet the predicted DOR is inconsistent with reported familial relationships. There are many explanations for noted differences between expected relationships and results obtained through genetic kinship analyses. The distribution of shared DNA varies widely among individuals of the same DOR, and the degree of overlap between different DORs increases as the relationships become more distant (40). Alternatively, there may be issues with genealogical records, such as reporting flaws, non-paternity, or incorrect pedigrees. Policies should be in place for addressing these scenarios in light of sensitive family situations, while retaining the ability to identify the unknown individual (e.g., testing additional references) (2).
The SNP genotypes obtained from historical samples exhibit cytosine deamination and are similar in quality to aDNA. For this reason, the damage correction option is a critical feature of the Parabon Fχ software that enhances the accuracy of the SNP genotypes. When damage correction was applied to the data herein, the predicted DOR was improved. Previous reports have demonstrated through simulation that genotyping errors have a substantial effect on the LR of kinship scenarios, particularly for close genetic relationships (39). The DNA damage expected to be observed in historical remains and aged skeletal samples can affect read alignment to the reference genome, especially in short fragments, as well as SNP genotyping, thereby culminating in genotyping errors. Erroneous SNP alleles could increase allele sharing and artificially inflate kinship statistics (39), leading to adventitious hits between unrelated individuals such as those observed in the WGS data before damage correction. When both SNP capture and damage correction were used in combination on the historical samples in this study, in no instance was a casework sample incorrectly paired with an unrelated FRS (LR >10,000).
This approach of combining large-scale SNP capture with the Parabon Fχ software tailored for degraded DNA analysis provided promising results for forensic genetics in this study, particularly for historical remains cases. SNP capture from aged, degraded skeletal samples may be especially impactful in cases where DNA degradation has prevented successful STR amplification and/or where there is a lack of paternal or maternal relatives. The ability to capture requisite SNP data overcomes STR limitations, expands the pool of eligible DNA sample donors suitable for kinship comparisons by enabling distant kinship estimation from living relatives and removes the need to use lineage assays (mitochondrial DNA sequencing or Y-chromosomal STRs). Although further testing and validation are still required before implementation in a forensic laboratory, this study demonstrates the successful application of SNP capture combined with the Parabon Fχ software to facilitate distant kinship estimation in decades-old unidentified remains cases.
Disclaimer
The assertions herein are those of the authors and do not necessarily represent the official position of the United States Department of Defense, the Defense Health Agency, or its entities including the Armed Forces Medical Examiner System. Any mention of commercial products was done for scientific transparency and should not be viewed as an endorsement of the product or manufacturer
Conflicts of interest
Steven Armentrout, Ellen McRae Greytak, and Janet Cady are employees of Parabon NanoLabs, Inc., the developer and commercial vendor of the Parabon Fχ Forensic Analysis Platform.
Author contributions
Conceptualization -E.M. Gorden, E.M. Greytak, K.S.A., T.P.M., and C.M.; Formal Analysis – E.M. Gorden, E.M. Greytak, and J.C.; Funding Acquisition – E.M. Greytak, T.P.M., and S.A.; Investigation – E.M. Gorden; Methodology -E.M. Gorden, E.M. Greytak, K.S.A., J.C., T.P.M., and C.M.; Project Administration – T.P.M. and S.A.; Resources – T.P.M.; Software – E.M. Gorden, E.M. Greytak, and J.C.; Supervision – T.P.M., S.A. and C.M.; Visualization – E.M. Gorden, E.M. Greytak, K.S.A., and C.M.; Writing – Original Draft Preparation – E.M. Gorden; Writing – Review & Editing – E.M. Greytak, K.S.A., J.C., T.P.M., S.A., and C.M.
Data availability
Data are on file at the AFMES-AFDIL and available to authorized third-party scientists upon written request.
Funding
This study was funded in part by the Defense Forensics and Biometrics Agency, the Department of Defense Office of the Deputy Assistant Secretary of Defense for Emerging Capabilities and Prototyping, US Army Research Office and the Washington Headquarters Services Acquisition Directorate (W911NF-13-R-0006, W911NF-16-C-0085 and modifications).
Acknowledgments
The authors would like to thank Jennifer Daniels-Higginbotham (SNA International, Armed Forces DNA Identification Laboratory) for laboratory analysis and assistance; Timmathy Cambridge (Armed Forces Medical Examiner System) for technical assistance; Amanda Sozer, (SNA International), Michael Fasano, Shairose Lalani, Lt Col Briones and COL Louis Finelli (Armed Forces Medical Examiner System) for administrative and logistical support.
References


