

Abstract
Recent years, allele-specific single cell RNA-seq (scRNA-seq) analysis have demonstrated wide-spread dynamic random monoallelic expression of autosomal genes (aRME). However, the origin of dynamic aRME remains poorly understood. It is believed that dynamic aRME is originated from discrete transcriptional burst of two alleles. Here, for the first time, we have profiled genome-wide pattern of dynamic aRME and allele-specific burst kinetics in mouse pre-gastrulation embryos. We found wide-spread dynamic aRME across the different lineages of pre-gastrulation embryos and which is linked to the allelic burst kinetics. Specially, we found that expression level and burst frequency are the key determinants of dynamic aRME. Altogether, our study provides significant insight about the origin of prevalent dynamic aRME and cell to cell expression heterogeneity during the early mammalian development.
Introduction
Recent advances on allele-specific single cell RNA-seq (scRNA-seq) have revealed cell to cell dramatic variation of allelic gene expression pattern (Deng et al., 2014; Gendrel et al., 2016; Gregg, 2017; Reinius and Sandberg, 2015; Reinius et al., 2016). It has been shown that in a single cell many autosomal genes show monoallelic expression at a particular time point and pattern of allelic expression can change dramatically with the time. This wide-spread temporal aRME has been commonly known as dynamic aRME. The first allele-specific scRNA-seq study in mouse preimplantation embryos showed that ~12-24% of autosomal genes in a blastomere undergo RME (Deng et al., 2014). Interestingly, aRME for most of the genes was not stable across cell divisions since very few genes showed persistence of allelic expression patterns across the cells of the same embryo. It was therefore concluded that the aRME is dynamic over time. In the same study, analysis of hepatocytes from adult mice and mouse fibroblast cell lines also showed a similar pervasiveness of dynamic aRME (Deng et al., 2014). Subsequently, prevalent dynamic aRME has been reported in a variety of cell-types of mouse and human (Borel et al., 2015; Reinius et al., 2016). However, the prevalence of dynamic aRME during the pre-gastrulation development is not known yet. Here, we have profiled the genome-wide pattern of dynamic aRME in different lineages of pre-gastrulation mouse embryos.
On the other hand, the origin of dynamic aRME remains poorly understood. It is thought that dynamic aRME is a consequence of stochastic transcriptional burst (Eckersley-Maslin and Spector, 2014; Reinius and Sandberg, 2015). It is known that transcription happens through discrete bursts such that the state of a gene keeps switching randomly from an active to an inactive state, which leads to discontinuous production of mRNA (Raj and van Oudenaarden, 2008; Raj et al., 2006; Suter et al., 2011; Tunnacliffe and Chubb, 2020). Moreover, it is believed that two alleles for most of the genes burst independently and therefore the abundance of RNA in a cell originating from different alleles can change dramatically over time and which can lead to the dynamic aRME. However, the link between allelic transcriptional burst kinetics and the dynamic aRME has not been explored extensively. In the present study, we have profiled allele-specific transcriptional burst kinetics in different lineages of pre-gastrulation mouse embryos to investigate the link between transcriptional burst kinetics and dynamic aRME.
Results
Dynamic aRME in different lineages of pre-gastrulation mouse embryos
To investigate the aRME pattern in different lineages of pre-gastrulation mouse embryos, we performed allele-specific gene expression analysis using available scRNA-seq dataset of E5.5, E6.25 and E6.5 hybrid mouse embryos (Cheng et al., 2019) (Fig. 1A). These embryos are derived from two divergent mouse strains (C57Bl/6J and CAST/EiJ) and therefore harbor polymorphic sites between the alleles, which allowed us to perform allelic expression profiles of the genes (Fig. 1A). We segregated the cells into the three lineages: epiblast (EPI), extraembryonic ectoderm (ExE) and visceral endoderm (VE) based on t-distributed stochastic neighbor embedding (t-SNE) analysis (Fig. S1).

(A) Clustering of all cells (n=510) from the three different stages (E5.5, E6.25 and E6.50) into two principal dimensions using t-SNE analysis based on 3000 most variable genes. (B) Representation of lineage specific marker expression of the clustered cells generated in t-SNE plot: Pou5f1 for EPI, Bmp4 for ExE and Amn for VE.

(A) Graphical outline of the workflow: allelic gene expression and burst kinetics analysis in different lineages (EPI, ExE and VE) of pre-gastrulation hybrid mouse embryos (E5.5, E6.25 and E6.50) at single cell level using published scRNA-seq dataset. Hybrid mouse embryos were obtained from crossing between two divergent mouse strains C57 and CAST. (B) Estimation of mean percent of autosomal genes showing monoallelic expression per cell of each lineage (EPI, ExE and VE) at different stages (E5.5, E6.25, E6.5). (C) Estimation of mean percent of autosomal genes showing monoallelic expression per cell of each individual embryo of each lineage at different stages. (D) Estimation of mean percent of autosomal genes showing monoallelic expression per embryo of each lineage at different stages.
First, we quantified allelic expression pattern of the autosomal genes in individual cell of different lineages. We found with an average of ~15 to 20% of genes showed monoallelic expression either from CAST or C57 allele per cell and the pattern was almost similar across the three lineages EPI, ExE and VE of different developmental stages (Fig. 1B). Moreover, allelic expression of each individual embryo of different developmental stages showed very similar pattern (Fig. 1C). We considered a gene as monoallelic if at least 95% of the allelic reads was originated from only one allele. As a control, we explored the status of allelic expression pattern of Xist long noncoding RNA in E6.5 VE female cells. Xist is the master regulator of X-inactivation and exclusively express from the inactive-X chromosome. As VE cells undergo imprinted inactivation of the paternal X-chromosome, we found exclusive expression of XIST from the inactive paternal-X chromosome in most of the cells as expected (Fig. S2A). Moreover, profiling allelic expression of X-linked genes, showed >90% of expression from the active maternal-X chromosome and thus validating the accuracy of the allelic expression analysis method (Fig. S2B). Next, we estimated the mean percent of genes showing monoallelic expression per embryo through pooling the cells of an individual embryo. Interestingly, we found that percent of monoallelically expressed genes significantly reduced to 0.8-2% per embryo (Fig. 1D). This result indicated that allelic expression pattern of individual gene is dynamic, i.e. varying cell to cell in each lineage of each embryo at a particular stage. Based on this, next we investigated the status of allelic pattern of individual genes across the cells of each lineage of each developmental stage. Indeed, we found a huge variation of the allelic status of the genes across the cells, indicating the presence of cell to cell dynamic RME (Fig. 2). Overall, we found four different patterns of allelic expression (Fig. 2), which we categorized as follows. Category 1: non-random monoallelic; where the allelic expression of a gene was skewed towards one of the allele across the cells; category 2: random monoallelic with one allele, where allelic expression was biased towards one allele while the other cells showed biallelic expression; category 3: random monoallelic with either allele; here allelic expression pattern was stochastic i.e. either CAST or C57 allele randomly expressed in a cell while other cells still showed biallelic pattern and category 4: genes with biallelic expression in at least 95% of cells. Quantification of the percent of genes of these different categories revealed an almost similar pattern across the three lineages EPI, ExE and VE (Fig. 2). Interestingly, we found that significant proportion of autosomal genes (Category 2: 4-39% and Category 3: 30-81%) showed dynamic RME (Fig. 2). Only, 1 to 2% of genes showed non-random monoallelic expression (Cat 1) and 10 to 29% of genes showed biallelic expression (Cat 4) (Fig. 2). Altogether, these results suggested wide-spread dynamic aRME in each lineage of mouse pre-gastrulation embryos.

Female VE cells undergo imprinted X-inactivation and therefore paternal X-chromosome is chosen as the inactive-X chromosome. XIST long noncoding RNA exclusively expresses from the inactive-X chromosome. (A) As expected, we found in almost all cells except few, allelic expression of XIST originated from paternal-X chromosome. (B) Profiling allelic expression of X-linked genes from maternal allele, showed >90% of expression from the active maternal-X chromosome almost in all cells and thus validating the accuracy of the allelic expression analysis method.

Quantification of percent of genes showing different category of allelic expression (Cat1: Non-random monoallelic, Cat 2: random monoallelic with one allele, Cat 3: random monoallelic with either allele, Cat 4: biallelic) in three different lineages EPI, ExE and VE across the different developmental stages.
Dynamic aRME is linked to allele-specific transcriptional burst kinetics
We explored genome-wide allele-specific transcriptional burst to investigate the correlation between dynamic aRME and transcriptional bursting. Based on two state model of transcription, transcription occurs in burst where state of a gene keeps switching from ON to OFF state (Fig. 3A).
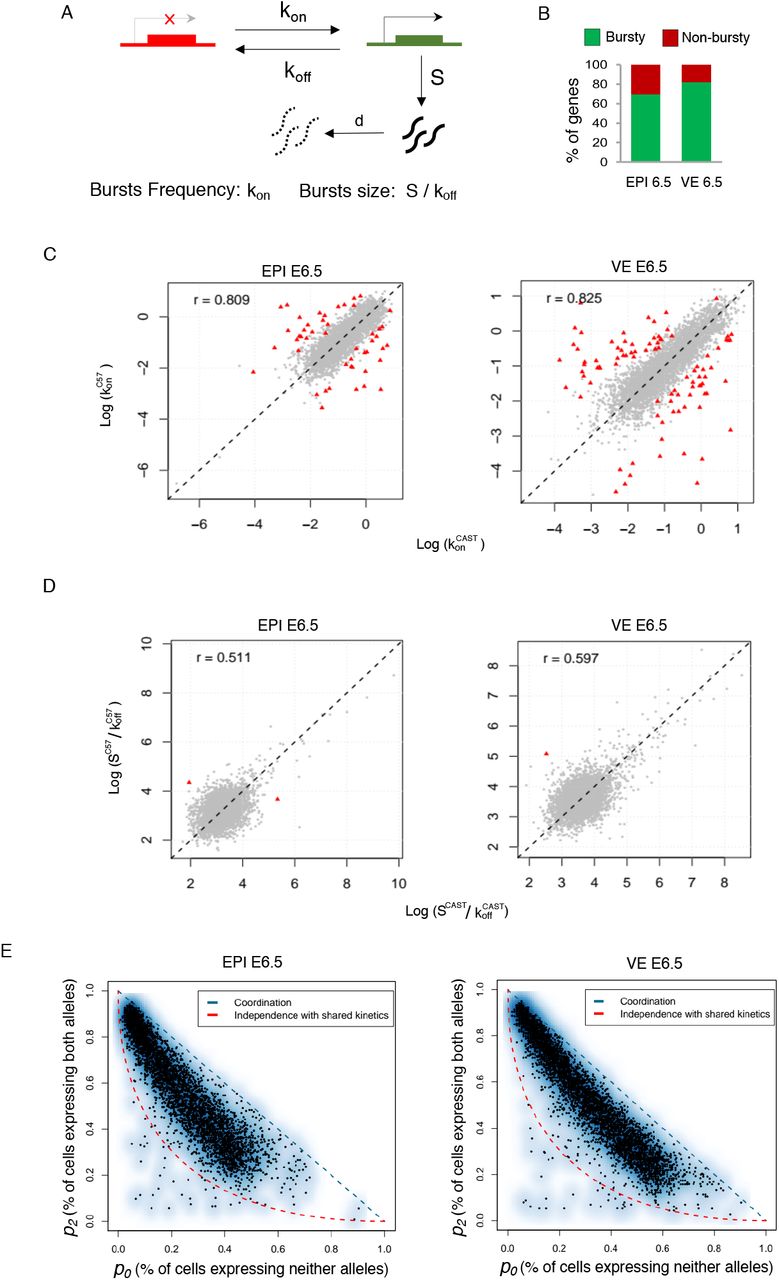
(A) Representation of two state model of transcription. kon: rate at which a gene becomes transcriptionally active (from off to on); koff: rate at which a gene becomes inactive (from on to off); S is rate of transcription, while the gene is active; d is rate of mRNA decay. Burst kinetics is characterized through burst frequency (kon) and the burst size (S/koff). (B) Estimation of proportion of autosomal genes with bursty expression in EPI and VE cells of E6.5 stage. (C) Burst frequency of the two alleles of most of the genes was highly similar in EPI and VE cells of E6.5 stage (r= 0.80 and 0.82 respectively). Genes having significantly different allelic burst frequency marked as red triangle. (D) Similar burst size of the two alleles of most of the genes in EPI and VE cells of E6.5 stage (r= 0.51 and 0.59 respectively). Genes having significantly different allelic burst size marked as red triangle. (E) Smooth scatter plot showing independence of allelic transcriptional bursting in EPI and VE cells of E6.5 stage. p0 is percent of cells expressing neither allele. p2 is percent of cells expressing both alleles. Black points representing individual genes. Diagonal blue line (p0 + p2 = 1) represent coordinated bursting whereas red curve represents perfect independent bursting with shared kinetics.
Burst kinetics is mainly characterized through burst frequency and burst size. The burst frequency is the rate at which bursts occur per unit time and burst size is determined by the average number of synthesized mRNA while a gene remains in an active state (Fig. 3A). We applied SCALE in EPI and VE cells of E6.5 to determine the genome-wide burst kinetics of autosomal genes in allele specific manner. Principally, SCALE first categorize the genes to biallelic, monoallelic and silent using Empirical bayes framework based on the allele specific expression and then characterize the burst kinetics on biallelic genes (Jiang et al., 2017). In both, E6.5 EPI and VE we found that among the biallelic genes, majority of the genes (70-82%) showed bursty expression (Fig. 3B). Next, we compared the burst kinetics between the alleles of individual genes. Interestingly, we found that the alleles of most of the genes showed similar burst kinetics, i.e, they had similar burst frequency and size (Fig. 3C & 3D). Only 48 (EPI) and 90 (VE) genes showed significantly different allelic burst frequency (Fig. 3C). On the other hand, very few genes showed significantly different allelic burst size (Fig. 3D). Next, we determined the independence of allelic transcriptional burst. We found that allelic transcriptional bursting is neither independent nor perfectly coordinated (Fig. 3E).
Next, we determined the correlation between transcriptional burst kinetics and dynamic aRME. First, we wanted to see if there any correlation between bursty gene expression and dynamic aRME. Interestingly, we found that majority of the dynamic aRME genes (Cat 2 & Cat 3) showed bursty expression (Fig. 4A). Specially, for Cat 3 aRME genes, more than 92% genes showed bursty expression (Fig. 4A). On the other hand, majority of biallelic genes (Cat 4) for EPI cells showed non-bursty expression (Fig. 4A). Altogether, these results suggested that dynamic aRME genes are mostly the bursty genes and genes undergoing biallelic expression are non-bursty. Next, we examined if there any correlation between allelic expression of genes with the allelic burst kinetics. To test this, we performed pairwise correlation test between different burst kinetics parameters and sum of allelic read counts for each gene across the cells (Fig. 4B). We found that total expression of alleles is positively corelated (r=0.65-0.77) with allelic burst frequency. On the other hand, allelic expression was positively correlated with the burst size (r=0.12-0.18) as well as proportion of unit time the allele remains active (r=0.23-0.34), however, correlation value was much lower compared to the burst frequency. To get more insight in to this aspect, we compared the burst frequency and burst size of alleles with the percent of cells expressing that corresponding allele. Interestingly, we found that proportion of cells express one allele of genes is dependent on burst frequency of that allele rather than burst size (Fig. 4C). Overall, we found that proportion of cells express one allele of genes is increases parallel way with the increase in burst frequency. Similarly, we compared mean expression of alleles with the allelic burst frequency and burst size and found that mean expression level substantially dependent on allelic burst frequency instead of burst size (Fig. 4D). Allelic expression was directly proportional with the allelic burst frequency such that alleles expressing high showed high allelic burst frequency, low had low allelic burst frequency. Interestingly, comparison of overall expression level between bursty vs. non-bursty genes revealed that non-bursty genes have always significantly higher expression compared to the bursty genes (Fig. 5A). Next, we hypothesized that proportion of cells with monoallelic gene expression is might be dependent on expression level of genes. To test our hypothesis, we analyzed correlation between gene expression level and percent of cells showing the monoallelic expression for that gene and as expected we found a high negative correlation (r= −0.58 to −0.61) (Fig. 5B). Altogether, these results indicated that extent of monoallelic expression of a gene is dependent on its expression level as well as allelic burst frequency. Finally, based on our observation and analysis we proposed a model highlighting how transcriptional burst kinetics can contribute to the dynamic aRME (Fig. 5C). Basically, we propose that bursty genes with asynchronous allelic burst kinetics build up the dynamic aRME landscape. Specially, genes with lower expression and/or lower burst frequency frequently undergo monoallelic expression (Fig. 5C). On the other hand, genes with high expression and high allelic burst frequency express biallelically most of the time (Fig. 5C).

(A) Quantification of proportion of dynamic aRME genes (Cat 2 & Cat 3) with bursty expression and proportion of biallelic genes (Cat 4) having bursty expression in EPI and VE cells of E6.5 stage. (B) Pairwise correlation between different allelic bursting kinetics parameters (burst frequency: konCAST and konC57; Proportion of unit time that the gene stays in active form: pCAST = konCAST/ (konCAST + koffCAST); pC57 = konC57/ (konC57 + koff57); burst size: SCAST/ koffCAST and SC57/ koffC57) and expression level (sum of normalized allelic read counts (log)) of the alleles in EPI and VE cells of E6.5 stage. (C) Scatter plot representing estimate of burst size and burst frequency of the CAST and C57 allele of autosomal genes. Color of gene is profiled based on percent of cells expressing CAST or C57 allele. (D) Scatter plot representing estimate of burst size and burst frequency of the CAST and C57 allele of autosomal genes. Color of gene is depicted based on mean allelic expression.

(A) Comparison of expression level of bursty vs. non-bursty genes in EPI and VE cells of E6.5 stage. (B) Correlation plot between mean expression of gene and percent of cells showing monoallelic expression for that gene (r= −0.58 in EPI and - 0.61 in VE). (C) Model representing how transcriptional burst kinetics can lead to dynamic aRME.
Discussion
It is believed that dynmic aRME creates temporal variation among the cells and thereby contribute to the cell fate decision, promote cellular plasticity during development (Gregg, 2017; Huang et al., 2018). Therefore, profiling the pattern of dynamic aRME during early development is of immense interest. In fact, scRNA-seq analysis of murine pre-implantation blastomeres revealed wide-spread dynamic aRME (Deng et al., 2014). In consistence, our study revealed that dynamic aRME is prevalent in different lineages of pre-gastrulation mouse embryos, similar to the blastomeres. We found that ~69-88% of genes showed variation in their allelic expression pattern across the cells of a lineage of a particular stage, whereas 10-29% genes had consistent biallelic expression across the cells (Fig. 2). Therefore, it seems that dynamic allelic expression is a general feature of gene expression affecting many genes during development.
On the other hand, studies in a variety of species have revealed that transcription happens through discrete bursts such that the state of a gene keeps wavering randomly from an active to an inactive state, which leads to discontinuous production of mRNA (Chubb et al., 2006; Larson, 2011; Raj and van Oudenaarden, 2008; Raj et al., 2006; Suter et al., 2011). The sporadic nature of transcriptional bursting is proposed to be a major driver of spontaneous heterogeneity in gene expression, which in turn drives diversity of cell behavior in differentiation and disease (Raj and van Oudenaarden, 2008). However, the kinetics of transcriptional bursting remains poorly understood. For a long time, the analysis of transcriptional burst kinetics was mainly based on single-molecule RNA-FISH or live-cell imaging and therefore restricted to a few selected loci of the genome (Raj et al., 2006). Recent advancements in allele-specific expression analysis of a large number of genes at single cell level, however, has made it possible to analyse transcriptional burst kinetics at allelic level genome-wide more extensively (Ochiai et al., 2020; Sun and Zhang, 2020). In this study, we have profiled genome-wide allelic burst kinetics in different lineages of pre-gastrulation mouse embryos. We found that majority of the autosomal genes have bursty expression and alleles of most of the genes have similar burst kinetics, which is consistent as described previously in other cell types (Fig. 4B, C & D) (Jiang et al., 2017). Moreover, while independent form of allelic transcriptional burst with shared burst kinetics is widely accepted, we found that allelic transcriptional bursting is neither independent nor perfectly coordinated, which is consistent with a recent study inferring that allelic bursting is mostly dependent in nature (Fig. 4E) (Choi et al., 2019).
Finally, our study demonstrates that dynamic aRME is linked to allelic burst kinetics. We found that majority of dynamic aRME genes show bursty expression. Moreover, the genes with lower expression and lower burst frequency are more prone to undergo frequent monoallelic expression (Fig. 5C). On the other hand, non-bursty genes or bursty genes with high allelic burst frequency and high expression exhibit frequent biallelic expression (Fig. 5C). Overall, burst frequency and expression level are the key determinants for frequent monoallelic expression rather than burst size. Indeed, recent studies have demonstrated that transcriptional burst can explain aRME (Larsson et al., 2019; Symmons et al., 2019). In future, more investigations is necessary to delineate the biological significance of wide-spread dynamic aRME.
Methods
Data acquisition
Single cell transcriptome datasets used for this study were acquired from Gene Expression Omnibus (GEO) under the accession number GSE109071 (Cheng et al., 2019). For our study, we analyzed single cell dataset generated from E5.5, E6.25 and E6.50 hybrid mouse embryos (C57BL/6J × CAST/EiJ). E5.5 and E6.25 embryos were derived from the following cross: C57(F) × CAST(M); whereas E6.5 were derived from CAST(F) × C57(M).
Lineage identification
All the single cells (510 cells) of different stages were subjected to dimension reduction algorithm using t-distributed stochastic neighbor embedding (t-SNE) to identify lineages. 3000 most variable genes were used for the analysis. t-SNE was performed using Seurat (version 3.1.5) (Butler et al., 2018; Stuart et al., 2019). The allocation of each cluster to cell lineages to EPI, ExE and VE lineages was based on the expression of bona fide marker genes: Oct4 for EPI, Bmp4 for ExE and Amn for VE.
Allele Specific Expression and burst kinetics analysis
For allelic expression analysis of genes, first we constructed in silico CAST specific parental genome by incorporating CAST/EiJ specific SNPs into the GRCm38 (mm10) reference genome using VCF tools (Danecek et al., 2011). CAST specific SNPs were obtained from Mouse Genomes Project (https://www.sanger.ac.uk/science/data/mouse-genomes-project). Reads were mapped onto both C57BL/6J (mm10) reference genome and CAST/EiJ in silico parental genome using STAR with no multi-mapped reads. To exclude any false positive, we only considered those genes which had at least 1 informative SNPs (at least 3 reads per SNP site). In case of genes having more than 1 SNP, we took average of SNP-wise reads to have the allelic read counts. We normalized allelic read counts using spike-in. We considered those genes which had at least mean 10 reads per cell for each lineage of a specific developmental stage. Allelic expression was calculated individually for each gene using formula = (Maternal/Paternal reads) ÷ (Maternal reads + Paternal reads). A gene was considered monoallelic if at least 95% of the allelic reads was coming from only one allele. We performed allele specific burst kinetics analysis using SCALE in EPI (n=123 cells) and VE (n=115 cells) of E6.5 stage (Jiang et al., 2017).
Author’s Contribution
SG conceptualized and supervised the study. Bioinformatic analyses was performed by HCN. DC and SM helped with the analysis. SG wrote the manuscript. Final manuscript was approved by all the authors.
Acknowledgments
We thank R.V. Pavithra for her help in artwork and discussion. Study is supported by DBT grant (BT/PR30399/BRB/10/1746/2018), DST-SERB (CRG/2019/003067) and DBT-Ramalingaswamy fellowship (BT/RLF/Re-entry/05/2016) awarded to SG. We also thank DST-FIST [SR/FST/LS11-036/2014(C)], UGC-SAP [F.4.13/2018/DRS-III (SAP-II)] and DBT-IISc Partnership Program Phase-II (BT/PR27952-INF/22/212/2018) for infrastructure and financial support.
References


