

Abstract
Severe acute respiratory syndrome coronavirus 2, SARS-CoV-2, was quickly identified as the cause of COVID-19 disease soon after its earliest reports. The knowledge of the contemporary evolution of SARS-CoV-2 is urgently needed not only for a retrospective on how, when, and why COVID-19 has emerged and spread, but also for creating remedies through efforts of science, technology, medicine, and public policy. Global sequencing of thousands of genomes has revealed many common genetic variants, which are the key to unraveling the early evolutionary history of SARS-CoV-2 and tracking its global spread over time. However, our knowledge of fundamental events in the evolution and spread of this coronavirus remains grossly incomplete and highly uncertain. Here, we present the heretofore cryptic mutational history, phylogeny, and dynamics of SARS-CoV-2 from an analysis of tens of thousands of high-quality genomes. The reconstructed mutational progression is highly concordant with the timing of coronavirus sampling dates. It predicts the progenitor genome whose earliest offspring without any non-synonymous mutations were still spreading worldwide months after the report of COVID-19. Over time, mutations gave rise to seven major lineages that spread episodically, some of which arose in Europe and North America after the genesis of the ancestral lineages in China. Mutational barcoding establishes that North American coronaviruses harbor very different genome signatures than coronaviruses prevalent in Europe and Asia that have converged over time. These spatiotemporal patterns continue to evolve as the pandemic progresses and can be viewed live online.
Even months after the initial detection of SARS-CoV-2 as the causal agent of COVID-19, and the acquisition of tens of thousands of genomes, the early evolutionary history and order of mutational events that arose during the pandemic remains unresolved1–8. Widely-recognized impediments include a limited number of phylogenetically informative variants in genomes, the ubiquity of sequencing errors, and the lack of a closely-related outgroup sequence, all of which have complicated the inference and rooting of the SARS-CoV-2 phylogeny1–8. Consequently, the traditional approach to the analysis of viral spread and evolution in which a reliable genome phylogeny is first inferred, and then observed differences among sequences are mapped site-by-site has not been able to stage the earliest mutational events in the evolution of the novel coronavirus9,10. The definition and cataloging of viral lineages are similarly complicated by phylogenetic noise7.
To sidestep these issues, we applied a mutation order approach (MOA) that does not rely on the inference of phylogeny as an intermediate step in reconstructing the mutational history of SARS-CoV-2 genomes11–13. MOA is well-suited for analyzing SARS-CoV-2 genomes because its clonal evolution, without evidence for recombination in the early stages of the outbreak, preserves the collinearity of variants in genomes. This feature enables the use of shared co-occurrence of variants in genomes and the frequencies of individual variants informative to reliably infer mutational history even in the presence of sequencing errors and other artifacts11,14 (see Methods).
A mutational history of SARS-CoV-2
We analyzed 29,681 SARS-CoV-2 genomes (herewith referred to as 29KG dataset), each with at least 28,000 bases, sampled between 24 December 2019 and 07 July 2020, representing 97 countries and regions around the world. In the 29KG dataset, 49 single nucleotide variants (SNVs) occur with greater than 1% variant frequency (vf > 1%; Supplementary Table 1) and were the subject of our investigation. We used MOA to reconstruct their mutational history presented in figure 1. The first mutations (μ’s, α’s, and β’s) were all sampled early on in Asia (China) and have the highest frequency in the 29KG dataset (Fig. 1, red pies). In this mutation history, over 95% of the variants showed an extremely high co-occurrence index, COI, i.e., each variant was found in the genomic background of the variant preceding it in the graph. The average COI for variants exceeds 96.9%, which is indicative of a strong signal to infer the mutation history reliably. The inferred mutation order agreed with the timing of the first sampling for variants in all but two cases (Fig. 1, see Methods). This concordance provides independent validation of the reconstructed mutation graph because neither sampling dates nor locations were used in the inference of mutational history. Such independence is the key to avoiding circularity in the subsequent analysis of the origin and spread of new mutants. For example, some early genome samples in China have been used as references in databases and analyses to orient mutational changes15–18. This practice assumes that reference genomes are ancestral. The mutation history in figure 1, reconstructed independently of any spatiotemporal information, permits a direct test of such assumptions and reveals more robust SARS-CoV-2 mutational trends and reliable evolutionary history.
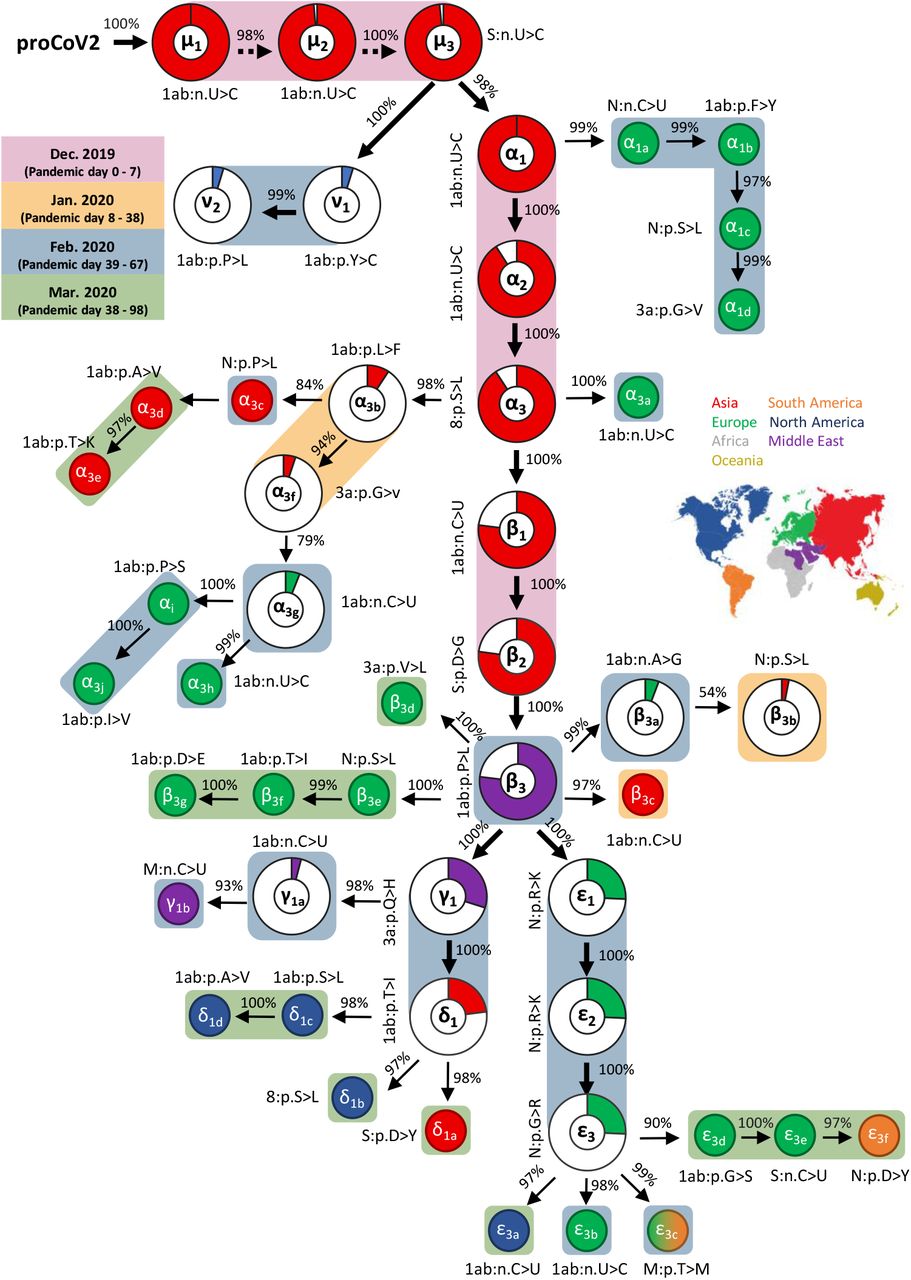
Mutational history graph of SARS-CoV-2. Thick arrows mark the pathway of widespread variants (frequency, vf ≥ 5%), and thin arrows show paths leading to other common mutations (5% > vf > 1%). The size of the pie in pie-charts is proportional to variant frequency in the 29KG dataset, with pie-charts shown for variants with vf > 3% and pie color based on the region of the world where that mutation was first observed. A circle is used for all other variants, with the filled color corresponding to the earliest sampling region. The co-occurrence index of each mutation and its predecessor mutation is shown next to the arrow connecting them. Base changes (n.) are shown for synonymous mutations, and amino acid changes (p.) are shown for non-synonymous mutations along with the gene/protein names (“ORF” is omitted from gene name abbreviations given in Supplementary Table 1). A rounded rectangular background indicates the earliest month in which a mutation was first found. More details on each mutation are presented in Supplementary Table 1.
The progenitor SARS-CoV-2 genome
MOA predicts the genome sequence of the most recent common ancestor, i.e., the progenitor SARS-CoV-2 genome, henceforth proCoV2 (available at http://igem.temple.edu/COVID-19). In the proCoV2 genome, there are 170 non-synonymous and 958 synonymous substitutions when compared with the genome of a closely-related coronavirus, RaTG13, found in a Rhinolophus affinis bat19 (Fig. 2a). This amounts to a 96.12% sequence similarity between proCoV2 and RaTG13 sequences.

Evolutionary divergence and history of SARS-CoV-2. (a) A waterfall display of genome phylogeny recapitulating the mutation graph in figure 1. The numbers of genomes mapped to each node are depicted by open circles (very few genomes), open triangles (few genomes), small gray triangles (many genomes), and large black triangles (very many genomes). The tip label is the name of the mutation on the connecting branch. Green and red branches are synonymous and non-synonymous mutations, respectively. Thick branches mark mutations that occur with a frequency greater than 3% in the 29KG data. (b) Cumulative count of single nucleotide variants present in the 29KG genome dataset at different frequencies. (c) Temporal and spatial distribution of strains identical to proCoV2 on amino acid sequence level, i.e., they have only synonymous differences. (d) The number of base differences from proCoV2 for genomes that were sampled in December 2019 and January 2020. The 17 genomes sampled in December 2019 in China (red) have six common SNVs different from proCoV2, whereas six genomes sampled in January 2020 in China (Asia, red) and USA (North America, blue) show only three bases differences. A circle marks the presence of genome, with multiple genomes (2 and 15) sampled on two different days. (e) The number of genomes in the 29KG collection that were isolated weekly during the pandemic. The color scheme used to mark sampling locations is shown in panel c.
A comparison of the inferred proCoV2 sequence with genomes in the 29KG collection revealed no full matches at the nucleotide level. However, 120 genomes contained only synonymous differences from proCoV2. That is, all their proteins were identical to the corresponding proCoV2 proteins in the amino acid sequence. A majority (80 genomes) of these protein-level matches were from coronaviruses sampled in China and other Asian countries. The first sequence was sampled 12 days after the date of the earliest sampled virus whose genome became available on 24 December 2019, which we refer to as pandemic day 0 (week 0). Multiple matches were found in all sampled continents and detected as late as April 2020 (pandemic day 124) in Europe (Fig. 2c). These spatiotemporal patterns suggest that proCoV2 already possessed the repertoire of protein sequences needed to infect, spread, and persist in the global human population (see also ref.20).
Mutations of proCoV2 before the first COVID-19 reports
The first three synonymous SNVs (μ) of proCoV2 are present individually in more than 98% of the genomes in the 29KG collection. They have almost reached fixation in the global coronavirus population (Fig. 3a). All three SNVs almost always co-occur and present in all the genomes sequenced in China in December 2019 (Fig. 1). The proCoV2 genome containing all of the μ variants gave rise to an evolutionary lineage characterized by three additional variants (α). All three α variants are found in 90% of the genomes in 29KG and emerged before pandemic day 0. The first two α mutations were synonymous, and the third one was a non - synonymous mutation in ORF8 (Fig. 2a; Supplementary Table 1). Out of a total of six initial mutations of proCoV2 (μ’s and α’s), the first five were synonymous U→C changes, whose functional significance is being debated20,21 as they are the most common early nucleotide changes observed so far in the evolution of SARS-CoV-222.
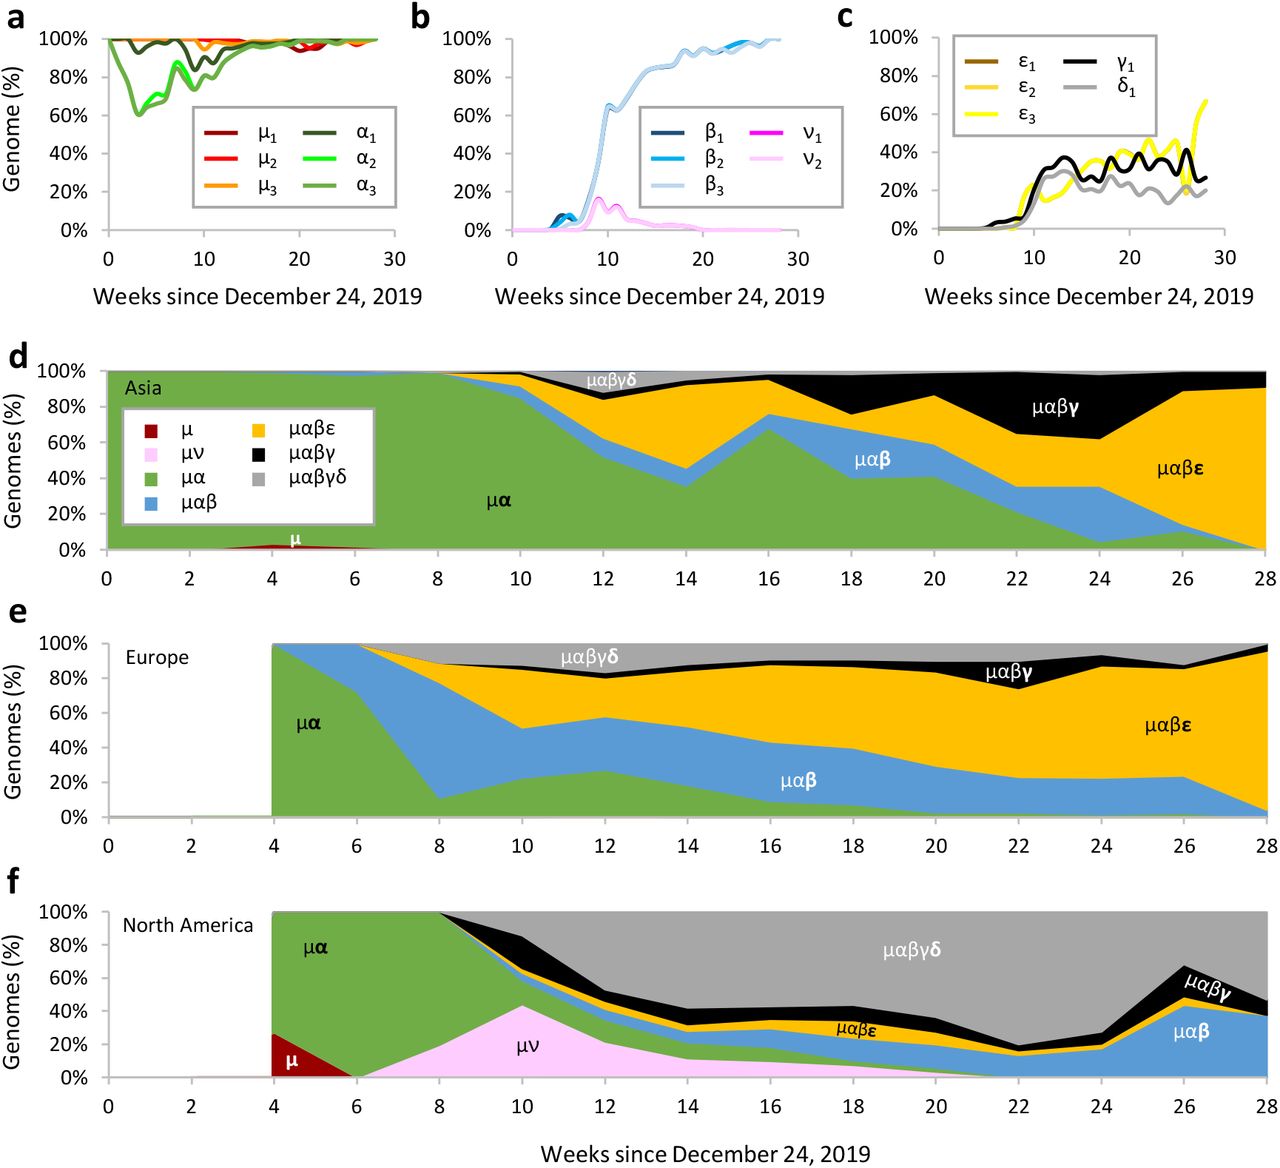
Spatiotemporal dynamics of SARS-CoV-2 genomes. (a-c) Temporal patterns of frequencies of major variants. The proportion of genomes containing each major mutant is calculated for each week on and after 24 December 2019 and then connected using a smoothed line. (d-f) Spatiotemporal patterns of genomes mapped to lineages containing different combinations of major variants in Asia, Europe, and North America. The number of genomes mapped to mutation lineages (e.g., proCoV2μα contains μ1 – μ3 and α1 - α3 variants) is counted biweekly to generate this stacked line graph. The area is the proportion of genomes mapped to the corresponding lineage in the two-week time frame. To simplify the display, “proCoV2” is omitted from the lineage names. There was not a sufficient number of genomes sampled from Europe and North America in the first four weeks.
The emergence of μ and α variants before the first reports of COVID-19 implies the existence of some sequence diversity in the ancestral SARS-CoV-2 populations. All the 17 genomes from China sampled in December 2019, including the designated SARS-CoV-2 reference genome, carry all three μ and three α variants (Fig. 2d). Interestingly, the six genomes containing μ variants but not α variants were sampled in China and the United States in January 2020 (Fig. 2d). Therefore, the earliest sampled genomes (including the designated reference) are not ancestral, and using them as such23–25 will spuriously predict several reversals or convergent mutations in the early history of SARS-CoV-2 genomes. For example, the root of SARS-CoV-2 phylogeny in the GISAID resource is placed between α1 and α3 variants in mutational history26. This placement of root suggests U to be the mutant base and C to be the ancestral base in SARS-CoV-2 at all four positions (three μ’s and α1), which proposes four consecutive backward mutations in SARS-CoV-2 or convergent mutations in bat because U is observed at all four positions in RaTG13. So many backward and convergent mutations in significant frequency would be unusual. In fact, the likelihood of mutation history constructed using C as the ancestral base was significantly worse than with U as the ancestral base (P < 0.01; see also Methods). Therefore, our analyses infer a credible root for the SARS-CoV-2 phylogeny.
Notably, a mutant of proCoV2 with μ variants, but without α variants, was isolated in the United States on pandemic day 59. This genome contained two additional non-synonymous variants (ν) and became a significant CoV-2 lineage before going extinct a few weeks later (Fig. 1, 3b, and 3f). Therefore, proCoV2 genomes with μ variants alone were distributed worldwide and gave rise to new CoV-2 lineages during the pandemic. The discovery of these patterns was possible by mutation order analysis and the use of proCoV2 as a reference, which enables improved molecular evolutionary and phylogenetic analyses of COVID-19.
Mutations after the first reports of COVID-19
A non-synonymous variant of the Spike protein (p.D614G, β2) of proCoV2μα genome and two other variants, one synonymous (ORF 1ab, β1) and one non-synonymous (ORF1ab, β3), co-occur in 99.1% genomes (β variants). The first two of these variants were detected on pandemic day 31 in China (and day 35 in Europe). These two variants are almost always sampled together. Soon after, a non-synonymous ORF1ab mutant (β3) occurred to complete form the β lineage that was first sampled in Saudi Arabia on pandemic day 41 and then in Europe on pandemic day 54.
Interestingly, β3 was not observed in Chinese samples until pandemic day 69. By that time, the β lineage had already been established worldwide. As a result of highly uneven and sparse sampling of genomes across the globe during the early phases of the pandemic (Fig. 2e), one cannot exclude the possibility that β variants first arose outside China, possibly the Middle East or Europe. Regardless, the three β variants preceded the coronavirus expansion in Europe two months after the pandemic began (Fig. 3b and 3e). Because of its co-occurrence with the Spike variant p.D614G, the role of ORF1ab β3 mutation likely to become attractive to investigate experimentally, as several studies have argued that the Spike variant increases the infectivity and facilitates the spread of COVID-19, albeit without detectable clinical consequences27–34.
The frequency of β variants has approached fixation in the SARS-CoV-2 population worldwide (Fig 3B). However, this increase has occurred concomitantly with, or possibly driven by, their descendant lineages (Fig. 3c). One lineage from proCoV2μαβ was founded by three mutations (ε) of the nucleocapsid protein (N) protein and first seen in genomes sampled on pandemic day 54 in Europe. This lineage (proCoV2μαβε) has become dominant in the European region to the point of almost wholly replacing all other lineages (Fig. 3e). All three ε mutants occur in adjacent codons of the N protein and are non-synonymous changes involving the Arginine residues. The net result of the three ε mutations is the gain of an Arginine, which increases the positive charge of the protein, an essential property for the N protein’s nucleic acid binding function that is critical for virus transcription and assembly35. Because all three ε variants are always found together and are increasing in frequency in Asia and Europe, they may have hitchhiked with or may have driven the increase in the frequency of the Spike p.D614G variant.
The second evolutionary lineage to emanate from proCoV2μαβ was founded by a mutation (γ) that, along with its descendant genome containing a δ mutation, gave rise to the most common coronaviruses in North America today (Fig. 3f). The γ variant was first detected on day 41 in Saudi Arabia (98 samples). The δ variant was first found in Singapore on pandemic day 54 (25 samples). They both appeared in Europe on pandemic day 59, underwent a limited spread for a few weeks, but did not become common (Fig. 3e). Because neither of these variants was detected in China until later (pandemic day 79), they may have originated in other regions of the world.
The presence of the γ and δ variants in and around Europe by pandemic day 59 and their subsequent appearance in eastern North America (first detected on pandemic day 66) is consistent with the suggestion that, early on, coronaviruses from Europe seeded infections in eastern North America36. As for the Asian seeding of infections in western North America37, μ and μα originated in China and dominated in the earliest phases of the pandemic. However, these mutants were replaced a few weeks later by μν genomes that were first isolated on pandemic day 59 in western North America and those found in eastern North America (μαβγδ genomes) (Fig. 3f). In recent months, the spatiotemporal pattern in North America has been led by the expansion of proCoV2μαβγδ genomes (Fig. 3f).
Overall, Asian spatiotemporal patterns of coronavirus lineages are more similar to European regions, where μαβ genomes with ε variants have become common (Fig. 3d). These patterns are very different from North American regions where ε remains a minority and μαβ genomes with γ and δ variants dominate (Fig. 3f). Therefore, spatiotemporal patterns have converged between Europe and Asia, both of which have diverged from North America.
Molecular phylogeny of SARS-CoV-2 genomes
The progression of mutations shown in figure 1 predicts observed and extinct genomes by tracking mutational history from the progenitor sequence. Therefore, it directly transforms into a phylogeny of genomes in which each node (leaf or internal) represents a genome type containing all the mutations that occurred on the path from that node to the progenitor proCoV2 (Fig. 2a). This phylogeny is a rooted tree of SARS-CoV-2, which has been challenging to infer reliably1–8. It shows that all the early novel coronavirus lineages were established by three μ mutations, all of which were first seen in genomes sampled in China. In fact, the next five major mutations (α1 – α3 and β1 – β2) were also detected first in China, establishing that the proCoV2 likely originated and evolved in China.
Genomes containing early mutations spread to other parts of the world, and they gave rise to new lineages much later. For example, a genome with three μ SNVs mutated to establish the ν lineage that likely arose many weeks after the pandemic began (sampled on day 59), spread extensively (4.7% of the genomes in 29KG), and remained restricted to North America. A mutant of the genome containing μ and α1 SNVs gave rise to a significant offshoot (α1a) more than two months after the pandemic began (pandemic day 63 in France). The genome harboring μ and α SNVs underwent three successive mutations, including Spike p.D614G, to establish the β lineage. This lineage gave rise to two major clades: one founded by γ and δ mutations that became predominant in North America. The other was founded by ε mutations that became predominant in Europe and Asia. Many of these major divergences in the early evolutionary history of SARS-CoV-2 have not been apparent from previous work due to difficulty in rooting and interpreting SARS-CoV-2 phylogenies1–7.
Each node in the mutation-based phylogeny in figure 2A can be represented by a binary barcode containing the presence/absence of 49 variants–a system that provides an intuitive mutational signature approach to classifying genomes (see Methods). We mapped genomes from the 29KG dataset to each node based on these signatures and represented high and low genome counts by open and closed circles and triangles (Fig. 2a). A comparison of our mutation-based classification with a widely used phylogeny-based classification26 revealed many similarities (see Supplementary Figure 1). However, several significant differences between classification schemes arose, likely caused by the use of early coronavirus samples to root SARS-CoV-2 phylogeny and the difficulty in reliably staging the earliest divergence events.
Episodic accumulation of variants
The numbers of genomes mapping to many ancestral nodes in the SARS-CoV-2 phylogeny are relatively small (represented by open circles and triangles in Fig. 2a). In particular, the number of genomes with both α2 and α3 variants is more than 20-times more than those containing only the α2 variant (1,116 versus 47 genomes). Similarly, the number of genomes with all three β variants (3,032) exceeds those with predecessor β1 and β2 mutants (40 and 9 genomes, respectively). The three ε variants always occur together (5,365 genomes), with other combinations of ε variants found in only two genomes (Supplementary Table 1). Similar trends are observed for many other offshoots, as well. This clustering of mutants suggests an episodic nature of variants spread (P < 0.01, Methods), which may arise from founder effects, positive selection, or both (e.g., ref.20). However, such inferences of evolutionary and epidemiological mechanisms are complicated by highly uneven regional and temporal genome sequencing that is unlikely to produce an unbiased representative sample of the actual worldwide population (Fig. 2e).
In this phylogeny, the proportion of non-synonymous to synonymous changes (N/S) is 1.9. This ratio is almost 10-times larger than the ratio of 0.18 for the inferred proCoV2 and observed Bat CoV proteins. A McDonald-Kreitman test38 rejects the similarity of molecular evolutionary patterns observed within the SARS-CoV-2 population (29KG dataset) and between human proCoV2 and the bat coronavirus. It is not prudent to automatically invoke the action of positive selection using such neutrality tests, because synonymous polymorphisms in SARS-CoV-2 genomes are affected by molecular mechanisms (e.g., RNA editing)21,39 as well as negative selection21. Furthermore, even slightly deleterious alleles can become common when there is a population expansion40. We cannot assume that all non-synonymous and synonymous differences between human CoV-2 and bat CoV sequences are neutral20. Nevertheless, N/S patterns do show that molecular evolutionary patterns observed within SARS-CoV-2 genomes infecting humans are different from those spanning the divergence between RaTG13 and proCoV2.
In conclusion, the approach taken here to discover key mutational events, a timeline of their evolution, and spatial distributions of variants and evolutionary lineages will generally be applicable for analyzing pathogens during the early stages of outbreaks. The approach is scalable for even bigger datasets because it does not require more phylogenetically informative variants with an increasing number of samples. In fact, it benefits from bigger datasets as they afford more accurate estimates of individual and co-occurrence frequencies of variants and enable more reliable detection of lower frequency variants. Its application to an extensive collection of SARS-CoV-2 genomes has facilitated the reconstruction of the progenitor viral genome and the identification of mutant lineages, empowering the tracking of distinct SARS-CoV-2 lineages over time and space, improving our understanding of the past, current, and future evolution of SARS-CoV-2 and COVID-19. An initial implementation of a regularly updated SARS-CoV-2 phylogeny and global spatiotemporal patterns utilizing GISAID data is available from http://igem.temple.edu/COVID-19 (an early beta version).
Methods
Genome data acquisition and processing
We downloaded SARS-CoV-2 genomes from the GISAID41 database along with information on sample collection dates and locations. Of all the genomes downloaded, we only retained those with greater than 28,000 bases and marked as originating from human hosts. Each genome was subjected to codon-aware alignment with the NCBI reference genome (accession number NC_045512) and then subdivided into ten regions based on CDS features: ORF1a (including nsp10), ORF1b (starting with nsp12), S, ORF3a, E, M, ORF6, ORF7a, ORF8, N, and ORF10. Gene ORF7b was removed because it was too short for alignment and comparisons. For each region, we scanned and discarded sequences that contained too many ambiguous nucleotides in order to remove data with too many sequencing errors. Thresholds were 0.5% for the S gene, 0.1% for ORF1a and ORF1b genes, and 1% for all other genes. We mapped individual sequences to the NCBI reference genome (NC_045512) using a codon-aware extension to the Smith-Waterman algorithm implemented in HyPhy42 (https://github.com/veg/hyphy-analyses/tree/master/codon-msa), translated mapped sequence to amino-acids and performed multiple protein sequence alignment with the auto settings function of MAFFT (version 7.453)43. Codon sequences were next mapped onto the amino-aid alignment. The multiple sequence alignment of SARS-CoV-2 genomes was aligned with the sequence of the coronavirus genome of the Rhinolophus affinis bat (RaTG13)19 and visually inspected and adjusted in MEGA X44,45. Ultimately, the final alignment contained all genomic regions except ORF7b and non-coding regions (5’ and 3’ UTRs, and intergenic spacers). After these filtering and alignment steps, the multiple sequence alignment contained 29,115 sites and 29,681 SARS-CoV-2 genomes, which we refer to as the 29KG dataset.
Reference genomes and collection dates
We used the dates of viral collections provided by the GISAID database41 in all our analyses. All genomes were used in the mutation ordering analyses, but genomes with incomplete sampling dates were excluded from the spatiotemporal analyses and derived interpretations. We noted that the earliest sample included in GISAID, (ID: EPI_ISL_402123), was collected on 24 December 2019, although the NCBI website lists its collection date as 23 December 2019 (GenBank ID: MT019529). Therefore, we used the GISAID collection date for the sake of consistency. Regarding the NCBI reference genome (GenBank ID: NC_045512)46, this sample was collected on 26 December 201947. The collection date for the GISAID reference genome (GenBank ID: MN908947) is listed as 31 December 201948, although the patient was reported sick and admitted into the hospital on 26 December 2019 46. Thus, in our analyses, we used the GISAID collection date of 31 December 2019 for the GISAID reference genome to be consistent with previous studies.
Mutation order analyses (MOA)
We used a maximum likelihood method, SCITE 11, and variant co-occurrence analysis for reconstructing the order of mutations corresponding to 49 common variants (frequency > 1%) in the 29KG dataset. MOA has demonstrated high accuracy for analyzing tumor cell genomes that reproduce clonally, have sequencing errors, and exhibit limited sequence divergence11,12. In MOA, higher frequency variants are expected to have arisen earlier than low-frequency variants in clonally reproducing populations11,14. By using the highest frequency variants to anchor the analysis and the shared co-occurrence of variants among genomes to order mutations, while allowing probabilistically for sequencing error and pooled sequencing of genomes11, we evaluated and compared the likelihood of various possible mutational histories. MOA is different from traditional phylogenetic approaches where positions are treated independently, i.e., the shared co-occurrence of variants is not directly utilized in the inference procedure. Notably, both traditional phylogenetic and mutation order analyses are expected to produce concordant patterns when sequencing errors and other artifacts are minimized. However, sequencing errors and limited mutational input during the coronavirus history adversely impact traditional methods1,4,7, as does the fact that the closest coronaviruses useable as outgroups have more than a thousand differences from SARS-CoV-2 genomes that only differ in a handful of bases from each other1,4.
MOA requires a binary matrix of presence/absence of mutant for 29KG. We first designated differences from the bat RaTG13 genome by “1,” otherwise a “0” was assigned. This was simply an initial seed for the analysis, as subsequent iterations coded RaTG13 bases as the mutant (“1”) for each position individually and selected the coding that produced mutation graphs with the highest maximum likelihood and average shared co-occurrence index (COI) of variants. COI for a given variant (y) is the number of genomes that contain y and its directly preceding mutation (x) divided by the number of genomes that contain y. At the genomic position 25563, RaTG13 base A was not present except in one genome in the 29KG dataset, so we assigned the mutant status to the minority base (U; vf = 29.8%) and the reference status to the majority base (G), an assumption that was tested in the same way as above. All missing and ambiguous bases were coded to be ignored (missing data) in all the analyses.
In SCITE analyses, we first used default parameter settings of false-negative rate (FNR = 0.21545) and false-positive rate (FPR = 0.0000604). We carried out ten independent runs to ensure stability and convergence in analyzing a matrix of 49 × 29861 (SNVs × genomes). The mutation graph with the highest log likelihood (lnL = −204,622.9) was used to obtain 29KG collection-specific estimates of FNR and FPR by comparing the observed and predicted sequences based on this mutation graph. These estimated FNR (0.0202) and FPR (0.0491) were very different from the SCITE default parameters, where estimated FNR was much lower, whose use in SCITE produced mutation history graphs with a much higher log-likelihood (lnL = −84,134.5). This difference in error rates is unsurprising because we used only common variants (vf > 1%), and the 29KG dataset was not obtained from single-cell sequencing, in which the allele dropout during single-cell sequencing elevates FNR, i.e., mutant alleles are not sequenced.
We then reversed ancestor/mutant coding for each variant to ensure that the orientation of each mutation was optimal. 49 datasets were subjected to SCITE analyses (FNR = 0.0202 and FPR = 0.0491). The initial assignment of the RaTG13 base to be the ancestor was supported for 47 positions. The log-likelihood of mutation graphs with those assignments was significantly higher than the alternative (P< 0.01 using the AIC protocol in ref.49). This means that the Bat CoV base is likely the ancestral base for 95.9% of the variants with a frequency greater than 1%, similar to the pairwise sequence similarity observed between SARS-CoV-2 and RaTG13 CoV genomes (~96%). At one (position 25563) of the remaining two positions, the mutation history with the majority base (G) as the ancestral state received a significantly higher likelihood (P << 0.01). At the other position (3037), mutation history graphs from base C received significantly higher likelihood support (ΔlnL = 1621.7) than base U, which indicated that the RaTG13 base (U) was not ancestral. In this case, the co-occurrence index was also much higher for the mutation history graph generated by using base C as the ancestor (91%). Therefore, we re-coded the column for position 3037 and generated a new 49 × 29861 (SNVs × genomes) matrix to conduct a SCITE analysis. It produced a mutation graph with much higher log-likelihood (lnL = −25,979.1) and lower FNR = 0.00537 and FPR = 0.00193.
We then used the above analysis settings and performed 100 runs of SCITE. Ninety-five mutation history graphs with the best log-likelihood (lnL = −25,979.1) were found. We chose the mutation graph with the highest average COI (97%) and presented it in figure 1. In this mutation graph, COI for each variant is shown next to the arrow, and an arrow is drawn with a dotted line if it occurred in fewer than a majority of the equally likely graphs. Based on the direction of the mutations in 49 SNVs, we generated the sequence of the progenitor SARS-CoV-2 (proCoV2). We have made available the proCoV2 genome sequence in FastA format at http://igem.temple.edu/COVID-19, which is the same as the NCBI reference genome with base differences (positions 2416, 19524, 23929, 18060, 8782, and 28144) as discussed in the text.
Temporal concordance
Because mutation ordering analysis analyses did not use spatial or temporal information for genomes or mutations, it can be validated by evaluating the concordance of the inferred order of mutations with the timing of their first appearance (tf). For a mutation i, we compared its tfi with the tfj such that j is the nearest preceding mutation in the mutation graph for which tfi ≠ tfj. The condition was met for 47 out of 49 mutations (95.9%). Two offshoot mutants of (β3) were sampled earlier than their predecessors by ten days. COI of one variant (β3b) was low (54%), but the other variant (β3c) showed a very high COI (97%).
Genome phylogeny and classification based on the mutation order
Each node in the mutational history graph predicts an intermediate (ancestral) or a tip sequence, which contains all the mutations from that node to the root of the mutation graph. Then, the phylogeny of these sequences is the same as the topology of the mutation history graph that is drawn as a directional graph anchored on the root node. Every node in the mutation-based phylogeny (Fig. 2a) was encoded in a mutational signature consisting of a binary barcode showing the presence/absence of 49 variants. We mapped each of the 29K genomes to a node in the phylogeny based on the highest sequence similarity at positions containing 49 common SNVs. Mismatches were allowed, as sequencing errors could create them. A small fraction of genomes (1.8%) could not be mapped unambiguously to one node, so they were excluded and investigated in the future. The number of genomes assigned to each node is shown in Supplementary Table 1.
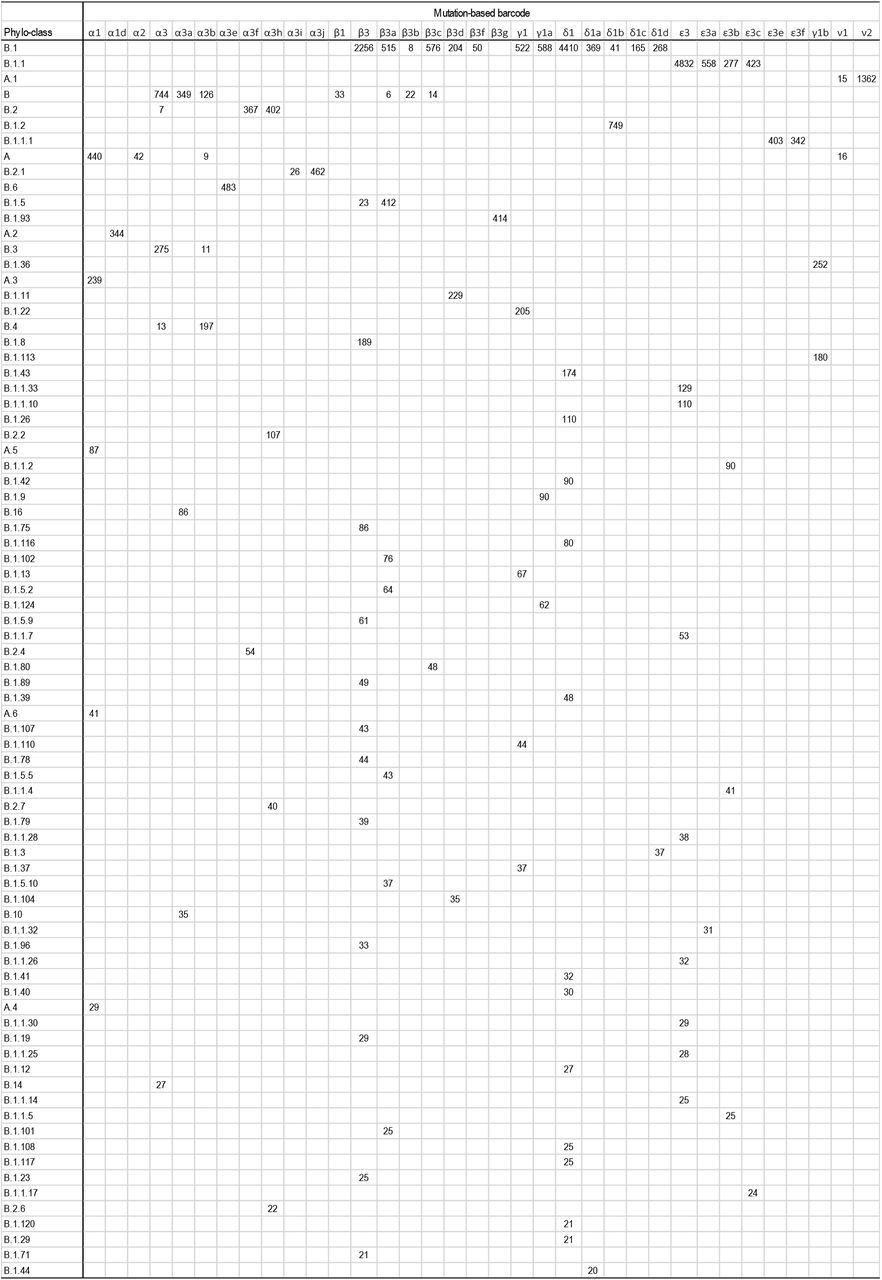
We compared our mutational classification with a phylogeny-based classification26 obtained using the Pangolin service (v2.0.3; https://pangolin.cog-uk.io/). Sequences from our alignment were submitted to the Pangolin website one-by-one, and a clade designation was received. The results are summarized in Supplementary Figure 1. In this table, all phylogenetic-groups with fewer than 20 genomes were excluded. Of the 80 phylogenetic groups shown, 74 are defined primarily by a single mutation-based barcode, as more than 90% of the genomes in those phylogenetic groups share the same barcode. This includes all small and medium-sized phylogenetic groups (up to 488 genomes) and two large groups (A.1 with 1,377 genomes and B.1.2 with 749 genomes). One large group, B.1.1, predominately connects with ε3 node (79%, 4,832 genomes), but some of its members belong to ε3 offshoots because they contain respective diagnostic mutations. For group B.1.1.1, two other ε3 offshoots are mixed up almost equally. Three other large differences between mutational barcoding and phylogeny-based grouping are seen for A, B, B1.1, and B.2. These differences are likely because the location of the root, as well as the earliest branching order of coronavirus lineages, is problematic in phylogeny-based classifications1,4,6,7. Overall, our mutation-based classification is more intuitive and can have higher resolution.
Tests for neutral evolution and episodic spread of variants
We tested the null hypothesis of the same molecular evolutionary patterns within the SARS-CoV-2 population and between species (i.e., Human SARS-CoV-2 and Bat RaTG13) by using a McDonald-Kreitman test38. The numbers of non-synonymous and synonymous polymorphisms with a frequency greater than 1% were 32 and 17, compared with the numbers of non-synonymous and synonymous fixed differences (170 and 958, respectively) inferred between proCoV2 and bat RaTG13 sequences. The McDonald-Kreitman test rejected the null overwhelmingly in a 2×2 contingency table analysis (P << 0.01).
We performed non-parametric Wald–Wolfowitz runs-tests50,51 to examine the temporally episodic spread of common mutants. Only one of the first six mutations was used because they were all sampled first on pandemic day 0. A test using 44 variants rejected the null hypothesis (P < 0.01) as did a test in the analysis that was restricted to variants with frequencies greater than 5% (P < 0.05). Therefore, the non-random spread of variants is statistically significant.
Data Availability and Code Availability
Live evolutionary history and spatiotemporal distributions of common variants are available at http://igem.temple.edu/COVID-19 (beta version). All genome sequences and metadata are available publically at GISAID (https://www.gisaid.org/) and predicted proCoV2 sequence is available at http://igem.temple.edu/COVID-19. The other relevant information is provided in the supplementary materials.
Author Contributions
S.K. conceived the project, designed analyses and visualizations, conducted analyses, and wrote the manuscript. S.M. designed and conducted analyses. S.P., S.W., and M.A.C.O. assembled sequence alignments. M.A.C.O., S.M., S.S., and Q.T. conducted analyses and rendered visualizations. S.P. and S.W. developed interactive visualizations. All authors intellectually contributed by discussing results and patterns, and everyone contributed to writing the manuscript.
Competing Interests
The authors declare that they have no competing interests.
Additional Information
Supplementary Information is available for this paper. Correspondence and requests for materials should be addressed to s.kumar{at}temple.edu.
SARS-CoV-2 variants and their molecular types and first timing and location.
A comparison of mutation-based and phylogeny-based classifications of 29KG genomes. Phylogeny-based classification is obtained by using the Pangolin service (v2.0.3; https://pangolin.cog-uk.io/). The value in each cell is the number of genomes that belong to the corresponding mutation-based and phylogeny-based groups. All phylogenetic-based groups with fewer than 20 genomes are excluded, and cells with fewer than five genomes matching have been left empty to make the comparison easier and to allow for sequencing and estimation errors.
Acknowledgments
We thank all the authors and organizations who have kindly deposited and shared genome data on GISAID (see http://igem.temple.edu/COVID-19 for a list of all the authors). We thank Ananias Escalante, Rob Kulathinal, Li Liu, Jose Barba-Montoya, Antonia Chroni, Ravi Patel, and Caryn Babaian for critical comments. We appreciate the technical support provided by Jared Knoblauch and Glen Stecher. This research was supported by grants from the U.S. National Science Foundation to S.K. (GCR-1934848 and DEB-2034228) and S.P. (DBI-2027196) and from the U.S. National Institutes of Health to S.K. (GM-0126567) and S.P. (AI-134384).
References


