

Abstract
Traditionally viewed as a motor control center, the cerebellum (CB) is now recognized as an integral part of a broad, long-range brain network that serves limbic functions and motivates behavior. This diverse CB functionality has been at least partly attributed to the multiplicity of its outputs. However, most studies have focused on cerebellar-cerebral cortical connections, at the expense of subcortical limbic structures. Nothing is known about how the CB connects to the nucleus accumbens (NAc), a subcortical region with which the CB shares functionality in motivated behaviors. Here, we report findings from in vivo electrophysiological experiments that investigated the functional connectivity between CB and NAc. We found that electrical microstimulation of deep cerebellar nuclei (DCN) modulates NAc spiking activity. This modulation differs in terms of directionality (excitatory vs. inhibitory) and temporal characteristics, in a manner that depends on NAc subregion: in the medial shell of NAc (NAcMed), slow inhibitory responses prevail over excitatory ones, whereas the proportion of fast excitatory responses is greater in the NAc core (NAcCore) compared to NAcMed.
Differences also exist in response onset latencies and dependence on CB stimulation intensity, which further argues for differential connectivity. If different pathways provide signal to each subregion, the divergence likely occurs downstream of the CB because we did not find any response-type clustering within DCN. We propose that the fast excitatory responses would be well poised to support rapid communication of information critical to the control of motivated behavior, such as prediction or prediction-error signals. The slower, less synchronous and longer-lasting modulation may be suggestive of a regulatory function, such as gain control of the communication between NAc and other brain regions. Finally, because there are no direct monosynaptic connections between CB and NAc, we performed viral tracing experiments to chart disynaptic pathways that could potentially mediate the newly discovered CB-NAc communication. We identified two anatomical pathways, which recruit the ventral tegmental area and intralaminar thalamus as nodes. These pathways and the functional connectivity they support could underlie the role of the CB in motivated behaviors.
Introduction
The cerebellum (CB) exploits the parallel, modular organization of its circuitry to integrate information and perform complex computations. Most cerebellar research sheds light on this complexity in the context of the CB’s role in updating and predicting motor movements1. However, accumulating evidence supports cerebellar involvement in high-order non-motor functions as well2–5. In humans, the CB is consistently activated during decision making, particularly during risk- or reward-based tasks6,7, and during aversive experiences and emotional learning8,9. Further support for non-motor roles of CB stems from clinical translational studies, which have linked CB dysfunction with neurodevelopmental disorders, posttraumatic stress disorder, generalized anxiety disorder, addiction, and cognitive and emotional disturbances known as cerebellar cognitive affective syndrome8,10–18. These findings are further corroborated by evidence from animal studies, which solidify a role for the CB in the processing of valence, reward, reward anticipation and omission19–23; emotional learning and aggression24–31; and motivation32–34.
The ability of the CB to derive a complex repertoire of non-motor functions from its relatively invariant cellular organization is largely attributed to its diverse outputs35–38. In addition to the heavily emphasized non-motor cerebellar influences on cortical regions39–45, functional and/or anatomical cerebellar connections with subcortical structures critical for cognition and emotion have also been documented37,46–50. Here, we focused on the nucleus accumbens (NAc), a complex limbic structure that shares reward, motivation and affective functionality with the CB51,52. Stimulation of CB cortex or deep cerebellar nuclei (DCN) modulates levels of NAc dopamine -- an important, but not exclusive, regulator of NAc functions53–59. However, how the CB connects to NAc is unknown.
Here we used in vivo electrophysiology in anesthetized mice to examine the effects of DCN stimulation on spiking activity in the NAc medial shell (NAcMed) and core (NAcCore). These regions exhibit distinct input-output organization, anatomy, and function60–65. We provide the first evidence, to our knowledge, of an electrophysiological connection between CB and NAc, which shows NAc subregion-dependent specificity. Using viral tracing approaches, we offer first insights on the anatomical blueprint of disynaptic CB-NAc connectivity, which includes nodal neurons in ventral tegmental area (VTA) and limbic thalamus. These findings may expound upon the involvement of the CB in limbic functions such as motivation, reward learning, and affective processing.
Materials and Methods
In vivo electrophysiology
Mice
C57Bl/6J mice of both sexes (N = 38) were used in accordance with the National Institutes of Health guidelines and the policies of the University of California Davis Committee for Animal Care. Acute in vivo recordings were performed at postnatal days P43-P64. All animals were maintained on a light/dark cycle (light 7AM-7PM), and experiments were performed during the light cycle.
Surgery
Anesthesia was initially induced by brief inhalation of 4-5% isoflurane followed by an intraperitoneal injection of anesthetic cocktail (100 mg/kg ketamine; 10 mg/kg xylazine; 1 mg/kg acepromazine), and was maintained with periodic injections of the anesthetic cocktail (20-50 mg/kg ketamine), as needed. Animals were placed in a stereotactic frame after confirmation of anesthesia depth using a toe pinch response test. Breathing rate and toe pinch responses were monitored to ensure maintenance of anesthesia. A small craniotomy and durectomy were performed over the DCN (lateral/interposed n.: relative to lambda, in mm: −2.1 to - 2.6 AP; +/-2.1 to +/-2.3 ML), and over NAc targeting the medial shell and/or core (relative to bregma: +1.7 to +1.54 AP; +/− 0.4 to +/-1.15 ML).
Stimulation
A custom stimulating stereotrode (~200 μm distance between tips) was lowered 1.95 - 2.45 mm below the brain surface (in DV axis) through the cerebellar craniotomy to reach the DCN. Ten trials of bipolar constant-current electrical microstimulation were delivered at each location at a 15-s inter-trial interval. Each stimulation trial consisted of a 200-Hz burst of five 0.5-ms monophasic square-waveform pulses at 100 μA. In a subset of experiments (N = 15 mice), the stimulation intensity was varied between 30, 100, and 300 μA in interleaved blocks of 5 trials per intensity. The use of stereotrode-delivered electrical stimuli in these experiments was instrumental in allowing us to 1) probe changes in NAc spiking activity in response to broad variations in current intensity; 2) exercise tight control over a small localized area; and 3) simultaneously stimulate all neurons in that area.
Data Acquisition
For electrophysiological recordings, a 12-channel (platinum; 0.2 - 2 MΩ impedance) axial multi-electrode array (FHC; 150 μm distance between channels), dipped in fluorescein dextran (3000 MW), was lowered into the NAc at a depth of 3.75 - 5.25 mm below the brain surface (DV axis). Electrode signals were fed to a digital headstage (RHD 2132, Intan Technologies) for amplification (x20), filtering (0.7 - 7500 Hz) and digitization (30 kS/s with 16-bit resolution), before transfer to an open-source acquisition system (OpenEphys) for display and storage.
Histology for Verification of Electrode Placement
Positioning of electrodes was initially guided by atlas-based stereotactic coordinates (Paxinos & Franklin) and, upon completion of experiments, histologically verified through electrolytic lesions (for location of DCN microstimulation electrodes; single 10-s cathodal pulse of 300 μA) and fluorescence imaging (NAc fluorescein dye track). Coordinates for subsequent animals of the same litter were further adjusted accordingly. Briefly, at the end of experiments electrodes were retracted and animals were perfused with 4% (w/v) paraformaldehyde (PFA) in 0.1 M phosphate buffer (PB). Brains were dissected and post-fixed in 4% PFA, sliced in phosphate buffered saline (PBS) and inspected under a fluorescence stereoscope (Olympus SZX2). NAc slices containing the dye track from the recording array were identified under 488 nm light, and CB slices with electrolytically lesioned tissue were identified under brightfield illumination. Slices of interest were subsequently stained with DAPI (1:20,000, Thermo Fisher Scientific), mounted on slides, and imaged using a VS120 Olympus slide scanner. Images were manually registered to the Paxinos and Franklin Mouse Brain Atlas and the location of the recording electrode tip was mapped. Only channels along the recording array that were determined to be within NAcMed and/or NAcCore were included in analysis. Similarly, experiments in which cerebellar electrolytic lesions were localized outside the lateral and/or interposed DCN were excluded from analysis.
Quantification and Statistical Analysis
Data processing and quantification
Custom-written MATLAB scripts (Mathworks) were used for data processing and analysis. Separation of multi-unit spikes from local field potentials was achieved through a 4th-order Butterworth high-pass filter (cutoff at 300 Hz). The filtered signal was thresholded at 3-3.5 standard deviations below the average voltage of a 10-s baseline (taken before stimulation onset), and neural firing rates were computed from the spike counts in consecutive 10-ms time bins (peri-stimulus time histogram; PSTH). Putative spikes with time differences less than 10 ms from stimulus artifacts or 2 ms from the previous spike were discarded.
To quantify the DCN stimulation-induced modulation of NAc spiking activity we first averaged the PSTH across all trials of the same intensity at the same recording and stimulation sites, and randomly permuted a trial-averaged 10-s pre-stimulus baseline 1,000 times. The observed trial-averaged PSTH was then z-transformed based on the mean and standard deviation of the randomization distribution (z-transformed firing rate). A change of firing rate from baseline was considered a response to DCN stimulation only if it (a) took place within the first 3 s following stimulus onset (response window), and (b) exceeded either a positive threshold of z = 4 (for excitatory responses) or a negative threshold of z = −3.4 (for inhibitory responses). The same thresholds were employed to identify responses of both NAc subregions and to all stimulation intensities that were tested in this study. Recordings with responses were categorized as responders (vs. non-responders). Extensive analyses of candidate thresholds (an example subset of the candidate thresholds we tested appears in Fig. 2S) allowed us to employ response thresholds that (a) kept the relative frequency of threshold crossings during a 3-s pre-stimulus baseline window (i.e., same duration as the response window) less than 5% (false positive responses; typically around 2-3%), and (b) the relative distribution of excitatory/inhibitory responses was robust to small changes in threshold. Onset latency of responses was quantified as the time of threshold crossing relative to stimulus onset.

A. Percent threshold crossings for pre-stimulus baseline (dotted lines) and during response window (solid lines) for different types of responses (red: inhibitory; blue: excitatory) in NAcMed (A1) and NAcCore (A2), as a function of threshold. DCN stimulation: 100 μA. Selected threshold values (vertical dashed line) maintain a maximum of 5% crossings during baseline (horizontal dashed line) for each response type and NAc subregion. B, Same as in A, but for subset of data that compared 3 DCN stimulation intensities (30, 100 and 300 μA).
Statistics
Unless otherwise noted, we performed all statistical comparisons using the random permutation method66,67. We randomly shuffled the data between groups 1,000 times and estimated the probability to find a difference greater than or equal to the observed difference by chance alone. To correct for multiple comparisons, we followed the Benjamini-Hochberg method68 with False Discovery Rate (FDR) set at 10%.
Anatomical Tracing
Surgery and viral injections
Mice of both sexes (P35 - P49) were anesthetized with isoflurane (4% - 5% induction; 1.5% maintenance) and secured to a stereotactic frame. After exposing the top of the skull, the head was leveled and small craniotomies were drilled over areas of interest. Injections were made using a Micro4 controller and UltraMicroPump 3 (VWR). Glass needles were made from 1-mm outer diameter glass pipettes (Wiretrol II, Drummond) pulled to a fine tip (20 - 50 μm tip diameter, 3 - 4 mm tip length) using a pipette puller (P-97, Sutter). Needles were left in place for 7-10 min following injections to minimize diffusion. Following surgery and analgesia administration (0.1 mg/kg buprenorphine, 5 mg/kg meloxicam), mice were allowed to recover on a warm heating pad before being transferred back to the vivarium. Mice remained in the colony to allow for recovery and retrograde labeling/virus expression for 2-3 weeks prior to euthanasia and tissue collection/processing.
For co-localization experiments (Fig. 6): AAV9-CAG-GFP (2 × 10¹² viral particles/ml, UNC viral core) was injected in DCN (from bregma, in mm: medial n.: −2.55 AP, ± 0.75 ML, −2.1 DV, 50 nl; interposed n.: −2.5 AP, ± 1.55 ML, −2.1 DV, 50 nl; lateral n.: −2.2 AP, ± 2.3 ML, −2.12 DV, 50 nl; and −1.8, ± 2.35 ML, −2.12 DV, 50 nl). Cholera toxin subunit B (ctb)-640 or −568 (5 mg/ml, Biotium) was injected in NAc medial shell and core (from bregma, in mm: 1.8 AP, ± 0.8 ML, −4.2 DV, 200 nl). For anterograde transsynaptic tracing (Fig. 7): AAV1-hSyn-Cre-WPRE-hGH (1013 gc/ml, Addgene; 1:10 dilution) was injected in DCN (coordinates as above). AAV5-CAG-FLEX-tdTomato (7.8 × 10¹² viral particles/ml, UNC viral core; 1:2 dilution) or AAV5-pCAG-FLEX-EGFP-WPRE (1.1 × 10¹³ gc/ml, Addgene; 1:2 dilution) was injected in VTA (from bregma, in mm: 2.8 AP, ± 0.35 ML, −4.2 DV, 100 nl; and −2.85 AP, ± 0.6 ML, −4.2 DV, 100 nl) or thalamus (from bregma, in mm: −0.85 AP, ± 0.3 ML, −3.3 DV, 300 nl; and −1.2 AP, ± 0.5 ML, −3.5 DV, 300 nl; 1:5 dilution).
Histology and fluorescence microscopy
Two to three weeks following tracer/virus injections, mice were anesthetized with an anesthetic cocktail (100 mg/kg ketamine, 10 mg/kg xylazine, 1 mg/kg acepromazine) and perfused transcardially with 4% (w/v) PFA in PB. Brains were post-fixed in 4% PFA for 6 h and transferred to 30% sucrose in PBS for overnight incubation at 4°C. Brains were coronally sectioned (60 μm) on a sliding microtome, stained with DAPI, mounted to slides, coverslipped with Mowiol-based antifade solution and imaged. VTA sections were immunostained for tyrosine hydroxylase (TH) prior to mounting, as follows: slices were first incubated with blocking solution [10% normal goat serum (NGS) in PBS supplemented with 0.3% Triton-X100; PBST] for 1 h at room temperature, then with mouse anti-TH (clone LNC11, Millipore Sigma; 1:1000) in blocking solution with 2% NGS overnight at 4°C. Sections were washed with PBST (3 × 20 min) and incubated for 1 h at room temperature with goat anti-mouse Alexa fluor 488 secondary antibody (1:1000), washed with PBS (3 × 20 min), mounted, coverslipped and imaged. Epifluorescence image mosaics were acquired on an Olympus VS120 slide scanner with a 10x air objective. High magnification confocal images were taken sequentially with different laser lines and a 60x oil-immersion objective on a Zeiss LSM800 microscope with Airyscan. Image brightness/contrast was adjusted using ImageJ (NIH) for display purposes.
Results
DCN microstimulation bidirectionally alters NAc spiking activity
To examine functional connectivity between CB and NAc, we recorded ongoing spiking activity from NAcMed and NAcCore in vivo and electrically microstimulated the DCN (Fig. 1A,B). We primarily targeted the lateral DCN, activation of which has been shown to modulate levels of dopamine in NAc55. In a subset of experiments, post-hoc analysis localized the bipolar stimulating electrode in the interposed DCN, and these data were included in our analysis. Activation of DCN with 100-μA current pulses evoked two distinct types of responses in NAc: inhibitory (Fig. 1C) and excitatory (Fig. 1D). We define a response as the positive and/or negative threshold-crossing spiking activity that occurred within 3 s from stimulus presentation. The time course of all positive (blue) and negative (red) threshold-crossing spiking activity throughout the 10-s trial can be seen in the peri-stimulus time histograms in Fig. 2 (Fig. 2A1,A2). Analysis of NAc responses revealed differences in the prevalence of each response type (i.e., inhibitory vs. excitatory), based on NAc subregion. In NAcMed, DCN microstimulation elicited a significant number of inhibitory responses compared to pre-stimulus baseline (Fig. 2B,C and Table 1A,B) (proportion of inhibitory responses in NAcMed: 11.1%, comparison to prestimulus baseline activity: p = 0.0), as well as some excitatory responses (5.5%); however, the proportion of the latter did not differ significantly from that expected by chance alone (p = 0.16)(Fig. 2C). By contrast, DCN microstimulation elicited a significant number of both inhibitory and excitatory responses in NAcCore (Fig. 2B,C) (5.7% inh.: p = 0.005; 15.7% excit.: p = 0.0). Even though the prevalence of all (pooled excitatory and inhibitory) responses was not different between NAcMed and NAcCore (Table 1C; p = 0.1), the proportion of excitatory vs inhibitory responses was significantly different in both NAcMed and NAcCore (Table 1D; p = 0.0 for both subregions). Finally, comparisons between NAc subregions (Table 1E) indicated that the NAcCore displayed significantly more excitatory responses than the NAcMed (p = 0.0) and that the NAcMed displayed significantly more inhibitory responses than the NAcCore (p = 0.059).

A, Schematic diagram of recording setup. Recording electrode array was lowered into NAc and bipolar stimulating electrode was lowered into deep cerebellar nuclei. Stimulation protocol consisted of 10 trials (inter-trial interval: 15 s) of five 100-μA, 0.5-ms pulses at 200 Hz. B, Recording sites in NAcMed and NAcCore. Numbers at bottom of slices indicate distance from bregma. C-D, Examples of inhibitory and excitatory responses in NAcMed (C) and NAcCore (D), respectively, as a function of time. Top, 4-s raster plots of spiking activity; Middle, Peri-stimulus time histograms of firing rate (10-ms bin); Bottom, Average firing rate, normalized to baseline (z-score). Red dotted lines indicate response threshold, set at −3.4 for inhibitory responses and +4.0 for excitatory responses. Stimulus artifacts have been masked for clarity (teal bars).
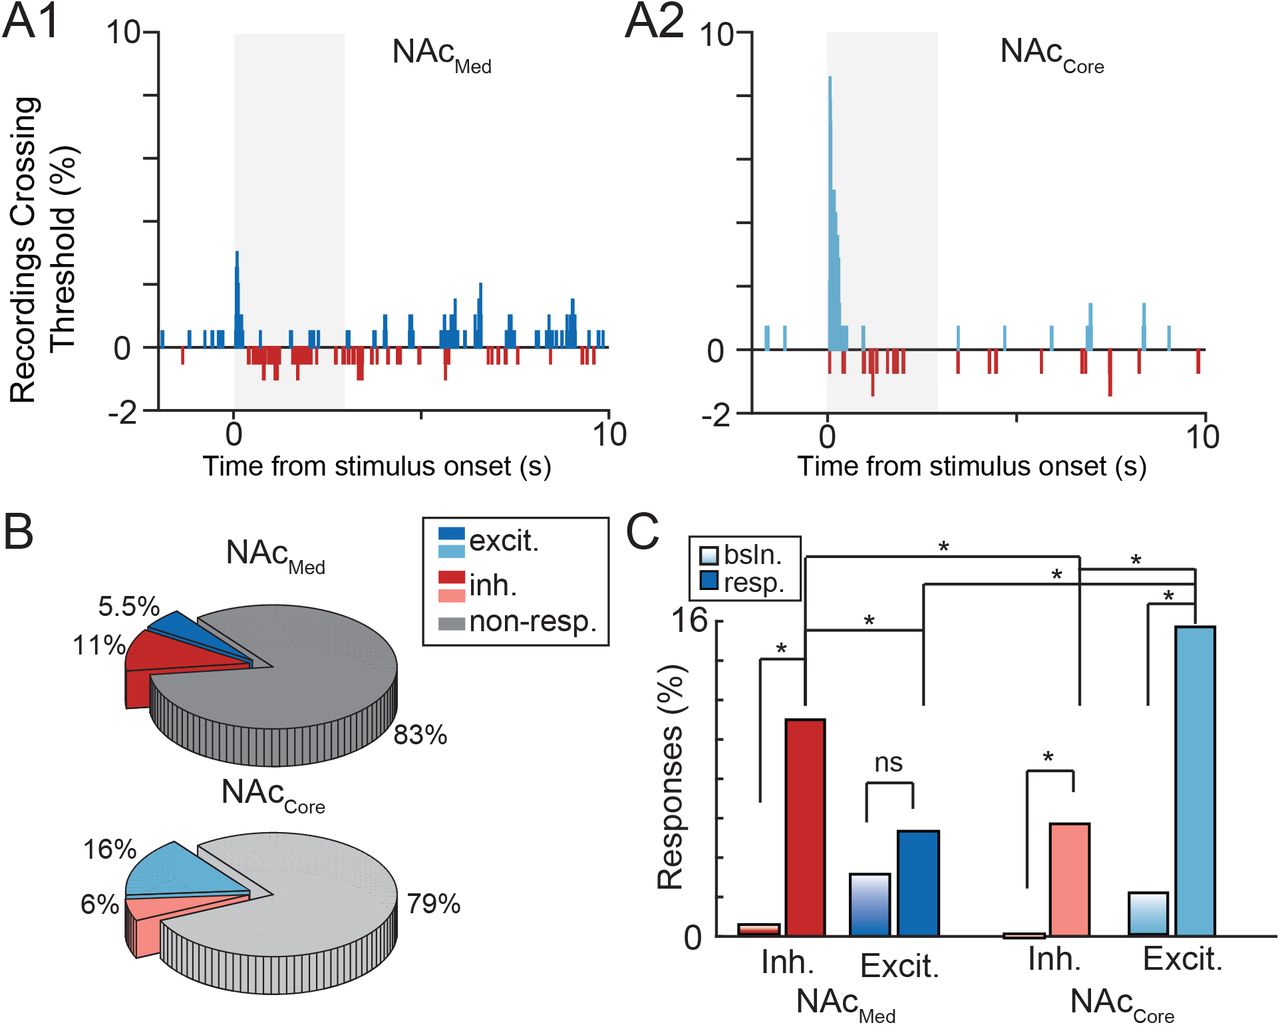
A, Percent of recordings crossing positive (blue) or negative (red) threshold at each 10-ms time bin for NAcMed (A1) and NAcCore (A2) regions, as a function of time. Shaded area indicates 3-s response window. B, Pie charts of distribution of response types in NAcMed and NAcCore. Recordings that cross positive threshold within the response window are classified as excitatory (blue); recordings that cross negative threshold as inhibitory (red); recordings that do not cross either threshold as non-responders (gray). C, Comparison of % recordings crossing threshold during pre-stimulus baseline (bsln.) vs. response window (resp.), separated by type (excitatory, inhibitory) and NAc region (medial shell, core). * stat. sig., corrected for multiple comparisons (FDR <10%).
To ensure that the observed relationships between excitatory and inhibitory responses in NAcMed and NAcCore did not hinge on response thresholds, we quantified proportions of responses for different threshold values (Fig. 2S). We chose values that maintained a maximum of 5% threshold crossings during pre-stimulus baseline (i.e., false positive response rate not greater than 5%). We found that the relative distribution of excitatory and inhibitory responses was robust to small changes in threshold. Together, these results suggest that (a) activation of DCN can modulate ongoing spiking activity in NAc and (b) this modulation is both inhibitory and excitatory. Interestingly, (c) excitatory modulation of spiking activity is more prevalent in NAcCore than in NAcMed; and (d) in NAcMed, inhibitory modulation is more prevalent than in NAcCore.
Temporal profiles of NAc responses
We subsequently evaluated the temporal profiles of NAc responses to DCN microstimulation. In both NAcMed and NAcCore, excitatory responses appeared to precede inhibitory ones (Fig. 2A1,A2). This can be seen more clearly in 3D color plots (Fig. 3A,B), in which all excitatory and inhibitory responders are aligned to the time of stimulus onset and ordered by response-onset latency, with the z-transformed firing rate represented by color (corresponding color plots of all non-responders ordered by latency of peak activity are shown in Fig. 3S). To quantitatively describe these differences, we compared onset latencies for excitatory and inhibitory responses using multiple-comparison-corrected random permutation tests (Fig. 3C and Table 1F,G). We found that excitatory responses were significantly faster (i.e., had shorter onset latencies) than inhibitory ones both in NAcMed (mean ± SEM: excit.: 0.60 ± 0.26 s, inh.: 1.40 ± 0.15 s, p = 0.001) and in NAcCore (mean ± SEM: excit.: 0.15 ± 0.04 s, inh.: 0.97 ± 0.18 s, p = 0.0). Irrespective of type, responses were faster in NAcCore than in NAcMed (excit: p = 0.022, inh.: 0.049), which further supports differential connectivity.

Firing rate (z-score) of non-responders, ordered on the y-axis by latency of peak response amplitude, as a function of time.
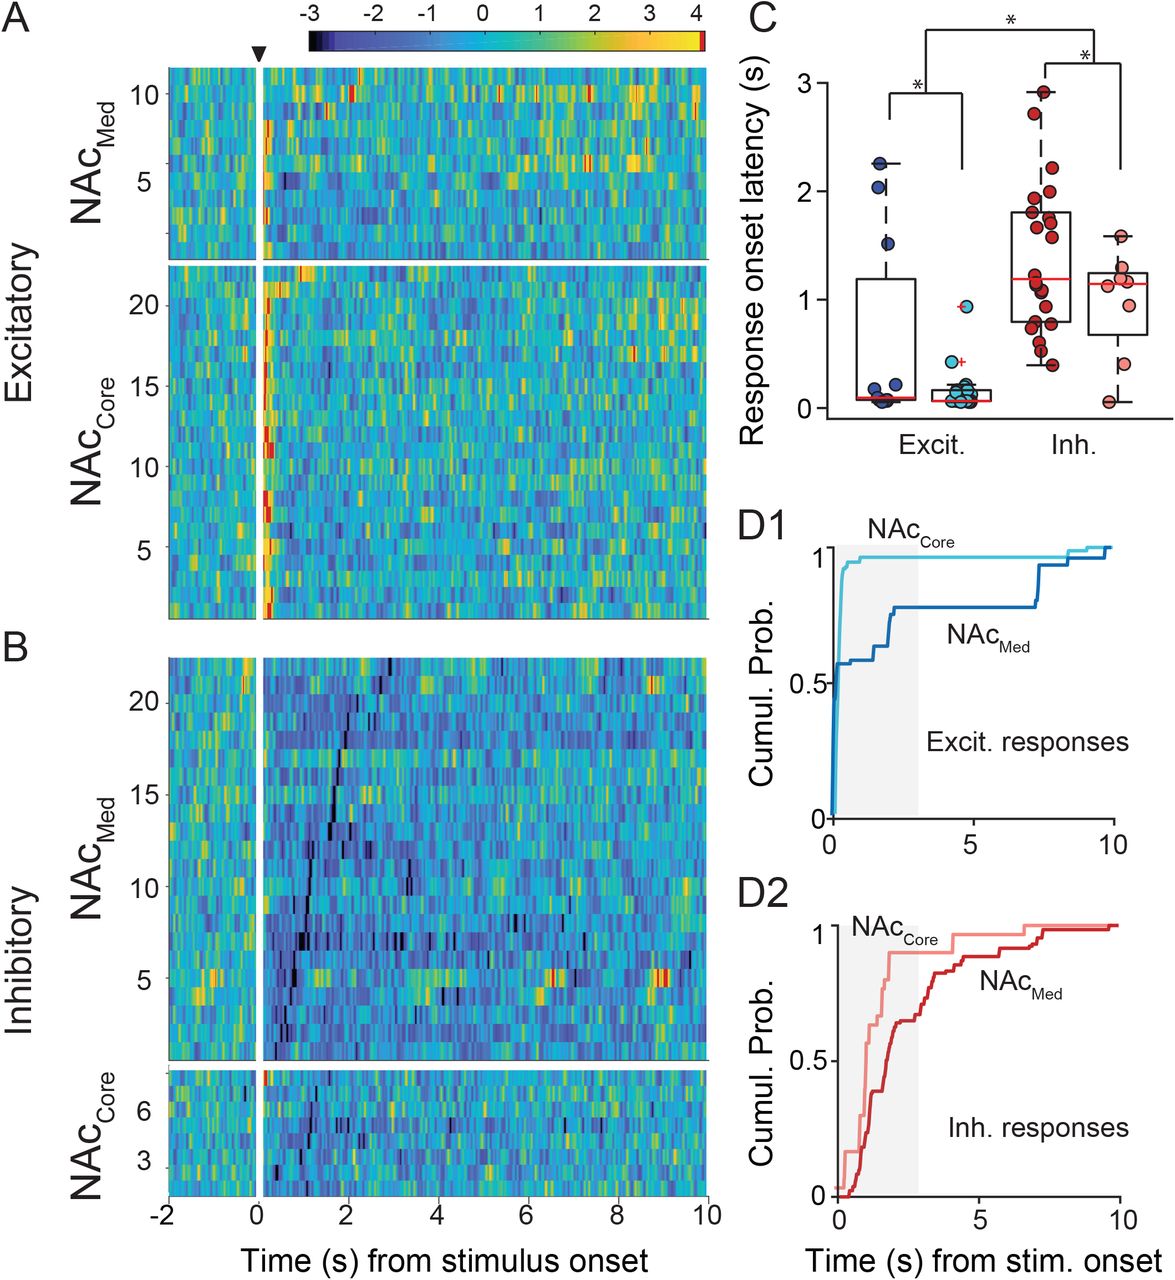
A,B, Heat maps of firing rate (z-score) of excitatory (A) and inhibitory (B) responses in NAcMed and NAcCore, as a function of time. Responses were ordered on the y-axis by onset latency. Black triangle denotes time of stimulation; white vertical bars mask stimulus artifact for clarity. C, Box plots (and raw data) for comparison of onset latencies for excitatory and inhibitory responses within each NAc subregion. * stat. sig., corrected for multiple comparisons (FDR<10%). D1,D2, Cumulative probability histograms of threshold crossings for excitatory (D1) and inhibitory (D2) responses in NAcMed and NAcCore, with most crossings falling within 3 s of stimulus onset (shaded region).
To evaluate the time period over which NAc spiking activity remained supra-threshold, we plotted the cumulative probability of threshold crossings in NAcMed and NAcCore excitatory and inhibitory responders as a function of time from stimulus onset (Fig. 3D1,D2). These plots are also informative of how fast, and presumably synchronous, the initial rise in activity was. An advantage of this approach of extracting information on temporal characteristics is that it does not impose a theoretical model on the data, which may or may not fit the data adequately. We found that excitatory responses were indeed faster and shorter-lived than inhibitory responses in both NAc subregions [Table 1H; 50% rise-time (in s): NAcMed: excit.: 0.21; inh.: 1.72, permutation test, p = 0.013; NAcCore: excit.: 0.18, inh.: 1.20, permutation test, p = 0.0]. The 50% rise-times of excitatory responses in NAcMed and NAcCore were not significantly different (p = 0.27), despite the few threshold crossings observed at later time points (Fig. 3D1). In contrast, the difference between NAcMed and NAcCore inhibitory responses (Fig. 3D2) was significant (p = 0.035). Collectively, these results suggest that DCN microstimulation reliably evokes fast, short-lived excitatory responses and slower, temporally protracted inhibitory responses in NAc.
Spatial considerations for electrical stimulation
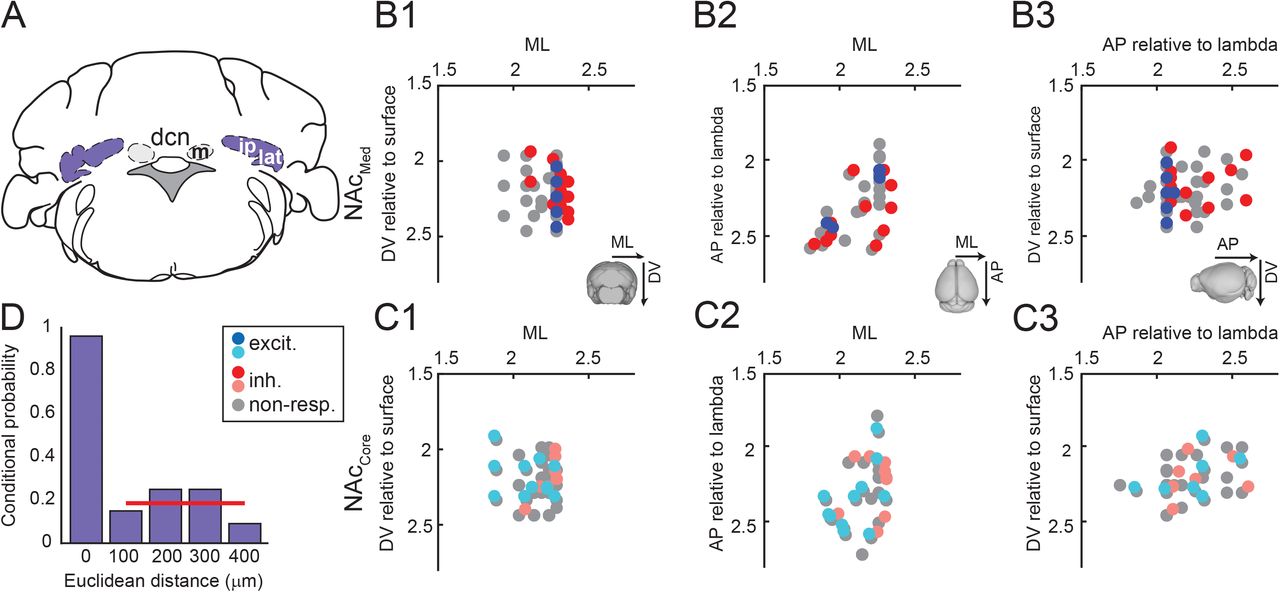
To contain the spread of electrical current at DCN stimulation sites, we used bipolar stimulation electrodes. To confirm that the stimulation was indeed localized, we performed current-spread analysis (Fig. 4D), which took advantage of the fact that we probed individual NAc recording sites with stimuli delivered at multiple DCN sites. We quantified the likelihood that stimulation of a DCN site would evoke a significant excitatory or inhibitory response at a given NAc site and plotted likelihood values as a function of the Euclidean distance from the DCN site that evoked the strongest response at that NAc site (most effective DCN stimulation site, at d = 0 μm). We reasoned that if the electrical current spread over a large radius from the most effective DCN site, stimulation of other sites within that radius would also evoke NAc responses with likelihood greater than expected by chance. We found that even at close distances (100 μm) from the most effective site, the probability of a DCN stimulation site evoking a significant response was not different from the marginal probability (i.e., the probability to evoke a response across all recordings, regardless of distance from the most effective site) (Table 1I; p = 0.49). This result confirms that our stimulation was localized.

A, The lateral or interposed DCN was electrically stimulated. Abbreviations: m: medial n., ip: interposed n.; lat: lateral n. B,C, Stereotactic coordinates of DCN stimulation sites in ML-DV (B1,C1), ML-AP (B2,C2), and AP-DV (B3,C3) planes. Colored dots denote sites that evoked excitatory (blue), inhibitory (red), or no responses (gray) in NAcMed (B) and NAcCore (C). Abbreviations: ML: medio-lateral, DV: dorso-ventral, AP: antero-posterior, excit.: excitatory, inh.: inhibitory, non-resp.: non-responding. D, Spatial resolution of stimulation (current spread analysis). Plot of the probability that a stimulation site would elicit a NAc response at various distances from the DCN site that elicited the strongest response in each experiment (most effective site at distance d = 0 μm). Red horizontal line shows marginal response probability across all experiments.
Given that DCN stimulation was localized, could the observed differences in NAc response types arise from regional differences within DCN? To address this question, we examined whether there was clustering of DCN sites with respect to their effectiveness to evoke significant excitatory or inhibitory responses in NAcMed and/or NAcCore. We did not find indications of such clustering (Fig. 4B,C), which argues against topographical organization of lateral DCN with respect to NAc response types. Using a similar approach, we examined whether there was topographical clustering of excitatory and/or inhibitory responder sites within NAc subregions, but we did not find evidence for any such organization either (not shown).
Differential and non-linear dependence of NAc responses on DCN stimulation intensity
To further probe the functional connectivity between DCN and NAc, in a subset of experiments we assessed the effectiveness of DCN microstimulation to modulate spiking activity in NAcMed and NAcCore at three different intensities: 30 μA, 100 μA, and 300 μA. We found that the ~3-fold change in stimulation intensity had (a) differential effects based on response type and NAc subregion, and (b) non-linear effects on the prevalence of response types in both NAc subregions.
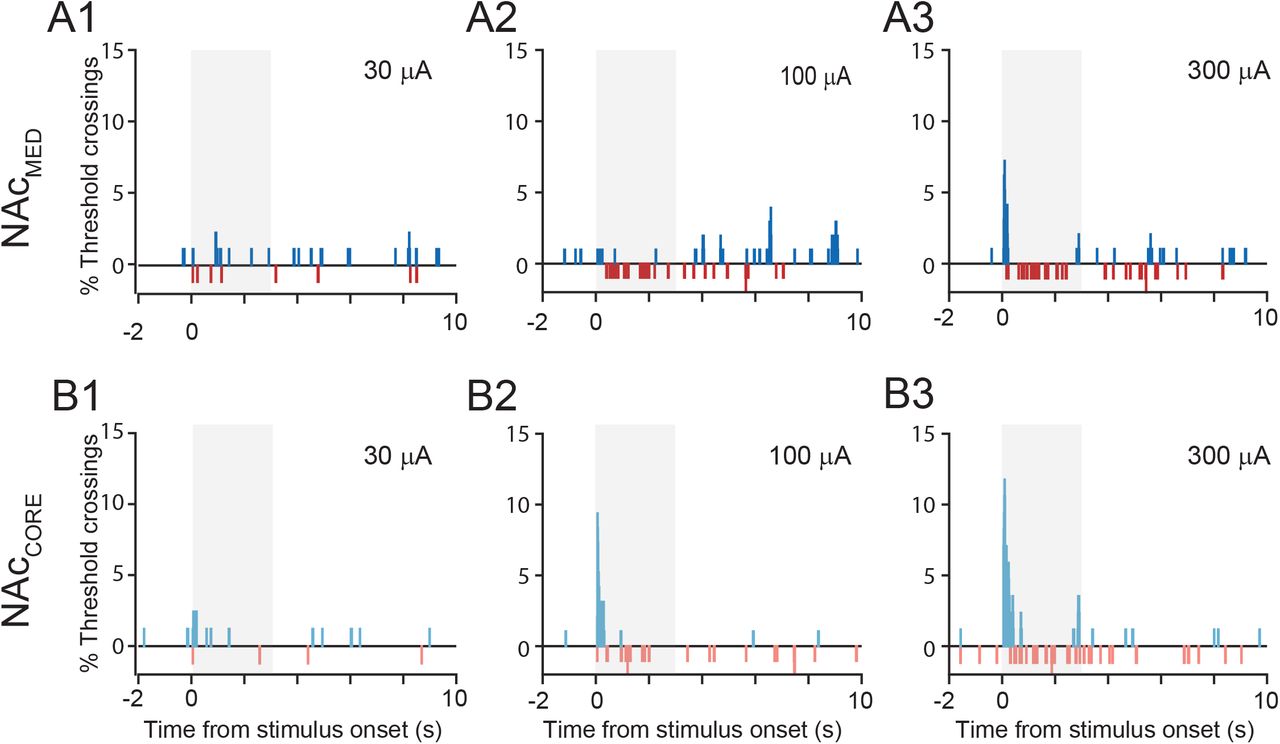
Specifically, weak (30 μA) DCN microstimulation effectively evoked a small but significantly greater-than-baseline number of only excitatory responses and only in NAcMed (Fig. 5A,B and Table 2A,B,D) (proportion of responses: NAcMed: excit.: 11.5%; compared to pre-stimulus baseline, p = 0.021; inh.: 4.6%, compared to pre-stimulus baseline, p = 0.193; excit. vs. inh. in NAcMed: p = 0.005; NAcCore: excit.: 8.5%, compared to pre-stimulus baseline, p = 0.08; inh.: 2.4 %, compared to pre-stimulus baseline, p = 0.24). Interestingly, after increasing intensity to 100 μA, only inhibitory responses could be evoked reliably above baseline in NAcMed (proportion of responses: inh.: 13.7%, compared to pre-stimulus baseline, p = 0.0; excit.: 3.9%, compared to pre-stimulus baseline, p = 0.51; exc. vs. inh. in NAcMed: p = 0.0). By contrast, in NAcCore 100-μA DCN microstimulation reliably evoked both excitatory and inhibitory responses (exc.: 12.5%, compared to pre-stimulus baseline, p = 0.0; inh.: 7.3%, compared to pre-stimulus baseline, p = 0.006), with the prevalence of excitatory responses being significantly greater than inhibitory ones (exc. vs. inh. in NAcCore: p = 0.006). The differential effect of 100-μA microstimulation on NAc subregions was statistically significant: more excitatory responses were evoked in NAcCore than in NAcMed (Table 2E; p = 0.03), whereas the prevalence of inhibitory responses was similar between subregions (p = 0.1).

A, Distribution of response types in NAcMed (A1) and NAcCore (A2) evoked by 30, 100, and 300 μA DCN microstimulation. B, Comparison of % recordings crossing threshold during pre-stimulus baseline (bsln) vs. response window, by response type (excitatory, inhibitory), stimulation intensity (30, 100, 300 μA), and NAc subregion (medial shell, core). * stat. sig., corrected for multiple comparisons (FDR<10%). For clarity we only indicate statistically significant differences from pre-stimulus baseline and across intensities within each response type and NAc subregion (see also Table 2). C, Firing rate (z-score) heat maps of excitatory and inhibitory responses in NAcMed and NAcCore, as a function of time. Responses were ordered on the y-axis by onset latency. Black triangle denotes time of stimulation; white vertical bars mask stimulus artifact for clarity. D, Boxplots of onset latencies for excitatory and inhibitory responses in NAcMed (top) and NAcCore (bottom) elicited by 30, 100, and 300 μA DCN stimulation. Figure legend in A also applies to panels B and D. Abbreviations: non-resp.: non-responding, inh.: inhibitory, excit.: excitatory.
Finally, the 300-μΑ DCN microstimulation evoked significant proportions of both excitatory and inhibitory responses in NAcMed (excit.: 16.5%, compared to pre-stimulus baseline, p = 0.0; inh.: 14.4%, compared to pre-stimulus baseline, p = 0.0), with similar prevalence (exc. vs. inh.: p = 0.8). In NAcCore, this stimulation regime reliably evoked excitatory but not inhibitory responses (exc.: 25.9%, compared to pre-stimulus baseline, p = 0.0; inh.: 10.6%, compared to pre-stimulus baseline, p = 0.07) (exc. vs. inh.: p = 0.0). However, the effect on NAc subregions did not reach statistical significance (excit.: p = 0.11 for NAcMed vs. NAcCore; inh.: p = 0.29 for NAcMed vs. NAcCore) (Table 2A-E).
The non-linear effects of stimulation intensity can be appreciated if we consider the change in the prevalence of response types across different intensities (Fig. 5B; Table 2F). Specifically for excitatory responses, increasing stimulation intensity from 30 μA to 100 μA did not increase response prevalence in either NAcMed or NAcCore. In fact, NAcMed showed significantly decreased responses (excit.: 30 vs. 100 μA: NAcCore: p = 0.17; NAcMed: p = 0.023). Further increasing stimulation intensity from 100 μA to 300 μA significantly increased excitatory responses in both NAcMed and NAcCore (excit.: 100 vs. 300 μA: NAcMed: p = 0.002; NAcCore: p = 0.0). By contrast, for inhibitory responses a 30-to-100 μA change in stimulus intensity was sufficient to significantly increase response prevalence in both NAcMed and NAcCore (inh.: 30 vs. 100 μA: NAcMed: p = 0.011; NAcCore: p = 0.0). Further increase to 300 μA did not significantly affect inhibitory response prevalence in either subregion (inh.: 100 vs. 300 μA: NAcMed: p = 0.4; NAcCore: p = 0.3). Notably, the localized nature of DCN stimulation was not compromised at 300 μA (comparison to marginal probability at 100 μm from most effective DCN site: p = 0.3; Table 2J,K).
Collectively, these results paint a picture of complex dynamics of NAc modulation by DCN: although, overall, stronger DCN stimulation increases NAc responsiveness, the relationship is highly non-linear, and the ratio of excitation/inhibition varies (and is even reversed in some cases) in a subregion- and stimulation regime-dependent manner. Moreover, the threshold for NAc modulation appears to depend on response-type, with excitatory responses being more sensitive to DCN stimulation than inhibitory ones.
Response onset latencies are largely unaffected by DCN stimulation intensity
To investigate effects of DCN input strength on temporal characteristics of NAc responses, we examined the dependence of response onset latencies on DCN stimulation intensity in the subset of experiments that involved testing of all three intensities (Fig. 5D). After correction for multiple comparisons, we confirmed that overall, excitatory responses were significantly faster than inhibitory ones (Fig. 5D and Table 2G,H). The temporal profile differences between excitatory and inhibitory responses are also apparent in the 3-D color plots of z-transformed spiking activity for inhibitory and excitatory responders (Fig. 5C), as well as the frequency histograms of threshold crossings across all recorded sites (Fig. 5S). We did not find significant differences in response onset latency across the three stimulation intensities (Table 2I). This result shows that the strength of DCN stimulation modulates NAc response prevalence but not onset latency.

A,B, Time histograms of % recordings in NAcMed (A) and NAcCore (B) that cross positive (blue) or negative (red) threshold at each 10-ms time bin, for DCN stimulation intensity of 30 μA (A1,B1), 100 μA (A2,B2) and 300 μA (A3,B3). Shaded region designates 3-s response window.
Anatomical blueprint of CB-NAc connectivity
There are no direct, monosynaptic connections between DCN and NAc (Allen Brain Atlas, and our own observations); we therefore hypothesized the existence of at least disynaptic anatomical pathways between the two regions. To test this hypothesis, we adopted a 2-prong approach. First, we combined injection of a retrograde tracer (cholera toxin subunit B (ctb) −640 or −568) in NAc with injection of an anterograde viral tracer (AAV9-CAG-GFP) in DCN to identify areas of overlap (nodes) in a putative disynaptic CB-NAc circuit (Fig. 6A,B). Histological processing and high resolution confocal imaging of brain sections (N = 4 mice with successful NAc and DCN injections, without spill to neighboring regions) revealed two regions of overlap between ctb-filled neurons that project to NAc and GFP-labelled DCN axonal projections: the VTA and limbic thalamus (Fig. 6C,D). In VTA, most areas of overlap localized medially and caudally and involved both TH+ (dopaminergic) neurons (Fig. 6C) and TH-neurons. In the thalamus, we found areas of overlap in parafascicular (PF) and anterior centromedial (CM) intralaminar nuclei (Fig. 6D). We found overlap in these same regions also when DCN injections were restricted to the lateral n. (Fig. 6E,F; N = 2). These results are consistent with the existence of a disynaptic DCN-NAc anatomical circuit and point to VTA and intralaminar thalamic nuclei as putative nodes.

A, Schematic diagrams of stereotactic injections in DCN and NAc. B1, Expression of GFP at DCN injection sites. B2, Ctb-568 injection site in NAc. C, Overlap of ctb-labeled NAc projectors and DCN axons in VTA. C1, VTA identification through TH immunostaining. C2, TH+ neuron. C3, Retrograde ctb-568 labelling Ctb in NAc-projecting cell. C4, GFP-expressing DCN axons. C5, C2-C4 merged. D, Overlap of ctb retrograde label (red) in NAc projectors (blue; NeuN) and GFP-expressing DCN axons (green) in intralaminar thalamic nuclei. D1-D2, Overlap in parafascicular (PF) n. D3-D4, Overlap in centromedial (CM) n. Yellow boxes in C1,D1,D3 denote zoom-in areas depicted in C2-C5, D2 and D4, respectively. E-F, Airyscan confocal images from experiments similar to A but with only lateral DCN injected with AAV-GFP. E1, Ctb-labeled (red) NAc-projecting cell in the VTA. E2, TH+ cell (blue) with overlapping GFP-labeled axonal projection (green) from lateral DCN. E3,E1-2 merged. F1, GFP-labeled axon from lateral DCN (green) overlaps with ctb-labeled (red) NAc-projecting cell (blue: NeuN) in the PF n. F2, Same as in F1 but for neuron in the CM n. Scale bars: B1-2,C1,D1: 200 μm; C2-C5,D2,D4,E1-3,F1,F2: 5 μm; D3: 100 μm. Numbers denote distance from bregma.
To confirm these observations through an independent approach, we performed AAV1-mediated anterograde transsynaptic tracing experiments69 via stereotactic injections of AAV1-Cre in DCN and AAV-FLEX-tdTomato in VTA or limbic thalamus (Fig. 7A,B; N = 3). This approach relies on the transsynaptic transfer of Cre to postsynaptic neurons, which, once infected with a floxed fluorophore, become fluorescently labeled. With this method, we confirmed the existence of neurons receiving CB input in VTA (Fig. 7C1,C2) and limbic thalamus (Fig. 7D1,D2). Importantly, we were able to localize their labeled axonal projections in NAc, in both NAcMed and NAcCore (Fig. 7C3,D3). We observed similar patterns of cell labeling and projections to the NAcMed and NAcCore when AAV1-Cre was injected in lateral DCN only (Fig. 7E,F; n = 2). These findings chart the blueprint of disynaptic DCN-NAc connectivity and could provide an anatomical foundation for our newly discovered DCN-NAc functional connection.

A, Schematic diagram of AAV1-mediated transsynaptic labeling approach. B, Schematic diagrams of stereotactic injections of floxed fluorophore in VTA and thalamic nodes. C1, The VTA is visualized via TH immunostaining (green). Yellow box denotes zoom-in area depicted in C2. Rn: red nucleus; ml: medial lemniscus. C2, Neurons that receive DCN input are labeled with tdTomato (red; white arrowheads). Green: TH+ neurons (white arrows). Orange: TH+, tdTomato+ neuron (yellow arrowhead). C3, Projections of CB-VTA neurons in NAc medial shell (NAcMed) and core (NAcCore). D1, Neurons that receive DCN input in thalamus are labeled with tdTomato (red). Blue: NeuN. CM: centromedial n.; PC: paracentral n.; CL: centrolateral n.; VL: ventrolateral n. D2, Same as D1, but for parafascicular n. (PF). fr: fasciculus retroflexus. D3, Projections of CB-thalamic neurons in NAcMed and NAcCore. E-F, Fluorescence images from experiments similar to A-B but with only lateral DCN injected with AAV-Cre. E, NAc projections of VTA neurons receiving input from lateral DCN. F, Same as in E but for thalamic neurons. Scale bars below images: C1:200 μm; C2: 100 μm; C3,D1-3,E,F: 500 μm. Numbers denote distance from bregma.
Discussion
In this study we examined the uncharted functional connectivity between CB and NAc through in vivo electrophysiology and neuroanatomy. We found that electrical microstimulation of DCN modulates spiking activity in NAc and elicits responses in both NAcMed and NAcCore. In both subregions, these responses manifested as inhibitory and/or excitatory modulations of spiking activity and exhibited NAc subregion-specificity with respect to response-type prevalence, dependence on stimulus intensity, and response latency.
First, we found that weak DCN stimulation reliably evoked only excitatory responses and only in NAcMed. At a moderate stimulation intensity, the excitation/inhibition ratio reversed and only inhibitory responses were observed reliably. This finding was observed in NAcMed but not in NAcCore even when the same DCN site was stimulated, which suggests that it emerges from circuit properties downstream of the DCN. At the strongest DCN stimulation, NAcMed responded with both excitatory and inhibitory responses at similar proportions. The DCN stimulation threshold for modulating responses was higher in NAcCore compared to NAcMed because moderate stimulation was needed to reliably induce inhibitory or excitatory responses in this subregion. The strongest DCN stimulation regime preferentially increased excitatory responses compared to inhibitory ones in NAcCore.
Second, we found differences in the onset latency of NAc responses: excitatory responses were faster to start and shorter-lasting than inhibitory ones in both subregions. With respect to region-specific effects, both excitatory and inhibitory responses in NAcCore were faster than in NAcMed, at least with the moderate 100 μA stimulation regime. The differences in response profiles between NAcMed and NAcCore are consistent with the fact that the anatomy and functions of these NAc subregions also differ57,62,63,65,70,71.
The differences in prevalence, temporal characteristics, and effective stimulation intensity of responses between NAcMed and NAcCore suggest that the two subregions do not receive the same copy of the CB signal. These differences are unlikely to arise from within DCN, because our analyses of the topographical organization of effective DCN stimulation sites (Fig. 4) indicated widespread and overlapping distributions of sites that could potentially evoke excitatory or inhibitory responses in NAcMed and/or NAcCore. Even sites as close as 100 μm from each other could evoke quite different responses. If these different response profiles in NAc arise from distinct sources within DCN, these sources are likely organized at a scale below the resolution of our study (e.g., at the cellular level). Moreover, even if distinct pools of DCN neurons transmit signals to the two NAc subregions, the onset-latency differential between responses suggests at least some divergence in the downstream routes that DCN signals take to arrive at their NAc destinations.
The influence of the DCN on NAc spiking activity is probably served by disynaptic (and/or possibly polysynaptic) pathways. This is supported by the finding that the onset of both excitatory and inhibitory responses in NAcMed, as well as the onset of at least the inhibitory responses in NAcCore, occurred well past the onset of stimulation and its artifact, which placed a lower bound on the latencies we were able to detect confidently. Our electrophysiological observations are also consistent with tracing experiments (Allen Brain Atlas; our own preliminary work) that have not found direct anatomical connections between CB and NAc, and are further corroborated by our viral tracing experiments (Figs. 6,7), which point to VTA and intralaminar thalamic nuclei as nodes in DCN-NAc communication routes.
Anatomical and functional connections between DCN and VTA, and DCN and intralaminar n. nodes, have been described previously20,46,72–75. VTA and thalamic projections to NAc are also well established64,76–83. It might therefore not be surprising that the DCN recruit these nodes to communicate with NAc. However, the VTA and thalamus are exquisitely complex areas with multiple output streams. For example, the VTA projects not only to NAc but also to hippocampus, hypothalamus, lateral habenula, entorhinal cortex, etc.84–86. None of these downstream target regions appears to be disynaptically connected to DCN through the VTA, which points to specificity in circuit wiring. Our study is the first one, to our knowledge, to map a DCN-VTA-NAc circuit. A recent study provided anatomical evidence for a disynaptic medial DCN-NAc circuit37. Here we extend these observations to lateral DCN and also provide evidence for the centromedial and parafascicular nuclei as parts of the thalamic node.
The cell types and properties of nodal neurons that receive DCN input remain incompletely understood. In the VTA, for example, glutamatergic DCN projections target both dopaminergic and non-dopaminergic neurons20,75,87. Given the known heterogeneity of VTA neural populations88,89, DCN inputs could activate dopaminergic, GABAergic, glutamatergic, and/or dual neurotransmitter-releasing neurons. This diversity in neural types, which are known to project to NAc with some subregion-specificity59,83,90–94, could at least partly explain the differences in responses and onset latencies we observed in our experiments. For example, the action of dopamine on G protein-coupled receptors to modulate neuronal activity could be responsible for the long latencies and/or duration in NAcMed inhibitory responses. Thalamic neurons also show at least partial NAc subregion specificity63,76,95, which could explain the faster excitatory responses in NAcCore compared to NAcMed.
It is tempting to speculate on network-wide implications of the different DCN-NAc response profiles. The fast excitatory profiles would be well poised to support the rapid communication of information critical to the control of motivated behavior, such as prediction or prediction-error signals, which are well established in the cerebellum19,21,22,96. The slower, less synchronous and longer-lasting inputs may be suggestive of a regulatory function, e.g., gain control of the communication between NAc and other brain regions.97 If the DCN signals do in fact reach NAcMed and NAcCore through distinct pathways, this leaves room for their distinct multiplexing with signals originating elsewhere. Future investigations into the cellular basis of CB-NAc communication as well as its behavioral contributions are clearly in order. Here, we have broken new ground by providing the first evidence of functional connectivity between CB and NAc, identifying its NAc subregion-dependence, and offering an anatomical blueprint that could serve as its foundation.
Conflict of Interest
The authors declare that the research was conducted in the absence of any commercial or financial relationships that could be construed as a potential conflict of interest.
Author contribution
AD, EA and DF designed the research; AD and SJJ performed the research; AD and EA analyzed the data; SG assisted with tissue slicing and registration; SJJ assisted with preparation of anatomy figures; AD, EA and DF wrote the paper.
Funding
This work was supported by a Whitehall fellowship, BRFSG-2017-02, R21MH114178 and NSF1754831 to DF; a NARSAD 2018 Young Investigator Grant to EA; AD was supported by NIH Grant T32 GM 007377 and a UC Davis Dean’s Distinguished Graduate Fellowship.
Acknowledgements
We thank Drs. Brian Wiltgen, Karen Zito, Marty Usrey and Brian Mulloney of UC Davis for access to equipment, and members of the Fioravante lab for critical reading of previous versions of the manuscript.
Footnotes
↵a These authors share senior authorship.
References
- 1.↵
- 2.↵
- 3.
- 4.
- 5.↵
- 6.↵
- 7.↵
- 8.↵
- 9.↵
- 10.↵
- 11.
- 12.
- 13.
- 14.
- 15.
- 16.
- 17.
- 18.↵
- 19.↵
- 20.↵
- 21.↵
- 22.↵
- 23.↵
- 24.↵
- 25.
- 26.
- 27.
- 28.
- 29.
- 30.
- 31.↵
- 32.↵
- 33.
- 34.↵
- 35.↵
- 36.
- 37.↵
- 38.↵
- 39.↵
- 40.
- 41.
- 42.
- 43.
- 44.
- 45.↵
- 46.↵
- 47.
- 48.
- 49.
- 50.↵
- 51.↵
- 52.↵
- 53.↵
- 54.
- 55.↵
- 56.
- 57.↵
- 58.
- 59.↵
- 60.↵
- 61.
- 62.↵
- 63.↵
- 64.↵
- 65.↵
- 66.↵
- 67.↵
- 68.↵
- 69.↵
- 70.↵
- 71.↵
- 72.↵
- 73.
- 74.
- 75.↵
- 76.↵
- 77.
- 78.
- 79.
- 80.
- 81.
- 82.
- 83.↵
- 84.↵
- 85.
- 86.↵
- 87.↵
- 88.↵
- 89.↵
- 90.↵
- 91.
- 92.
- 93.
- 94.↵
- 95.↵
- 96.↵
- 97.↵


