

Abstract
Protein-protein interactions govern the cellular decision-making and a multitude of various functions. Thus, identifying new interactions between proteins can significantly facilitate our understanding on the mechanistic principles of protein functions. Coevolution between proteins is a sign of functional communication and, as such, provides a powerful approach to search for novel molecular partners. However, evolutionary analyses of large arrays of proteins, in silico, is a highly time-consuming effort, which has limited the usage of this method to protein pairs or small protein families. Here, we developed AutoCoEv, a user-friendly computational pipeline for the search of coevolution between a large number of proteins. Driving over 10 individual programs, with CAPS2 as a key software for coevolution detection, AutoCoEv achieves seamless automation and parallelization of the workflow. Importantly, we provide a patch to CAPS2 source code to strengthen its statistical output, allowing for multiple comparisons correction. We apply the method to inspect coevolution among 324 individual proteins identified to be in, or close to, the lipid rafts of B lymphocytes. We successfully detected multiple strong coevolutionary relations between the proteins, predicting many novel partners and previously unidentified clusters of interacting molecules. We conclude that AutoCoEv can be used to predict protein interaction from large datasets of hundreds and, with the aid of super-computing resources even thousands of proteins in a time and cost-efficient manner.
Introduction
The biological function of proteins is carried out through associations with various molecules, the majority of which are other proteins. The interplay between their amino acids, reflects the underlying molecular mechanisms of protein association, activity and regulation. Screening for novel interactions is of high importance for deciphering the complexity of protein networks, determinant for the functional organization of cells. It has been shown that relations between proteins can be extrapolated from the evolutionary history of their genes, in silico [1,2]. Such computational approaches, however, would demand a high degree of automation when used with large datasets, an issue that we have successfully addressed in this work.
Evolution of proteins is influenced by structural and functional constraints between amino acids, enforcing their changes in a concerted manner. Detecting intra- or inter-molecular coevolution is regarded as a sign of functional dependence between residues within the same protein, or between sites belonging to different partners, respectively [3]. Various computational methods for prediction have been described, among which are BIS2 [4], ContactMap [5], DCA [6], Evcouplings [7], MISTIC [8] and CAPS2 [9]. Many searches for inter-protein coevolution have been confined to a relatively small number of partners, where an existing correlation has been essentially anticipated [10–14]. Without automation, extending the work to even tens of proteins presents a challenge, and becomes virtually impossible for larger numbers of proteins.
Here, we developed an automated and user-friendly computational pipeline, called AutoCoEv, for the large-scale screening for protein interactions. In the center of the workflow is CAPS2 (Coevolution Analysis using Protein Sequences 2) software, that compares the evolutionary rates between sites in the form of their correlated variance [9]. By driving more than 10 additional programs, AutoCoEv achieves a high level of automation, flexibility and processes parallelization, enabling the analysis of hundreds and even thousands of proteins. We demonstrate the performance of the pipeline by analyzing 324 lymphocyte lipid raft resident proteins [15], identified in a proximity biotinylation screen, for their potential interactions.
Implementation
The preparation pipeline for most coevolutionary analyses has a relatively simple concept. Typically, for each protein of interest, a multiple sequence alignment (MSA) is produced from its orthologues in different species, optionally combined with a phylogenetic tree. However, this process requires the, sometimes challenging, correct identification of orthologues, the retrieval of their sequences, as well as, various filtering and file format conversion steps.
Command line interface, configuration and inpu
AutoCoEv is written in BASH, and offers a simple menu-driven command line interface (CLI), in which the individual steps are enumerated (Figure 1). Options for the programs that AutoCoEv drives, as well as different filtering parameters, are configured in a single file (settings.conf), which is well commented and described in detail in the manual, distributed with the script. Once configuration has been set, a user can simply go through the consecutive steps and conduct the analysis automatically.

By carrying out sequentially the steps, the user can complete the whole pipeline. Steps 1-3 deal with homologous sequences retrieval; steps 4-6 carry out the identification of most appropriate orthologues; steps 7-9 create the MSA and phylogenetic trees; steps 10-11 run parallelized CAPS for each unique protein pair combination; steps 12-13 process the results and generate XML; step 14 exits the script.
As an input, AutoCoEv requires a list of proteins with their UniProt identifiers [16] and a list of species with their taxonomic codes. Optionally, a phylogenetic tree may be provided from an external source, such as TimeTree [17], to be used as a guide when trees are calculated from MSA (see later). Upon start, AutoCoEv offers to download its required databases from OrthoDB [18] and to run initial preparations on the retrieved databases, such as FASTA database indexing (Figure 1A). Once databases are in place and input files are loaded, the pipeline proceeds to the main menu (Figure 1).
Identification of orthologues
For each protein of interest, AutoCoEv consults with OrthoDB, searching for homologues from the species in the user-provided list. The script matches the UniProt ID of each protein to its OrthoDB ID, then extracts its unique orthologues group (OG) ID at a given level of organisms (e.g. Eukaryota, Metazoa, Vertebrata, Tetrapoda, Mammalia). This level, or node, is specified by the user and would depend on the species for which orthologues are searched (next step). The script will report proteins with missing or duplicated entries at OrthoDB, as well as species where homologues of a protein are not found. The script will also report proteins with the same OG ID at the specified level, that are typically a result of gene duplication (see manual for details).
Once these searches are done, AutoCoEv prepares a list of homologues for each protein, found in the species of interest (Figure 2 A). Due to alternative splicing or gene duplication, there may be several homologues identifiers per species for the same protein. Therefore, the script determines the most appropriate orthologue by a reciprocal BLAST [19] run as follows. The amino acid sequence from the reference organism (e.g. mouse or human) of each protein is downloaded from UniProt and prepared as a local BLAST database. The respective homologous sequences identified from each species are then blasted against the reference organism sequence. For each individual species, the hit with the best score is considered as the correct orthologue, with the option to omit those that do not pass a certain identity and gaps threshold, specified by the user (e.g. over 35% identity and less than 25% gaps in the alignment to the reference organism). As a result, each protein holds a collection of automatically curated orthologous sequences, one per species, ready for alignment in the next step.

(A) Orthologue identification. Reading the user-provided lists of proteins of interest and species to be searched, the script communicates between databases to extract genes (ODB) and orthologous groups (OG) identifiers (ID). Homologous sequences are then blasted against the UniProt sequences from the reference organism (e.g. mouse or human) in order to prepare a FASTA list of most appropriate orthologues; (B) Alignments and phylogenetic trees. Orthologues are then aligned by selected method (MAFFT, Muscle or PRANK) and processed by Gblocks, to report regions of low quality. PhyML calculates trees from the MSA generated in the previous step, optionally using the external tree as a guide; (C) Create all unique protein pairs. In preparation for the CAPS2 run, the script calls SeqKit and TreeBeST to ensure that only species that both paired proteins have in common are present in their MSA and trees. Since number of species affects the specificity of CAPS2, the user can specify a threshold of the minimum permitted number of common species (e.g. 20). Each pair folder has two subfolders: for MSA and trees. (D) Running CAPS for each protein pair. The script executes CAPS2 in each protein pair folder in a parallelized fashion via GNU/Parallel. (E) Results processing. The output in each pairs folder is inspected and processed, followed by Bonferroni correction of p-values. Finally, the results are prepared as a table and parsed into an XML file ready for the network analysis by Cytoscape. An R Shiny script is also provided separately if Cytoscape-independent analyses of the network are desired.
Multiple sequence alignment
AutoCoEv offers a choice of three widely-used and accurate programs for the creation of multiple sequence alignments (MSA): MAFFT (Multiple Alignment using Fast Fourier Transform) [20], MUSCLE (MUltiple Sequence Comparison by Log-Expectation) [21] and PRANK (Probabilistic Alignment Kit) [22] (Figure 2B). Different MAFFT aliases are supported, while for PRANK an external phylogenetic tree (e.g. obtained from TimeTree) can be specified as a guide. The script also runs Gblocks [23] on each generated MSA, to obtain information on regions that are poorly aligned, too divergent or otherwise unreliable. This information is used after CAPS2 run is complete, when assessing the quality of the results (see “Result processing”).
Phylogenetic trees
CAPS2 will generate its own trees automatically at runtime, if no trees are explicitly specified. We have patched the program, so that the generated trees are exported in the output (see Materials and Methods, “Patch for verbose CAPS output”), allowing the user to inspect them.
Alternatively, trees calculated by another program can be provided to CAPS2, which may improve the sensitivity of the analysis. For this, AutoCoEv calls PhyML (Phylogenetic estimation using Maximum Likelihood) [24] to calculate trees from each MSA (Figure 2B). Additionally, an external tree (e.g. obtained from TimeTree) can be specified to be used as a guide for PhyML, while the generated trees can be rooted by TreeBeST [25], automatically by minimizing height. In our experience, CAPS2 runs are more stable when such rooted trees are used and, accordingly, the trees produced by CAPS2 are also rooted.
Detection of inter-protein coevolution by CAPS
Before the actual CAPS2 run, AutoCoEv performs several preparation steps of the orthologues MSA and (optionally) trees, created for each protein, as described above. The script produces all unique pairwise combinations between the proteins, creating an individual folder dedicated to each pair (Figure 2C). As an example, 10 proteins will produce 45 combinations, while the 324 proteins of our data set yield 52,326 pairs. For each combination, the script determines the species where an orthologous sequence was found for both proteins. Before being placed in the protein pair folder, sequences of the “not shared” species are removed from the MSAs by SeqKit [26], while the trees (if external trees are used) are trimmed according by TreeBeST. In our experience, the presence of too many species, not shared by the two proteins, deteriorates the stability of CAPS2. Since the number of species affects the specificity of the coevolution detection [9], users can specify a minimum threshold of shared species for a protein pair (e.g. 20).
When all is set, AutoCoEv runs CAPS2 via GNU/Parallel in the next step, spawning multiple individual instances of the program, each operating in a separate protein pair folder (Figure 2D).
Parallelization
The computational time required for the analysis presents a major bottleneck, as many programs lack CPU multi-threading. Utilization of multiple CPU cores is a necessity at several steps through this workflow, the most critical one being the run of CAPS2 itself. For CAPS2, and other software, we overcome these limitations by executing processes via GNU/Parallel [27]. We achieve the simultaneous run of multiple, single-core jobs, dramatically speeding up the time of computation.
P-values of the results
At run time, CAPS2 sets an α-value threshold (e.g. α = 0.01) for the probability of error when rejecting the null hypothesis (type I error), when significant co-evolving sites are detected. Results with a probability of type I error below α are reported, however their actual p-values are not, which poses limitations to rank or compare the data between protein pairs. Therefore, we patched CAPS2 to output p-values when inter-protein co-evolution is searched, following the run steps of the program.
First, based on the input data, CAPS2 simulates a number of random MSA pairs, and tests all sites combinations for co-evolutionary correlation. The acquired correlation values are stored in a vector, the size of which (VSIZE) depends on the MSA lengths of the two proteins (L1 and L2), and the number of simulations (r) performed (Figure 3). The correlations are sorted by value (from 0 to 1) and the vector hereafter serves as a null data distribution to which the real data will be compared. The α-value derives an index number (ITHRESH) within the vector (Equation 1), whereas the value contained at the indexed position is set as a correlation threshold (CTHRESH) (Figure 3A, up).
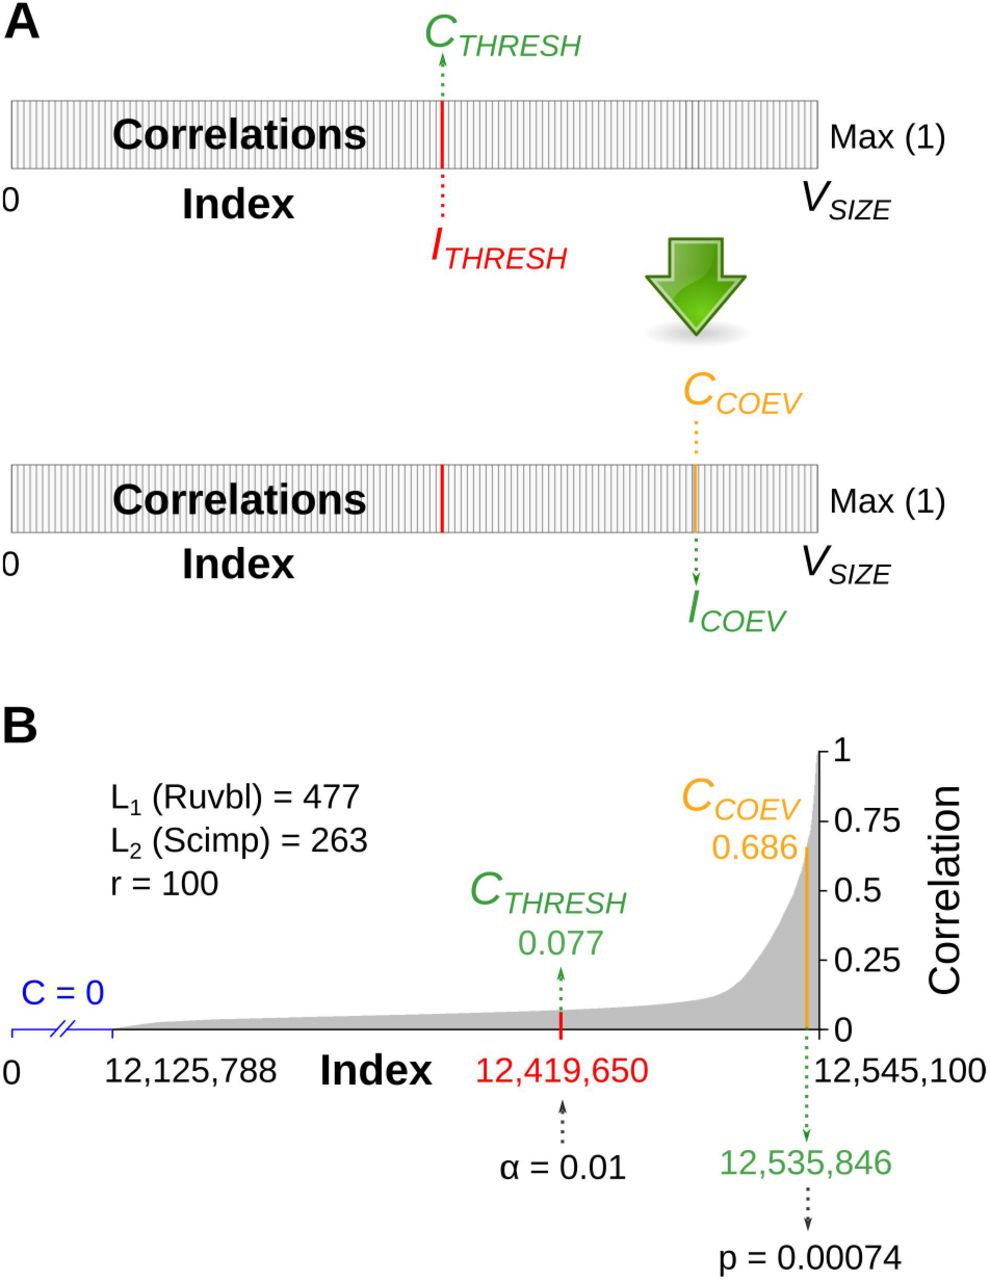
(A) Threshold and correlation. Correlation values of simulated data are stored in a vector (rectangular box) and sorted by size from 0 to 1 (Max). The vector size (VSIZE) reflects the total number of possible correlations multiplied by the number of simulations. The threshold position within the vector (index, ITHRESH) is determined by α in Equation 1, and its correlation value (CTHRESH) is set as a cut-off for the correlations detected in the user-provided data (CCOEV). With our patch, CAPS2 ranks the position of each detected correlation value within the vector, determines its index (ICOEV) and uses it in Equation 2 to calculate the corresponding p-value. (B) Example data. Protein pair Ruvb1 and Scimp was analysed in the noguide run (see next). The lengths of Ruvb1 and Scimp MSAs (L1 and L2) and the number of simulations (r) are reflected in VSIZE = 12,545,100. The contents of the vector holding correlation values (C) from the simulated data are shown: C = 0 (no correlation) in blue (X-axis) and C > 0 in grey, starting at index 12,125,788. The threshold value position (red) is determined by α in Equation 1 and returns CTHRESH = 0.077. A pair of coevolving with a CCOEV = 0.686, was ranked within the vector at index 12,535,846; the index was in turn used in Equation 3 to calculate p = 0.00074 for the correlation..

The threshold is thus specific for each protein pair, and correlations detected from the real data, that rank above it are deemed as being significant. With our patch, after coevolution has been detected between two sites, CAPS2 ranks its value within the vector and determines the corresponding index (ICOEV). After “searching back” the ICOEV (Figure 3A, down), CAPS2 can calculate the corresponding p-value (Equation 2). An actual example is shown in Figure 3B.

CAPS2 estimates the correlation between two sites bidirectionally, exporting their mean value in the results. We would expect that a reliable correlation estimation stems from two closely bound or even identical values. Therefore our patch makes the program to also output the directional correlations and their p-values, which allows for additional assessment of the results.
Result processing
After CAPS2 runs are completed in all protein pair folders, AutoCoEv processes the results in several steps of filtering, sorting and assessment (Figure 2E). The script calls R [28] to produce Bonferroni-corrected p-values of the co-evolving sites from each protein pair. Co-evolving residues with significant corrected p-values (e.g. adj. p < 0.05) are further inspected, in regards of their MSA columns quality, as determined by Gblocks after the MSA step, as well as the percentage of gaps in the MSA column. Since correlation values (CCOEV) derived by CAPS2 cannot be directly compared between protein pairs, AutoCoEv calculates normalized values to the threshold (CTHRESH) of each protein pair (Equation 3), where 1 is the maximum possible correlation value:

We also noticed that on rare occasions, CAPS2 assigns a negative value at the bidirectional correlation estimation step. Since this usually yields a mean value lower than the threshold, AutoCoEv dismisses site pairs where a negative correlation was estimated.
Results are saved as a spreadsheet and in the final step, an XML (Extensible Markup Language) file of the resulting network is produced, ready for visualization and additional analyses by Cytoscape [29]. Network parameters that can be filtered include normalized correlation, p-value (corrected and non-corrected), bootstrap, alignment quality in the MSA, gaps, difference in the bidirectional estimation of p-values and more (see Manual for details). In addition, we provide separate script for further processing of the collected results, where the number of co-evolving sites for each protein pair that pass certain criteria, such as p-value, is recorded. We are also developing an R shiny script for the dynamic analysis of the produced network, without the need of Cytoscape.
Application
We tested AutoCoEv on a set of 324 mouse proteins, identified by APEX2 proximity biotinylation to be located at the lipid raft membrane domains in B cells [15] (bioRxiv). Orthologues of each of the mouse proteins were searched in 36 more species in OrthoDB at node tetrapoda. After the reciprocal BLAST run against mouse, we considered orthologues with sequence identity to mouse greater than 35%. Sequences with over 25% gaps in the BLAST alignment, likely due to an isoform with internal exon(s), were also filtered out. We selected MAFFT alias L-INS-i to generate MSA of the orthologues, since it allows for flanking sequences around a central aligned region, where we do not expect large gaps to occur.
AutoCoEv produced a total of 52,326 unique pairs – 50,565 of which had a minimum of 20 “shared species” and were therefore parsed to CAPS2. As the phylogenetic tree is critical for estimation of coevolution, we tested three approaches to obtain trees, in three separate runs of steps 8-13 of the pipeline (Figure 1). In our first run, we let CAPS2 produce its own trees (referred from now on as automatic); in the second, the trees were calculated by PhyML using a tree from TimeTree as a guide (referred as guide); and in the third, we ran PhyML without a guide tree (referred as noguide).
Each CAPS2 run, evaluating 50,565 protein pairs, typically took around 3 days on a 12-thread CPU (see Materials and Methods for details) with 32GB of RAM. We have noticed that on rare occasions, CAPS2 crashes at runtime with a “Segmentation fault”, therefore we first inspected the number of failed runs. It appeared that CAPS2 was least stable in the automatic run, having failed in 0.8% of the protein pairs (Figure 4A). The fraction of protein pairs where co-evolution was detected was highest in the noguide runs, however after the Bonferroni-correction, it was reduced to relatively equal values between conditions. The sites that passed the Bonferroni-correction were thus considered for the subsequent analyses. The noguide run proposed the highest proportion of co-evolving sites per protein pair (Figure 4B). We also inspected the MSA columns of these co-evolving amino acids in respect to the percentage of alignment gaps as well as alignment quality, as determined by Gblocks. In all three conditions, ∼94% of the pairs belonged to alignments with less than 20% gaps, and ∼70% were also from MSA regions deemed as good quality.

All values stated are for conditions in the order: automatic, guide and noguide. (A) Protein pairs overview. CAPS2 failed in 0.8%, 0.2% and 0.25% of the respective runs. Co-evolution was detected in 37%, 30.6% and 39% of the respective runs, while 24%, 19%, and 22% had co-evolving pairs that passed the Bonferroni correction with adjusted p<0.05 (filled parts of the bars). These pairs were considered in the subsequent analyses. (B) Co-evolving residue pairs overview. Average numbers of co-evolving sites per protein pair were 4.2, 4.3, and 4.8. High number of gaps (>20% of the species, as an average value for both co-evolving sites) in the MSA columns were found for around ∼6% of the residue pairs of all conditions. The percentage of sites also belonging to good quality MSA regions as determined by Gblocks was 70.5%, 71.6% and 72.7% (filled parts of the bars). (C) P-values differences in the bidirectional correlation determination. Linear scale, median values are indicated. (D) P-values comparison. Logarithmic scale, median values are indicated. (E) Overlap of the protein pairs detected by each condition. Pairs with over 3 co-evolving residues are shown to the right. (F) P-values comparison of the protein pairs found in the intersection of the three conditions. Split violin plots represent all intersection proteins (left) versus intersection proteins with ≥ 3 co-evolving residues (right). Logarithmic scale, median values are indicated.
To get an estimate on the overall reliability and significance of the results, we then focused on the non-corrected p-values produced for each sites pair. The noguide runs had more similar p-values produced by their bidirectional estimation, as well as an overall lower p-values, compared to the other two conditions (Figure 4C and D). This implied that the noguide run strategy could be the most reliable choice for this particular dataset.
To further assess the results, we compared the individual protein pairs detected as co-evolving by the automatic, guide and noguide runs. We estimated that 3908 pairs were detected by all three, making 28.1% of the total number of unique pairs detected by all runs (Figure 4E, left). From them, noguide had the highest number of pairs identified also in either of the other two conditions alone (12.6% with automatic and 12.8% with guide), further pointing us to this strategy. In addition, we would expect that a correlation between two proteins is manifested by more than a single pair of co-evolving sites. Aiming to improve the reliability of the results, we decided to focus on proteins found to be co-evolving with at least 3 residue pairs by all three runs (Figure 4E, right). We assorted 1386 such protein pairs, or 17.9% of the total number that passed the ≥ 3 residues criterion in the automatic, guide and noguide runs. They had lower p-values, compared to the ones from the 3908 pairs above, and notably, the results from the noguide run showed the lowest overall p-values (Figure 4F). Therefore, we decided to visualize in Cytoscape the network produced by the noguide run, focusing on the 1386 protein pairs, identified also in the other two runs.
For the network, we additionally applied a more strict filtering by Bonferroni corrected p-values (<0.01) ending up with a list 172 pairs between 114 proteins (Figure 5A). Visualizing the produced XML file in Cytoscape revealed a complex network of predicted functional interactions (Figure 5B). Five nodes had the highest number of partners (>10), while the highest numbers of co-evolving sites (>20) were found between 7 pairs from total of 11 nodes (Table 1).
Nodes with the highest numbers of partners (>10).
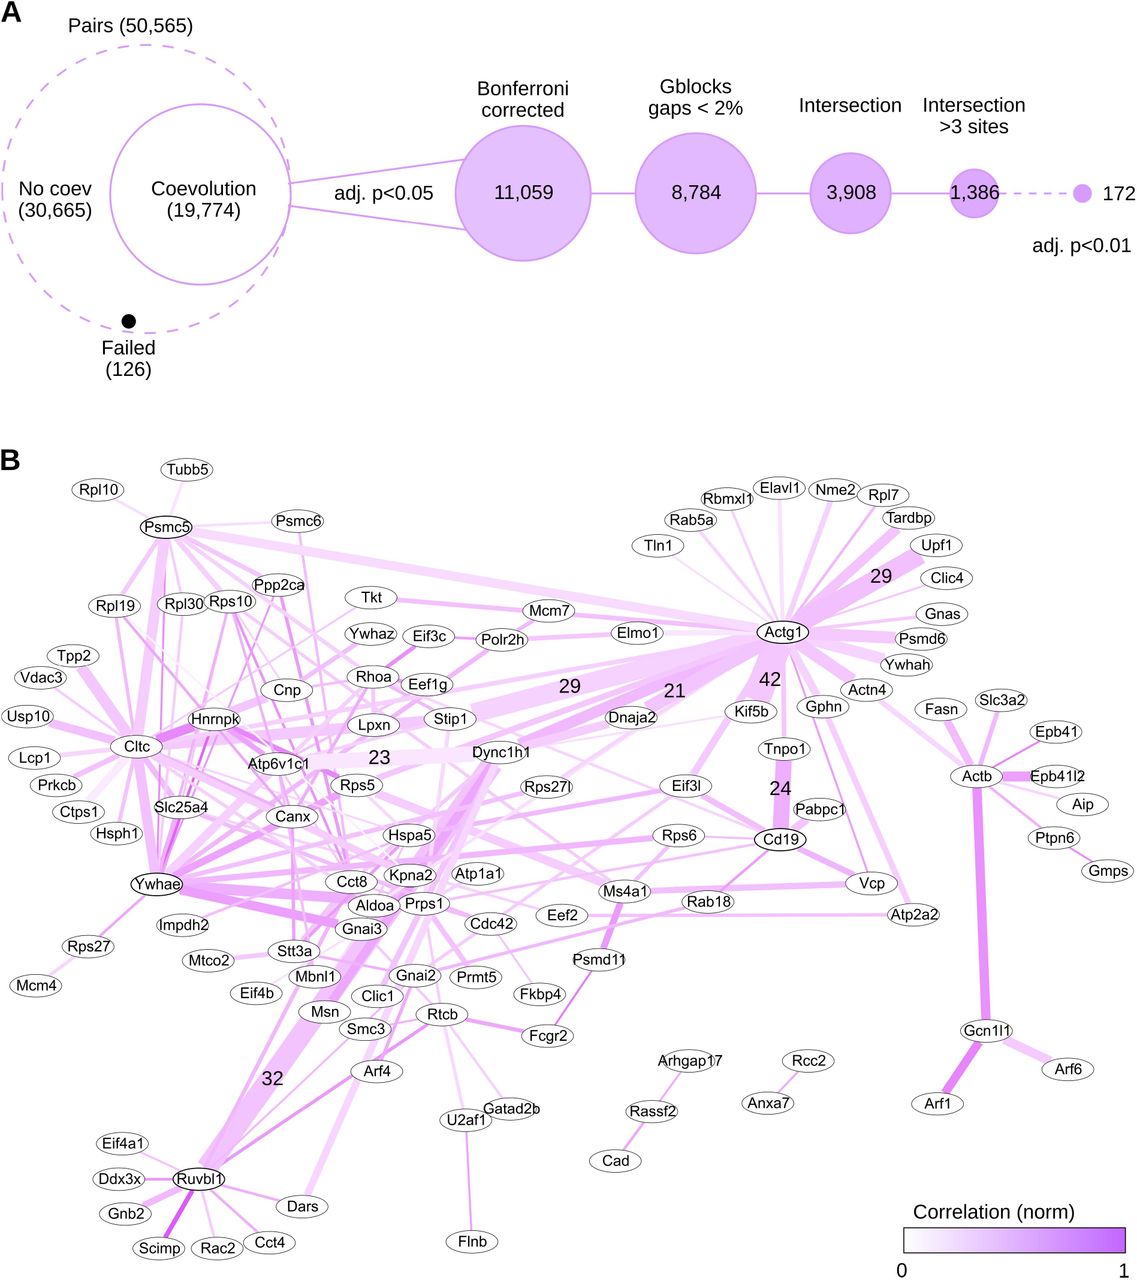
(A) Filtering step summary. Proteins of condition noguide were subjected to several filtering steps before network visualization. Number of protein pairs is indicated in brackets. (B) Co-evolutionary network. Lines colour intensity indicates normalized correlation values. Nodes with highest numbers of partners (Table 1) are shown in thicker ellipses. Line thickness corresponds to the number of residue pairs between nodes. Pairs with highest numbers of co-evolving sites (Table 2) are indicated.
The 5 proteins with the highest numbest of coevolving pairs were non-muscle actin γ-1, clathrin heavy chain, 14-3-3 protein ε, a component of the Hsp90 co-chaperone R2TP complex, Ruvbl1, and a 26S proteasome regulatory subunit Psmc5. These results are in good agreement with the literature, as all of these proteins are known to have a very broad interaction network necessary to fulfil their functions [30–34]. On the other hand, the protein pairs with the highest number of coevolving amino acids were rather surprising. The top 7 pairs did not present well-known direct interactions, but the results pointed towards functional co-operation. For example, it is well-known that the actin and microtubule cytoskeletons have various important interactions [35], yet we found no reports of actin directly interacting with the microtubule motor protein kinesin-1. Importantly, however, coevolution analysis detects various types of interactions beyond direct contact [3]. These results set the base for deeper examination of the network and validation of the individual interacting partners in wetlab studies.
Discussion
In this paper, we present AutoCoEv: an interactive script, aimed at the large-scale prediction of inter-protein coevolution. The variety of options that can be easily set in the configuration file, allow for numerous adjustments, providing a great level of flexibility in the workflow.
The automated batch identification of orthologues grants the seamless processing of even thousands of proteins, when high computing power is available. The choice of MSA software largely depends on the sequences being aligned, therefore our script drives three of the most widely used MSA programs [36], and we consider incorporation of additional methods in the future, such as T-coffee [37] and ClustalΩ [38]. PhyML offers a reliable means for trees calculation outside of CAPS2, and we are planning to implement wrappers for RAxML [39], MrBayes [40] and IQ-TREE [41]. As side observations, we saw that making trees outside of CAPS2 was beneficial for run stability, and that not using a fixed TimeTree species phylogeny as a guide for making PhyML trees outperformed runs with the guide. We speculate that this could be a reflection of different lineage-specific evolutionary rate variations between proteins, and therefore it is better to start tree building without previous assumptions of phylogeny.
By default, inter-molecular analysis in CAPS2 was designed for just a handful of proteins, or a single pair, as illustrated by the web interface (http://caps.tcd.ie/caps/). Lack of multi-threading is a major obstacle in the analysis of large datasets, but here we have successfully overcome this issue. By creating in advance all possible pairwise combinations, then running multiple instances of the program simultaneously, we take full advantage of modern multi-core processor architecture. With the increasing numbers of processor cores in the recent years, it is possible to analyse hundreds of proteins even on a common modern PC. For protein numbers reaching a thousand or more, access to super-computing resources is required to keep the analysis run times reasonable.
Finally, we believe that our patch adds some valuable functionality to CAPS2, by expanding the verbosity of the results. Most importantly, reporting the p-value of the detected correlations, allows for additional statistical tests, improving the overall power of the analyses.
Materials and methods
Data availability
The script is under MIT license and is freely available for download from the GitHub repository of our group (https://github.com/mattilalab/autocoev) together with the data used in this work. For details, please see Manual on GitHub.
Script environment and required software
AutoCoEv is written in BASH and its development was done on Slackware GNU/Linux (http://www.slackware.com/). Software tools and their dependencies, not included in the base system, were installed from the scripts available at SlackBuilds.org (https://slackbuilds.org/). These are: CAPS (2.0), Datamash (1.7), Exonerate (2.4.0), Gblocks (0.91b), MAFFT (7.471), MUSCLE (3.8.1551), NCBI BLAST+ (2.10.1), PRANK (170427), Parallel (20200522), PhyML (3.3.20200621), R (4.0.0), SeqKit (0.13.2), squizz (0.99d) and TreeBeST with Ensembl modifications (1.9.2_git347fa82).
Compiling CAPS requires Bio++ (release 1.9) libraries (http://biopp.univ-montp2.fr/): bpp-utils (1.5.0), bpp-seq (1.7.0), bpp-numcalc (1.8.0) and bpp-phyl (1.9.0, patched). A virtual machine image with all requirements pre-installed is also available upon request. See Supplementary Materials for details and dependencies.
Databases
When searching for orthologues, AutoCoEv takes advantage of the data from OrthoDB (https://www.orthodb.org/). The following databases are used (10.1): odb10v1_all_fasta.tab.gz, odb10v1_gene_xrefs.tab.gz, odb10v1_OG2genes.tab.gz. The script also communicates with UniProt (https://www.uniprot.org/) to download the latest sequence of each protein of interest from its reference organism. For an external phylogenetic tree, the TimeTree knowledgebase was consulted (http://www.timetree.org/).
Patch for verbose CAPS output
Our patch introduces two modifications to CAPS, making the program produce more verbose output. First, the program will use TreeTemplateTools from bpp-phyl to export CAPS2 generated trees by treeToParenthesis, if none were supplied by the user at run-time. Second, after coevolution between sites has been determined, CAPS2 ranks the correlation value within totaltemp vector containing the null simulated data. The index of the lower bound value is considered and used to calculate p-value corresponding as close as possible to the detected correlation. See Supplementary Materials for detailed explanation with excerpts of code.
Proximity biotinylation
For details, see Awoniyi et al bioRxiv [15], a preceding study from our group, published in parallel with this work. Briefly, lysates of B cells stimulated with 10µg/mL antibody against BCR were collected after 0 min, 5 min, 10 min and 15 min time points. The APEX2 system was used to induce biotinylation of proteins within 20 nm range in close proximity to the BCR. Samples were subjected to streptavidin affinity purification followed by mass spectrometry analysis. MaxQuant (1.6.17.0) was used for database search and after differential enrichment analysis with NormalyzerDE (1.6.0), a list of 346 proteins, proposed as raft-resident, was prepared. From these proteins, 324 were found in OrthoDB and used with here with AutoCoEv.
Data analyses
Post-run analyses were done by R and Gnumeric spreadsheet (http://www.gnumeric.org/). For Figure 4C and D, data were first sorted by size and the average of every 10 values was used to render the violin plots. When analyzing protein pairs with ≥ 3 co-evolving sites, the p-values and Bonferroni corrected p-values were averaged by the number of sites between the two proteins. Venn diagrams were generated by DeepVenn [42], while network was visualized in Cytoscape (3.8.2). All figures were designed in Inkscape (https://inkscape.org/).
Author contributions
PBP developed the BASH script, analyzed the data and wrote the manuscript. LOA provided the input data for analyses, developed a statistical evaluation of the results by R scripting and wrote a network analysis script in R Shiny. VŠ conceived the original idea of the automated pipeline. PKM contributed to the study design, trouble-shooting, and manuscript preparation.
Competing interest statement
The authors declare no competing interests
Supplementary Materials
Manual
For details on AutoCoEv and instructions, please consult the Manual distributed with the script tarball. Also, check our GitHub page: https://github.com/mattilalab/autocoev for any updates.
Prerequisites
AutoCoEv was developed on Slackware 14.2 (http://www.slackware.com/) x86_64. Software, not included in the distribution, was installed from the scripts available at the SlackBuilds.org (SBo) project (https://slackbuilds.org/). The following programs should be installed, as well as their own dependencies, all available at SBo:

Detailed instructions on how to install software from SBo, can be found in website’s the HOWTO section (https://slackbuilds.org/howto/). Send a request to pebope{at}utu.fi if you want a VM image with all dependencies preinstalled.
Compiling CAPS from source
CAPS requires Bio++ suite (release v1.9) libraries, compiled in this order: bpp-utils (1.5.0), bpp-numcalc (1.8.0), bpp-seq (1.7.0) and bpp-phyl (1.9.0). Sources can be obtained from the suite webpage (http://biopp.univ-montp2.fr/repos/sources/). TreeTemplateTools.h from bpp-phyl needs to be slightly modified, in order to work with CAPS, therefore a patch (caps_TreeTemplateTools.patch) is provided.
The libraries (and patch) are available at SBo, as part of the bpp1.9 “legacy” Bio++ suite, which can be safely installed along the new version of the suite:
Verbose CAPS (vCAPS)
A SlackBuild script for vCAPS is also available at SBo, which automatically applies the caps_verbose.patch (see next) and compiles the program with -O2 -fPIC flags. In our experience, setting flags to -O3 did not yield a significant speed improvement.
Hardware
Test runs of AutoCoEv were done on Intel Xeon W-2135 (6 cores / 12 threads) or i7-9700KF (8 cores / 8 threads) CPU with 32GB RAM.
Patch for verbose CAPS output
We provide a patch (caps_verbose.patch) to CAPS source code (caps.cpp), that makes the program output its generated trees, as well as the p-value for each correlated amino acid pair. For the moment, the patch introduces these changes only for inter-protein analyses.
Trees output
When phylogenetic trees are not supplied by the user, CAPS generates its own trees automatically:

P-values output
CAPS simulates number (-r) of random MSA, where each simulated alignment has the same number of columns (length) as the real data and is tested by the same method. This ensures that the data are compared to a null distribution without coevolution pressures. Correlation information from the simulated data is stored and sorted into vector totaltemp:
The correlation threshold for each protein pair is based on the simulated data in totaltemp, found at a certain index, value. It is determined by the alpha (-a) run-time option, referred here as threshval:
Correlation between residues R1 and R2 is determined as the mean of correlation R1→R2 and correlation R2→R1. Each must be higher than the threshold, whereas thresholdR is always 0.01:
We seek to calculate the p-value of each correlation using the formula from [1], where value is the correlation closest index within the totaltemp vector. We introduce a new function getIndex, which ranks a value K within a vector v, defines its lower bound value as it, then determines the index of it within the vector.
Here, v = totaltemp and K = Correl_[cor] and the p-value of Correl_[cor] is returned as alphathresh:

We use the index of lower bound it, since an exact match of the correlation value Correl_[cor] is unlikely to be found within totaltemp:
The patched executable of CAPS is installed as “vCAPS”, so it can be installed along the the official binary “caps” provided by upstream.
Acknowledgements
We thank the members of the Lymphocyte Cytoskeleton lab for their critical comments on our manuscript. This work was supported by the Academy of Finland (grant ID: 25700, 296684, 307313, and 327378 to PM; 286712 to VŠ), as well as Sigrid Juselius and Jane and Aatos Erkko, and Magnus Ehrnrooth foundations. The authors would like to thank Martti Tolvanen for discussions on the theoretical basis and editing the final manuscript, Akseli Mantila for help with the C++ code of CAPS2 and Dian Dimitrov for advising on mathematics and statistics.
Footnotes
References


