

Abstract
Predicting individual differences in cognitive processes is crucial, but the ability of task-based fMRI to do so remains dubious, despite decades of costly research. We tested the ability of working-memory fMRI in predicting working-memory, using the Adolescent Brain Cognitive Development (n = 4,350). The conventionally-used mass-univariate approach led to poor out-of-sample prediction (Mean r = .1-.12). However, the multivariate ‘Elastic Net’, which draws information across brain regions, enhanced out-of-sample prediction (r = .47) by several folds. The Elastic Net also enabled us to predict cognitive performance from various tasks collected outside of the scanner, highlighting its generalizability. Moreover, using an omics-inspired approach, we combined Elastic Net with permutation, allowing us to statistically infer which brain regions contribute to individual differences while accounting for collinearity. Accordingly, our framework can build an easy-to-interpret predictive fMRI model that transfers knowledge learned from large-scale datasets to smaller samples, akin to polygenic scores in genomics.
Introduction
Task-based functional magnetic resonance imaging (fMRI) has been a prominent tool for neuroscientists since the early 90s5. One goal of task-based fMRI is to derive predictive, interpretable and biologically valid measures of individual-level cognitive functions6,7. Ideally, signals from task-based fMRI should indicate differences across individuals’ cognitive functions probed by the task. For example, scientists should be able to predict people’s behavioral performance in working memory based on their fMRI signals during a working-memory task. Yet, this goal remains largely unattained. This is partly because conventional approaches for task-based fMRI usually do not provide good predictive ability given their poor reliability as demonstrated recently8. To overcome this limitation, our study proposes a framework that draws information across brain regions to build a predictive model from task-based fMRI data. Specifically, our proposed approach aims at enhancing the predictive ability for task-based fMRI, while still allowing us to statistically infer which brain regions contribute to this prediction. Ultimately, this easy-to-interpret predictive model can potentially be used in future studies that collect fMRI from the same task to predict individual differences of a similar cognitive process, especially if the model is built from well-powered data. This is similar to the use of polygenic scores in genetics9.
Conventionally, to learn about which brain areas are associated with individual differences, neuroscientists use the mass-univariate approach10. Here, researchers first test many univariate associations between 1) fMRI BOLD at each brain region that varies as a function of task conditions (e.g., high vs. low working memory load) and 2) an individual-difference variable of interest (e.g., working memory performance). They then apply multiple comparison corrections, such as Benjamini-Hochberg’s false discovery rate (FDR)11 and Bonferroni, to control for false conclusions based on multiple testing10. Accordingly, the mass univariate allows for easy statistical inference about the associations at each individual brain region. However, this simplicity may come at a price. Recent findings have challenged the ability of the mass univariate in task-based fMRI to predict individual differences given its low test-retest reliability8. Indeed, although statistical inference is the aim of the mass univariate, research has also questioned its inference, especially due to certain utilizations of multiple comparison corrections that can lead to high false positives in some cases and high false negatives in others12. Having separate testings for different brain areas in a mass-univariate fashion also places an assumption about independency among brain areas, further constraining its inference.13
Drawing information across different brain areas simultaneously in one model has been suggested as a potential solution to improve statistical inference and to avoid the use of multiple comparison corrections13,14. The ordinary least squares (OLS) multiple regression is an extremely widespread method for predicting a response variable from multiple explanatory variables simultaneously. For task-based fMRI, this means simultaneously having all brain regions as explanatory variables to predict an individual difference variable. In gist, the OLS fits a plane to the data that minimizes the squared distance between itself and the data points15,16. With uncorrelated explanatory variables, the OLS has the benefit of being readily interpretable - each explanatory variable’s slope represents an additive effect of that each explanatory variable has towards the response variable16. However, in a situation where strongly correlated explanatory variables are present, known as multicollinearity (reflected by high Variance Inflation Factors; VIF), the OLS tends to give very unstable estimates of coefficients and extremely high estimates of model uncertainty (reflected in large standard errors)17–20. Accordingly, an out-of-the-box OLS may not be well-suited for statistical inference in the fMRI setting where strong spatial correlations are common. Moreover, it is still untested how much the OLS can improve out-of-sample prediction over the mass univariate for task-based fMRI.
To address multicollinearity and improve out-of-sample prediction, many researchers have exchanged classical OLS regression for a machine-learning based method, called penalized regression15,16. Apart from minimizing the sum of squared errors, penalized regression simultaneously minimizes the weighted sum of the explanatory variables’ slopes15,16,21. For example, if the explanatory variables are BOLD signals from different regions, a penalized regression model will shrink the contribution of some regions closer towards zero (or set it to zero exactly). The degree of penalty to the sum of the explanatory variable’s slopes is determined by a ‘penalty’ hyperparameter: the greater the penalty, the more are the explanatory variable’s slopes shrunk, and the more regularized the model becomes. The appropriate value of penalty is typically chosen through cross-validation22–24. A general form of penalized regression, known as Elastic Net21, also includes a ‘mixture’ hyperparameter, which determines the degree to which the sum of either the squared (known as ‘Ridge’) or absolute (known as ‘Lasso’) slopes is penalized. Our study formally tested if the Elastic Net improved out-of-sample prediction for task-based fMRI, compared to the mass univariate and the OLS.
A major drawback of penalized regression, along with other machine-learning algorithms used in task-based fMRI14, is the difficulty in drawing statistical inference about which brain areas are involved in predicting the individual differences, especially when compared to the mass univariate and the OLS. In fact, despite over a decade of research, statistical inference with penalized regression models still remains a hot area of statistical research.25 However, recently, a relatively straightforward framework for computing statistical inference with the Elastic Net, eNetXplorer1, was developed. The central idea behind eNetXplorer is to fit two sets of many Elastic Net models. In the first set, Elastic Net models are fitted to predict the true response variable (target models), whereas in the second set, the models are fitted to predict a randomly permuted response variable (null models). For example, if the observations are participants in a study, then the target models will try to predict one participant’s response from the same participant’s set of explanatory variables (e.g., brain regions), whereas the null models will try to predict one participant’s response from another participant’s explanatory variable. Both the null and the target models are tuned and assessed via repeated cross-validation. Given that there is no relationship between the shuffled response and the predictors in the null models, any non-null predictive accuracy and coefficient estimates in the null models has to be spurious. By comparing the magnitude of the coefficient estimates in target models to null models, eNetXplorer allows for near-exact inference for each individual explanatory variable (via the permutation tests)26,27. While eNetXplorer was originally developed for the use with spectral “omics” data, there is considerable overlap in the challenges faced in the analysis of omics and fMRI data28, and as such, eNetXplorer may prove a valuable tool in the latter as well.
The overarching aim of our work is to achieve good accuracy in predicting individual differences from task-based fMRI data while simultaneously drawing inferences about brain regions involved. Our study used a large-scale task-based fMRI dataset from the Adolescent Brain Cognitive Development (ABCD)29 to test the performance of the Elastic Net against the mass univariate (using the FDR and Bonferroni corrections) and OLS approaches. Specifically, we computed a linear contrast of fMRI signals during the working memory N-Back task29,30 (2-back vs. 0-back, reflecting high vs. low working-memory load) across the whole brain and used them as explanatory variables in our predictive models. We selected the N-Back task as it provided a well-defined cognitive process (working memory) and behavioral performance (accuracy in performing the task).
First, to evaluate out-of-sample prediction, we randomly split the data into training (75%) and test (25%) sets. We trained the models on the training set to predict behavioral performance of the N-Back task using the three methods (mass univariate, OLS and Elastic Net). We then evaluated the models’ predictions by correlating between predicted and observed behavioral performance in the test set. Second, to compute statistical inference, we used the training set. For the mass univariate, we examined which brain regions survived FDR and/or Bonferroni corrections. Similarly for the OLS, we investigated which brain regions had coefficients with p < .05. For the Elastic Net, we computed statistical inference using eNetXplorer by applying permutations. We also investigated the potential problem of multicollinearity of the OLS. We predicted that the statistical significance of a brain region would vary as a function of multicollinearity (assessed using the Variance Inflation Factor, VIF) in the OLS more so than in the Elastic Net. This is because multicollinearity will tend to inflate the standard errors of explanatory variables in the OLS17–20; however, the Elastic Net is designed to regularize the influence of multicollinearity21. Third, to ensure that the models generalized well across scanning sites where the data were collected (i.e., out-of-site generalization), we split the data based on scanning sites. We then evaluated the models’ predictive ability on one site, not being included in the model building process, a technique known as a leave-one-site-out cross validation. Forth, to demonstrate that the framework could be applied to predict individual differences in cognitive processes beyond behavioral performance collected from the same fMRI task (i.e., out-of-scanner generalization), we trained different models to predict behavioral performance from each of 10 cognitive tasks, collected outside of the fMRI session. Of specific interest is the list sorting working memory task31 that measured working memory outside of fMRI sessions. We then evaluated their prediction using train-test split and cross validation.
Methods
We used the data from the ABCD Study Curated Annual Release 2.0132. Our participants were 9-10-year-old children scanned with 3T MRI systems at 22 sites across the United States, recruited as reported previously33. The ethical oversight of this study is detailed elsewhere34. The ABCD Study provided detailed data acquisition procedures and fMRI image processing that are also outlined in previous publications29,35. Of note, the ABCD study applied Freesurfer to parcellate the brain based on Destrieux36 and ASEG37 atlases. The parcellation resulted in data showing fMRI activity at 167 gray-matter (148 cortical surface and 19 subcortical volumetric) regions.
In the N-Back fMRI task29,30, children were presented with pictures featuring houses and faces with different emotions. Depending on the trial blocks, children were asked to report whether the picture matched either: (a) a picture shown 2 trials earlier (2-back condition), or (b) a picture shown at the beginning of the block (0-back condition). We considered fMRI measures derived from the [2-back vs 0-back] linear contrast (i.e., high vs. low working-memory load) as an fMRI index of working-memory. We used the average contrast values across two runs. As for behavioral performance for the N-back task, we used the accuracy of the 2-back condition as it is correlated well with performance of cognitive tasks collected outside of the scanner38.
Children completed the 10 out-of-scanner cognitive tasks on an iPad during a 70-min in-session visit. The detailed description about these 10 tasks was provided elsewhere39. FIrst, the Flanker task measured inhibitory control40. Second, the Card Sort task measured cognitive flexibility41. Third, the Pattern Comparison Processing task measured processing speed42. Fourth, the Picture Vocabulary task measured language and vocabulary comprehension43. Fifth, the Oral Reading Recognition task measured language decoding and reading31. Sixth, the Picture Sequence Memory task measured episodic memory44. Seventh, the Rey-Auditory Verbal Learning task measured auditory learning, recall and recognition45. Eight, the List Sorting Working Memory task measured working-memory31. Ninth, the Little Man task measured visuospatial processing via mental rotation46. Tenth, the Matrix Reasoning task measured visuospatial problem solving and inductive reasoning45.
For the analyses in the current study, we followed the recommended exclusion criteria from the ABCD study47. We excluded data with structure MRI T1 images that were flagged as needing clinical referrals, having incidental findings (e.g., hydrocephalus and herniation) or not passing quality controls (including IQC_T1_OK_SER and FSQC_QC fields). Second, we excluded data with fMRI T2* images that did not pass quality controls or had excessive movement (dof > 200). Third, we excluded data flagged with unacceptable behavioral performance during the N-Back task. Fourth, we removed all data from a Philips scanner due to a post-processing error in the release 2.01. Lastly, we identified outliers of the contrast estimates for each of the 167 regions using the 3 IQR rule and applied listwise deletion to remove observations with outliers in any region. We applied the IQR rule separately on the training and test sets for the out-of-sample prediction and on training and held-out sites for out-of-site generalization (see more below). If the IQR were to apply on the whole dataset, the final sample would consist of 4,350 children (2153 females).
Out-of-sample prediction for N-Back behavioral performance
We first split the data into a training (75%) and a test (25%) set. Next, we fitted the mass univariate, the OLS, and the Elastic Net models. The mass univariate analysis consisted of many separate simple regression models, each of which has N-Back behavioral performance (the accuracy of the 2-back condition) as a response variable and each brain region as an explanatory variable. The OLS regression was fitted once, using all brain regions as explanatory variables and behavioral performance as the response variable. Similarly, for the Elastic Net, we used all brain regions to explain behavioral performance. However, unlike with the OLS, we implemented grid search to tune two hyperparameters - penalty and mixture - via 10-fold cross-validation using ‘glmnet’ and ‘tidymodels’ libraries (www.tidymodels.org). In the grid, we used 100 levels of penalty from .025 to 10, equally spaced on the logarithmic-10 scale, and 10 levels of mixture from 0 to 1 on the linear scale. To evaluate predictive ability, we used the test set and examined out-of-sample Pearson’s correlations between predicted vs. observed behavioral performance in this set. For the mass univariate analysis, we used the fitted simple regression models and examined the prediction from the areas that passed the FDR and/or Bonferroni corrections in the training set. For the OLS, we examined the prediction from the fitted OLS model. For the Elastic Net, we examined the prediction from the model with the best-tuned penalty and mixture.
Statistical Inference for N-Back behavioral performance
We examined the inference using the training set. With the mass univariate analysis, we determined regions that were significantly associated with behavioral performance (the accuracy of the 2-back condition) using FDR and/or Bonferroni corrections (alpha = 0.05). With the OLS, we defined significant regions as those with a p < .05 coefficient.
With the Elastic Net, we chose the best tuning parameters from the previously run grid search and applied eNetXplorer48 to fit two sets of many Elastic Net models. In one set, the models were fitted to predict the true response variable (behavioral performance; target models), while in the other set the models were fitted to predict the same response variable randomly permuted (null permuted models). We split the data into 10 folds 100 times (100 runs; eNetXplorer default), and then in each run the target models were repeatedly trained on 9 folds and tested on the leftover fold. Additionally, for each cross-validation run of the target models, there were 25 number of permutations of the null permuted models (eNetXplorer default). We defined the explanatory variables’ (brain regions) coefficient for each run, kr, as the average of non-zero model coefficients across all folds in a given run. Across runs, we used an average of a model coefficient weighted by the frequency of obtaining non-zero model coefficient per run (see the detailed implementation of eNetXplorer here49 Formally, we defined an empirical p-value as:
 where pval is an empirical p-value, r is a run index, nr is the number of run, p is a permutation index, np is the number of permutation, Θ is the right-continuous Heaviside step function and |k| is the magnitude of an explanatory variable’ coefficient. Briefly, we used the proportion of runs in which the null models performed better than the target models to establish statistical significance for each explanatory variable’ coefficient.
We detected multicollinearity of the explanatory variables (brain regions) using Variance Inflation Factors (VIF) calculated from the model fit of the unregularized model (i.e., the OLS). We then examined the extent to which the VIF varied with uncertainty estimates that determine statistical significance, including standard error (SE) of the coefficients for the OLS and standard deviation (SD) of the permuted null coefficients for the Elastic Net.
Out-of-site generalization for N-Back behavioral performance
The ABCD collected the data from several sites in the US29. Thus, leave-one-site-out cross-validation allowed us to assess how generalizable the predictive accuracy of each method was, irrespective of fMRI machines and experimenters from each site. As opposed to splitting the data into 75% training: 25% test as in the out-of-sample prediction, here we split the data according to data collection sites. We left data from one site as a test set, as long as there were more than 100 participants in that site after quality control (leaving 17 sites), and cross-validated the prediction across these held-out sites. We use the same configurations for fitting and testing the mass univariate, the OLS, and the Elastic Net models with the out-of-sample prediction described above.
Out-of-scanner generalization for 10 other cognitive tasks
Here we examined if we could predict individual differences in cognitive processes beyond behavioral performance collected from the same fMRI task (the accuracy of the 2-back condition). Predicting behavioral performance collected from the same fMRI task may have captured idiosyncratic variables that are specific to the task and session, not necessarily capturing individual differences in cognitive processes per se. Thus, instead of using the accuracy of the 2-back condition as a response variable in the model, we used each of 10 cognitive tasks39,50collected outside of the fMRI session, as a response variable. We then used 25/75 train-test split and leave-one-site-out cross-validation to examine the performance of the mass univariate, the OLS, and the Elastic Net. Please see our github page for our scripts and detailed outputs: https://narunpat.github.io/TaskFMRIEnetABCD/NbackMassUniOLSEnetAllplots.html
Results
Out-of-sample prediction for N-Back behavioral performance
Fig.1 summarizes out-of-sample prediction for N-Back behavioral performance based on the 25/75 train-test split. For the mass univariate, the maximum out-of-sample Pearson’s r of all brain regions was .25. The average out-of-sample Pearson’s r of the regions that survived the FDR correction was .1 (SD = .07), and of those that survived the Bonferroni correction was .12 (SD = .06). For the OLS, the out-of-sample Pearson’s r was .45. For the Elastic Net, the best tuned mixture (.11) and penalty (.06) led to the out-of-sample Pearson’s r at .47.

We evaluated predictive ability of the three modeling methods (mass univariate, OLS, and Elastic Net) using correlations (Pearson’s r) between predicted vs. observed N-Back behavioral performance in the test set based on the 25/75 train-test split. Note that the mass univariate has multiple data points because its predictive ability was calculated separately for each region.
Statistical Inference for N-Back behavioral performance
Out of 167 regions, there were 13 regions that were statistically significant across the three methods, such as the left inferior frontal sulcus, left anterior cingulate cortex, right superior frontal gyrus and right middle frontal gyrus among others (see Fig. 2). For the mass univariate, 96 brain regions survived the FDR correction, and 69 brain regions survived the Bonferroni correction (see Fig. 2, 3). For the OLS, there were 22 brain regions that had a coefficient with p < .05 (see Fig 2, 4). For the Elastic Net, there were 29 brain regions that had a coefficient with empirical p < .05 (see Fig 2, 5).

We evaluated statistical significance using p < .05 in the training set. We only plotted brain regions that were statistically significant in one of the methods.

We based coefficients on the mass univariate (i.e., separate simple regressions at each brain region), having N-Back behavioral performance as a response variable and each brain region as an explanatory variable. We only plotted brain regions that passed FDR and/or Bonferroni corrections (p < .05).

We based coefficients on the OLS with brain regions as explanatory variables and N-Back behavioral performance as a response variable. We only plotted regions with p < .05.
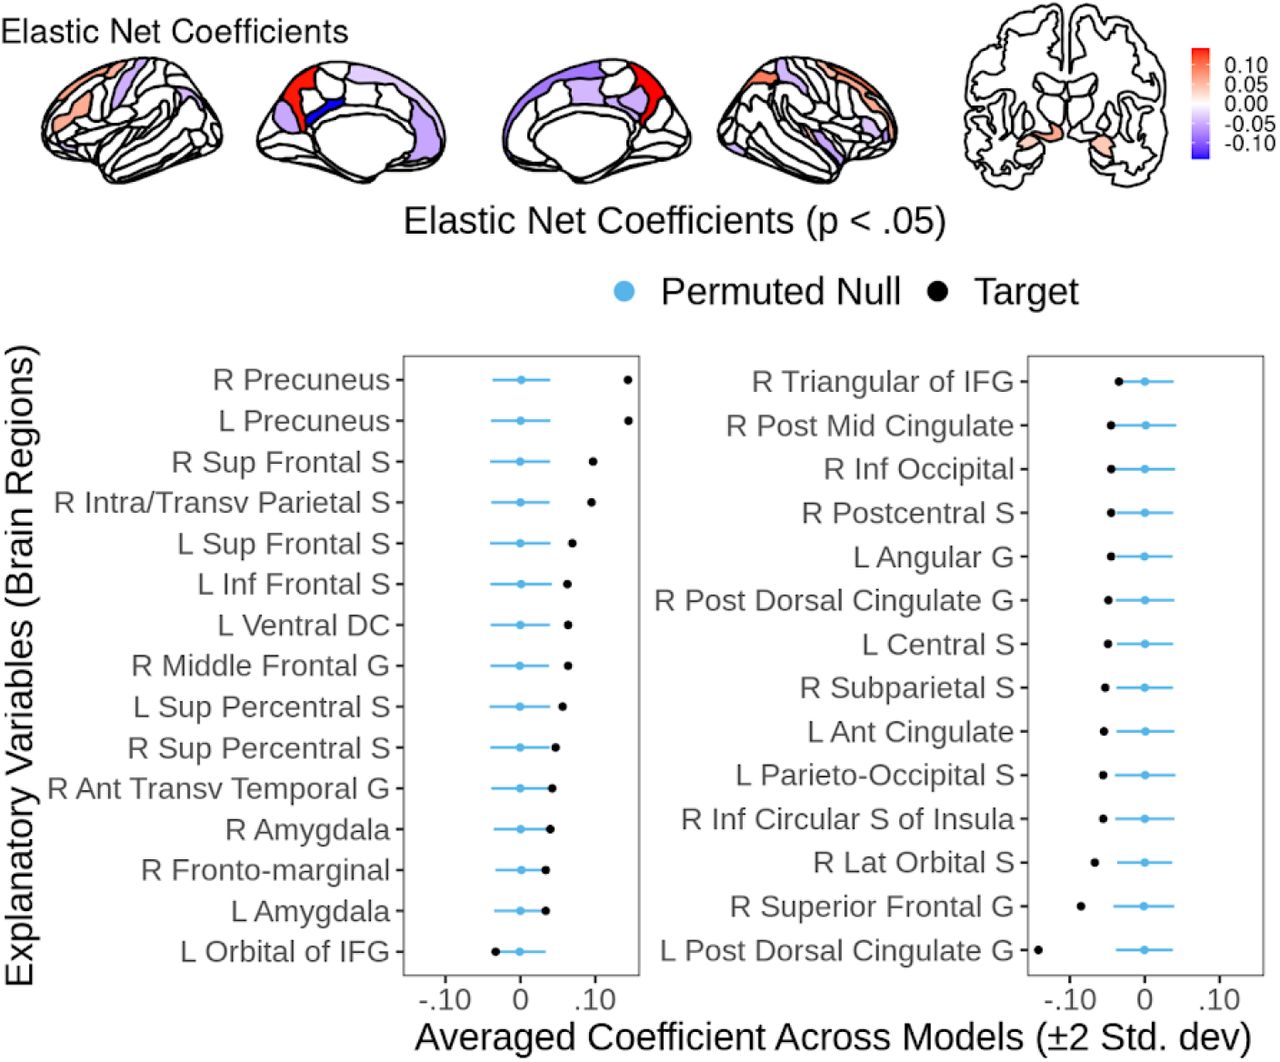
We based coefficients on the Elastic Net with brain regions as explanatory variables and N-Back behavioral performance as a response variable. We only plotted regions with empirical p < .05.
The VIF of many brain regions was higher than five (Median = 4.19, Q1-Q3 = 2.63-6.16, range = 1.58-11.23), indicating high multicollinearity among certain brain regions (see Fig 6). Fig 6 also shows the extent to which the VIF corresponded to the uncertainty estimates: standard error (SE) of the coefficients for the OLS and standard deviation (SD) of the permuted null coefficients for the Elastic Net. For the OLS, the coefficient SE linearly increased as a function of the VIF, from .016 at the lowest VIF to .052 at the highest VIF (see Fig 6a, 6b). In contrast, for the Elastic Net, the permuted null coefficient SD did not dramatically change as a function of the VIF, from .015 at the lowest VIF to .020 at the highest VIF (see Fig 6c, 6d). Thus, the statistical significance for the OLS was influenced by multicollinearity, much stronger than that for the Elastic Net.

We calculated the VIF based on the OLS model fit. Here we show explanatory variables with statistical significance (p < .05) in blue. 6a) and 6b) are based on the OLS. 6a) shows standard error (SE) of the coefficients as a function of the VIF. 6b) shows the coefficients plus 2*SE as a function of the VIF. 6c) and 6d) are based on the Elastic Net. 6c) shows standard deviation (SD) of the permuted null coefficients as a function of the VIF. 6d) shows the permuted null coefficients plus 2*SD as a function of the VIF.
Out-of-site generalization for N-Back behavioral performance
Fig. 7 shows the results of the leave-one-site-out cross-validation. Across sites, the out-of-site predictive ability of the Elastic Net and OLS were better than that of any single brain areas that passed the FDR and Bonferroni in the Mass Univariate.

We evaluated predictive ability of the mass univariate with FDR, mass univariate with Bonferroni, OLS, and Elastic Net using correlations (Pearson’s r) between predicted vs. observed N-Back behavioral performance in the held-out site. Note that mass univariate has multiple data points because predictive ability was calculated separately for each region that passed a multiple comparison correction (FDR or Bonferroni).
Out-of-scanner generalization for 10 other cognitive tasks
We demonstrated out-of-scanner generalization for 10 cognitive tasks collected outside of the fMRI session in Fig. 8 (25/75 train-test split) and Fig. 9 (leave-one-site-out cross-validation). The magnitude of out-of-scanner predictive ability (Pearson’s r) for the Elastic Net was numerically higher than that for the OLS in all 10 tasks. Generally, the Elastic Net and OLS had higher out-of-scanner predictive ability than the Mass Univariate, both with the FDR and Bonferroni corrections. Additionally, the predictive ability of the 10 out-of-scanner cognitive tasks was lower than that of the in-scanner N-Back. The best out-of-scanner predictive ability was language and vocabulary comprehension from the Picture Vocabulary task, while the worst predictive ability was the processing speed form the Pattern Comparison Processing task. Out-of-scanner working-memory from the List Sorting Working Memory task has the average out-of-sample Pearson’s r from the regions that survived the FDR correction at .07 (SD = .03), and from those that survived the Bonferroni correction at .09 (SD = .03). In comparison, the list sorting working memory task has the out-of-sample Pearson’s r for the OLS at .21 and for the Elastic Net at .26.
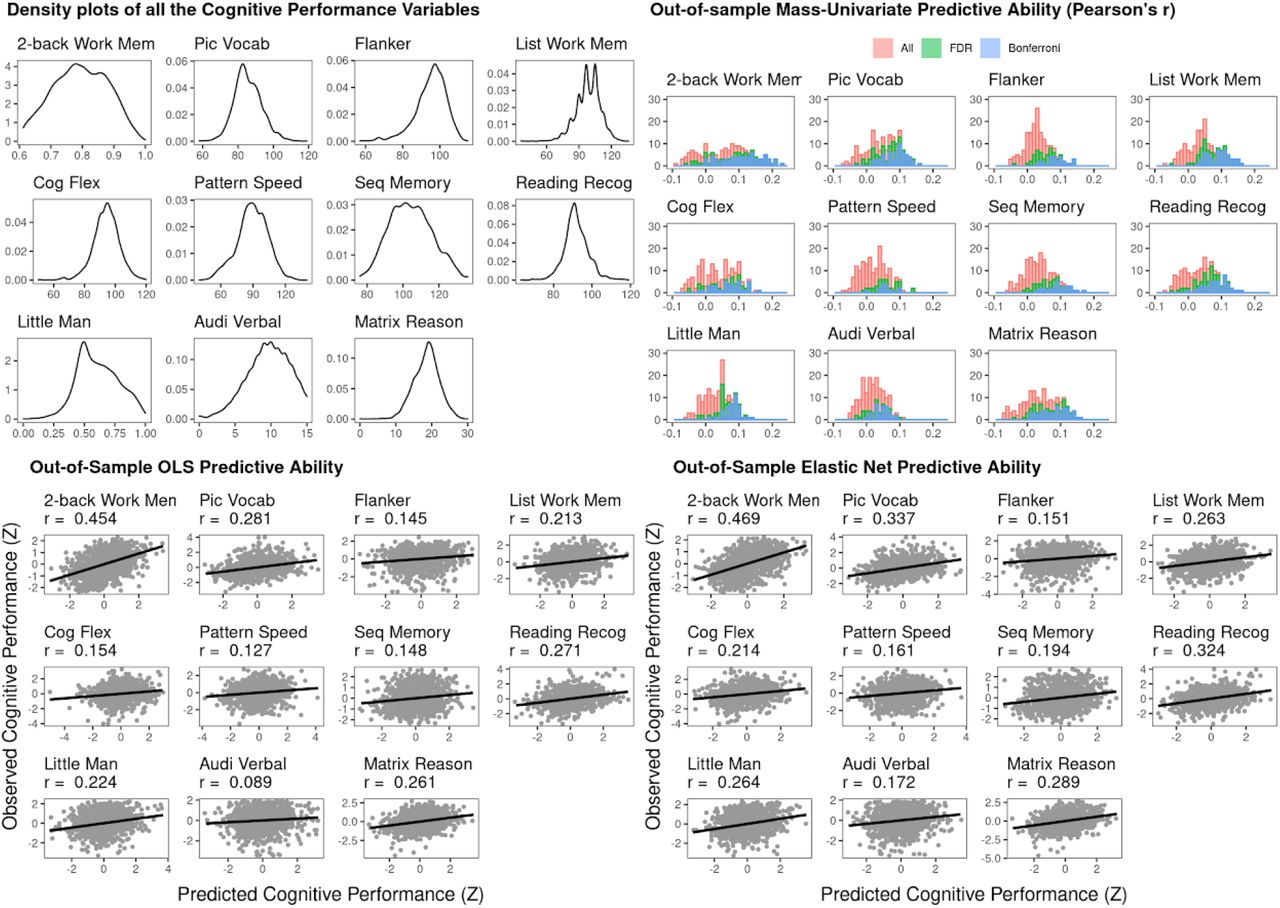
We evaluated predictive ability of the three modeling methods (mass univariate, OLS, and Elastic Net) using correlations (Pearson’s r) between predicted vs. observed behavioral performance across cognitive tasks in the test set based on the 25/75 train-test split. The top left figure shows density plots of behavioral performance from all cognitive tasks in the whole dataset.

We assessed predictive ability of the mass univariate with FDR and Bonferroni, the OLS, and the Elastic Net using correlations (Pearson’s r) between predicted vs. observed behavioral performance in the held-out site. Each dot represents the predictive ability from each held-out site. For the mass univariate with FDR and Bonferroni, the predictive ability was the median of Pearson’s r across brain regions that passed each respective multiple comparison correction.
Discussion
The conventional mass-univariate methods for task-based fMRI provided poor out-of-sample prediction for individual differences in behavioral performance collected from the same fMRI task (N-Back) and from other out-of-scanner cognitive tasks. The poor performance was present on the test data and on cross-validation across sites even with the conservative multiple-comparison correction (Bonferroni)49. Drawing information across brain regions using either the OLS or Elastic Net dramatically improved predictive ability. However, there was clear evidence of multicollinearity in the OLS regression, reflected by high VIF in many areas. This rendered the statistical inferences from the OLS problematic. The Elastic Net addressed multicollinearity by regularizing the magnitude of coefficients. Combining the Elastic Net with permutations in the eNetXplorer framework appeared to provide the best of both worlds: improving predictability while maintaining inference.
Majority of task-based fMRI research has implemented the conventional mass-univariate method. Considerable efforts have been made to improve its statistical inference12,13,27. Yet, its predictive ability seems to be largely ignored. Here we showed that the mass-univariate method lacked predictive ability in test samples and generalizability across sites and across cognitive tasks . The low predictive ability and generalizability of mass univariate analysis is likely to impede its clinical usefulness and research replicability. For instance, the mean r value from all of the regions that passed the Bonferroni correction we obtained from the mass univariate is .12. With alpha = .05, this r value requires a sample size of 540 to achieve a priori power at .8. This sample size is far beyond those used in usual task-based fMRI studies, and thus we would expect failure to replicate in many task-based fMRI studies that focus on predicting brain-behavior relationships across individuals using the mass univariate. The problem can be worse for studies with a much more complicated task than the well-defined N-Back and for studies aiming to predict individual differences outside of fMRI scanning sessions.
Drawing information across the whole brain via the OLS or Elastic Net enhanced our capacity to use task-based fMRI for out-of-sample prediction, out-of-site generalization and out-of-scanner generalization by many folds. Although this enhancement is still far from being usable in clinical practice, it provided a realistic effect size for research replicability. For instance, with alpha=.05, the out-of-sample r value for the Elastic Net, .47, requires a sample size of 30 to achieve a priori power at .80. This sample size is within a modern standard for fMRI research that investigates brain-behavior relationships.
Combining the Elastic net with permutation (i.e., the eNetXplorer1 approach) not only improves predictive ability and generalizability but also potentially improves statistical inference. It relaxes an assumption about independent contributions from different brain areas and allows pooling of contributions across brain areas. It is well accepted that cognitive phenomena do not result from activity of individual brain areas in isolation, but instead from activity of integrated networks51. The conventional mass-univariate methods overlook this integrative nature of brain function and do not exploit all available information from multiple brain areas. Moreover, eNetXplorer1 addresses the issue of multicollinearity that violates the OLS’ assumption which thus undermines statistical inference for its explanatory variable. As demonstrated here (Fig 6a,b) and elsewhere17–20, the OLS resulted in higher uncertainty (i.e., wider standard errors) for variables with high multicollinearity. This means, using the OLS, we may miss regions with coefficient magnitudes that would have been significant under non-collinear conditions. The problem of having higher uncertainty for regions with high multicollinearity was less concerning for the Elastic Net (Fig 6c,d). Thus, using regularization, the Elastic net addressed the issue of multicollinearity, enabling researchers to simultaneously identify the significant regions as well as to use the data from the current study to build an easy-to-interpret model that should provide accurate predictions for future studies.
From our out-of-scanner generalization analysis, we were able to train the Elastic Net and OLS models based on fMRI during the N-Back task to predict behavioral performance of other cognitive tasks, not collected simultaneously with the fMRI. We observed variability in the level of generalizability among tasks. This suggests that fMRI activity during the n-back tasks reflected multiple cognitive processes, some of which may be used more generally and therefore be active whilst performing other cognitive tasks. Of note, we were able to predict individual differences in behavioral performance from the List Sorting Working Memory task31 reasonably well (r = .26 in the Elastic Net case). Yet, this predictive ability was lower compared to that of behavioral performance collected during the fMRI session from the N-Back task (r = .47), which was also thought to capture working memory. This means, behavioral performance during the fMRI N-Back task may capture variability beyond individual differences in working memory that might be idiosyncratically specific to the N-Back task itself and session (e.g., arousal, attention and other processes). Thus, this suggests that our framework can be used to build predictive models for specific (N-Back during the fMRI recording) or for more general (working memory and other cognitive tasks) situations.
Given the emergence of large-scale, task-based fMRI studies52, one potential use of Elastic Net/eNetXplorer is to build predictive models that provide summary statistics for future smaller studies. This is similar to polygenic scores in genomics9 where geneticists use large discovery datasets to build models that reflect addictive effects of SNPs across the genome on certain phenotypes of interest. Geneticists can then use summary statistics from these discovery datasets to compute polygenic scores of separate, often smaller target samples, to reflect their propensity to develop the phenotypes. Polygenic scores are interpretable based on the effect sizes of SNPs that are associated with phenotypes.9 Polygenic scores also improve replicability of genetics studies, compared to the classical “candidate-gene” approach.53 Here we suggest that neuroimagers can take a similar approach to build a predictive model based on task-based fMRI from large-scale studies. This predictive model provides summary statistics (i.e., coefficients) for future studies to compute indices, termed here as poly-brain-regional scores, that reflect individual differences in cognitive processes of interest probed by the task used. Future task-based fMRI studies that examine the same cognitive processes can then use the same task and compute these poly-brain-regional scores without having to collect the large amount of data. As we showed here, the poly-brain-regional scores seem to provide improved predictive ability, and thus should enhance power and in turn replicability for task-based fMRI studies.
Our study has limitations. While the ABCD dataset is one of the largest datasets with task-based fMRI available29, its sample as of 2020 has a very restrictive age range. The predictive model built from our study may only be generalized to children aged 9-10 years old. However, given that the study will trace the participants until they are 19-20 years old, future studies will be able to use a similar approach to ours and expand the age range. Next, our method shown relied on Freesurfer’s parcellation36,37, which is the only parcellation available post-processed from the ABCD release 2.0.132. This commonly used parcellation is based on subject-specific anatomical landmarks, but its regions are relatively large. Future studies may need to demonstrate predictive ability with smaller parcels, which will lead to higher number of regions, and in turn, higher number of explanatory variables, but might also result in higher inconsistencies in identifying areas across participants. Lastly, there were many large outliers in the data that we dealt with via listwise deletion. The mass univariate, OLS, and Elastic Net all rely on minimizing the sum of the squared errors, which can be disproportionately influenced by outliers54,55. In the future, it may be useful to combine the Elastic Net/eNetXplorer workflow with robust versions of the penalised regression54,56, in order to eliminate the need for removal of outliers.
To conclude, using a large-scale study, we demonstrated that the conventional mass-univariate approach for task-based fMRI led to poor predictive ability for inter-individual brain-behavior relationships. Drawing information from multiple brain areas across the whole brain appeared to improve predictive ability, both on hold-out test set and cross-validated across scanning sites and to avoid the reliance on multiple comparison corrections. Using a novel approach, eNetXplorer, we were able to maintain the statistical inferences without sacrificing our ability to interpret the contribution from different areas due to multicollinearity. Taking advantage of the availability of large-scale studies in task-based fMRI, our predictive modeling approach allows future studies to calculate “poly-brain-regional scores” that reflect individual-difference variables of interest. We believe our approach should enhance the usefulness and replicability of task-based fMRI signals for neuroimaging, similar to what polygenic scores have done for genetics.
Acknowledgments
Data used in the preparation of this article were obtained from the Adolescent Brain Cognitive Development (ABCD) Study (https://abcdstudy.org), held in the NIMH Data Archive (NDA). This is a multisite, longitudinal study designed to recruit more than 10,000 children age 9-10 and follow them over 10 years into early adulthood. The ABCD Study is supported by the National Institutes of Health and additional federal partners under award numbers U01DA041022, U01DA041028, U01DA041048, U01DA041089, U01DA041106, U01DA041117, U01DA041120, U01DA041134, U01DA041148, U01DA041156, U01DA041174, U24DA041123, U24DA041147, U01DA041093, and U01DA041025. A full list of supporters is available at https://abcdstudy.org/federal-partners.html. A listing of participating sites and a complete listing of the study investigators can be found at https://abcdstudy.org/scientists/workgroups/. ABCD consortium investigators designed and implemented the study and/or provided data but did not necessarily participate in analysis or writing of this report. This manuscript reflects the views of the authors and may not reflect the opinions or views of the NIH or ABCD consortium investigators. The authors also thank developers who have maintained R packages used here, including but not limited to eNetXplorer1, ggseg2, tidyverse3 and tidymodels4.
Footnotes
Declaration of Interest: The authors declare no competing interests.
Funding: NP was supported by Otago Medical Research Foundation and Oakley Mental Health Research Foundation. YW and AS were supported by Otago Medical Research Foundation.
https://narunpat.github.io/TaskFMRIEnetABCD/NbackMassUniOLSEnetAllplots.html
References


