

Abstract
Brain regions within a posterior medial network (PMN) are characterized by sensitivity to episodic tasks, and they also demonstrate strong functional connectivity as part of the default network. Despite its cohesive structure, delineating the intranetwork organization and functional diversity of the PMN is crucial for understanding its contributions to multidimensional event cognition. Here, we probed functional connectivity of the PMN during movie watching to identify its pattern of connections and subnetwork functions in a split-sample replication of 136 participants. Consistent with prior findings of default network fractionation, we identified distinct PMN subsystems: a Ventral PM subsystem (retrosplenial cortex, parahippocampal cortex, posterior angular gyrus) and a Dorsal PM subsystem (medial prefrontal cortex, hippocampus, precuneus, posterior cingulate cortex, anterior angular gyrus). These subsystems were anchored by two complementary regions: Retrosplenial cortex mediated communication between parahippocampal cortex and the Dorsal PM system, and posterior cingulate cortex mediated communication among Dorsal PM regions. Finally, the distinction between PMN subsystems is functionally relevant: whereas both Dorsal and Ventral PM connectivity tracked the movie content, only Ventral PM connections increased in strength at event transitions and appeared sensitive to episodic memory. Overall, these findings provide a model of PMN pathways and reveal distinct functional roles of intranetwork subsystems associated with event cognition.
1. Introduction
Complex cognitive processes, such as understanding and remembering events, rely on the functional interactions of brain networks, defined as groups of structurally and functionally connected brain regions. One such network is the posterior medial network (PMN), which consists of regions that are strongly functionally connected with the parahippocampal cortex, including posterior medial temporal lobe, medial and lateral posterior parietal cortex, and medial prefrontal cortex (Libby et al., 2012; Wang et al., 2016). As part of the default network (Buckner et al., 2008; Raichle et al., 2001), the PMN seems to play a pivotal role in event perception and memory, with its network-level functional role described as forming situational or contextual models (Ranganath & Ritchey, 2012; Reagh & Ranganath, 2018; Ritchey, Libby, et al., 2015). An important characteristic of events is that they are multidimensional, including their visuo-spatial content, conceptual significance, and attributed thoughts and emotions. While large-scale networks help to paint a broad picture of regions that tend to affiliate during cognitive tasks, distinct components of cognitive processes are likely associated with smaller subnetworks of brain regions (Cabeza & Moscovitch, 2013), refined from the large-scale network in which they are embedded. Therefore, understanding how the PMN supports the representation of multidimensional events requires a better understanding of its subnetwork architecture (Ritchey & Cooper, 2020). Here, we deconstruct the organization of the PMN and test how its constituent connections relate to event cognition.
Regions of the PMN tend to function in a cohesive manner, exhibiting strong task-independent correlations in BOLD activity within the default network as well as task-related coactivation. Prior research has shown increased activity across the PMN during the recollection and construction of specific events (Benoit & Schacter, 2015; Rugg & Vilberg, 2013; Schacter et al., 2007; Spreng et al., 2009), network-wide multivariate representation of event-specific information (Chen et al., 2017; Robin et al., 2018), as well as reliable PMN responses to transitions between event contexts (Baldassano et al., 2017; Ben-Yakov & Henson, 2018; Reagh et al., 2020). Research that has directly modulated the PMN also supports its cohesive structure: non-invasive brain stimulation of left angular gyrus (AG) — a cortical gateway to the default network —increases both BOLD activity (Kim et al., 2018), and functional connectivity throughout the PMN during episodic tasks (Warren et al., 2019), confirming the strong functional dependence between these regions. Functional communication within the PMN not only increases during event processing, but also dynamically tracks the amount of information later recalled (Cooper & Ritchey, 2019; Simony et al., 2016). The overarching role of PMN communication appears tied to the construction of meaningful contextual frameworks, as evidenced by increasing connectivity among PMN regions as the temporal structure of naturalistic events is learned (Aly et al., 2018). Beyond this research, it is important to highlight the functionally diverse organizational structure of the PMN, a flexibility which may explain its ability to dynamically adapt to varying task demands.
Two emerging lines of evidence suggest that although episodic construction may describe PMN function at the network level, there is also significant diversity of cognitive processes and functional connectivity profiles associated with PMN regions (Ritchey & Cooper, 2020). The first line of research illustrating PMN diversity comes from the multidimensional analysis of mnemonic content, drawn from both standard episodic tasks as well as movie perception and recall. Separable attributes of episodic memory are associated with distinct PMN regions: Whereas medial temporal lobe (MTL) regions facilitate success retrieval of event information, parietal cortex tracks the richness of that information, with memory imageability and precision dissociating medial and lateral parietal regions, respectively (Richter et al., 2016). Relatedly, the PMN is fractionated by transient activation within the hippocampus and retrosplenial cortex when accessing episodic information, and sustained activation in dorsal medial and lateral parietal cortex during elaboration (Daselaar et al., 2008; Thakral et al., 2017; Vilberg & Rugg, 2012). Interestingly, PMN regions also show variable temporal resolutions of event context signals during movie watching (Baldassano et al., 2017; Keidel et al., 2017). Ventral medial parietal cortex and parahippocampal cortex separate events at short time-scales whereas dorsal medial and lateral parietal cortex separate events at longer time-scales (Baldassano et al., 2017; Chen et al., 2016). Additionally, parahippocampal and ventral parietal signals are stronger when there is a new narrative context, but lateral parietal activity is increased when an existing context is maintained (Keidel et al., 2017). Taken together, such dissociations point to a hierarchical structure of event cognition within the PMN, with specific event information being conveyed from the MTL and ventral parietal cortex to update representations in dorsal and lateral parietal regions.
The second line of research suggesting a diverse PMN organizational structure comes from resting-state analyses that have shown fractionation of the large-scale default network into distinct subsystems. Such research has demonstrated the presence of a cortical MTL network, including parahippocampal cortex and ventromedial parietal cortex, and a more dorsal network including posterior cingulate cortex, prefrontal cortex, and lateral temporal cortex (Andrews-Hanna et al., 2010; Barnett et al., 2020; Braga & Buckner, 2017; Gordon et al., 2020; Kaboodvand et al., 2018). Moreover, activity of these subsystems appears to correlate with distinct, yet related, cognitive domains: An MTL network may be driven by spatial-contextual processes (Baldassano et al., 2016; Silson et al., 2019) and a Dorsal Medial network shows sensitivity to conceptual information and mental states (Andrews-Hanna et al., 2010; Barnett et al., 2020; DiNicola et al., 2020). The PMN identified in studies of event perception and memory includes brain regions that bridge these previously defined default subsystems. Yet, a focused analysis of intranetwork PMN connectivity, where network definition is limited to areas specifically associated with episodic processing, is lacking. Understanding the organization of the PMN could help to shed light on why the aforementioned functional dissociations occur. Specifically, what are the paths of information flow between brain regions that are associated with episodic processing? And are there functionally distinct subsystems within the PMN that differentially contribute to event cognition?
To address these outstanding questions, we analyzed a subset of the Cambridge Centre for Ageing and Neuroscience (CamCAN) dataset (Shafto et al., 2014; Taylor et al., 2017), a large population-representative sample of individuals who underwent a rich behavioral and neuroimaging testing protocol, generating data ideal for the estimation of dynamic changes in functional connectivity of the PMN during movie watching. First, we aimed to identify separable PMN subsystems based on voxel connectivity patterns. Second, we used partial correlations and nodal lesion analysis to determine the most dominant functional pathways as well as key regions that mediate connectivity within the PMN. Finally, we tested the functional significance of intranetwork PMN connectivity dynamics in terms of their sensitivity to movie content, including event transitions, and their relation to individual differences in episodic memory.
2. Material and Methods
2.1 Data
The data analyzed here were obtained from the CamCAN Stage II data repository (Shafto et al., 2014; Taylor et al., 2017): https://camcan-archive.mrc-cbu.cam.ac.uk/dataaccess/. From this dataset, we selected healthy young adult subjects aged 18-40 who are right-handed, native English speaking, and who had completed the movie watching fMRI scan. A total of 154 (80 female, 74 male; mean age = 30.92, SD = 5.64) subjects met this criteria. After data quality checks, detailed in section 2.4, 18 subjects were removed from the sample, leaving 136 subjects for all analyses. Due to this large sample size, we randomly divided subjects into two equal groups (68 subjects per group), equating for age (group 1: mean = 31.06, SD = 5.75; group 2: mean = 31.12, SD = 5.52) and gender (35 females and 33 males per group). All statistical analyses were run first on group 1 only, allowing us to explicitly test the replicability of our results with group 2.
2.2 Task
In the MRI scanner, participants watched a 8 minute movie (Shafto et al., 2014). The movie was a shortened episode of Alfred Hitchcock’s “Bang! You’re Dead” (Hasson et al., 2008, 2010) that was cut in a way that retained the central plot (see Ben-Yakov & Henson, 2018). To allow us to quantify meaningful changes in context during the movie — transitions from one ‘event’ to another — we used the event boundaries as defined by Ben-Yakov & Henson (2018). As part of their study, a sample of 16 participants were asked to watch the movie and to indicate whenever they felt like one event ended and another began. The authors used these subjective ratings to define 19 likely ‘boundaries’ in the movie. For the purpose of the current analyses, we used these times to create event transition windows, defined as the boundary TR +/- 2 TRs to capture any gradual changes in context around the boundary, additionally shifted forward by 2 TRs to account for the hemodynamic lag.
2.3 MRI data acquisition
The CamCAN MRI data were collected using a Siemens 3T TIM Trio scanner, with a 32 channel head coil, at the MRC Cognition and Brain Sciences Unit, Cambridge, UK. Diffusion-weighted imaging (DWI) data were acquired with a twice-refocused spin echo sequence, with 30 diffusion gradient directions each for b values of 1000 and 2000 s/mm2, and three images acquired using a b value of 0 [66 axial slices, TR = 9.1 s, TE = 104 ms, FOV = 192 × 192mm, voxel size = 2 × 2 × 2mm]. Functional data during movie watching were acquired with a multi-echo T2* EPI sequence over 193 volumes [32 axial slices, 3.7mm thick, 0.74mm gap, TR = 2470ms, TE = [9.4, 21.2, 33, 45, 57] ms, flip angle = 78 degrees, FOV =192 × 192mm, voxel size = 3 × 3 x 4.44mm]. T1 images were acquired with a 3D MPRAGE sequence [TR = 2250ms, TE = 2.99ms, TI = 900ms, flip angle = 9 degrees, FOV = 256 x 240 x 192m, 1mm isotropic voxels, GRAPPA acceleration factor = 2]. Fieldmap scans were additionally collected for distortion correction of functional data [TR = 400ms, TE = 5.19ms/7.65ms, 1 Magnitude and 1 Phase volume, 32 axial slices, 3.7mm thick, 0.74mm gap, flip angle = 60 degrees, FOV = 192 × 192mm, voxel size = 3 × 3 × 4.44mm].
2.4 FMRI data processing
The description of MRI data processing below was taken, with minimal adaptations, from the custom language generated by fMRIPrep (Esteban et al., 2018), which has been released under the CC0 licence and is recommended for use in publications.
MRI data was preprocessed using fMRIPrep 1.5.2; https://fmriprep.org/en/stable/; RRID:SCR_016216), which is based on Nipype 1.3.1 (Gorgolewski et al., 2011); https://nipype.readthedocs.io/en/latest/; RRID:SCR_002502). Many internal operations of fMRIPrep use Nilearn 0.5.2 (https://nilearn.github.io/; RRID:SCR_001362). The T1-weighted (T1w) image was corrected for intensity non-uniformity with N4BiasFieldCorrection, distributed with ANTs 2.2.0 (http://stnava.github.io/ANTs/, RRID:SCR_004757), and was then skull-stripped with a Nipype implementation of the antsBrainExtraction.sh workflow (from ANTs), using OASIS30ANTs as target template. Brain tissue segmentation of cerebrospinal fluid (CSF), white-matter (WM) and gray-matter (GM) was performed on the brain-extracted T1w using fast (FSL 5.0.9; https://fsl.fmrib.ox.ac.uk/fsl/fslwiki; RRID:SCR_002823). Volume-based spatial normalization to the MNI152NLin6Asym template was performed through nonlinear registration with antsRegistration (ANTs 2.2.0), using brain-extracted versions of both T1w reference and the T1w template.
For the functional data, first, a reference volume and its skull-stripped version were generated using a custom methodology of fMRIPrep. A deformation field to correct for susceptibility distortions was estimated based on a field map that was co-registered to the BOLD reference, using a custom workflow of fMRIPrep. Based on the estimated susceptibility distortion, an unwarped BOLD reference was calculated for a more accurate co-registration with the anatomical reference. Head-motion parameters with respect to the BOLD reference (transformation matrices, and six corresponding rotation and translation parameters) were estimated before any spatiotemporal filtering using mcflirt (FSL 5.0.9). BOLD runs were slice-time corrected using 3dTshift from AFNI (https://afni.nimh.nih.gov/; RRID:SCR_005927). The BOLD time-series (including slice-timing correction) were resampled onto their original, native space by applying a single, composite transform (using antsApplyTransforms) to correct for head-motion and susceptibility distortions. A T2* map was estimated from the preprocessed BOLD by fitting to a monoexponential signal decay model with log-linear regression. For each voxel, the maximal number of echoes with reliable signal in that voxel were used to fit the model. The calculated T2* map was then used to optimally combine preprocessed BOLD across echoes. The optimally combined time series was carried forward as the preprocessed BOLD, and the T2* map was also retained as the BOLD reference. The BOLD reference was then co-registered to the T1w reference using flirt (FSL 5.0.9) with the boundary-based registration cost-function. Co-registration was configured with nine degrees of freedom to account for distortions remaining in the BOLD reference. The BOLD time-series were then resampled to the MNI template with 2mm voxel resolution.
FMRIPrep calculates several confounding time-series based on the preprocessed BOLD. Framewise displacement (FD) and DVARS were calculated for each functional run, both using their implementations in Nipype (following the definitions by (Power et al., 2014). Three global signals were extracted within the CSF, the WM, and the whole-brain masks. Additionally, a set of physiological regressors were extracted to allow for component-based noise correction using the CompCor method (Behzadi et al., 2007). Principal components were estimated after high-pass filtering the preprocessed BOLD time-series (using a discrete cosine filter with 128s cut-off) for the two CompCor variants: temporal (tCompCor) and anatomical (aCompCor). tCompCor components are calculated from the top 5% variable voxels within a mask covering the subcortical regions. This subcortical mask is obtained by heavily eroding the brain mask, which ensures it does not include cortical GM regions. aCompCor components are calculated within the intersection of the aforementioned mask and the union of CSF and WM masks calculated in T1w space, after projection to the native space of each functional run. After preprocessing with fMRIPrep, the confounds were inspected to determine if data met the criteria for inclusion. Subjects were excluded if more than 20% of time points exceeded a FD of 0.3mm and/or if the mean FD exceeded 0.2mm. After careful visual inspection of the data, subjects were additionally excluded if notable artifacts were present or preprocessing had failed. The CONN v.18.b toolbox (Whitfield-Gabrieli & Nieto-Castanon, 2012); https://web.conn-toolbox.org/; RRID:SCR_009550) was used to denoise the BOLD time-series with nuisance regression prior to analyses. For each subject, confound time-series included in the model were the six head motion parameters and their temporal derivatives, the first six aCompCor components from a combined white matter and CSF mask, and framewise displacement (FD). Additional spike regressors were included for any time points that exceeded a FD of 0.6mm and/or a standardized DVARS of 2. The mean number of spikes identified across subjects was 1.61 (max=13) out of 193 time points. After regression of motion confounds, BOLD data were band-pass filtered with a high-pass filter of 0.008 Hz and a low-pass filter of 0.1Hz. BOLD data were kept unsmoothed for extracting the mean time-series from regions of interest (ROIs), but were smoothed with a 6mm FWHM kernel for seed-to-voxel connectivity analyses.
2.5 DWI data processing
DWI data were processed using FSL (https://fsl.fmrib.ox.ac.uk/fsl/fslwiki; RRID:SCR_002823) and MRtrix (http://mrtrix.org; RRID:SCR_006971). Data were denoised, corrected with eddy current correction, and bias-field corrected. Constrained spherical deconvolution was used in calculating the fiber orientation distribution, which was used along with the brain mask to generate whole-brain tractography (seed = at random within mask; step size = 0.2 mm; 10 million tracts). After tracts were generated, they were filtered using spherical-deconvolution informed filtering of tractograms (SIFT) to improve the quantitative nature of the whole-brain streamline reconstructions (Smith et al., 2013). This algorithm determines whether a streamline should be removed or not based on information obtained from the fiber orientation distribution, which improves the selectivity of structural connectomes by using a cost function to eliminate false-positive tracts. Tracts were SIFTed until 1 million tracts remained. Connectomes were generated by using FLIRT to apply a linear registration to a 471-region sub-parcellated version of the Harvard-Oxford atlas (HOA) (Davis et al., 2017) to register it to each subject’s native diffusion space. The sub-parcellated HOA has the advantage of full cortical and subcortical coverage and relatively uniform, isometric ROI sizes. Connectomes describe the number of streamlines connecting any pair of regions. Out of 68 subjects per group, 61 subjects in group 1 and 59 subjects in group 2 had available DWI data.
2.6 Regions of interest
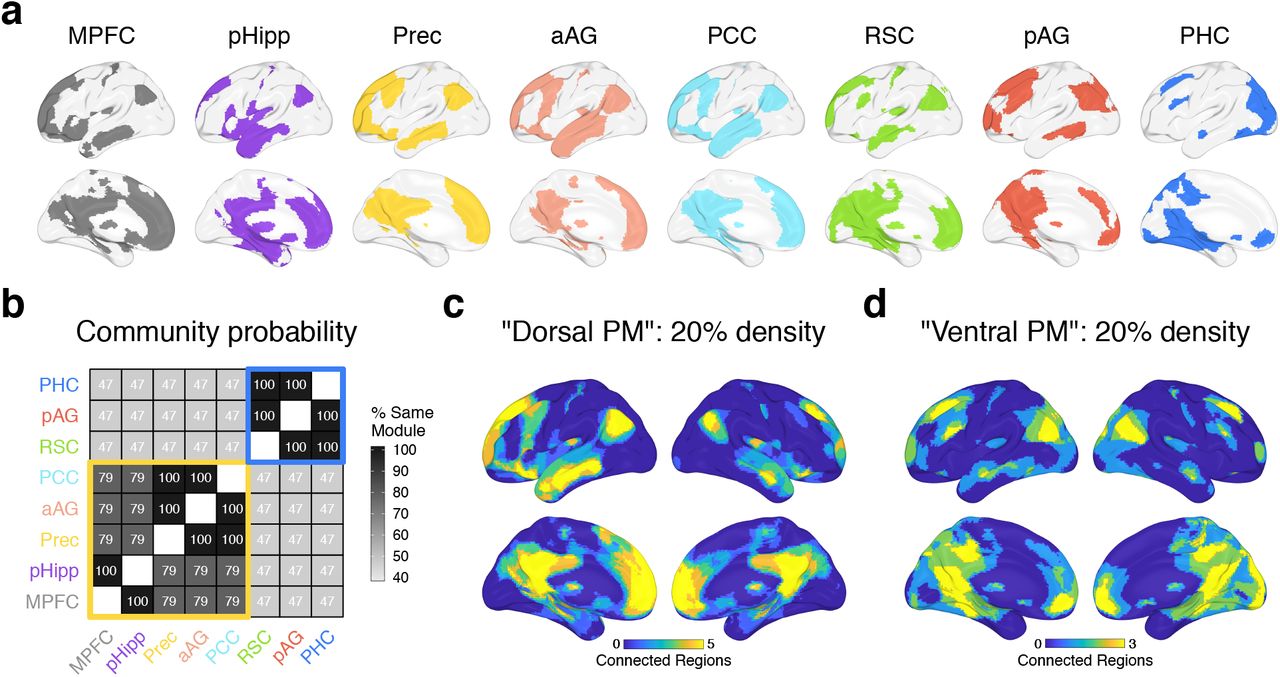
We used a combination of functional and anatomical atlases in order to accurately delineate our PMN ROIs. Specifically, posterior medial regions within two previously characterized default subsystems were selected from a cortical atlas (Schaefer et al., 2018) — labeled ‘Default A’ and ‘Default C’ — which reflect regions that are associated with constructive and episodic processes (Andrews-Hanna et al., 2010, 2014; DiNicola et al., 2020). We additionally included the posterior hippocampus (body and tail) from a probabilistic parcellation (Ritchey et al., 2015) due to its well-known role in episodic memory, sensitivity to event boundaries (Reagh et al., 2020), and connectivity to cortical PMN regions (Libby et al., 2012). Next, we used “episodic”-related activity, as defined by a Neurosynth meta-analysis (Yarkoni et al., 2011), to search for a single functional peak within each regional mask, except for medial parietal cortex regions (covering precuneus and posterior cingulate) where two peaks separated by at least 10 voxels were identified. To create each ROI, 100 contiguous (adjoining faces) episodic-sensitive voxels (2 x 2 x 2mm) were selected that expanded out from a peak, constrained by the regional mask. This process resulted in 8 equal-sized clusters (Figure 1a): posterior hippocampus (pHipp), parahippocampal cortex (PHC), retrosplenial cortex (RSC), precuneus (Prec), posterior cingulate cortex (PCC), posterior angular gyrus (pAG), anterior angular gyrus (aAG), and medial prefrontal cortex (MPFC). For estimation of white matter pathways, we selected regions within the sub-parcellated HOA that showed the greatest overlap (number of voxels) with the PMN clusters used for functional analyses.

Subsystems of the PMN derived from seed-to-voxel connectivity patterns. a) Left: PMN ROIs, showing each 100-voxel cluster. aAG = anterior angular gyrus, pAG = posterior angular gyrus, PCC = posterior cingulate cortex, MPFC = medial prefrontal cortex, pHipp = posterior hippocampus, PHC = parahippocampal cortex, RSC = retrosplenial cortex, Prec = precuneus. Right: Subsystems are estimated from the similarity of whole-brain seed-to-voxel connectivity patterns. b) The top 20% of group-averaged connections (binarized) between each seed and every voxel across the brain. c) Using connectivity density thresholds between 10% and 30%, Louvain community detection was run on the similarity of group-averaged voxel connectivity patterns with gamma values between 0.75 and 1.25. The matrix shows the percentage of the time each pair of ROIs were assigned to the same module across all density and gamma iterations. ROIs are grouped with hierarchical clustering for visualization, which reveals 2 subsystems. d&e) The overlap in binarized connections shown in (b) for regions of a “Dorsal PM” (d) subsystem (pHipp, MPFC, Prec, aAG, PCC) and for regions of a “Ventral PM” (e) subsystem (RSC, pAG, PHC). Warmer colors show a higher number of regions within connections to a voxel. Data is plotted from Group 1 (discovery sample) only — Group 2 (replication sample) results look almost identical, revealing the same subnetworks (Supplementary Results S.1).
2.7 Statistical analyses
All analysis code is available through our github repository: http://www.thememolab.org/paper-camcan-pmn/. Data were analyzed using MATLAB, R v3.5.1, and RStudio v1.0.143. Brain images were generated with BrainNet Viewer (Xia et al., 2013), and all other plots were generated with ggplot2 within the R tidyverse (https://www.tidyverse.org/).
2.7.1 Seed-to-voxel functional connectivity and subsystems
For each region of the PMN, seed-to-voxel connectivity values were calculated as the Pearson’s correlation between the mean ROI time-series (averaged over voxels in the unsmoothed data) and each voxel’s time-series (from smoothed data), resulting in a whole brain connectivity map per ROI and subject. Subject-level connectivity maps were averaged (after Fisher’s z transformation), per ROI, to produce group-level maps. Louvain community detection (Blondel et al., 2008), from the Network Toolbox (Christensen, 2018), was used to identify likely PMN subnetworks based on the similarity of group-averaged ROI voxel connectivity patterns, applied iteratively over different connection density thresholds and gamma values. Specifically, each ROI connectivity map was binarized according to density thresholds of 10-30%, by 5% increments, such that the top X% of voxel connections were marked as 1, with connections below that threshold marked as 0. The correlation between the binarized, group-averaged connectivity maps was calculated between every pair of ROIs, and this similarity matrix was run through the Louvain algorithm with gamma values between 0.75 and 1.25, in .01 increments. Each iteration of community detection, with a unique density and gamma combination, assigned the PMN ROIs to mutually exclusive groups, and the probability of every pair of ROIs being assigned to the same group was calculated across all iterations. Hierarchical clustering was applied to the matrix of shared probabilities to determine the most appropriate groupings of ROIs into subsystems.
2.7.2 Intranetwork time-averaged functional and structural connectivity
Intranetwork functional connectivity over the entire duration of the movie was calculated using both bivariate and partial correlations. The bivariate network was constructed simply as the pairwise Pearson correlations among the 8 ROI time-series. In contrast, the partial network was constructed as the correlation between the residuals of every pair of ROIs after regressing out the variance explained by the other six PMN regions from their time-series. Therefore, each partial edge in the network reflects an approximation of “direct” functional connectivity of two nodes, in that the path between them does not need to pass through any of the other six PMN nodes. Of course, any “direct” paths could be partially mediated by regions outside of the PMN, so we consider partial edges to reflect the most dominant intranetwork connections. Subject-level bivariate and partial networks were Fisher-z transformed prior to group-averaging, at which point values were transformed back to r values for visualization. Mean functional connectivity within and between the PMN subsystems was compared with t-tests to validate their distinction at the intranetwork level. For both bivariate and partial group-level networks, edges were retained if they were significant at p < .05 (Bonferroni-corrected for the number of possible edges, 28) across subjects. Each subject’s structural network was constructed as the shortest path length (weighted by streamline count) between every pair of PMN regions (n = 8) within the full structural parcellation (n = 471), such that a shorter path length reflects fewer edges with a higher streamline count required to connect two regions. As such, lower values for the weighted distance measure reflect a stronger, more direct connection between any pair of regions. Our use of the distance metric is motivated principally due to the fact that direct connections between lateral/medial regions (e.g., AG and PHC) or distant anterior/posterior regions (e.g., RSC and MPFC) are not reliable in typical diffusion imaging datasets, but the relationship between these regions can nonetheless be inferred through secondary/tertiary/etc. connections through mediating regions.
2.7.3 Virtual lesions and influential regions
In order to probe the specific mediating influence of each ROI on functional connectivity within the PMN, we implemented a “virtual lesion” analysis. This approach can be thought of as an iterative partial network, wherein, for every ROI m, the correlation between the residuals of all pairs of ROIs is calculated after removing the variance explained by m (also see Kaboodvand et al., 2018). The remaining network thus reflects connectivity after the “lesion” and, in contrast to the full partial network described in 2.6.2, reveals the influence of a single region on the PMN. The partial correlation values (c’) are then compared to the original, bivariate correlations (c) to calculate the proportion of PMN connectivity that is mediated by m [Pm = 1 - (c’/c)]. At the subject-level, the overall influence of m on PMN connectivity is calculated by contrasting the mean of c and c’ across all network edges. At the group-level, the mean values of c and c’ across subjects are contrasted per edge to illustrate the specific network pathways that m mediates. For this edge-specific analysis, edges were considered only if their group-level bivariate correlation value (c) exceeded .2, which ensured that there was a meaningful connection to potentially mediate. A mean r value of .2 was deemed to be a conservative threshold for defining a meaningful edge as it reflects the critical value for a significant correlation (at ɑ = .005) between our ROI time-series with 193 TRs. Prior to any averaging, both c and c’ were Fisher-z transformed. For both of the aforementioned subject-level and group-level analyses, we excluded any potential suppressing effects (where c’ > c, i.e. Pm < 0) by setting Pm to 0 in such instances, and also excluded the influence of mean negative values of c’ (i.e. Pm > 1) by setting Pm to 1 in these cases. Therefore, proportion mediated was constrained to the range 0-1.
2.7.4 Movie-related time-varying functional connectivity
Whereas the previous functional analyses were based on time-averaged connectivity across the movie, remaining analyses targeted the relevance of time-varying PMN connectivity in relation to the movie input. First, we considered the influence of event transitions in the movie on PMN connectivity. For each pair of ROIs, we entered their standardized time-series as well as their product (coactivation), reflecting the edge time-series (Faskowitz et al., 2019; van Oort et al., 2018), as predictors in a logistic regression model with event type (transition:1 vs. within-event:0) as the dependent variable [event ~ ROIi + ROIj + ROIi*ROIj]. The beta coefficient of the interaction term reflects the change in ROI coactivation at event transitions. These beta values were averaged within and between PMN subsystems to test the sensitivity of PMN connections to event transitions. This analysis was then repeated in conjunction with the virtual lesion approach described in 2.6.3 to investigate which PMN regions drive any event-related change in connectivity throughout the network. Here, prior to estimating the event transition regression model, the variance explained by a third ROI m was removed from the time-series of ROIs i and j. For each value of m, a group-level network was constructed reflecting the mean change in connectivity between every pair of ROIs after controlling for m. The subject-level beta values of each edge were tested against zero using a two-tailed t-test (p < .05, Bonferroni-corrected for the number of remaining edges after removing m and its variance, 21). The mean beta value of the rest of the network after removing m (reflecting the average change in connectivity at event transitions) was additionally summarized for each subject.
Second, we considered whether PMN connectivity dynamics are tied to fluctuations in the movie stimulus (including but not limited to event transitions), which are shared across subjects, or whether they reflect idiosyncratic fluctuations, which are distinct across subjects, by comparing the intersubject similarity of time-varying connectivity. Within each subject and for every time point t, we first calculated the Spearman correlation between every pair of ROI time-series over a window of 25 TRs (~60s) centered on t, resulting in a vector of time-varying connectivity. This window size is consistent with prior working characterizing time-varying correlations during movie-watching (Di & Biswal, 2020; Jang et al., 2017; Simony et al., 2016), with the aim of smoothing noise that accompanies the raw edge time-series or correlations over short windows (also minimized here with Spearman correlation), while preserving temporal resolution, before comparing time-varying connectivity between subjects (Di & Biswal, 2020). To test if PMN connectivity fluctuations are tied to the movie, we next calculated the intersubject Pearson correlation of time-varying connectivity vectors (Di & Biswal, 2020), averaged within each subsystem, using a leave-one-subject-out approach (Nastase et al., 2019): For each subject, we calculated the correlation between their time-varying connectivity and the average time-varying connectivity of all remaining subjects, resulting in one intersubject correlation value per subject. If connectivity fluctuations are meaningfully related to the movie content (shared across subjects), then the average intersubject correlation should be non-zero. We also compared the intersubject correlations of the same subsystem to intersubject correlations across different subsystems to test if movie-related dynamics of PMN subsystems are distinct from one another. All r values were Fisher-z transformed prior to averaging.
2.7.5 Memory-related intersubject representational similarity
In a final exploratory analysis, we tested how PMN connectivity relates to episodic memory on an independent task. Within our full sample of CamCAN subjects, exactly half (N=68) had also completed a separate item-scene memory task, where neutral objects were paired with a negative, neutral, or positive background scene. In a memory test, participants recalled the objects and their associated scene context, verbally describing the details of the scene (see Shafto et al., 2014 for a detailed task description). One subject was excluded from analyses due to a high number of response errors (> 50% of trials). We used the number of neutral trials for which the scene context was recalled in detail as a measure of episodic memory for each subject. As a control measure, we used priming of objects in the neutral condition, as indexed by corrected recognition of previously studied degraded objects.
We first considered the influence of time-averaged connectivity, testing if there was a correlation between mean PMN subsystem functional connectivity and episodic memory across subjects. Second, we considered the influence of time-varying connectivity by using intersubject representational similarity analysis (IS-RSA), as outlined by (Finn et al., 2020). A subject x subject representational dissimilarity matrix (RDM) was calculated for behavioral scores, and another was calculated for brain data. The brain RDM was defined as the intersubject dissimilarity (1 - Pearson correlation) of time-varying connectivity (or activity, see Supplemental Results) for each of the PMN subsystems. Two behavioral RDMs were tested — a nearest neighbor model, reflecting the Euclidean distance between the memory scores of every pair of subjects [abs(i-j)], and an “Anna K” model, where high performing subjects are assumed to be similar, with increasing variability among lower performing subjects [max score - min(i,j)]. The Spearman rank correlation was then calculated between every behavioral RDM and brain RDM. To determine the significance of the behavior-brain correlations, 10,000 permutations were run, wherein the subject labels for the brain RDM were shuffled for every permutation. The p-value for the behavior-brain comparison was calculated as the proportion of permutation correlations that were greater than the true correlation. Bonferroni-corrected p-values were also calculated, correcting for the total number of tests (6: 2 behavioral models x 3 time-varying connectivity measures).
3. Results
The analyses presented below tested the architecture of the PMN during movie watching, and how its connections relate to events in the movie. We used patterns of whole-brain connectivity to distinguish two PMN subsystems and then assessed the strength of intranetwork connectivity within and between subsystems. Next, we investigated the mediating influence of individual regions on the strength of PMN connections. Finally, we tested how PMN subsystems are similarly or differentially modulated by the content of the movie, including events transitions, and how PMN functional connectivity relates to individual differences in episodic memory.
3.1 PMN subsystems from voxel functional connectivity patterns
First, we tested whether regions in the PMN were dissociable based on their patterns of connections with the rest of the brain. To do so, we examined seed-to-voxel connectivity across the whole brain, using the similarity of whole-brain connectivity patterns between ROIs (Figure 1a) to group them into subsystems with Louvain community detection. Comparing the similarity of seed-to-voxel connectivity patterns across PMN ROIs revealed a high degree of overlap in the strongest connections. As expected, voxels within the broader default network, including medial prefrontal cortex, medial and lateral parietal cortex, and lateral temporal cortex, were consistently within the top 20% of functional connections to PMN regions (Figure 1b), supporting their common grouping within a coherent network. However, two distinct PMN subsystems were identified (Figure 1c). We tested the replicability of these results in a second group of subjects, which revealed an identical allocation of ROIs to PMN subsystems (see Supplementary Results S.1).
Across multiple connection thresholds and Louvain gamma values, PHC, pAG, and RSC were grouped into the same module almost 100% of the time, hereafter referred to as the “Ventral posterior medial (PM)” subsystem (Figure 1e). These regions shared a module assignment with other ROIs approximately 50% of the time. On the other hand, MPFC, pHipp, Prec, aAG, and PCC were assigned to the same module at least 78% of the time, hereafter referred to as the “Dorsal PM” subsystem (Figure 1d). Due to this high overlap and limited number of ROIs, we grouped all 5 of these regions together, but it is interesting to note that pHipp and MPFC were particularly similar in their voxel connectivity patterns, being grouped into the same module 100% of the time. The same was true for Prec, aAG, and PCC, suggesting that a finer-grained parcellation may be possible.
3.2 Functional and structural architecture of the PMN
Next, we examined connections within the set of PMN ROIs. Like the seed-to-voxel analyses, Pearson’s correlations between the ROI time-series confirmed a high-degree of interconnectedness (Figure 2b). Despite significant connectivity between virtually all pairs of ROIs, evidence for the subsystems identified in 3.1 was supported (Figure 2d) — on average, connections within both the Ventral and Dorsal PM subsystems were stronger than connections between them (ts(67) > 4.32, ps < .001; replicated in Group 2: ts(67) > 4.06, ps < .001). However, the high bivariate connectivity throughout the PMN can be influenced by the presence of indirect connections, making it difficult to parse what the underlying functional pathways might be. Therefore, to identify functional connections not explained by other PMN regions, a full partial network was constructed, wherein each connection reflects the unique variance between a pair of ROIs after controlling for all other PMN regions. The partial correlation analysis revealed a far more sparse network structure (Figure 2c) while preserving and even amplifying the finding of greater connectivity within the subsystems than between them (Figure 2e) (ts(67) > 7.22, ps < .001; replicated in Group 2: ts(67) > 7.03, ps < .001). The majority of significant partial edges (r > 0, p < .05 Bonferroni-corrected) detected in Group 1 were replicated in Group 2, including the selective communication of PHC to the Ventral PM subsystem and pHipp, the integration of RSC with dorsal medial parietal and prefrontal cortex in addition to the Ventral PM subsystem, and the strong coupling between PCC and both aAG and Prec.
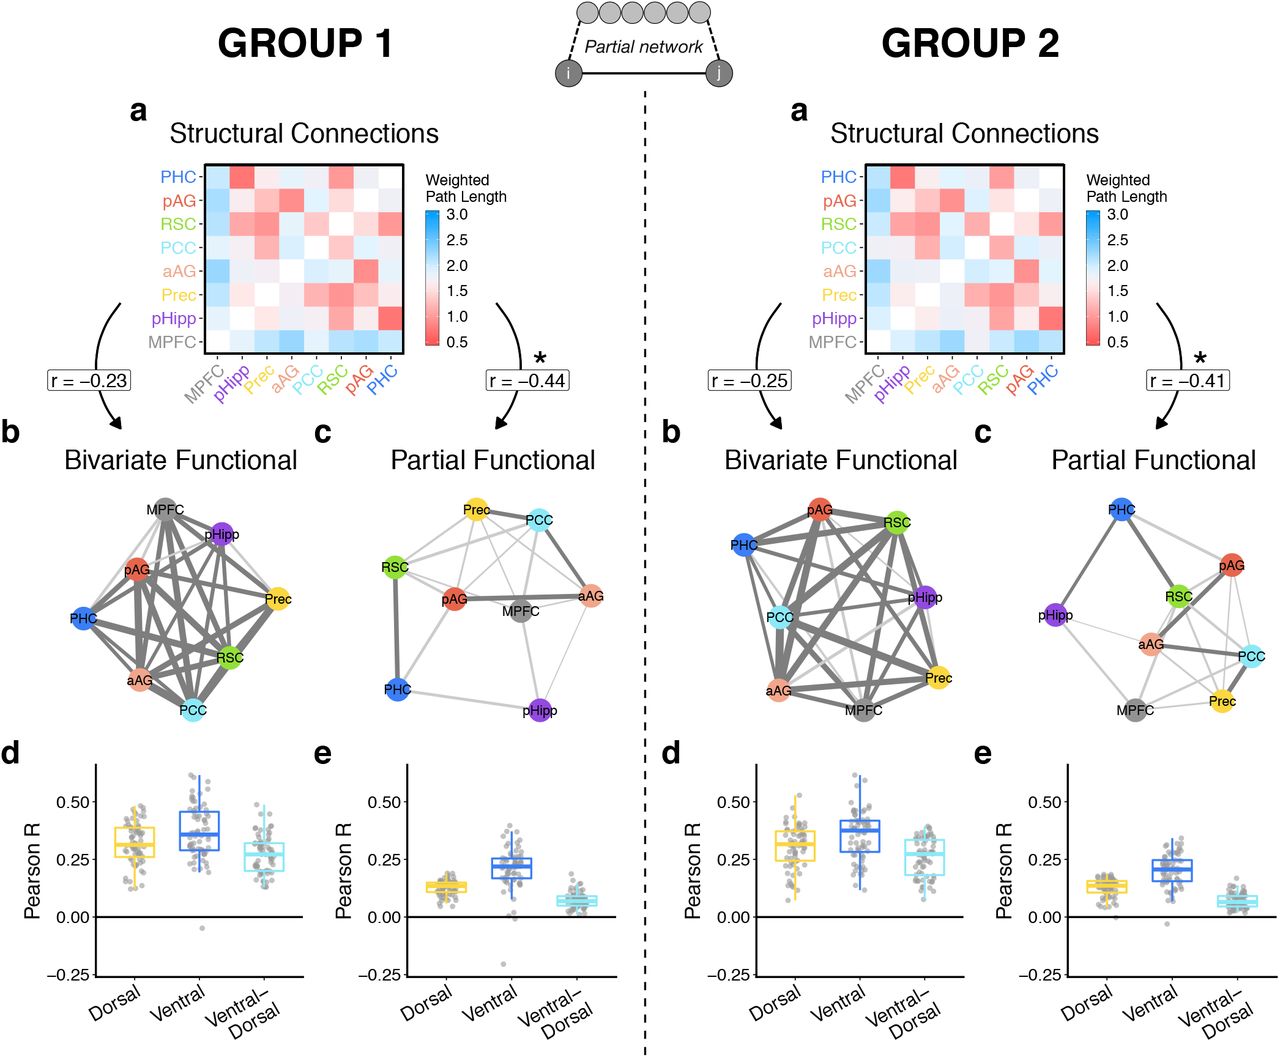
Intranetwork PMN connectivity. Top Center: ‘Direct’ functional connections were estimated via a partial network, wherein the connection between i and j reflects unique variance unexplained by the other 6 PMN regions. Left = Group 1 (discovery sample) results; right = Group 2 (replication sample) results. a) Structural connectivity between PMN regions, represented as the average shortest path length weighted by the number of streamlines. b&c) Functional edges calculated from the bivariate correlation (b) or partial correlation (c) between the time series of every pair of PMN ROIs, averaged across subjects. Dark edges = mean r > .2, all edges = mean r > 0, p < .05 (Bonferroni-corrected). d&e) The distribution of mean bivariate (d) and partial (e) functional connectivity across subjects within and between PMN subsystems. Each point indicates a subject.
Correlating the unique edges of each subject’s functional network with the distance measures of each subject’s structural network (Figure 2a) revealed a stronger correspondence for partial (Group 1: mean Z = −.19, 95% CI = [−.24, −.14]; Group 2: mean Z = −.19, 95% CI = [−.24, −.14]) than bivariate (Group 1: mean Z = −.10, 95% CI = [−.16, −.04]; Group 2: mean Z = −.13, 95% CI = [−.18, −.08]) correlations (Group 1: t(60) = 5.30, p < .001; Group 2: t(58) = 3.71, p < .001). Note here that we expect a negative relationship between functional connectivity (correlation of time series) and our measure of structural connectivity (structural distance, with smaller values corresponding to more closely, strongly connected region pairs). For group-averaged networks, there was a significant relationship between edges of the partial functional network and the structural network (r = −.443, t(26) = −2.52, p = .018), replicated in Group 2 (r = −.413, t(26) = −2.31, p = .029), but not between the bivariate functional network and the structural network (Group 1: r = −.230, t(26) = −1.21, p = .24; Group 2: r = −.250, t(26) = −1.31, p = .20). Therefore, the functional architecture of the PMN revealed with partial correlations is more representative of its underlying structural organization.
3.3 Virtual lesions reveal key PMN hubs
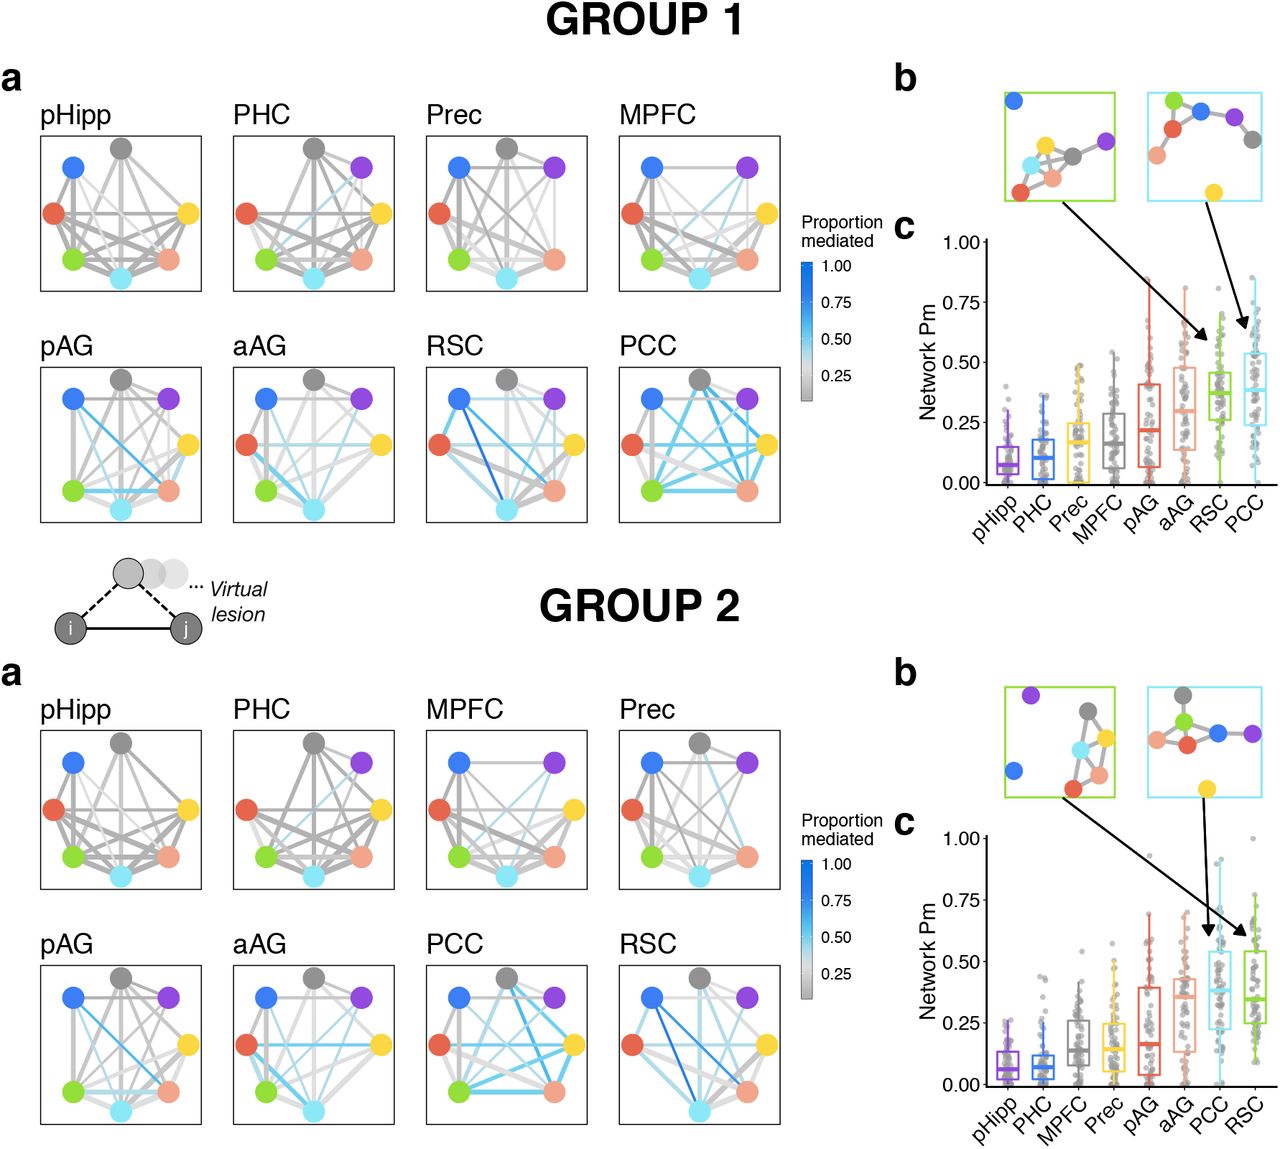
The full partial network structure provides insight into the overall pattern of information flow throughout the PMN, helping to disentangle a highly interconnected system. In order to further understand how individual ROIs mediate specific network pathways, we conducted a “virtual lesion” analysis to identify the influence of each ROI on the rest of the network. Eight partial networks were constructed, each removing one ROI’s edges and the variance in other edges explained by the ROI. This analysis allowed us to calculate the proportion of an edge (Figure 3a) as well as the mean functional connectivity of the remaining network (Figure 3c) that was mediated by the “lesioned” ROI (proportion mediated = Pm).

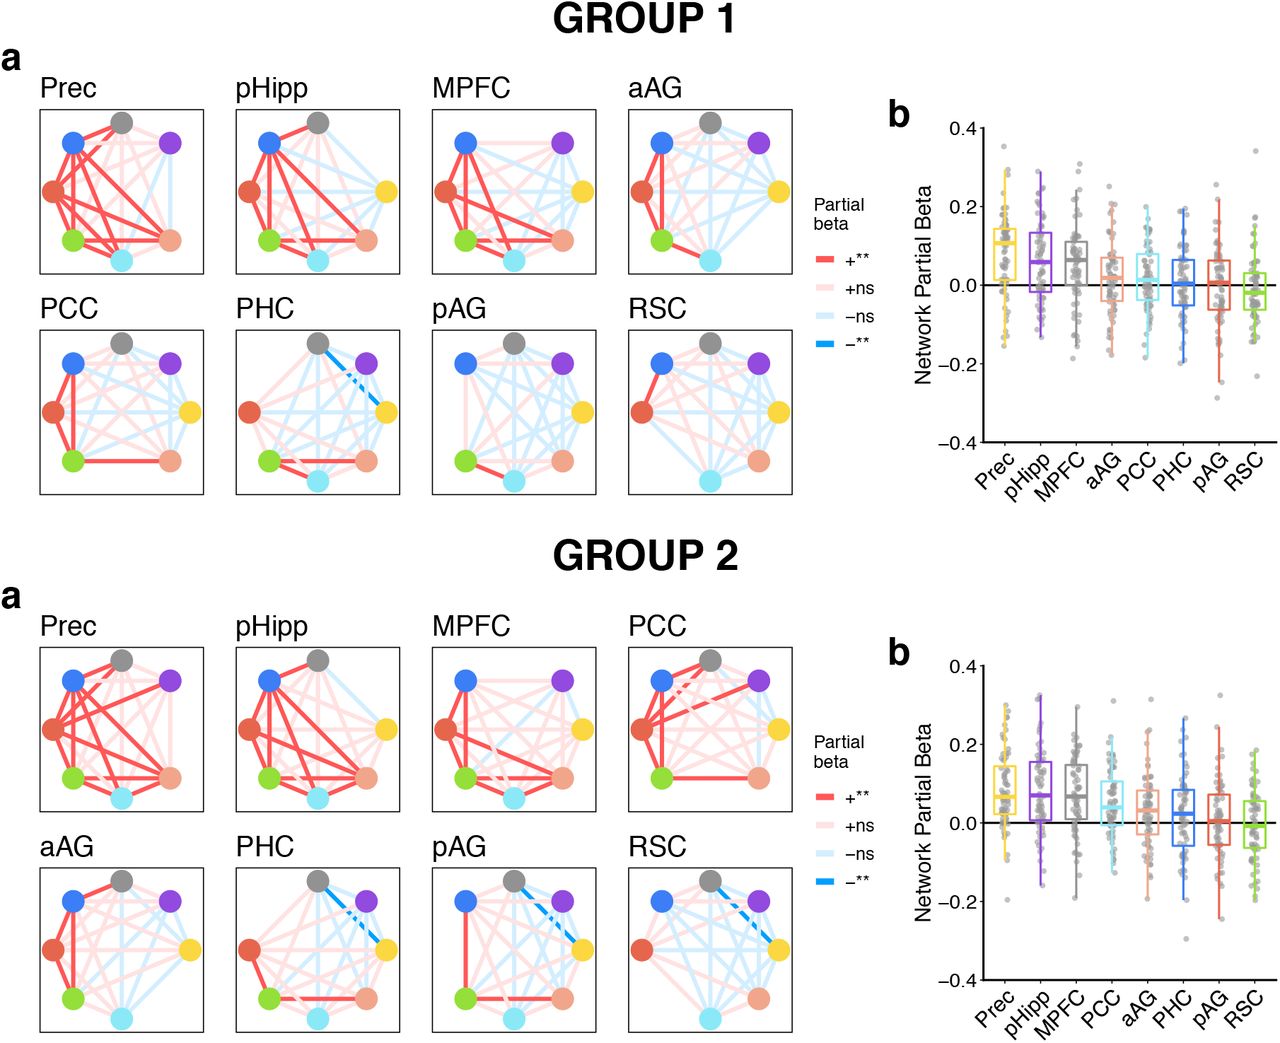
Virtual lesions of PMN ROIs. Top = Group 1 (discovery sample) results; bottom = Group 2 (replication sample) results. Middle left schematic: Similar to the partial network approach but iterative by ROI, a ‘virtual lesion’ measures the mediating effect of an ROI on network connectivity. a) The effect of removing the variance explained by each ROI on PMN edges. Plotted edges reflect all group-averaged bivariate correlations (r) > .2, with width reflecting the original, bivariate edge strength. Edge color indicates the proportion of the edge that is mediated by the ROI labelled in the top left of each panel (removed from the accompanying graph), such that blue colors indicate a larger reduction in an edge’s strength relative to gray colors. Proportion mediated (Pm) values for edges are calculated based on group-averaged data. b) The effect of RSC (left) and PCC (right) lesions on connectivity between remaining PMN regions, showing edges (mean r) that are > .2 after statistical removal of the ROI. c) For each subject (point), the proportion of mean connectivity across the rest of the network that is mediated by the ROI along the x axis. Panels in (a) are sorted by total network Pm as shown in (c).
These results revealed a number of interesting patterns. First, pHipp, PHC, Prec, and MPFC have a relatively small mediating influence on the rest of the PMN (top row, Figure 3a), replicated in Group 2. This suggests that, even though these regions communicate with one another and other PMN regions, few intranetwork connections are mediated by their activity. There were two notable exceptions, replicated in Group 2 — PHC influences connectivity of pHipp to RSC, and MPFC also partially mediates connectivity of pHipp to RSC and PCC. Second, both anterior and posterior AG exert a moderate influence on PMN connectivity, but with specific roles: pAG mediates communication between the Ventral PM system (PHC and RSC) and aAG. In turn, aAG mediates connectivity between pAG and dorsal medial parietal regions — Prec and PCC. Finally, RSC and PCC appear to be hubs, exerting the strongest influence on PMN connectivity, but with complementary roles: As observed from panels in Figure 3a and b, RSC mediates communication between the Ventral and Dorsal PM subsystems, with a particularly large influence on PHC pathways, but leaves communication between Dorsal PM regions largely intact. In contrast, PCC has almost no effect on connectivity among Ventral PM regions but substantially mediates communication among Dorsal PM regions, with the exception of pHipp-MPFC, as well as integration of the Dorsal PM subsystem with RSC.
3.4 PMN dynamics related to movie content
The prior results show the presence of two PMN functional subsystems and reveal key nodes that mediate their communication through analyses of time-averaged functional connectivity over the entire movie. Here, we sought to validate the functional significance of these subsystems in terms of their time-varying dynamics. First, we tested how connectivity within and between the subsystems changed at event transitions in the movie. In line with prior analyses of event boundaries in the CamCAN dataset (Ben-Yakov & Henson, 2018; Reagh et al., 2020), we confirmed a general increase in activity across our PMN ROIs at event transitions (see Supplementary Results S.2). Therefore, we asked how connectivity is modulated by event transitions over and above these activity changes.
We found a striking and replicable dissociation between the subsystems in the sensitivity of connectivity to event transitions. Whereas coactivation within the Dorsal PM subsystem did not change as a function of event transitions (Group 1: t(67) = −1.21, p = .23; Group 2: t(67) = 0.00, p = 1), there was a strong increase in coactivation within the Ventral PM subsystem (Group 1: t(67) = 8.50, p < .001; Group 2: t(67) = 8.95, p < .001), and between Ventral and Dorsal PM regions (Group 1: t(67) = 4.80, p < .001; Group 2: t(67) = 6.88, p < .001) (see Figure 4a&b). In both groups, the change in functional connectivity of the Ventral PM subsystem at event transitions was significantly greater than changes within the Dorsal PM subsystem (Group 1: t(67) = 7.84, p < .001; Group 2: t(67) = 7.40, p < .001) and between Ventral and Dorsal PM regions (Group 1: t(67) = 6.78, p < .001; Group 2: t(67) = 5.27, p < .001). A follow-up analysis combining the event-transition ~ connectivity regression model with virtual lesions (see Supplementary Results S.3) showed that RSC, in particular, mediated the event-related increase in connectivity across the network — a “lesion” of this region eliminated the increase in PMN functional connectivity at event transitions.

Change in PMN connectivity at event transitions. Left = Group 1 (discovery sample) results; right = Group 2 (replication sample) results. Center-top schematic: Network edges within and between PMN subsystems were related to event transitions in the movie over time. a) The group-averaged beta values, reflecting the change in connectivity between each pair of ROIs at an event transition relative to within an event. Warmer colors reflect an increase in connectivity at a transition. b) The distribution of mean subsystem changes in connectivity at event transitions. Each point indicates a subject, * indicates a change significantly greater than zero at p < .05. c) Group-averaged time-varying connectivity is plotted for connections within and between the PMN subsystems. Line = mean across subjects, ribbon = standard error of the mean. Gray windows indicate event transition phases within the movie (shifted by 2TRs to account for the HRF). Note that some transition windows are immediately adjacent to one another, producing wider windows. Time-varying connectivity is calculated using a 25-TR sliding window, centered on each TR.
To probe movie-related connectivity dynamics within and between the PMN subsystems beyond their specific relation to event transitions, we additionally calculated time-varying connectivity using a sliding-window (Figure 4c). We then compared the similarity of time-varying connectivity across subjects to determine if PMN subsystem connectivity was related to the movie content (shared across subjects) and if connectivity of the two PMN subsystems exhibited similar or distinct fluctuations. Interestingly, visual inspection of the data shows that the only point during the movie where group-averaged connectivity among Dorsal PM regions exceeded that among Ventral PM regions was during a prolonged event, without any transitions, from approximately 100s to 182s. Intersubject correlations revealed that connectivity fluctuations of the whole PMN appear to be tied to the movie content, as evidenced by significant intersubject similarity of time-varying connectivity for both the Ventral PM subsystem (Group 1: mean Z = 0.23, SE = 0.04, t(67) = 6.03, p < .001; Group 2: mean Z = 0.20, SE = 0.04, t(67) = 5.45, p < .001) and the Dorsal PM subsystem (Group 1: mean Z = 0.30, SE = 0.05, t(67) = 6.74, p < .001; Group 2: mean Z = 0.25, SE = 0.04, t(67) = 5.57, p < .001). In contrast, there was not a positive intersubject relationship between the time-varying connectivity of the Ventral PM subsystem and the time-varying connectivity of the Dorsal PM subsystem (Group 1: mean Z = −0.09, SE = 0.03, t(67) = −3.04, p = .003; Group 2: mean Z = −0.02, SE = 0.02, t(67) = −1.01, p = .32). Therefore, connectivity fluctuations within PMN subsystems appear tied to the movie input, as reflected in consistent patterns across subjects, but movie-related connectivity dynamics of the Dorsal and Ventral PM subsystems are distinct from one another.
3.5 Relationship between PMN network dynamics and episodic memory
The prior analyses demonstrated functional differences between PMN subsystem connectivity patterns and their relation to the movie events. But what is the significance of PMN connectivity for memory-related behavior? To gain some preliminary insight into this question, we conducted exploratory analyses testing if functional connectivity related to individual differences in episodic memory performance on an independent task (Figure 5). In this task, participants were tested on their memory for the scene context associated with studied objects. Episodic memory was defined as the number of trials for which participants could describe the scene context in detail.

Relationship between PMN connectivity and episodic memory. a) Correlations between time-averaged functional connectivity and episodic memory. b) Intersubject representational similarity calculation, wherein a memory representational dissimilarity matrix (RDM) is correlated with a brain RDM. c) The memory RDM using a nearest neighbor model, where subjects with similar memory scores are assumed to have similar brain dynamics. The memory RDM using an “Anna K” model, where subjects with high memory are assumed to have similar brain dynamics, with low memory subjects assumed to be more variable. e&f) Null distributions of memory RDM - to - brain RDM Spearman rank correlations over 10,000 permutations, shuffling subject labels in the brain RDM. The solid, colored lines, indicate the correlation between the behavior and brain RDMs for each PMN subsystem. Permutations of the nearest neighbor model, f) Permutations of the “Anna K” model. g) Mean time-varying connectivity of the Ventral PM subsystem, plotted separately for high and low episodic memory subjects, defined by a median split (ribbon = standard error of the mean). Gray windows = event transitions in the movie for visualization.
There was no significant relationship between time-averaged PMN subsystem connectivity strength during the movie and episodic scores across subjects (Figure 5a; Dorsal: r = −.079, p = .52; Ventral: r = .178, p = .15; Ventral-to-Dorsal: r = .018, p = .88). Next, we used intersubject representational similarity analysis (Figure 5b; Finn et al., 2020) to test the relationship between time-varying connectivity and episodic memory. We tested two models — nearest neighbor (Figure 5c), where subjects with similar behavior are assumed to have similar connectivity dynamics, and an “Anna K” model (Figure 5d), where high performing subjects are assumed to have similar connectivity, with low performing subjects being more variable. A nearest neighbor model (Figure 5e) revealed no significant relationship between time-varying PMN connectivity and episodic memory (Dorsal: r = .030, p = .15; Ventral: r = .051, p = .053, Bonferroni-corrected p = .32; Ventral-to-Dorsal: r = .007, p = .37). However, the Anna K model (Figure 5f) suggested a positive, selective relationship between the intersubject similarity of episodic memory and Ventral PM time-varying connectivity (r = .101, p = .017) although we highlight that this effect did not survive correction across all 6 models (Bonferroni-corrected p = .10). This correlation was not present for time-varying Dorsal (r = .036, p = .20) or Ventral-to-Dorsal PM connections (r = .017, p = .30). Control analyses showed no significant correspondence between time-varying PMN processes and memory for activity or a measure of object priming from the same task (see Supplemental Results S.4).
To visualize any potential correspondence between Ventral PM subsystem connectivity and episodic memory, the mean time-varying connectivity was calculated for subjects with high (N=35) vs. low (N=32) memory scores, using a median split (Figure 5g). This revealed distinct changes in Ventral PM connectivity over the movie between memory groups: post-hoc tests for a linear trend in time-varying connectivity showed that subjects who had high episodic memory scores significantly increased their Ventral PM connectivity over time (mean Z = 0.326, t(34) = 5.31, p < .001), whereas subjects with lower scores did not (mean Z = 0.002, t(31) = 0.04, p = .97), which was significantly different between groups (t(64.6) = 3.67, p < .001). Therefore, not only do PMN subsystems show meaningfully distinct patterns of functional connectivity during movie watching, those dynamics, particularly of Ventral regions, may have implications for individuals’ episodic memory.
4. Discussion
The PMN is a structurally and functionally interconnected system that specializes in the construction of episodic representations. Prior work has provided valuable insight into the functional properties and representations of the PMN as a whole, but research is only just starting to map the organizational structure of the PMN, which is important for understanding the multidimensional nature of episodic thought (Ritchey & Cooper, 2020). To this end, we sought to tease apart functional pathways and subsystems within the PMN, testing how they relate to changes in event context and individual differences in episodic memory. First, we found that the PMN can be parcellated into two functional subsystems: a Ventral PM system comprising PHC, RSC, and posterior AG, and a Dorsal PM system comprising PCC, Prec, anterior AG, MPFC, and pHipp. These subsystems were highlighted through a partial network, which was related to the underlying structural organization of the PMN. Second, we showed that RSC is a key mediator of connectivity between PHC and the Dorsal PM system, whereas PCC mediated communication among Dorsal PM regions. Third, we found that although connectivity of both the Dorsal and Ventral PM subsystems tracked the movie content, showing time-varying similarity across subjects, there was a selective increase in functional connectivity of Ventral PM regions at event transitions. Finally, time-varying connectivity of the Ventral PM subsystem appeared to relate to individual differences in episodic memory.
The partition of the PMN into two separable functional subsystems during movie watching aligns with prior work considering fractionation of the broader default network during rest. Early approaches identified an MTL default subsystem, characterized by strong connectivity to PHC, that included RSC and posterior AG, and a Dorsal Medial subsystem, comprising dorsal MPFC and lateral temporal cortex, with these two subsystems converging on a Core subsystem of dorsal medial parietal cortex and MPFC (Andrews-Hanna et al., 2010). Recent work in individuals, however, has divided the default network into two interdigitated subsystems (Braga & Buckner, 2017; DiNicola et al., 2020) that retain notable overlap with groupings of PMN regions identified here. In particular, default network ‘A’ is characterized by strong functional connectivity to PHC, whereas default network ‘B’ includes regions within anterior lateral parietal cortex, PCC, and MPFC that appear similar to our Dorsal PM network. However, these parcellations have not included the hippocampus and other subcortical structures, and the individual-specific analyses do not afford a direct comparison with the current results or with group-level functional dissociations in the literature.
More recently, the default network has been segregated beyond two systems, including a separate Parietal Network of middle AG, medial parietal cortex, and anterior MPFC, and a Ventromedial Network of hippocampus and ventral MPFC (Barnett et al., 2020; Gordon et al., 2020). We also observed some evidence for a functional divide within the Dorsal PM system, with reliable clustering of hippocampus and MPFC based on similar patterns of whole-brain connectivity. Interestingly, these prior studies and our results suggest that the hippocampus may be more strongly aligned with the network organization of MPFC despite strong functional communication with PHC. Overall, the subsystems we revealed within the PMN during movie-watching appear to align with those that have been identified with a whole-brain approach during rest. An outstanding question, however, is whether movie-watching or other episodic paradigms might be best suited to studying the organization of PMN because they directly modulate the network. Finally, the partial network analysis results converged with patterns of structural connectivity, highlighting RSC as strongly interconnected within the PMN, demonstrating the utility of partial correlations for representing a network’s structure. Some notable differences emerged in this cross-modal comparison: the hippocampus is structurally connected to RSC —unsurprising given their close proximity—but their functional connection is not dominant within the PMN. Second, MPFC is quite distant from other PMN regions and thus only weakly structurally connected within the PMN but shows reliable functional integration with medial parietal cortex and hippocampus, and is often considered a hub within the broader default network (Buckner et al., 2008).
Beyond the overarching network organization, a virtual lesion analysis further revealed the influence of individual PMN regions. The hippocampus consistently exerted the lowest influence on network connectivity suggesting that, whereas PHC and connections of the Dorsal PM system — most notably MPFC — converge on the hippocampus, it may not drive communication among cortical PMN regions. In support, prior work suggests that temporal integration of narrative information during movie watching in Dorsal PMN regions may not depend on interactions with the hippocampus (Chen et al., 2016; Zuo et al., 2020). The hippocampus has been previously characterized as a gateway between the PMN and an anterior temporal (AT) network that processes item and emotional information (Ranganath & Ritchey, 2012; Ritchey, Libby, et al., 2015). Therefore, while it may not be central to situation models supported by cortical PMN regions, the hippocampus may be important for connecting the PMN with other brain networks. In contrast, RSC and PCC had a large influence on intra-PMN communication, but our analysis highlighted distinct mediating roles: RSC influenced communication between PHC and the Dorsal PM subsystem, whereas PCC influenced communication between Dorsal PM regions. The dominance of both RSC and PCC in the network supports prior work that has highlighted these areas as connectivity “hubs”. PCC is often regarded as an integrative hub of the default network (Andrews-Hanna et al., 2010; Buckner et al., 2008), as revealed with partial correlation analyses (Fransson & Marrelec, 2008), that can regulate information flow between default regions (Wang et al., 2019). Complementing the current findings, RSC in turn has been shown to mediate connectivity between the MTL and dorsal default network regions (Kaboodvand et al., 2018), and is thought to serve as a key area of transformation between MTL and dorsal parietal spatial codes (Bicanski & Burgess, 2018).
In addition to understanding the functional structure of the PMN, we sought to demonstrate the functional relevance of subsystems for event processing. Prior work has shown increased activity throughout the PMN at event boundaries (Ben-Yakov & Henson, 2018; Reagh et al., 2020). However, we observed a selective increase in connectivity of the Ventral PM subsystem, not among Dorsal PM regions, at event transitions. This dissociation highlights both a distinct finding from connectivity patterns that is not observed with regional activity alone, and a dominant role of Ventral PM communication, particularly involving RSC, in integrating events within the PMN. Interestingly though, time-varying connectivity of both the Ventral and Dorsal PM subsystems was 'synced' to the movie stimulus, as evidenced by intersubject correlations, but they were unrelated to one another. This suggests that the subsystems were related to different features of the movie, and thus the event-transition dissociation is not reflective of any overall difference in the sensitivity of connectivity fluctuations to movie content. The movie shown to participants was 8 minutes in total, with some events only lasting a few seconds. A fine-grained sensitivity to event structure among Ventral PM regions supports findings of a temporal event hierarchy in the PMN, with RSC and PHC processing the most high-resolution events in contrast to more slowly evolving context models in Dorsal PM regions (Baldassano et al., 2017; Keidel et al., 2017). Moreover, within the broader default network, connectivity between the medial temporal lobe and RSC, specifically, has been shown to increase during episodic tasks relative to rest (Bellana et al., 2017).
We suggest that, at local event boundaries, Ventral PM regions communicate with Dorsal PM regions to integrate the event with a sustained and more abstract contextual framework. This explanation is in line with evidence of intra-PMN dissociations in the reinstatement of event context, which is persistent in AG, Prec, and PCC and more transient in PHC and RSC (Jonker et al., 2018). An outstanding question, therefore, is whether within-Dorsal PM connectivity increases at boundaries characterized by less frequent thematic shifts that could not be explicitly modeled with the current task. Relatedly, it is unclear whether Ventral PM connectivity is particularly sensitive to boundaries that are characterized by shifts in visuo-spatial content or whether it reflects a content-general process that would be sensitive to other kinds of context shifts, such as semantic narrative. Providing some support for the latter, a prior study suggests that RSC and PHC are sensitive to changes in narrative context when visuo-spatial context is maintained (Keidel et al., 2017). Finally, a surprising finding was the lack of increase in hippocampal connectivity at event transitions, particularly given the dominant role of hippocampal event boundary signals in supporting memory (Cohen et al., 2015; Cooper & Ritchey, 2020; Reagh et al., 2020). It is possible, however, that the posterior hippocampus creates and separates event-specific representations (Chanales et al., 2017; Schlichting et al., 2015) in contrast to the integrated event structure (embedding specific events within an ongoing situational model) supported by cortical PMN communication (Aly et al., 2018).
Mirroring the modulation of PMN connectivity by movie event transitions, an exploratory analysis showed some evidence for a selective relationship between Ventral PM connectivity and episodic memory on an independent task. Subjects who had detailed recollection of scene context showed more similar patterns of time-varying Ventral PM connectivity during movie watching, which reflected an increase in connectivity over time. Ventral areas of the PMN, particularly PHC and RSC, are strongly related to the processing of spatial contextual information in memory and imagination (Gilmore et al., 2016; Robin et al., 2018; Silson et al., 2019), and PHC, RSC, and posterior AG have also been previously defined as a functionally connected system supporting scene memory (Baldassano et al., 2016; Steel et al., 2020). Moreover, functional connectivity of Ventral PM regions, specifically, has been previously related to episodic memory: One study found that PHC- and RSC-mediated resting state connectivity of the hippocampus and AG was related to TMS-enhanced spatial memory precision (Tambini et al., 2018). In another study, there was a selective relationship between MTL-RSC resting state connectivity and episodic memory that was not present for other default network connections (Kaboodvand et al., 2018). In contrast to this prior research, we did not find a relationship between time-averaged connectivity and individual differences in memory. Rather, we provide preliminary evidence that Ventral PM connectivity dynamics may be relevant for individual differences in episodic memory, although we highlight that the main effect did not survive Bonferroni correction. We speculate that increased Ventral PM connectivity over time in subjects could indicate an enhanced ability to bind spatial-contextual information, though future research will be required to test this hypothesis and, importantly, replicate the current results.
In conclusion, we revealed distinct functional subsystems of the PMN, whose pathways dynamically tracked movie content and were mediated in complementary ways by RSC and PCC. Communication of the Ventral PM subsystem was selectively modulated by event transitions during movie-watching and may relate to individual differences in episodic memory. Beyond these specific findings, our analyses point to both the utility and challenges of integrating large-scale networks with questions about specific cognitive operations, which are often studied in a region-centric manner. Understanding the subnetwork organization of brain networks, and mapping that organization to specific task-related factors, may be the key to understanding the functional relevance of large-scale networks associated with high-level cognitive processes (Cabeza et al., 2018; Cabeza & Moscovitch, 2013; Ritchey & Cooper, 2020). Overall, our findings provide a model of PMN organization, and highlight the significance of functional diversity of the PMN for event cognition.
Supplementary Results
S.1 Replication of PMN subsystems
The seed-to-voxel connectivity patterns were highly similar between Group 1 (shown in Fig.1, main paper) and the replication Group 2 (Fig.S1). The replication sample resulted in identical allocation of PM ROIs to two subsystems, also suggesting the potential for a more refined structure of the Dorsal PM subsystem with an alliance between pHipp and MPFC and a robust grouping of Prec-aAG-PCC.

Subsystems of the PMN from seed-to-voxel connectivity patterns: Replication (Group 2) results. a) The top 20% of group-averaged connections (binarized) between each seed and every voxel across the brain. b) The percentage of the time of each pair of ROIs were assigned to the same module across all density and Louvain gamma values. c&d) The overlap in binarized connections shown in (a) for regions of a “Dorsal PM” (c) subsystem (MPFC, pHipp, Prec, aAG, PCC) and for regions of a “Ventral PM” (d) subsystem (RSC, pAG, PHC).
S.2 Sensitivity of PMN activity to event transitions
The current analyses use the event boundaries identified by Ben-Yakov & Henson (2018) in their original analysis of the CamCAN movie-watching data. With a larger sample than that included here (due to a higher upper age limit) and different analysis methods (including larger ROIs from the Harvard-Oxford atlas), the authors showed increased activity of the hippocampus, PHC, and posterior medial cortex (including Prec and PCC/RSC) in response to event boundaries. To validate this finding with our methods and ROIs, the mean change in activity from within-event to event-transition time points was calculated for each subject from their z-scored time series, per ROI. Our results replicate those of Ben-Yakov & Henson as well as Reagh et al. (2020) in showing robust increases in activity at event boundaries across the PMN (Figure S2).
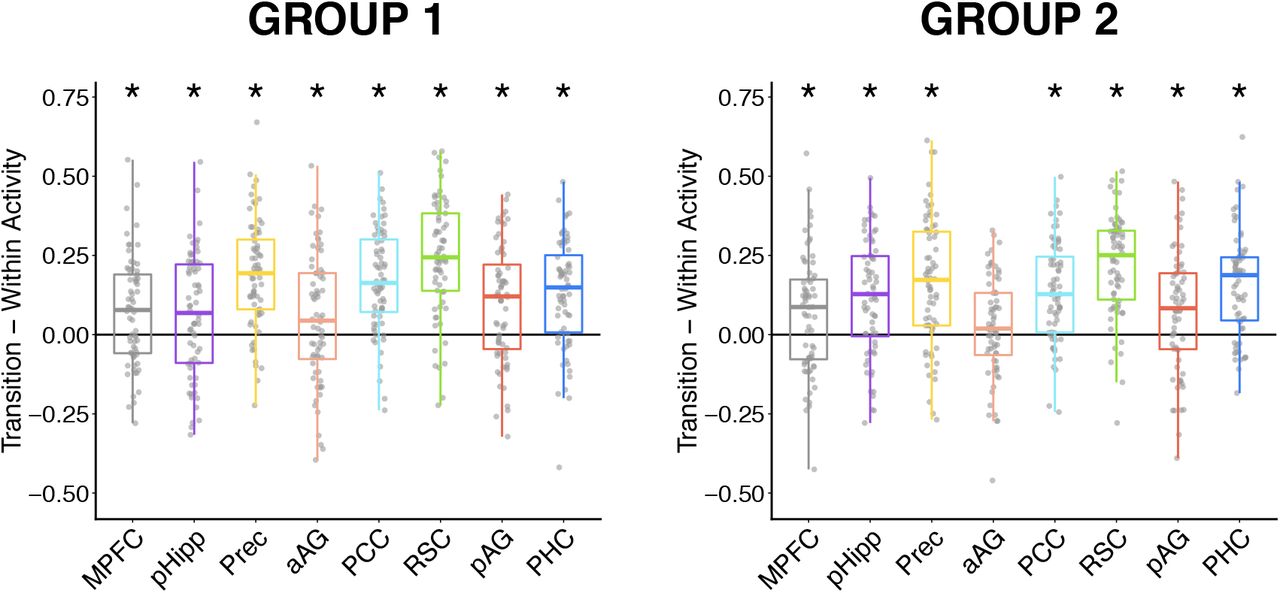
The change in activity between within-event time points and event transitions. ROI time series were first z-scored within each subject and mean activity was contrasted between phases. Points indicate individual subjects, * indicates p < .05, FDR-corrected across all ROIs. Results reveal a consistent increase in activity across the PM network at event transitions, that is replicated in group 2.
S.3 Virtual lesions of event-transition connectivity
Following the analysis of event-modulated connectivity (main paper, section 3.4), we probed which ROIs mediated the change in PMN connectivity at event transitions by using a variant of the virtual lesion analysis: The variance of each ROI was iteratively removed from the time-series of every other pair of ROIs, now before their coactivation time-series was used to predict event transitions. The edges that significantly change their connectivity at event transitions, after statistical removal of an ROI from the network, are shown in Figure S3. In both groups, a “lesion” of Ventral PM regions eliminated the overall increase in PMN connectivity at event transitions, which was particularly apparent for RSC (Group 1: t(67) = −0.92, p = .36; Group 2: t(67) = −0.51, p = .61). As expected, both PHC and pAG also substantially influenced event-modulated connectivity, but critically, when removing these ROIs, RSC connectivity changes persisted (Figure S3a). In contrast, removing pHipp and Prec from the network had virtually no effect on the overall increase in PMN connectivity at event transitions, which remained significant (Group 1: ts(67) > 4.76, ps < .001; Group 2: ts(67) > 6.38, ps < .001). These results suggest that RSC activity, in particular, drives the increased communication between Ventral and Dorsal PM regions when an event context shifts.

Effect of virtual lesions on event-modulated connectivity. Top = Group 1 (discovery sample) results; bottom = Group 2 (replication sample) results. a) The group-averaged partial beta values, reflecting the change in connectivity between each pair of ROIs at an event transition, as shown in Figure 4A, but now after removing the variance explained by the ROI labelled in the top left of each panel (also removed for the corresponding graph). Warmer colors reflect an increase in connectivity at a transition relative to within an event. Darker colors (warm and cool) denote edges with a partial beta value significantly different from 0 (** = two-tailed p < .05, Bonferroni-corrected across edges within each panel; ns = non-significant). b) The mean partial beta — reflecting the mean change in PMN connectivity at event transitions after controlling for the ROI on the x axis. Each point indicates a subject. Panels in (a) are sorted by mean network partial beta as shown in (b).
S.4 Intersubject representational similarity control analyses
To test the specificity of the intersubject representational similarity analysis results, we ran two control analyses — one to test if there was relationship between time-varying PMN subsystem activity and episodic memory, and the other to test if intersubject similarity of time-varying PMN connectivity related to an independent memory measure from the same task, object priming. Using the same method as for analyses of time-varying connectivity, intersubject similarity of activity was defined as the correlation of mean PMN subsystem activity time-series for every pair of subjects. There was no significant relationship between the intersubject similarity of PMN activity and episodic memory using both the nearest neighbor model (Dorsal: r = .028, p = .25; Ventral: r = −.004, p = .52) and the Anna K model (Dorsal: r = .078, p = .14; Ventral: r = .071, p = .19). In testing the relationship between the intersubject similarity of time-varying PMN connectivity and object priming, we also found no significant relationships using both the nearest neighbor model (Dorsal: r = .037, p = .12; Ventral: r = −.020, p = .71; Ventral-to-Dorsal: r = .019, p = .24) and the Anna K model (Dorsal: r = .053, p = .11; Ventral: r = −.045, p = .85; Ventral-to-Dorsal: r = −.058, p = .97). Therefore, a correspondence between time-varying Ventral PMN processes and individual differences in memory appears to be specific to connectivity and to episodic performance within this task.
Acknowledgements
Data collection and sharing for this project was provided by the Cambridge Centre for Ageing and Neuroscience (CamCAN). The authors also thank Aya Ben-Yakov for making the movie event boundary data available. CamCAN funding was provided by the UK Biotechnology and Biological Sciences Research Council (grant number BB/H008217/1), together with support from the UK Medical Research Council and University of Cambridge, UK.
References


