

Abstract
Understanding speciation is a central endeavour in Biology. The formation of new species was once thought to be a simple bifurcation process. However, recent advances in genomic resources now provide the opportunity to investigate the role of post-divergence gene flow in the speciation process. The diversification of lineages in the presence of gene flow appears paradoxical. However, with enough time and in the presence of incomplete physical and/or ecological barriers to gene flow, speciation can and does occur. Speciation without complete isolation appears especially likely to occur in highly mobile, wide-ranging marine species, such as cetaceans, which face limited geographic barriers. The toothed whale superfamily Delphinoidea represents a good example to further explore speciation in the presence of interspecific gene flow. Delphinoidea consists of three families (Delphinidae, Phocoenidae, Monodontidae) and within all three families, contemporary interspecific hybrids have been reported. Here, we utilise publicly available genomes from nine species, representing all three Delphinoidea families, to investigate signs of post-divergence gene flow across their genomes, and to shed light on the speciation processes that led to the current diversity of the superfamily. We use a multifaceted approach including: (i) phylogenetics, (ii) the distribution of shared derived alleles, and (iii) demographic inference. We find that the divergence and evolution of lineages in Delphinoidea did not follow a process of pure bifurcation, but were much more complex. Our results indicate multiple ancestral gene flow events within and among families, which may have occurred millions of years after initial divergence.
Introduction
The formation of new species involves the divergence of lineages through reproductive isolation. Such isolation can initially occur in allopatry (geographical isolation) or in sympatry (biological/ecological isolation). Over time, these barriers are maintained and strengthened, ultimately leading to the formation of new species (Norris and Hull, 2012). While allopatric speciation requires geographical isolation plus time, sympatric speciation often requires a broader and more complicated set of mechanisms (Turelli et al., 2001). These mechanisms mostly rely on ecologically-mediated natural selection. Parapatric speciation, on the other hand, encompasses intermediate scenarios of partial, but incomplete, physical restrictions to gene flow leading to speciation.
Through the analysis of whole-genome datasets, the detection of post-divergence gene flow between distinct species is becoming commonplace (Árnason et al., 2018; Barlow et al., 2018; Westbury et al., 2020), demonstrating that speciation is much more complex than a simple bifurcating process (Campbell and Poelstra, 2018; Feder et al., 2012). Speciation is not an instantaneous process, but requires tens of thousands to millions of generations to achieve complete reproductive isolation (Butlin and Smadja, 2018; Coyne and Orr, 2004; Liu et al., 2014). The duration it takes to reach this isolation may be especially long in highly mobile marine species, such as cetaceans, due to a relative lack of geographic barriers in the marine realm, and therefore high potential for secondary contact and gene flow (Árnason et al., 2018).
The apparent inability to undergo allopatric speciation in marine species has been termed the marine-speciation paradox (Bierne et al., 2003). However, over the past decade, genomic studies have provided some insights into how speciation can occur within cetaceans (Árnason et al., 2018; Moura et al., 2020). For example, initial phases of allopatry among populations of killer whales (Orcinus orca) may have led to the accumulation of ecological differences between populations, which strengthened population differences even after secondary contact (Foote et al., 2011; Foote and Morin, 2015). However, whether these initial phases of allopatry caused the divergence, or whether speciation occurred purely in sympatry, remains debated (Moura et al., 2015). But, these two hypotheses are not necessarily mutually exclusive. Instead, differentiation in parapatry, encompassing features of both allopatric and sympatric speciation, may have been key in the evolutionary history of cetaceans.
The toothed whale superfamily Delphinoidea represents an interesting opportunity to further explore speciation in the presence of putative interspecific gene flow. The crown root of Delphinoidea has been dated at ~19 million years ago (Ma) (95% CI 19.73 - 18.26 Ma) (McGowen et al., 2020) and has given rise to three families: (i) Delphinidae, the most species-rich family, which comprises dolphins and ‘black-fish’ (such as killer whales and pilot whales (Globicephala spp.)); (ii) Phocoenidae, commonly known as porpoises; and (iii) Monodontidae, which comprises two surviving lineages, beluga (Delphinapterus leucas) and narwhal (Monodon monoceros).
Delphinoidea is of particular interest, as contemporary interspecific hybrids have been reported within all three families (Delphinidae:(Espada et al., 2019; Miyazaki et al., 1992; Silva et al., 2005); Phocoenidae: (Willis et al., 2004); Monodontidae:(Skovrind et al., 2019). However, these hybrids represent recent hybridization events that occurred long after species divergence, and their contribution to the parental gene pools is mostly unknown. The presence of more ancient introgressive hybridization events between families, and during the early radiations of these families, has yet to be investigated. With the rapid increase of genomic resources for cetaceans, and in particular for species within Delphinoidea, we are presented with the ideal opportunity to investigate post-divergence gene flow between lineages, furthering our understanding of speciation processes in cetaceans.
Here, we utilise publicly available whole-genome data from nine species of Delphinoidea, representing all three families, to investigate signs of post-divergence gene flow across their genomes. Our analyses included five Delphinidae (killer whale, Pacific white-sided dolphin (Lagenorhynchus obliquidens), long-finned pilot whale (Globicephala melas), bottlenose dolphin (Tursiops truncatus), Indo-Pacific bottlenose dolphin (T. aduncus)); two Phocoenidae (harbour porpoise (Phocoena phocoena), finless porpoise (Neophocaena phocaenoides)); and two Monodontidae (beluga, narwhal). Moreover, we compare their species-specific genetic diversity and demographic histories, and explore how species abundances may have played a role in interspecific hybridisation over the last two million years.
Results and discussion
Detecting gene flow
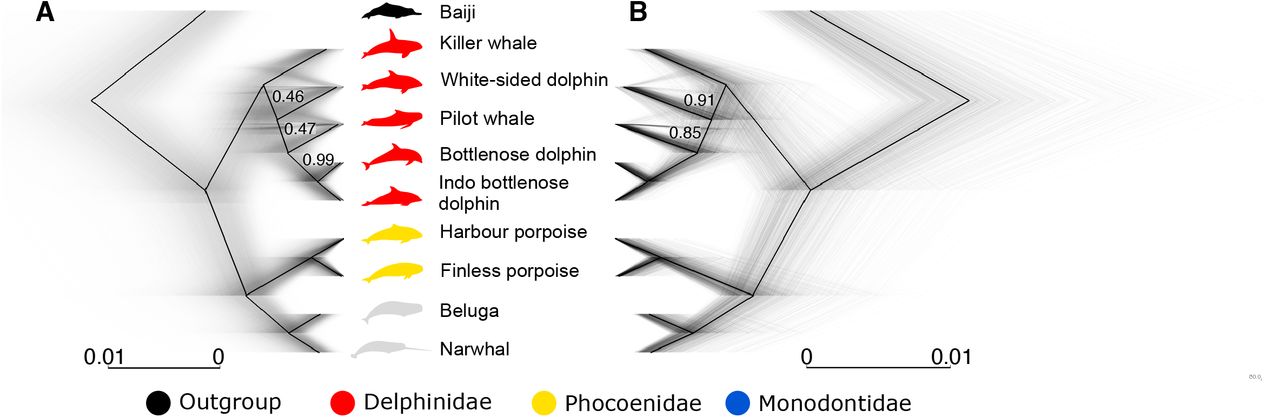
To assess the evolutionary relationships across the genomes of the nine Delphinoidea species investigated, we computed non-overlapping sliding-window maximum-likelihood phylogenies of four different window sizes in RAxML (Stamatakis, 2014). These analyses resulted in 43,207 trees (50 kilobase (kb) windows), 21,387 trees (100 kb windows), 3,705 trees (500 kb windows), and 1,541 trees (1 megabase (Mb) windows) (Fig. 1, Supplementary Fig. S1, Supplementary Table S1). The 50 kb windows retrieved a total of 96 unique topologies, 100 kb windows retrieved 47 unique topologies, 500 kb windows retrieved 16 unique topologies, and 1 Mb windows retrieved 15 unique topologies. Regardless of window size, we retrieve consensus support for the species tree previously reported using target-sequence capture (McGowen et al., 2020). However, when considering the smallest window size (50 kb), we find a considerable proportion of trees (up to 76%) with an alternative topology to the known species tree (Fig. 1A). These alternative topologies may be due to incomplete lineage sorting (ILS) or to interspecific gene flow (Leaché et al., 2014). Moreover, the higher prevalence of this pattern in the 50 kb windows (for example, 21% of windows show an alternative topology in the 1 Mb dataset (Fig. 1B)), may indicate that inconsistencies in topology are caused by ancient, rather than recent, events.

Simultaneously plotted trees constructed using non-overlapping sliding windows of (A) 50 kb in length and (B) 1 Mb in length. Black lines show the consensus tree. Grey lines show individual trees. Numbers on branches show the proportion of windows supporting the node. Branches without numbers show 100% support. Baiji, killer whale, Pacific white-sided dolphin, long-finned pilot whale, harbour porpoise, finless whale, beluga, and narwhal silhouettes: Chris huh, license CC-BY-SA-3.0 (https://creativecommons.org/licenses/by-sa/3.0/). Bottlenose dolphin silhouette: license Public Domain Dedication 1.0.
We explored whether the large number of phylogenetic discrepancies in the 50kb windows could be linked to the GC content (%GC) of the windows. Discrepancies could arise, as elevated levels of GC content can result from higher levels of GC-Biased Gene Conversion (gBGC) in regions with higher levels of recombination (Lartillot, 2013). When binning windows into either high, medium, or low levels of GC content, the most common topologies are consistent, but with slight differences in overall values (Supplementary Table S2). This result suggests that the topological discrepancies are not arising purely due to GC-content linked biases and recombination rate.
To investigate whether the alternative topologies could simply be explained by ILS, or whether a combination of ILS and gene flow was a more probable cause, we ran Quantifying Introgression via Branch Lengths (QuIBL) (Edelman et al., 2019) on every twentieth tree from the 50 kb sliding-window analysis (Supplementary Table S3), as well as on a dataset that contained trees constructed using 20 kb windows with a 1 Mb slide (Supplementary Table S4). As we did not recover any large numbers of phylogenetic discrepancies between families, we were only able to look at the potential cause of discrepancies in the Delphinidae family. Our QuIBL analyses suggest that the different retrieved topologies cannot be explained by ILS alone, but a combination of both ILS and gene flow.
To further explore potential gene flow while taking ILS into account, we applied D-statistics. D-statistics use a four-taxon approach [[[H1, H2], H3], Outgroup] to uncover the differential distribution of shared derived alleles, which may represent gene flow between either H1/H3 or H2/H3. Here we used baiji (Lipotes vexillifer) as the outgroup, and alternated ingroup positions based on the consensus topology. We find that 85 out of 86 tests show signs of gene flow within and between families (Supplementary Table S5), suggesting the evolutionary history of Delphinoidea was more complex than a simple bifurcating process.
Due to the inability of the four-taxon D-statistics approach to detect the direction of gene flow, as well as whether gene flow events may have occurred between ancestral lineages, we used D-foil. D-foil enables further characterization of the D-statistics results, which may be particularly relevant given the complex array of gene flow putatively present within Delphinoidea. D-foil uses a five-taxon approach [[H1, H2] [H3, H4], Outgroup] and a system of four independent D-statistics in a sliding-window fashion to uncover (i) putative gene flow events, (ii) donor and recipient lineages, and (iii) whether gene flow events occurred between a distantly related lineage and the ancestor of two sister lineages, which is indicative of ancestral-lineage gene flow. However, due to the input topology requirements of D-foil, we were only able to investigate gene flow between families, and not within families, using this analysis. Hence, we tested for gene flow between Delphinidae/Phocoenidae, Delphinidae/Monodontidae, and Monodontidae/Phocoenidae.
The D-foil results underscore the complex pattern of post-divergence gene flow between families indicated by the D-statistics. We find support for interfamilial gene flow events between all nine species investigated, to varying extents (Supplementary Table S6). This could reflect multiple episodes of gene flow between all investigated species. Alternatively, the pattern could reflect ancient gene flow events between the ancestors of H1-H2 and H3-H4 (in the topology [[H1, H2] [H3, H4], Outgroup]), with differential inheritance of the admixed loci in subsequent lineages. Such ancestral gene flow events have previously been shown to lead to false positives between species pairs using D-statistics (Moodley et al., 2020). A further putative problem with these results can be seen when implementing D-foil on the topology [[Delphinidae, Delphinidae], [Monodontidae, Phocoenidae], Outgroup]. We find the majority of windows support a closer relationship between Delphinidae (ancestors of H1 and H2) and Monodontidae (H3), as opposed to the species tree. If this result is correct, it suggests the input topology was incorrect, implying that Delphinidae and Monodontidae are sister lineages, as opposed to Phocoenidae and Monodontidae. However, this contrasts with the family topology of [Delphinidae, [Phocoenidae, Monodontidae]] retrieved in our phylogenetic analyses (Fig. 1) and reported by others (McGowen et al., 2020; Steeman et al., 2009). Instead, we suggest our result reflects the limited ability of D-foil to infer gene flow between these highly divergent lineages.
False positives and potential biases in D-statistics and D-foil can arise due to a number of factors including (i) ancestral population structure, (ii) introgression from unsampled and/or extinct ghost lineages, (iii) differences in relative population size of lineages or in the timing of gene flow events, (iv) different evolutionary rates or sequencing errors between H1 and H2, and (v) gene flow between ancestral lineages (Moodley et al., 2020; Slatkin and Pollack, 2008; Zheng and Janke, 2018). These issues are important to consider when interpreting our results, as the deep divergences of lineages suggest there were probably a number of ancestral gene flow events, as well as gene flow events between now-extinct lineages, that may bias results.
Cessation of lineage sorting and/or gene flow
To further elucidate the complexity of interspecific gene flow within Delphinoidea, we implemented F1 hybrid PSMC (hPSMC) (Cahill et al., 2016). This method creates a pseudo-diploid sequence by merging pseudo-haploid sequences from two different genomes, which in our case represents two different species. The variation in the interspecific pseudo-F1 hybrid genome cannot coalesce more recently than the emergence of reproductive isolation between the two parental species. If some regions within the genomes of two target species are yet to fully diverge, due to ILS or to gene flow, hybridisation may still be possible. Therefore, we use this method to infer when reproductive isolation between two species may have occurred.
When considering the uppermost limit of when two target genomes coalesce (equating the oldest date), and the lower confidence interval of each divergence date (equating the most recent date) (McGowen et al., 2020), we find the majority of comparisons (29/36) show lineage sorting and/or gene flow occurred for >50% of the post-divergence branch length (Fig. 2, Supplementary results). However, as we used divergence dates estimated assuming a fixed tree-like topology without ILS or gene flow (McGowen et al., 2020), the divergence dates we use may be overestimated. Nevertheless, our results suggest that reaching complete reproductive isolation in Delphinoidea was a slow process, due to ILS and/or gene flow. ILS levels are known to be proportional to ancestral population sizes, and inversely proportional to time between speciation events (Pamilo and Nei, 1988). Hence, if ILS was the only explanation for this phenomenon, this would suggest extremely large ancestral population sizes. An alternative explanation is the occurrence of gene flow after initial divergence, supported by our phylogenetic and D-statistics results above. Post-divergence gene flow may reflect the ability of cetacean species to travel long distances, and the absence of significant geographical barriers in the marine environment. Alternatively, if geographic barriers did drive initial divergence, the pattern retrieved in our data may reflect secondary contact prior to complete reproductive isolation.
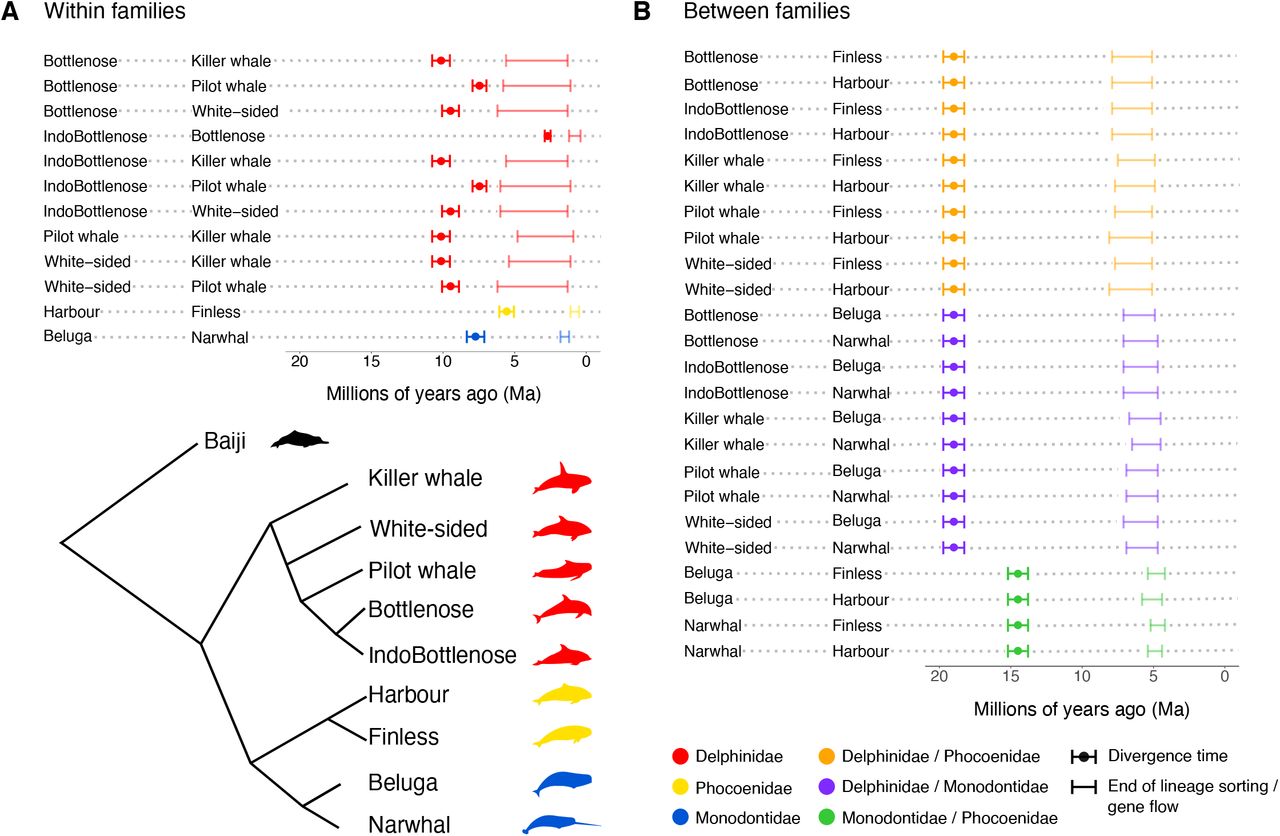
Estimated time intervals of when gene flow ceased between species pairs are based on hPSMC results and simulated data. Divergence time estimates are taken from the full dataset 10-partition AR results of McGowen et al 2020.
Despite our finding of long-term gene flow in the majority of species comparisons, our results suggest that lineage sorting is complete and that gene flow has ceased between all lineages in our dataset. This finding is in contrast with confirmed reports of fertile contemporary hybrids between several of our target species, and may reflect the inability of hPSMC to detect low levels of migration. For example, viable offspring have been reported between bottlenose dolphins and both Indo-Pacific bottlenose dolphins (Gridley et al., 2018) and Pacific white-sided dolphins (Crossman et al., 2016; Miyazaki et al., 1992). Simulations have shown that in the presence of as few as 1/10,000 migrants per generation, hPSMC will suggest continued gene flow. However, this is not the case with a rate < 1/100,000 migrants per generation. Rather, in the latter case, the exponential increase in Ne of the pseudo-hybrid genome, which can be used to infer the date at which gene flow ceased between the parental species, becomes a more gradual transition, leading to a larger estimated time interval of gene flow (Cahill et al., 2016). Within Delphinidae, we observe a less pronounced increase in Ne in the pseudo-hybrids, suggesting continued, but very low migration rates (Supplementary results). This finding suggests that gene flow within Delphinidae may have continued for longer than shown by hPSMC, which may not be sensitive enough to detect low rates of recent gene flow. Either way, our hPSMC results within and between all three families show a consistent pattern of long periods of lineage sorting/gene flow in Delphinoidea, some lasting up to more than ten million years post divergence.
We further assessed the robustness of our hPSMC results to the inclusion or exclusion of repeat regions in the pseudodiploid genome. We compared the hPSMC results when including and removing repeat regions for three independent species pairs of varying levels of phylogenetic distance. These included a shallow divergence (bottlenose and Indo-Pacific bottlenose dolphins), medium divergence (beluga and narwhal), and deep divergence (bottlenose dolphin and beluga) (Supplementary Figs. S2 - S4). For all species pairs, results showed that pre-divergence Ne is almost identical, and the exponential increase in Ne is just slightly more recent when removing the repeat regions, compared to when repeat regions are included. This gives us confidence that the inclusion of repeats did not greatly influence our results.
To add independent evidence for continued lineage sorting/gene flow for an extended period after initial divergence, we compared relative divergence time between killer whale, Pacific white-sided dolphin, and long-finned pilot whale based on the species tree and a set of alternative topologies (Supplementary figure S5). We focused on Delphinidae due to the large number of loci per alternative topology (Supplementary Tables S1, S2, S3, and S4). By assuming ILS and gene flow are the dominant forces behind gene-tree discordance, we can uncover information about the timing of ILS and gene flow events among lineages, by isolating the loci that produce each topology (Mendes and Hahn, 2016). In agreement with our hPSMC results, this analysis shows that ILS/gene flow continued for a long time after initial divergence. For example, we observe that the killer whale diverges from all other Delphinidae at a relative divergence time of 0.45 (45% of the divergence time of Delphinoidea and the baiji) in the consensus topology (Supplementary figure S5A). In an alternative topology, the killer whale is placed as sister to the Pacific white-sided dolphin (Supplementary figure S5B); despite still diverging from the remaining Delphinidae at approximately the same relative timing (0.42), it diverges from the Pacific white-sided dolphin at a relative divergence time of 0.25. As we assume the alternative topologies only arise due to ILS and/or gene flow, this suggests lineage sorting and/or gene flow continued along ~40% of the post-divergence branch length. This estimate is qualitatively equivalent to that made using hPSMC (minimally 43%). Similarly, long periods of post-divergence lineage sorting/gene flow are observed when investigating topologies with the killer whale and long-finned pilot whale as sister species (Supplementary figure S5C, ~43%), and with the Pacific white-sided dolphin and long-finned pilot whale as sister species (Supplementary figure S5D, ~37%).
The alternative topologies may have arisen due to ILS alone. However, for ILS to have continued for so long after initial divergence would suggest very large effective population sizes in all lineages involved. In summary, by combining findings from several analyses, and with the knowledge that interspecific hybridisation is still ongoing between many of the lineages studied here, we suggest that both ILS and gene flow played a major role in the speciation of Delphinoidea.
Interspecific hybridisation
Making inferences as to what biological factors lead to interspecific hybridisation is challenging, as many variables may play a role. One hypothesis is that interspecific hybridization may occur at a higher rate during periods of low abundance, when a given species encounters only a limited number of conspecifics (Crossman et al., 2016; Edwards et al., 2011; Westbury et al., 2019). When considering species that have not yet undergone sufficient divergence, preventing their ability to hybridise, individuals may mate with a closely-related species, instead of investing energy in finding a relatively rarer conspecific mate.
To explore the relationship between susceptibility to interspecific hybridisation and population size, we calculated the level of genome-wide genetic diversity for each species, as a proxy for their population size (Fig. 3A). Narwhal, killer whale, beluga, and long-finned pilot whale have the lowest diversity levels, respectively, and should therefore be more susceptible to interspecific hybridization events. A beluga/narwhal hybrid has been reported (Skovrind et al., 2019), as has hybridisation between long-finned and short-finned pilot whales (Miralles et al., 2016). However, hybrids between species with high genetic diversity, including harbour porpoise (Willis et al., 2004), Indo-Pacific bottlenose dolphin (Baird et al., 2012), and bottlenose dolphin (Espada et al., 2019; Herzingl and Johnsonz, 1997), have also been reported, suggesting genetic diversity alone is not a good proxy for susceptibility to hybridisation.

(A) Autosome-wide levels of heterozygosity calculated in 20 Mb windows of consecutive bases. (B-D) Demographic history of all studied species within (B) Delphinidae, (C) Phocoenidae, and (D) Monodontidae, estimated using PSMC. Thick coloured lines show the autosome-wide demographic history. Faded lines show bootstrap support values.
To investigate whether interspecific gene flow took place during past periods of low population size, we estimated changes in intraspecific genetic diversity through time (Fig. 3B-D). The modeled demographic trajectories, using a Pairwise Sequentially Markovian Coalescent model (PSMC), span the past two million years. We could therefore assess the relationship for the three species pairs, where the putative interval for the cessation of lineage sorting/gene flow was contained within this period: harbour/finless porpoise (Phocoenidae), beluga/narwhal (Monodontidae), and bottlenose/Indo-Pacific bottlenose dolphin (Delphinidae) (Fig. 2).
In the harbour porpoise, we observe an increase in effective population size (Ne) beginning ~1 Ma, the rate of which increases further ~0.5 Ma (Fig. 3C). The timing of expansion overlaps the period during which lineage sorting/gene flow with the finless porpoise ceased (~1.1 - 0.5 Ma, Fig. 2), suggesting gene flow may have occurred between the two species when population size in the harbour porpoise was lower. We observe a similar pattern in belugas; an increase in Ne ~1 Ma, relatively soon after the proposed cessation of gene flow with narwhals ~1.8 - 1.2 Ma (Fig. 3D). An increase in Ne may coincide with an increase in relative abundance, which would increase the number of potential conspecific mates, and in turn reduce the level of interspecific gene flow. Although we are unable to test the direction and level of gene flow between these species pairs, we expect a relative decline of gene flow into the more abundant species. A relative reduction of such events would in turn lessen genomic signs of interspecific gene flow, despite its occurrence.
We observe a different pattern in the bottlenose/Indo-Pacific bottlenose dolphins. In the previous examples, we find a relatively low population size when putative gene flow was ongoing, and only in one of the two hybridizing species. In the dolphins, we find a relatively high population size during the period of gene flow in both species; Ne declines ~1 - 0.5 Ma, coinciding with the putative end of gene flow ~1.2 - 0.4 Ma. The decline in Ne could either reflect a decline in abundance, or a loss of connectivity between the two species. In the latter, we expect levels of intraspecific diversity (and thereby inferred Ne) to decline with the cessation of gene flow, even if absolute abundances did not change. This is indeed suggested by our data, which shows both species undergoing the decline simultaneously, indicative of a common cause.
Seven of the nine Delphinoidea genomes investigated show a similar pattern of a rapid decline in Ne starting ~150 - 100 thousands of years ago (kya) (Fig. 3B-D; the exceptions are Pacific white-sided dolphin and narwhal). This concurrent decline could represent actual population declines across species, or, alternatively, simultaneous reductions in connectivity among populations within each species. Based on similar PSMC analyses, a decline in Ne at this time has also been reported in four baleen whale species (Árnason et al., 2018). Although this could reflect demographic factors, such as the loss of population connectivity, the unique life histories, distributions, and ecology of these cetacean species suggests that decreased population connectivity is unlikely to have occurred simultaneously across all studied species.
Rather, the species-wide pattern may reflect climate-driven environmental change. The period of 150 - 100 kya overlaps with the onset of the last interglacial, when sea levels increased to levels as high, if not higher, than at present (Polyak et al., 2018), and which may have had a marine-wide effect on population sizes. A similar marine-wide effect has been observed among baleen whales and their prey species in the Southern and North Atlantic Oceans during the Pleistocene-Holocene climate transition (12-7 kya) (Cabrera et al., 2018). These results indicate that past marine-wide environmental shifts have driven changes in population sizes across multiple species.
Although speculative, our demographic results suggest recent species-wide declines may have facilitated the resurgence of hybridization between the nine Delphinoidea species analysed. If hybridisation did increase, species may already have been sufficiently differentiated that offspring fertility was reduced. Even if offspring were fertile, the high level of differentiation between species may mean hybrids are unable to occupy either parental niche (Skovrind et al., 2019) and have therefore been strongly selected against. A lack of significant contribution from hybrids to the parental gene pools may be why we observe contemporary hybrids, but do not find evidence of this in our analyses.
Conclusions
Allopatric speciation is generally considered the most common mode of speciation, as the absence of gene flow due to geographical isolation can most easily explain the evolution of ecological, behavioural, morphological, or genetic differences between populations (Norris and Hull, 2012). However, our findings suggest that within Delphinoidea, speciation in the presence of gene flow was commonplace, consistent with sympatric/parapatric speciation, or allopatric speciation and secondary contact.
The ability for gene flow events to occur long after initial divergence may also explain the presence of contemporaneous hybrids between several species. In parapatric speciation, genetic isolation is achieved relatively early due to geographical and biological isolation, but species develop complete reproductive isolation relatively slowly, through low levels of migration or secondary contact events that allow hybridisation to continue for an extended period of time (Norris and Hull, 2012). The prevalence of this mode of speciation in cetaceans, as suggested by our study and previous genomic analyses (Árnason et al., 2018; Moura et al., 2020), may reflect the low energetic costs of dispersing across large distances in the marine realm (Fish et al., 2008; Williams, 1999) and the relative absence of geographic barriers preventing such dispersal events (Palumbi, 1994). Both factors are believed to be important in facilitating long-distance (including inter-hemispheric and inter-oceanic) movements in many cetacean species (Stone et al., 1990).
Our study shows that speciation in Delphinoidea was a complex process and involved multiple ecological and evolutionary factors. Our results take a step towards resolving the enormous complexity of speciation, through a multifaceted analysis of nuclear genomes. However, our study also underscores the challenges of precisely interpreting some results, due to the high levels of divergence between the target species. Despite this, we are still able to form hypotheses about general patterns and major processes uncovered in our data, which we hope will be further addressed as additional genomic data and new methodologies for data analysis become available.
Methods
Data collection
We downloaded the assembled genomes and raw sequencing reads from nine toothed whales from the superfamily Delphinoidea. The data included five Delphinidae: Pacific white-sided dolphin (NCBI Biosample: SAMN09386610), Indo-Pacific bottlenose dolphin (NCBI Biosample: SAMN06289676), bottlenose dolphin (NCBI Biosample: SAMN09426418), killer whale (NCBI Biosample: SAMN01180276), and long-finned pilot whale (NCBI Biosample: SAMN11083132); two Phocoenidae: harbour porpoise (Autenrieth et al., 2018) and finless porpoise (NCBI Biosample: SAMN02192673); and two Monodontidae: beluga (NCBI Biosample: SAMN06216270) and narwhal (NCBI Biosample: SAMN10519625). To avoid biases that may occur when mapping to an ingroup reference (Westbury et al., 2019), we used the assembled baiji genome (Genbank accession code: GCF_000442215.1) as mapping reference in the gene flow analyses. Delphinoidea and the baiji diverged ~24.6 Ma (95% CI 25.2 - 23.8 Ma) (McGowen et al., 2020).
Initial data filtering
To determine which scaffolds were most likely autosomal in origin, we identified putative sex chromosome scaffolds for each genome, and omitted them from further analysis. We found putative sex chromosome scaffolds in all ten genomes by aligning the assemblies to the Cow X (Genbank accession: CM008168.2) and Human Y (Genbank accession: NC_000024.10) chromosomes. Alignments were performed using satsuma synteny v2.1 (Grabherr et al., 2010) with default parameters. We also removed scaffolds smaller than 100 kb from all downstream analyses.
Mapping
We trimmed adapter sequences from all raw reads using skewer v0.2.2 (Jiang et al., 2014). We mapped the trimmed reads to the baiji for downstream gene flow analyses, and to the species-specific reference genome for downstream demographic history and genetic diversity analyses using BWA v0.7.15 (Li and Durbin, 2009) and the mem algorithm. We parsed the output and removed duplicates and reads with a mapping quality lower than 30 with SAMtools v1.6 (Li et al., 2009). Mapping statistics can be found in supplementary tables S7 and S8.
Sliding-window phylogeny
For the sliding-window phylogenetic analysis, we created fasta files for all individuals mapped to the baiji genome using a consensus base call (-dofasta 2) approach in ANGSD v0.921 (Korneliussen et al., 2014), and specifying the following filters: minimum read depth of 5 (-mininddepth 5), minimum mapping quality of 30 (-minmapq 30), minimum base quality (-minq 30), only consider reads that map to one location uniquely (-uniqueonly 1), and only include reads where both mates map (-only_proper_pairs 1). All resultant fasta files, together with the assembled baiji genome, were aligned, and sites where any individual had more than 50% missing data were filtered before performing maximum likelihood phylogenetic analyses in a non-overlapping sliding-window approach using RAxML v8.2.10 (Stamatakis, 2014). We performed this analysis four times independently, specifying a different window size each time (50 kb, 100 kb, 500 kb, and 1 Mb). We used RAxML with default parameters, specifying baiji as the outgroup, and a GTR+G substitution model. We computed the genome-wide majority rule consensus tree for each window size in PHYLIP (Felsenstein, 2005), with branch support represented by the proportion of trees displaying the same topology. We simultaneously visualised all trees of the same sized window using DensiTree (Bouckaert, 2010).
We tested whether results may be linked to GC content in the 50kb windows. To do this, we calculated the GC content for each window and binned the windows into three bins: The 33% with the lowest levels of GC content, the 33% with intermediate levels, and the 33% with the highest levels of GC content.
Quantifying Introgression via Branch Lengths (QuIBL)
To test hypotheses of whether phylogenetic discordance between all possible triplets can be explained by ILS alone, or by a combination of ILS and gene flow, we implemented QuIBL (Edelman et al., 2019) in two different datasets. The first dataset leveraged the results of the above 50 kb-window analysis, by taking every twentieth tree from the 50kb sliding-window analysis and running it through QuIBL. The second dataset was created specifically for this test, and contained topologies generated from 20 kb windows with a 1 Mb slide using the phylogenetic methods mentioned above. We ran QuIBL specifying the baiji as the overall outgroup (totaloutgroup), to test either ILS or ILS with gene flow (numdistributions 2), the number of total EM steps as 50 (numsteps), and a likelihood threshold of 0.01. We determined the significance of gene flow by comparing the BIC1 (ILS alone) and BIC2 (assuming ILS and gene flow). When BIC2 was lower than BIC1, with a difference of > 10, we assumed incongruent topologies arose due to both ILS and gene flow. Triplet topologies supporting the species tree, and those that had < 5 alternative topologies were excluded from interpretations.
D-statistics
To test for signs of gene flow in the face of incomplete lineage sorting (ILS), we ran D-statistics using all individuals mapped to the baiji genome in ANGSD, using a consensus base call approach (-doabbababa 2), specifying the baiji sequence as the ancestral outgroup sequence, and the same filtering as for the fasta file construction with the addition of setting the block size as 1Mb (-blocksize). Significance of the results was evaluated using a block jackknife approach with the Rscript provided in the ANGSD package. |Z| > 3 was deemed significant.
D-foil
As D-statistics only tests for the presence and not the direction of gene flow, we ran D-foil (Pease and Hahn, 2015), an extended version of the D-statistics, which is a five-taxon test for gene flow, making use of all four combinations of the potential D-statistics topologies. For this analysis, we used the same fasta files constructed above, which we converted into an mvf file using MVFtools (Pease and Rosenzweig, 2018). We specified the 5-taxon [[H1, H2], [H3, H4], baiji], for all possible combinations, following the species tree (McGowen et al., 2020)Fig. 1) and a 100 kb window size. All scaffolds were trimmed to the nearest 100 kb to avoid the inclusion of windows shorter than 100 kb.
Mutation rate estimation
For use in the downstream demographic analyses, we computed the mutation rate per generation for each species. To do this, we estimated the pairwise distances between all ingroup species mapped to the baiji, using a consensus base call in ANGSD (-doIBS 2), and applying the same filters as above, with the addition of only considering sites in which all individuals were covered (-minInd). The pairwise distances used in this calculation were those from the closest lineage to the species of interest (Supplementary Tables S9 and S10). The mutation rates per generation were calculated using the resultant pairwise distance as follows: mutation rate = pairwise distance x generation time / 2 x divergence time. Divergence times were taken from the full dataset 10-partition AR (mean) values from McGowen et al. (McGowen et al., 2020) (Supplementary Table S10). Generation times were taken from previously published data (Supplementary Table S11).
Cessation of lineage sorting and/or gene flow
To estimate when lineage sorting and/or gene flow may have ceased between each species pair, we used the F1-hybrid PSMC (hPSMC) approach (Cahill et al., 2016). As input we used the haploid consensus sequences mapped to the baiji that were created for the phylogenetic analyses. Despite the possibility of producing consensus sequences when mapping to a conspecific reference genomes, we chose the baiji for all comparisons as previous analyses have shown the choice of reference genome to not influence the results of hPSMC (Westbury et al., 2019). We merged the haploid sequences from each possible species pair into pseudo-diploid sequences using the scripts available in the hPSMC toolsuite. We independently ran each resultant species pair pseudo-diploid sequences through PSMC, specifying atomic intervals 4+25*2+4+6. We plotted the results using the average (i) mutation rate per generation and (ii) generation time for each species pair being tested. From the output of this analysis, we visually estimated the pre-divergence Ne of each hPSMC plot (i.e. Ne prior to the point of asymptotic increase in Ne) to be used as input for downstream simulations. Based on these empirical results, we ran simulations in ms (Hudson, 2002) using the estimated pre-divergence Ne, and various predefined divergence times to find the interval in which gene flow may have ceased between a given species pair. The time intervals and pre-divergence Ne for each species pair used for the simulations can be seen in supplementary table S12. The ms commands were produced using the scripts available in the hPSMC toolsuite. We plotted the simulated and empirical hPSMC results to find the simulations with an asymptotic increase in Ne closest to, but not overlapping with, the empirical data. The predefined divergence times of the simulations showing this pattern within 1.5x and 10x of the pre-divergence Ne were taken as the time interval in which gene flow ceased.
We repeated the above analysis for three species pairs bottlenose/Indo-Pacific bottlenose dolphins, beluga/narwhal, and beluga/bottlenose dolphin, but with an additional step, where we masked repeat elements of the haploid genomes using bedtools v2.26.0 (Quinlan, 2014) and the repeat annotations available on Genbank. Once we masked the repeat elements, we reran the hPSMC analysis as above.
Relative divergence times in Delphinidae
To further examine the timing of the ending of lineage sorting and/or gene flow, we performed phylogenetic inferences to uncover the relative divergence times on subsets of genomic loci showing alternative topologies in Delphinidae. For this, we masked repeats in the same fasta files used for our other phylogenetic analyses using the baiji Genbank annotation and bedtools (Quinlan, 2014). We extracted 1 kb windows with a 1 Mb slide from the aligned fasta files and only kept loci containing less than 50% missing data for any individual. We separated our data set into the loci that supported each of four sets of relationships Supplementary Fig. S5. These included loci that supported (i) the consensus species tree (n = 109), (ii) the Pacific white-sided dolphin as sister to the killer-whale (n = 84), (iii) the Pacific white-sided dolphin as sister to the clade of bottlenose dolphins, with the long-finned pilot and killer whales in a monophyletic clade as sisters to this group (n = 48), and (iv) the Pacific white-sided dolphin as sister to the long-finned pilot whale (n = 59). For each of the four sets, we inferred the relative divergence times across our samples of Delphinidae, also including the beluga and the baiji in the taxon set. We analysed each data set independently, constrained the tree topology to that of the corresponding set of loci, and constrained the age of the root to 1. We performed Bayesian dating using a GTR+Γ substitution model and an uncorrelated-gamma relaxed clock model in MCMCtree, as implemented in PAML v4.8 (Yang, 2007). The posterior distribution was approximated using Markov chain Monte Carlo (MCMC) sampling, with samples drawn every 103 MCMC steps over 107 steps, after discarding a burn-in phase of 105 steps. Convergence to the stationary distribution was verified by comparing parameter estimates from two independent analyses, and confirming that effective sample sizes were above 200 for all sampled parameters.
Heterozygosity
As a proxy for species-level genetic diversity, we estimated autosome-wide heterozygosity for each of the nine Delphinoidea species. We estimated autosomal heterozygosity using allele frequencies (-doSaf 1) in ANGSD (Korneliussen et al., 2014), taking genotype likelihoods into account (-GL 2) and specifying the same filters as for the fasta file construction with the addition of adjusting quality scores around indels (-baq 1), and the subsample filter (-downSample), which was uniquely set for each individual to result in a 20x genome-wide coverage, to ensure comparability between genomes of differing coverage. Heterozygosity was computed from the output of this using realSFS from the ANGSD toolsuite and specifying 20 Mb windows of covered sites (-nSites).
Demographic reconstruction
To determine the demographic histories of all nine species over a two million year time scale, we ran a Pairwise Sequentially Markovian Coalescent model (PSMC) (Li and Durbin, 2011) on each diploid genome independently. We called diploid genome sequences using SAMtools and BCFtools v1.6 (Narasimhan et al., 2016), specifying a minimum quality score of 20 and minimum coverage of 10. We ran PSMC specifying atomic intervals 4+25*2+4+6 and performed 100 bootstrap replicates to investigate support for the resultant demographic trajectories. PSMC outputs were plotted using species-specific mutation rates and generation times (Supplementary Table S11).
Author contributions
Conceptualization, MVW; Formal analysis, MVW, AAC, AR-I, BDC, DAD, SH; Writing – Original Draft MVW; Writing – Review & Editing All authors; Supervision, MVW, EDL; Funding Acquisition, EDL;
Acknowledgements
The work was supported by the Independent Research Fund Denmark | Natural Sciences, Forskningsprojekt 1, grant no. 8021-00218B and the Villum Fonden Young Investigator Programme, grant no. 13151 to EDL. AAC was funded by the Rubicon-NWO grant (project 019.183EN.005). We would like to thank all those contributing to the ever-increasing abundance of publicly available genomic resources. Without the availability of such data, our study would not have been possible. We would also like to thank Michael Fontaine, Christelle Fraïsse, Camille Roux, and Andrew Foote for their helpful input to previous versions of this manuscript.
References


