

Abstract
Coinfection by unrelated viruses in the respiratory tract is common and can result in changes in disease severity compared to infection by individual virus strains. We have previously shown that inoculation of mice with rhinovirus (RV) two days prior to inoculation with a lethal dose of influenza A virus (PR8), provides complete protection against mortality. In this study, we extend that finding to a second lethal respiratory virus, pneumonia virus of mice (PVM) and characterize the differences in inflammatory responses and host gene expression in single virus infected vs. coinfected mice. RV prevented mortality and weight loss associated with PVM infection, suggesting that RV-mediated protection is more effective against PVM than PR8. Major changes in host gene expression upon PVM infection were delayed compared to PR8, which likely provides a larger time frame for RV-induced gene expression to alter the course of disease. Overall, RV induced earlier recruitment of inflammatory cells, while these populations were reduced at later times in coinfected mice. Findings common to both coinfection conditions included upregulated expression of mucin-associated genes in RV/PR8 and RV/PVM compared to mock/PR8 and mock/PVM infected mice and dampening of inflammation-related genes late during coinfection. These findings, combined with differences in virus replication levels and disease severity, suggest that the suppression of inflammation in RV/PVM coinfected mice may be due to early suppression of viral replication, while in RV/PR8 coinfected mice may be due to a direct suppression of inflammation. Thus, a mild upper respiratory viral infection can reduce the severity of a subsequent severe viral infection in the lungs through virus-dependent mechanisms.
Author Summary Respiratory viruses from diverse families co-circulate in human populations and are frequently detected within the same host. Though clinical studies suggest that coinfection by more than one unrelated respiratory virus may alter disease severity, animal models in which we can control the doses, timing, and strains of coinfecting viruses are critical to understand how coinfection affects disease severity. In this study, we compared gene expression and immune cell recruitment between two pairs of coinfecting viruses (RV/PR8 and RV/PVM) that both result in reduced severity compared to infection by PR8 or PVM alone in mice. Reduced disease severity was associated with suppression of inflammatory responses in the lungs. However, differences in disease kinetics and host and viral gene expression suggest that protection by coinfection with RV may be due to distinct molecular mechanisms.
Introduction
The detection of more than one virus in respiratory samples is quite common, especially among pediatric patients (1-4). There are differences in the outcomes of coinfection - whether it results in increased, decreased, or no effect on disease severity - that likely reflect different virus parings, patient populations, and study criteria. For example, coinfection with influenza B virus was found to increase the severity of seasonal influenza A virus, while other virus pairings did not reach statistical significance (2). Another study found increased rates of hospitalization, but not other measures of clinical severity, associated with viral coinfections (1). In contrast, Martin et al. found that patients with one virus detected had increased risk of severe disease than those with multiple viruses detected, and some virus pairings were associated with lower viral loads in coinfected patients (5). Coinfection by non-SARS-CoV-2 viruses has been detected in COVID-19 patients, but the impact on disease severity is not well-understood (6-8). Despite differences among studies, it is clear that coinfecting viruses have the potential to alter pathogenesis and disease outcomes. While clinical studies illuminate this potential, model systems in which the virus pairs, doses, and timing of coinfection can be controlled are critical to understand how coinfection alters pathogenesis in the respiratory tract. Therefore, we developed a mouse model using pairwise combinations of respiratory viruses from different families for this purpose (9).
We previously found that infection of mice with a mild respiratory virus (rhinovirus strain 1B [RV] or mouse hepatitis virus strain 1 [MHV-1]) attenuates the severity of a subsequent infection by influenza A virus (strain PR8) (9). Although coinfection does not prevent PR8 replication, it leads to faster viral clearance and resolution of pulmonary inflammation. Protection from severe disease by viral coinfection has also been demonstrated by other groups. Similar to our study, Hua et al. found that a nasal-restricted infection by MHV-1 protects mice from lethal infection by PR8 and mouse-adapted severe acute respiratory syndrome coronavirus (SARS-CoV) (10). Furthermore, they found that protection is associated with enhanced macrophage recruitment to the lungs and up-regulation of SARS-CoV-specific CD4+ and CD8+ T cell responses (10). Inhibition or delay of viral shedding also occurs in ferrets during sequential inoculations with antigenically similar or dissimilar strains of influenza A and B viruses (11). A 2009 pandemic influenza A (A(H1N1)pdm09) virus prevents subsequent infection of ferrets by human respiratory syncytial virus (RSV) when the viruses are given within a short time frame (12). In contrast, RSV does not prevent replication of A(H1N1)pdm09 in ferrets, but reduces morbidity as determined by weight loss (12).
In this study, we aimed to evaluate whether RV-mediated disease attenuation was specific to PR8, or generalizable to other respiratory viral infections. We found that RV reduced the severity of an additional lethal respiratory virus, pneumonia virus of mice (PVM). PVM is a relative of human RSV in the family Pneumoviridae, genus Orthopneumovirus. Infection of mice with PVM results in severe disease that shares clinical features of the most severe infections by RSV, including infection of the bronchiolar epithelium, granulocytic inflammation, and pulmonary edema (13-15). Lethality upon infection of mice with PR8 or PVM is mediated largely by dysregulated inflammatory responses, rather than overt damage due to viral replication (16-19). Interestingly, there are differences in the types of immune responses that mediate protection against these two viruses. Type I and III interferon (IFN) signaling and alveolar macrophages are protective in PR8, but not PVM, infected mice (16, 18, 20-23). Conversely, plasmacytoid dendritic cells are required for protection in PVM, but not PR8, infected mice (24, 25). Interleukin-6 (IL-6) limits the severity of influenza A virus infection in mice, while it exacerbates disease in PVM-infected mice (26-28). Multiple mechanisms reduce the severity of both PR8 and PVM infections, including mucin production and inhibition of inflammatory responses (29-35). Based on these complex differences in immunity to infection with PR8 and PVM, we used a global gene expression approach combined with flow cytometry to evaluate potential mechanisms whereby coinfection with RV reduces the severity of PR8 and PVM.
Results
Coinfection with RV reduces the severity of PVM infection
We previously showed that coinfection of mice with RV reduced the severity of a lethal infection by influenza A virus, strain PR8 (9). Protection against lethal PR8 infection was most effective when RV was given two days before PR8, but significant disease attenuation was also seen when mice were inoculated with RV and PR8 concurrently. To determine if coinfection with RV would attenuate disease by a second lethal respiratory viral pathogen, we inoculated mice with media (mock) or RV two days before, simultaneously with, or two days after inoculation with PVM. Mice were monitored daily for mortality, weight loss, and clinical signs of disease for 14 days after PVM inoculation.
Infection with PVM alone (mock/PVM) was 100% lethal with all mice succumbing to infection or reaching humane endpoints by day 8 (Fig 1A). PVM-infected mice had rapid weight loss (Fig 1B) and exhibited clinical signs of disease, including ruffled fur, hunched posture, labored breathing, and lethargy. Mice that were inoculated with RV two days before (RV/PVM) or simultaneously with (RV+PVM) PVM were completely protected from mortality (Fig 1A), weight loss (Fig 1B), and clinical signs of disease. However, mice that received RV two days after PVM (PVM/RV) had equivalent disease severity as mock/PVM-infected mice. Although coinfection with RV reduced the severity of both PR8 (9) and PVM (Fig 1), protection was more effective against PVM. Importantly, coinfection resulted in complete protection against mortality and morbidity in addition to mortality when RV was given two days before or concurrent with PVM (Fig 1). In contrast, RV prevented mortality, but not morbidity, when given two days before PR8 and giving RV and PR8 concurrently was less effective at reducing disease severity (9).

Groups of 7 BALB/c mice were either mock-inoculated (mock/PVM) or inoculated intranasally with 7.6 x 10⁶ TCID50 units of RV two days before (RV/PVM), simultaneously with (RV+PVM), or two days after (PVM/RV) 1.0×10⁴ TCID50 units of PVM. Mice were monitored daily for (A) mortality and (B) weight loss. Statistical significance compared to mock/PVM was determined by (A) Log-rank Mantel-Cox test and (B) student’s t-test corrected for multiple comparisons using the Holm-Sidak method. P-value *p≤0.05, **p≤0.001.
Infection by PR8 and PVM induce different gene expression signatures in mouse lungs over time
To determine potential mechanisms of protection mediated by RV against PR8 and PVM, we undertook a comprehensive transcriptome analysis of mouse lungs (Fig 2). Mice were coinfected with RV two days before PR8 or PVM and total lung RNA was analyzed on days 0, 2, 4, and 6 after PR8 or PVM inoculation. Single virus-infected mice were mock-inoculated two days before PR8 or PVM and total lung RNA was isolated at the same time points. Weight loss was monitored daily to test for consistency with our previous morbidity and mortality analyses. RV-mediated protection against PR8 was not evident by 6 days post-infection (S1 Fig) though both mock/PR8 and RV/PR8 groups experienced weight loss at a rate similar to our previous study (9). In contrast, complete protection against weight loss was evident in RV/PVM coinfected mice (S1 Fig).

Mice were inoculated with RV or saline (mock) two days before challenge with PR8 or PVM. RNA was extracted from lung tissue from three mice per group on day 0 for mock and RV treated controls and days 2, 4, and 6 for mice receiving PR8 or PVM on day 0 and analyzed by RNA-seq.
Total lung mRNA from 3 mice per infection group and time point was collected and sequenced on the Illumina platform. Of the 14.6 to 55.3 (36.4 mean) million reads obtained for each sample, 83-91.2% were uniquely mapped to the mm10 mouse genome (GCA_000001635.2). The expression of 24,243 and 24,421 genes were measured using Cufflinks and HTSeq, respectively. We conservatively counted differentially expressed genes by requiring that they be identified by Cuffdiff, EdgeR, and Deseq2 as having greater than 50% expression change and p-values less than 0.05.
A principal component analysis was done with the 500 most highly variable genes to visualize variation across infection groups, time points, and replicates. Most variation in host gene expression was explained by the time elapsed since viral infection (Fig 3A). However, differences between viruses were also apparent. Infection by PVM caused fewer gene expression changes at early time points than PR8-infected mice, as seen by mock/PVM and RV/PVM day 2 samples clustering closely with mock and RV day 0 samples, respectively (Fig 3A, blue and purple points). By day 4, the PVM-infected mice had very different gene expression profiles than mock-inoculated mice on day 0. This delayed response to PVM infection is observed in other studies (16, 36). In contrast, PR8 infection dramatically altered gene expression in mice by day 2 (Fig 3A, light green points). Early changes in host gene expression induced by PR8, but not PVM, corresponded with earlier detection of PR8-specific transcripts (Fig 4). Moreover, the RV/PVM and mock/PVM samples were very different from each other by day 4 (Fig 3A, brown points). Despite dramatic differences in infection outcomes, RV/PR8 and mock/PR8 groups had similar gene expression signatures until day 6 (Fig 3A, orange points). This corresponds with the similar disease kinetics in these groups early during infection (9) (S1 Fig).
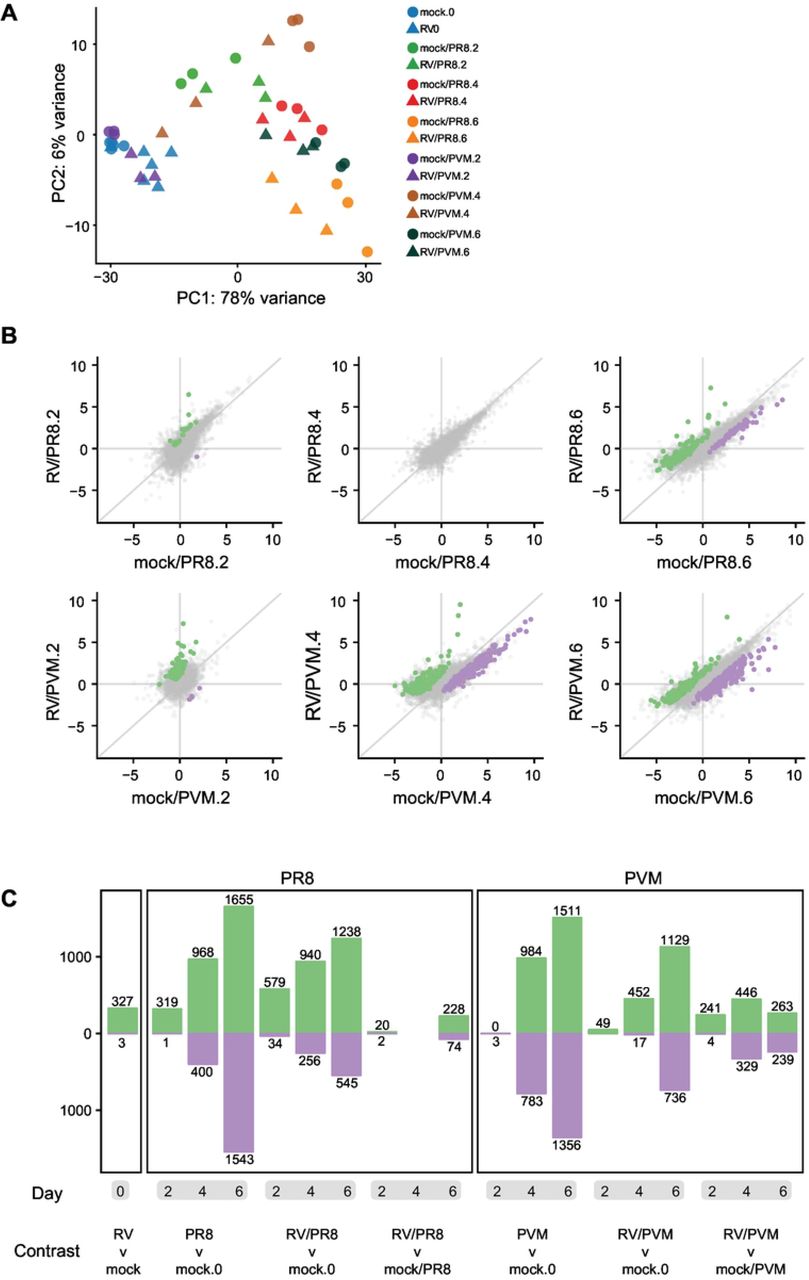
(A) Principal component analysis of RNA-seq data shows that the greatest variance in gene expression is primarily due to time since infection. The largest distances in single vs. coinfected groups are mock/PVM vs. RV/PVM on day 4 and mock/PR8 vs. RV/PR8 on day 6. (B) The scatter plots show the log2 fold change values of all genes compared to mock-inoculated mice on day 0. Genes upregulated in the coinfected compared to the single-virus infected mice are colored green. Down-regulated genes are colored purple. (C) Numbers of DEGs in all pairwise comparisons. The number of genes upregulated in the infected (versus mock) or coinfected (versus mock or single) mice are shown in green. Downregulated genes are shown in purple. See Supplemental Table 1 for lists of gene names and log2 fold change values.

For each group, the three replicates are shown with box plots indicating the quantile values of percent non-mouse reads mapped to viral genomes. Asterisks indicate significantly different treatment pairs, see Supplemental Table 3. P-value *p<0.05, **p<0.01, ***p≤0.001.
We next calculated differential gene expression levels in samples from all infected mice compared to mock-inoculated mice and compared them between single virus-infected and coinfected mice at each time point (Fig 3B). As reflected in the PCA, gene expression changed over time, as samples taken 2 days post-infection were most similar to mock-inoculated controls and samples taken 6 days post-infection were most different (Fig 3B, 3C). The transition of point clustering in Fig 3B from around the origin at day 2 to spread along the 1:1 line on day 6 illustrates this delayed gene expression response to viral infection. Genes differentially expressed between single virus-infected and coinfected mice also displayed time-dependent clustering shifts in both the PVM and PR8 experiments (Fig 3B). At 2 days post-infection, the expression values of differentially expressed genes (DEGs) indicated that the coinfected samples were more different from mock than the samples from single virus-infected mice (points are spread along the y-axis). At 6 days post-infection, DEGs differed more between mock-inoculated and single virus-infected mice than between mock-inoculated and coinfected mice (points spread along x-axis). This dampening of DEGs in coinfected mice suggests that the second infection by a lethal virus is ablated not only in virulence, but also in host gene expression response.
A summary of the numbers of DEGs across comparisons of all virus-infected to mock-inoculated mice and between single virus-infected vs. coinfected mice is shown in Fig 3C and lists of these DEGs are included in Supplemental Table 1. Again, the numbers of DEGs reflect the delayed response to PVM infection, dampened gene expression in coinfected mice, and relative similarity in gene expression in mock/PR8 and RV/PR8 infected mice.
Viral gene expression
Sequencing reads that did not map to the mouse genome were aligned with viral genomes. An insignificant number of reads mapped to the RV genome. This was expected because the abundance of positive-sense RV RNA and viral titers peak 24 hours after inoculation of BALB/c mice (37). The earliest time we analyzed was 48 hours (day 0) after inoculation, at which point RV RNA would likely represent a very low proportion of the total RNA.
Many reads mapped to PR8 and PVM genomes from the mice infected with these viruses (Fig 4). Coinfection by RV did not prevent PR8-specific gene expression, but reads mapped to PR8 were significantly lower in coinfected mice at all time points (Fig 4). Similarly, we previously showed that infectious PR8 titers in the lungs were equivalent in mock/PR8 and RV/PR8 infected mice on days 2 and 4 after PR8 inoculation (9). However, coinfection with RV led to earlier clearance of PR8 (by day 7), corresponding with the dramatically lower PR8 mRNAs seen on day 6 in the present study. These findings confirm that infection with RV does not prevent subsequent infection by PR8, rather it reduces viral gene expression and leads to faster clearance. Our sequencing protocol only captured polyadenylated RNAs, thus these reads represent viral mRNAs and not complementary (cRNA) or genomic (vRNA) viral RNAs. Based on individual gene mapping, the PR8 reads predominantly mapped to the nucleoprotein (NP) and hemagglutinin (HA) mRNAs (S2 Fig), which are known to be expressed at high levels during infection (38-40).
PVM gene expression was highest on day 4 and was robustly suppressed in RV-coinfected mice (Fig 4). This suggests that RV may limit PVM infection early, which corresponds with the more effective prevention of weight loss in RV/PVM (Fig 1) compared to RV/PR8 (9) coinfected mice (S1 Fig). All viral genes were detected in mice infected by PVM alone (mock/PVM) on day 4, with the genes that express the attachment (G), nucleoprotein (N), non-structural 2 (NS2), fusion (F), phosphoprotein (P), and matrix (M) proteins at the highest levels (S2 Fig). This does not strictly follow the gradient of mRNA levels corresponding with gene order that is expected from pneumoviruses (41), which likely reflects post-transcriptional differences in mRNA stability and the heterogeneous nature of collecting cells at different stages of the virus replication cycle.
RV induces innate immune response prior to secondary viral infection
We compared gene expression in lung tissue of mock-inoculated mice to mice infected by RV for 2 days (RV, day 0). Of the 24,421 genes compared, we identified 330 DEGs, of which only three were down-regulated (Fig 3C and S1 Table). To get a functional picture of the RV-infected lung on day 0, we identified enriched GO terms and KEGG pathways in the 330 DEGs. The most highly enriched terms on this list suggest that changes in the regulation of cell cycle or cell division were occurring in RV-infected compared to mock-inoculated mice; nearly all of the top 50 most enriched terms involved chromosome remodeling and mitosis (S2 Table). This list of enriched terms was quite different than the processes that were differentially regulated in PR8- or PVM-infected mice. Up-regulation of cell division-associated genes could be occurring in epithelial cells in conjunction with repair, immune cells recruited to the lungs, or both. In addition to cell division, multiple immune response-related GO terms related to type I IFN signaling, chemokine signaling, and immune cell chemotaxis were enriched by RV infection (S2 Table). RV infection induced up-regulation of several chemokine genes, including those that recruit monocytes, neutrophils, NK cells, T cells, B cells, and eosinophils (Ccl-2, 3, 6, 7, 8, 12, 17, 22, Cxcl-1, 3, 5, 9, 10, 13).
Host gene expression changes associated with viral coinfection
We next identified DEGs specific to coinfected (RV/PR8 or RV/PVM) vs. mock-inoculated mice that were not differentially expressed in single virus-infected (mock/PR8 or mock/PVM) vs. mock-inoculated mice at the same time points. The expression data for these three gene sets (unique to RV/PR8, unique to RV/PVM, shared by RV/PR8 and RV/PVM) are provided in supplemental figures (Fig S3-S5). Genes with shared up-regulation in RV-coinfected animals, regardless of timepoint and second virus, included those in the mucin biosynthesis pathway, MHC class II genes, and immunomodulatory genes. Genes with increased up-regulation in mice infected with RV/PVM compared to mock/PVM early (days 2 and 4) included Mgl2, Ccl6, Agr2, H2-M2, and Muc5b. Genes that had higher up-regulation in the single virus infections were predominantly increased late (days 4 and/or 6) and included genes associated with inflammation (Angptl4) or pulmonary fibrosis (Fosl2, Pappa, Sphk1). These genes were common to both PR8 and PVM infections and likely result from excessive inflammation and tissue damage within the infected lungs. Additional genes associated with inflammation and fibrosis (Nfkbia and Mmp9) or stress responses (Hspb8, Nupr1) were reduced in RV/PVM-compared to mock/PVM-infected mice. Finally, a set of genes were up-regulated in both mock/PVM- and RV/PVM-infected mice, but to a higher level in mock/PVM-infected mice (S100a9, Prss22, Fga, Krt17). These genes are also largely involved in inflammation and tissue damage and repair processes.
Genes involved in goblet cell metaplasia and mucin production were specifically increased in both RV/PVM and RV/PR8 coinfections compared to the single virus-infected mice at various time points. These included the major gel-forming airway mucins (Muc5ac and Muc5b), a disulfide isomerase (Agr2) required for mucin folding and polymerization, and a chloride channel regulator (Clca1) required for proper hydration of mucus. Additional ion channels (Slc6a20a), aquaporins (Aqp9), and mucus-associated proteins (Itln1) also had increased expression in coinfected mouse lungs. In addition to the mucin-related genes shared with RV/PR8, RV/PVM coinfected mice had increased expression of a transcription factor (FoxA3) that promotes goblet cell metaplasia and mucus production. Muc5ac and Clca1 had increased expression in coinfected mice at all time points (Fig 5).

Log2 fold change values compared to mock day 0 are shown for mucin 5ac (Muc5ac) and chloride channel accessory 1 (Clca1) genes, which are required for mucus production and hydration, respectively.
Based on the importance of type I IFN and inflammatory signaling pathways in the pathogenesis of viral infections, we generated heatmaps demonstrating relative gene expression across all groups for genes in the Hallmark Interferon Alpha Response and Inflammatory Response gene sets from MSigDB (42, 43). Overall, IFN-response genes had higher expression in RV/PR8 vs. mock/PR8 mice on day 2 and lower expression by day 6 (Fig 6A and S6 Fig). This pattern corresponds with our previous study that demonstrated increased expression of IFN-βonly on day 2 in RV/PR8 compared to mock/PR8 infected mice (9) and also the lower PR8 gene expression in coinfected mice (Fig 4). In contrast, mock/PVM and RV/PVM infected mice had delayed up-regulation of IFN-response genes and mock/PVM infected mice had dramatically higher expression of IFN-response genes on day 4 (Fig 6B and S6 Fig). This corresponds with the overall delayed PVM-induced gene expression and reduced levels of PVM RNA in coinfected mice (Fig 4). RV induced expression of a small subset of IFN-response genes (Il7, Ifi27, Lamp3, Cd74, Ifi30, and Lpar6) on day 0, which was maintained in RV/PVM-coinfected mice on day 2 (Fig 6B). While more variation in gene expression patterns was observed in the inflammatory response gene set, a large number of genes followed the same trends seen for IFN-response genes, i.e., a largely dampened response in RV-coinfected mice especially at later time points (Fig 6C, 6D and S7 Fig). By day 6, mock/PR8-infected mice had strongly up- and down-regulated expression of inflammatory response genes, while RV/PR8-coinfected mice had muted changes in expression of these genes (Fig 6C). A large subset of inflammatory response genes had similar patterns as IFN-response genes in mock/PVM and RV/PVM mice, including delayed expression and a muted response in coinfected mice (Fig 6D). This subset includes important inducers of inflammatory responses such as Nfkb1, Nfkbia, Rela, and Tlr3. Other subsets of genes (eg, Ccl17 and Ccl22) had early up-regulation in RV-infected mice on day 0, which was maintained in coinfected mice on day 2, and reduced in coinfected mice on days 4 and 6. In contrast with IFN-response genes, subsets of inflammatory response genes had higher expression in RV/PVM compared to mock/PVM infected mice throughout the course of infection. This suggests that, despite low virus levels (Fig 4) and no clinical signs of disease (Fig 1) and largely muted host gene expression, expression of some host genes is increased in RV/PVM-coinfected mice.

Heatmaps of Hallmark Interferon Alpha Response genes showing the relative expression (Z-scores) of genes for the (A) PR8 or (B) PVM coinfection RNA-seq timecourse. Heatmaps of Hallmark Inflammatory Response genes showing the relative expression (Z-scores) of genes for the (C) PR8 or (D) PVM coinfection RNA-seq timecourse. All heatmaps represent DESeq2 normalized counts where each gene is a row and each is ordered individually by hierarchical clustering. The colors (blue < white < red) represent the Z-score and a more intense color indicates a lower (blue) or higher (red) relative expression of that gene in that condition. Fully labeled heatmaps can be found in S6 and S7 Fig.
Flow cytometry analysis
Immune cells recruited to the lungs are affected by and contribute to the gene expression signatures seen in whole lung tissues. To analyze differences in immune cell recruitment to the lungs of single virus-infected and coinfected mice, we quantified innate immune cells in the left lobes by flow cytometry at the same time points as our gene expression analyses. Total cell counts from mock/PVM and RV/PVM infected mice were fairly consistent across all time points, while total cells in mock/PR8 and RV/PR8 infected mice increased by day 6 (S8 Fig). CD11b+ was used to differentiate leukocytes from resident lung cell populations. CD11b+ cells accounted for the increase in mock/PR8 and RV/PR8 infected lungs (Fig 7A). In contrast, while CD11b+ cells increased in the lungs of mice infected with mock/PVM, RV/PVM coinfected mice had reduced recruitment of these cells on days 4 and 6 (Fig 7E). Neutrophils were gated based on high expression of CD11b and Ly6G and the remaining cells were identified as alveolar macrophages (CD64+/SiglecF+) and interstitial macrophages (CD11b+/CD64+/SiglecF-) (S8 Fig) (44, 45).

Mice were inoculated with mock or RV on day −2 and PR8 (A-D) or PVM (E-H) on day 0, followed by analysis of specific cell populations in lung homogenates by flow cytometry, including total CD11b+ cell counts (A, E), and percentages of CD11bhi/Ly6Ghi neutrophils (B, F), CD11b+/CD64+/SiglecF-/Ly6G-interstitial macrophages (C, B), and CD64+/SiglecF+/Ly6G-alveolar macrophages (D, H). Asterisks indicate significantly different treatment pairs, see Supplemental Table 3. P-value *p<0.05, **p<0.01, ***p≤0.001. Expression of neutrophil (I, K) and monocyte/macrophage (J, L) specific chemokine genes from the RNA-seq analysis are shown as Log2 fold change vs. mock-inoculated mice.
The proportions of neutrophils and interstitial macrophages followed the same trends as total CD11b+ cells in PVM-infected mice, with lower proportions of these cells on days 4 and 6 in coinfected mice (Fig 7F, 7G). In contrast, interstitial macrophages were increased in RV/PVM, compared to mock/PVM-infected mice, early in infection. This indicates that coinfection by RV stimulates early recruitment of CD11b+ cells, specifically interstitial macrophages, while limiting recruitment of inflammatory cells later in infection. PR8-infected mice had similar trends, however the differences between mock/PR8 and RV/PR8 groups were less dramatic (Fig 7B, 7C). Neutrophil numbers were suppressed in RV/PR8 coinfected mice compared to mock/PR8 infected mice through-out the time course (Fig 7b). The interstitial macrophage proportions in mock/PR8- and RV/PR8-infected mice increased over time similarly to the total CD11b+ populations (Fig 7C). The lower proportions of neutrophils and interstitial macrophages at later time points in RV-coinfected mice corresponded with mRNA levels for chemokines. This was predominantly the case for neutrophil chemokines Cxcl1 and Cxcl2 (Fig 7I, 7K) and macrophage chemokines Ccl2 and Ccl7 (Fig 7J, 7L). These chemokines were generally lower in RV/PR8 coinfected mice on day 6 and RV/PVM coinfected mice on days 4 and 6 compared to mock/PR8 and mock/PVM infected mice, respectively.
There were no clear trends in alveolar macrophage numbers in mock/PR8- and RV/PR8-infected mice (Fig 7D), though their proportions were significantly higher in RV/PVM-coinfected mice compared to mock/PVM-infected mice on days 4 and 6 (Fig 7H). This is likely due to depletion of alveolar macrophages by PVM infection of these cells (46). A separate flow cytometry antibody panel was used to quantify CD4+ and CD8+ T cells in the lungs, but no significant differences were seen between single virus-infected and coinfected mice (S9 Fig). While 6 days may be too early to fully evaluate T cell responses, based on the kinetics of protection we do not expect T cells to be involved.
Discussion
Previously, we found that inoculation of mice with a mild respiratory viral pathogen, RV or murine coronavirus MHV-1, two days before PR8 provided significant protection against PR8-mediated disease (9). In this study, we expanded these results to show that RV-mediated protection was not specific to PR8, but also provided significant disease protection against a respiratory virus from another viral family, PVM. This is in agreement with other studies showing protection afforded by viral coinfection (10-12). Despite the commonality of coinfection resulting in reduced disease severity, there are differences between the virus combinations in the kinetics of disease and viral replication. Coinfection by RV provided more effective protection against PVM than PR8. RV/PVM coinfected mice had little to no signs of disease (Fig 1) and significantly limited PVM replication (Fig 4). In contrast, coinfection by RV prevented mortality, but not morbidity, associated with PR8 infection, and reduced viral gene expression but did not prevent infection by PR8 (Fig 4) (9). Further, RV given concurrently with PVM was as effective as when it was given two days before PVM (Fig 1). In contrast, RV was less effective at reducing the severity of PR8 when given concurrently and also exacerbated disease when it was given two days after PR8 (9). We also observed differences in the kinetics of gene expression in response to these virus pairs. Host (Fig 3) and viral (Fig 4) gene expression changes in response to PVM were delayed compared to PR8, thereby giving a larger window for RV-mediated protection. Thus, RV may be inducing antiviral mechanisms that are more effective against PVM, or different mechanisms may be responsible for inhibiting PVM infection and mediating effective clearance of PR8. We used transcriptomic and flow cytometry analyses to identify potential mechanisms that mediate protection against PR8 and PVM in mice that were coinfected with RV.
Analysis of RV-inoculated mice on day 0 (two days after RV inoculation) revealed up-regulation of 327 genes. These genes were highly enriched in GO categories that involved cell division or chemokine signaling (S2 Table). Despite expression of several chemokine and chemokine receptor genes, we did not observe a dramatic increase in immune cells in the lungs of RV-infected mice on day 0 (Fig 7). Although our flow cytometry results had variability in RV-infected mice on day 0 between our studies, we detected a significant increase in interstitial macrophages in the RV/PVM study (Fig 7G). Our flow cytometry panel was limited to focus on inflammatory cells (neutrophils and macrophages) and T cells and likely missed other cell types that could be recruited by RV early in infection. Further, by using whole lung for our assays, we may miss populations of cells that are small, but significant, in the airways. Indeed, other studies have found that neutrophils and lymphocytes are increased in the airways of RV-infected mice two days after inoculation (37, 47). While the chemokine signaling genes we identified in RV-infected mice on day 0 were also increased in single virus infected mice later, early upregulation of immune cell recruitment in coinfected mice may contribute to early control of infection and reduced disease severity.
In contrast to early recruitment of neutrophils, RV-coinfected mice had reduced numbers of neutrophils and interstitial macrophages later during infection (Fig 7). This decrease in inflammatory cell recruitment could be a result of reduced viral infection (Fig 4) and/or direct down-regulation of the inflammatory response. Other studies have shown that rhinoviruses inhibit macrophage responses to bacterial infection and toll-like receptor (TLR) stimulation (48, 49). This down-regulation leads to reduced neutrophil recruitment and activation and results in enhanced bacterial infection. While suppression of TLR signaling is detrimental during a subsequent bacterial infection, it can be protective in the case of respiratory viral infections for which inflammatory responses contribute to disease pathology. Blocking signaling from multiple TLRs (TLR2, TLR4, TLR7, and TLR9) through inhibiting the adaptor protein TIRAP reduces the severity of a lethal PR8 infection in mice (50). Inhibition of TIRAP reduces PR8-induced cytokine production by macrophages and is likely protective by limiting inflammatory responses (50). Similarly, inhibition of TLR2 and TLR4 signaling during PR8 infection reduces inflammatory cytokine responses and disease severity (51).
Inflammatory responses, particularly by granulocytes, are also associated with disease pathogenesis of PVM infection, independent of viral replication (32, 33). Priming with probiotic bacteria or parasitic infections can reduce the severity of PVM, which corresponds with reduced pulmonary inflammation. When given intranasally on days −14 and −7 prior to, or days 1 and 2 after PVM inoculation, Lactobacillus spp. prevent lethal viral infection (26, 52, 53). Bacterial priming is associated with reduced production of proinflammatory cytokines and chemokines and inflammatory cell recruitment to the lungs, especially neutrophils (26, 52, 53). Similarly, chronic schistosomiasis protects mice from a lethal PVM infection, which corresponds with up-regulation of mucus secretion pathways (30).
We found that coinfected mice had increased expression of several genes in the mucin production pathway. Muc5ac and Clca1 had increased expression in RV-coinfected mice with PR8 and PVM at all time points tested (days 0, 2, 4, and 6). Muc5ac, the predominant gel-forming mucin in the airways of humans and mice, is produced by goblet cells in the airway epithelium and Clca1 is a chloride channel regulator that is needed for proper mucus hydration. Other studies have reported up-regulation of Muc5ac mRNA and protein in the lungs and airways of RV-infected mice (37, 54, 55). Influenza A virus strains, including PR8, also induce expression of Muc5ac and mucus secretion (56-58). However, we only detected significant up-regulation of Muc5ac RNA in mock/PR8 infected mice on day 4 and it was to a lower level than in RV/PR8 coinfected mice (Fig 5). While stimulation of mucus production can promote pathology in chronic airway diseases such as asthma and COPD, acute mucus production in hosts with healthy airways promotes innate defense against pathogen invasion. Over-expression of Muc5ac in mice has been shown to reduce PR8 infection and neutrophil recruitment (31). Muc5ac also promotes neutrophil transmigration and recruitment (59), thus the reduction in neutrophils seen by Ehre et al. may be a consequence of lower viral replication. Muc5ac has also been shown to reduce the severity of PR8 and PVM infections in a parasite coinfection model (30). We hypothesize that expression of Muc5ac in RV-infected mice reduces infection and/or promotes more effective clearance of PR8 and PVM, which results in control of excessive neutrophilic inflammation.
In addition, coinfected mice had increased expression of the forkhead transcription factor FoxA3, which induces expression of multiple genes in the mucus production pathway that we found to be concurrently upregulated, including Muc5ac, Muc5b, Agr2, and Itln1 (54). Chen et al. demonstrated increased expression of FoxA3 and Muc5ac and goblet cell metaplasia in the airway epithelium of mice 3 days after infection by RV (54). In contrast to upregulating expression of genes associated with mucin production and goblet cell metaplasia, FoxA3 suppresses genes involved in antiviral innate immune responses (54). While this would be expected to enhance viral infections, early induction of antiviral immunity by coinfection may offset the inhibitory role of FoxA3. Additionally, this inhibitory role may contribute to down-regulation of detrimental inflammatory responses during coinfection. In addition to up-regulation of mucin genes, other genes important to mucin production and hydration had increased RNA levels in coinfected mice.
We found dramatic differences in the effects of interferon (IFN)-response genes in PR8 vs. PVM infected mice. In PVM-infected mice, increased expression of IFN-response genes was delayed until day 4, at which point expression was generally lower in coinfected compared to single virus infected mice. Similarly, other studies have shown no induction of IFN signaling at 24 hours (20) vs. strong IFN signaling by 6 days (16) after PVM infection in mice, although these studies used two different PVM strains in C57Bl/6 mice. In contrast, RV/PR8 coinfected mice had early (day 2) up-regulation of IFN-response genes and later down-regulation (day 6). These patterns correspond to those we have seen previously in RV/PR8 coinfected mice (9), and reflect a protective role of type I IFN in PR8, but not PVM, infected mice. Type I IFN signaling is important for immediate antiviral defense mechanisms as well as orchestrating the correct balance of immune cells responding to infection. RV/PR8 coinfected mice had early upregulation of type I IFN signaling (Fig 6) without an appreciable effect on viral gene expression (Fig 4) or replication (9). Indeed, others have shown that type I IFN signaling is critical for orchestrating monocyte responses to PR8 infection, which in turn limits neutrophilic inflammation (18). These findings demonstrate that type I IFN can provide protection during respiratory viral infections that is independent of direct inhibition of viral replication. Ongoing studies to determine the role of type I IFN signaling will be critical to understanding the differences in protection upon RV coinfection with PR8 and PVM.
Materials and Methods
Ethics Statement
All mouse procedures were approved by the University of Idaho’s Institutional Animal Care and Use Committee, in compliance with the NIH Guide for the Care and Use of Laboratory Animals. Female, 6-7 week-old BALB/c mice were ordered from Invivogen and were allowed to acclimatize for 10 days prior to experimentation. All mice were housed in the UI Laboratory Animal Research Facility under 12 hour light/dark cycles, received food and water ad libitum, and were monitored daily for any signs of distress.
Virus Infections
Viruses used in this study include PVM strain 15 (ATCC VR-25), RV1B strain B632 (ATCC VR-1645) and influenza A virus, A/Puerto Rico/8/34 (H1N1; BEI Resources NR-3169). Viruses were grown and titrated by TCID50 assays in BHK-21 (PVM), HeLa (RV1B), and MDCK (PR8) cell lines.
Mice were anesthetized using isoflurane during intranasal inoculation. RV/PVM timing experiments were performed using groups of seven mice. Mice were either mock-inoculated (PBS/2% FBS) or inoculated with 7.6 x 10⁶ TCID50 units of RV1B two days before, simultaneously with, or two days after 1.0 x 10⁴ TCID50 units PVM in 0.05 mL intranasally. Mice were then monitored daily for mortality, weight loss, and clinical signs of disease (ruffled fur, hunched posture, lethargy, and labored breathing). Clinical signs in these four categories were scored on a scale of 0-3 (0-none, 3-severe). Humane euthanasia was performed by overdose of sodium pentobarbital followed by exsanguination when mice lost more than 25% of their starting weight, exhibited severe clinical signs of disease, or at pre-determined time points. Survival and weight loss data were analyzed with Prism 6.0 (Graphpad) software using Log-rank Mantel-Cox and student’s t-test corrected for multiple comparisons using the Holm-Sidak method, respectively.
RNA-seq and flow cytometry experiments were performed using groups of five mice. Mice were either mock-inoculated (PBS/2% FBS) or inoculated with 7.6 x 10⁶ TCID50 units RV1B intranasally on day −2. On day 0, mice were either inoculated with ∼50 TCID50 units of PR8 or 1.0 x 10⁴ TCID50 units of PVM. Mice were euthanized on days 0, 2, 4, and 6 to collect lungs for analyses. Left lobes were used for flow cytometry analysis and right lobes were placed in RNALater for RNA-seq analysis (see below).
RNA-seq Analysis
RNA was extracted from mouse lung tissue according to the RNeasy Plus with gDNA removal protocol (QIAGEN) and quantified using an HS RNA kit and Fragment Analyzer (Advanced Analytical). The three samples with the highest RNA quality from each group were used for RNA-seq analysis. Stranded RNA libraries were prepared from 4 ug RNA of each sample by UI’s IBEST Genomics Resources Core according to KAPA’s stranded mRNA-seq (KK8420) library preparation protocol with capture of polyadenylated mRNAs. Libraries were tagged with unique ligation adapters (BioOScientific), amplified, quantified (qubit and fragment analyzer), and pooled at an equimolar ratio. The pooled library was split, pooled with other libraries, and sequenced across 5 lanes of an Illumina HiSeq4000 100bp PE run at University of Oregon’s Genomics and Cell Characterization Core. Paired end reads (100 bp) were quality trimmed and filtered using Trimmomatic v0.36 (ILLUMINACLIP:2:20:10, HEADCROP:10, SLIDINGWINDOW:4:15, MINLEN:36) and mapped to the mouse genome (GRCm38/mm10 downloaded from UCSC) using TopHat v2.1.1 (r 300) (60, 61). The TopHat alignments were the starting points for two methods of quantifying read counts and four methods of analyzing differential expression. The Cufflinks v2.1.1 package (Cufflinks, Cuffmerge, Cuffdiff) was compared to DE pipelines using HTSeq v0.8.0 (htseq-count -m intersection -nonempty -s reverse -t exon) followed by DESeq2 v1.18.1, and EdgeR 3.18.1 (62, 63). DESeq2 and EdgeR were run within the SARTools wrapper (64). DEGs with adjusted p values below 0.05 were dropped. A text file containing important parameters and code is included in S1 File.
Analysis of viral gene expression
Reads that did not map to the mouse genome were extracted and de-interleaved using BBmaps’ reformat script (http://sourceforge.net/projects/bbmap/) to give pair reads for mapping. These reads were aligned to the RV1B (D00239), PR8 (LC120388-LC120395), and PVM (AY729016) genomes using TopHat v2.1.1 and gene coverages were counted using HTseq v0.8.0 (see parameters above). Statistics were performed using a generalized linear model in R.
DEG function analysis
The DEG lists for each treatment comparison were searched for differentially enriched gene ontologies (GO terms) and KEGG pathways using CompGO (65). CompGO utilizes gene expression level data (as opposed to just gene names) to identify potential functions that differ between treatments. We ran CompGO on DEG lists from each individual method (Cufflinks, EdgeR, DESeq2) and combinations of gene sets to anecdotally look for consistency across methods.
Flow Cytometry
The left lung lobe of each sample was dissociated in RPMI medium containing type IV collagenase (MP Biomedicals) and DNase I (Spectrum) using gentleMACS C tubes according to the manufacturer’s recommendations (Miltenyi Biotec). Cells were filtered through a 70 µm strainer and red blood cells were lysed before blocking FC receptors using anti-CD16/CD32 (BioLegend). Cell-specific proteins were labeled with the following antibodies: CD11b-Alexa Fluor 488 (eBiosciences), Ly6G-APC (eBiosciences), CD64-PE (BioLegend), SiglecF-PerCP-Cy5.5 (BD Biosciences), or the appropriate isotype control antibodies. Stained cells were incubated in BD Stabilizing Fixative (BD Biosciences) and analyzed using a FACS Aria Cytometer (BD Biosciences). Results were analyzed using FlowJo software (Treestar) and gating was performed based on fluorescence minus one controls. The gating strategy used to identify neutrophils, alveolar macrophages, and interstitial macrophages is shown in S8 Fig.
Statistical Analysis
We analyzed flow cytometry (Fig 7) and viral read count (Fig 4) data resulting from our experiments to identify time-varying differences between mice infected with PR8 or PVM alone or coinfected with RV. To this end, we used negative binomial regression on each response variable with an explanatory model that had a main effect of days post-infections, a main effect of treatment (single or coinfection), and the interaction between the two main effects. Response variables were the number of CD11b cells, neutrophils, interstitial macrophages, alveolar macrophages, and viral read counts; all response variables were normalized versus total cell count except for viral RNA read count which was normalized against total RNA read count. Due to a prior visual investigation of our data, it seemed some of our response variables might be better fit with a quadratic time term. Because of this we fit an alternative model that included an orthogonal polynomial of degree 2 for time. We assessed whether the quadratic model was better than the linear model using a likelihood ratio test and chose the quadratic model if it offered a significant improvement in fit over the simpler linear model. The significance of treatment and time was determined using a type-I ANOVA. To detect differences between treatments at a given time, we also performed post hoc pairwise comparisons of the modeled mean at our observational time points (days 0, 2, 4, and 6) using the emmeans package in R. Supplemental Table 3 provides information on the analyses, including which time model was used, the significance of treatment and time. Significant contrasts are shown in individual figures.
Data availability
Raw Illumina reads have been deposited in NCBI SRA database under accession numbers SRR7060120-SRR7060117 under project PRJNA453386.
Supporting Information
Supplemental Table 1 provides raw read counts (mean of the three replicates and normalized to library size) and log2 fold change values for genes that had statistically significant differences in expression between each comparison (infected or coinfected vs. mock-inoculated and coinfected vs. single infected).
Supplemental Table 2 provides statistically significant GO terms for each comparison (infected or coinfected vs. mock-inoculated and coinfected vs. single infected).
Supplemental Table 3 provides a summary of results from negative binomial regression analyses of flow cytometry and viral read count data.
S1 Fig. Weight loss of mice used in the RNA-seq and flow cytometry experiments. Mice were inoculated intranasally with saline (mock) or RV on day −2 and PR8 or PVM on day 0. Weight was recorded daily for all mice until the pre-determined time points. Days −2 through 2, N=15 per group; days 3 through 4, N=10 per group; days 5 through 6, N= 5 per group.
S2 Fig. Read coverage of individual viral genes. The proportion of reads mapping to each viral gene is shown for mice infected with PR8 or PVM.
S3 Fig. Heatmap of mock/PR8 vs. RV/PR8 unique genes. Expression of genes that are significantly different between mock/PR8 and RV/PR8 infected mice that are not significant between mock/PVM and RV/PVM infected mice. Colors represent Z-scores for individual genes across infections and time points as described for Fig 6.
S4 Fig. Heatmap of mock/PVM vs. RV/PVM unique genes. Expression of genes that are significantly different between mock/PVM and RV/PVM infected mice that are not significant between mock/PR8 and RV/PR8 infected mice. Colors represent Z-scores for individual genes across infections and time points as described for Fig 6.
S5 Fig. Heatmap of differentially expressed genes shared by coinfected mice. Expression of genes that are significantly different between mock/PVM and RV/PVM infected mice that are also significant between mock/PR8 and RV/PR8 infected mice. Colors represent Z-scores for individual genes across infections and time points as described for Fig 6.
S6 Fig. Heatmaps of MSigDB Hallmark Interferon Alpha Response gene set shown in Figure 6, including gene names. See Fig 6 legend for details.
S7 Fig. Heatmaps of MSigDB Hallmark Inflammatory Response gene set shown in Figure 6, including gene names. See Fig 6 legend for details.
S8 Fig. Total cell counts and gating strategy for flow cytometry. Left lungs were processed for flow cytometry staining with antibodies against CD11b, Ly6G, CD64, and Siglec F. Total cell counts for all samples and representative plots showing the gating strategy to identify neutrophils, alveolar macrophages, and interstitial macrophages are shown.
S9 Fig. CD4 and CD8 cell counts by flow cytometry. Left lungs were processed for flow cytometry staining with antibodies against CD3, CD4, and CD8 to identify total CD4+ and CD8+ T cells.
Acknowledgements
This study was supported by the National Institutes of Health (NIH) grants P20 GM104420 and P20 GM103397. We thank the Institute for Bioinformatic and Evolutionary Studies (IBEST) Genomics Resources Core and Optical Imaging Core. The following reagents were obtained through the NIH Biodefense and Emerging Infections Research Resources Repository, NIAID, NIH: Influenza A Virus, A/Puerto Rico/8/34 (H1N1).
References


