

ABSTRACT
Amyotrophic lateral sclerosis (ALS) is an archetypal complex disease centered on progressive death of motor neurons. Despite heritability estimates of 52%, GWAS studies have discovered only seven genome-wide significant hits, which are relevant to <10% of ALS patients. To increase the power of gene discovery, we integrated motor neuron functional genomics with ALS genetics in a hierarchical Bayesian model called RefMap. Comprehensive transcriptomic and epigenetic profiling of iPSC-derived motor neurons enabled RefMap to systematically fine-map genes and pathways associated with ALS. As a significant extension of the known genetic architecture of ALS, we identified a group of 690 candidate ALS genes, which is enriched with previously discovered risk genes. Extensive conservation, transcriptome and network analyses demonstrated the functional significance of these candidate genes in motor neurons and disease progression. In particular, we observed a genetic convergence on the distal axon, which supports the prevailing view of ALS as a distal axonopathy. Of the new ALS genes we discovered, we further characterized KANK1 that is enriched with coding and noncoding, common and rare ALS-associated genetic variation. Modelling patient mutations in human neurons reduced KANK1 expression and produced neurotoxicity with disruption of the distal axon. RefMap can be applied broadly to increase the discovery power in genetic association studies of human complex traits and diseases.
INTRODUCTION
ALS is an untreatable, universally fatal and relatively common neurodegenerative disease with a lifetime risk of ~1/350 in the UK. The hallmark of the disease is motor neuron loss leading to respiratory failure and death1. 10% of ALS is autosomal dominant, and even for sporadic ALS (sALS), the heritability is estimated to be ~50%2,3. Genome-wide association studies (GWAS) in ALS4,5 have identified seven genome-wide significant loci, which have been linked to missense mutations. However, these changes occur in <10% of ALS patients, so there are likely to be a large number of missing ALS risk genes.
ALS GWAS studies to date have lost power by considering genetic variants in isolation, whereas in reality, a biological system is the product of a large number of interacting partners6,7. Moreover, noncoding regulatory regions of the genome have been relatively neglected in efforts to pinpoint the genetic basis of ALS, despite their functional synergy with the coding sequence8,9. Indeed, GWAS studies have suggested that a significant proportion of missing heritability in ALS is distributed throughout noncoding chromosomal regions4,5. The function of noncoding DNA is often tissue, disease, or even cell-type specific10, and the understanding of the cell-type-specific biological function in complex neurological diseases has been improving11,12. This therefore creates an opportunity to dramatically reduce the search space and so boost the power to discover ALS genetic risk, by focusing on genomic regions that are functional within the cell type of interest, i.e., motor neurons (MNs)13.
Here, we present RefMap (Regional Fine-mapping), a hierarchical Bayesian model to perform genome-wide identification of disease-associated genetic variation within active genomic regions. RefMap utilizes cell-type-specific epigenetic profiling to determine the prior probability of disease-association for each region. This reduces the search space by >90% given that a limited proportion of the genome is active in any specific cell type. ALS is notable for the selective vulnerability of MNs13. However, MNs are difficult to study in post-mortem tissues (e.g.14) because of their relative sparsity, so a different approach is needed. We performed exhaustive transcriptomic and epigenetic profiling, including RNA-seq, ATAC-seq, histone ChIP-seq and Hi-C, for motor neurons derived from fibroblasts of neurologically normal controls. We hypothesized that the genetic variation within regulatory regions may alter the expression of their target genes, and we proposed that disease-associated variants are likely to reduce gene expression via interfering with regulation. Applying RefMap to perform genome-wide fine-mapping based on ALS GWAS data (Fig. 1a) identified 690 ALS-associated genes, including previous GWAS hits and even known ALS genes not previously detected in GWAS studies.

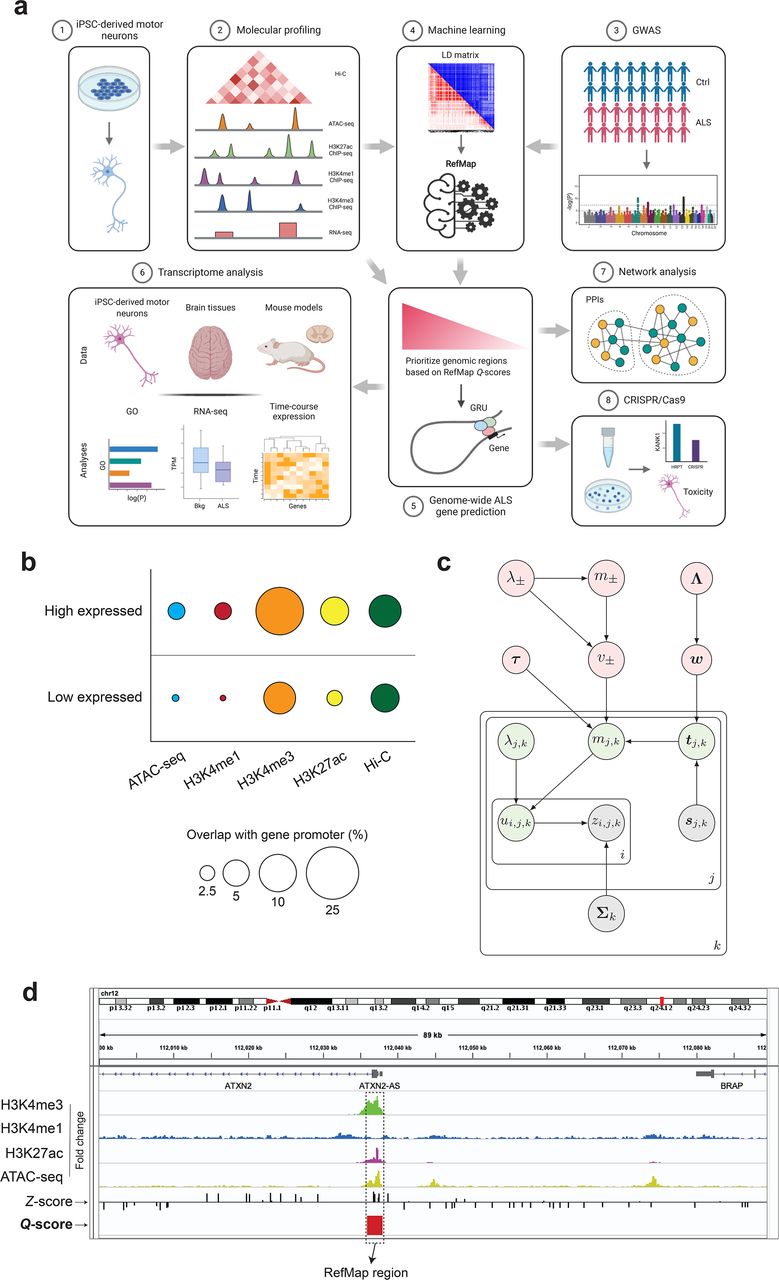
(a) Schematic of the study design for identifying ALS risk genes by integrating ALS genetics with functional genomics from motor neurons. (1-2) We sequenced the transcriptome and epigenome of the iPSC-derived motor neurons. By integrating (3) ALS genetics with functional genomics of MNs, (4) a machine learning model called RefMap was developed to fine-map ALS-associated regions. (5) After mapping those identified regions to their target genes, 690 ALS-associated genes were pinpointed. (6) Transcriptome analysis based on iPSC-derived MNs, human tissues and mouse models, as well as (7) network analysis were performed to demonstrate the functional significance of RefMap genes in ALS. (8) CRISPR/Cas9 reproduction of newly identified ALS-associated KANK1 mutations experimentally verified the proposed link to neuronal toxicity. The LD heatmap matrix in (4) was visualized in both R2 (red) and D’ (blue) using LDmatrix (https://ldlink.nci.nih.gov/?tab=ldmatrix). GRU=Gene Regulatory Unit; GO=Gene Ontology. (b) Epigenetic profiling data from motor neurons is internally consistent. Markers of genomic activity are significantly enriched in promoter regions of high-expressed genes compared to low-expressed genes. Circle area is proportional to % overlap. Hi-C data was scaled by a factor of ten for clarity. (c) Graphical representation of RefMap. Observed variables were annotated in grey, local hidden variables were in green and global latent variables were in pink (Methods). (d) A region (chr12:112,036,001-112,038,000) around ATXN2 was precisely pinpointed by RefMap because of elevated SNP Z-scores and enriched epigenome peaks (ATAC-seq, H3K27ac and H3K4me3 histone ChIP-seq). The output of RefMap was labeled as Q-score. ATAC-seq and ChIP-seq signals were shown in fold change (FC) based on one replicate from sample CS14.
We explored the functional significance of RefMap ALS genes based on a series of orthogonal analyses. Population genetics revealed that RefMap genes consist of conserved sequences, suggesting that their functions are important and not subject to genetic redundancy. Transcriptome data from MNs, human tissues and mouse models demonstrated that RefMap genes are down-regulated in ALS patients, consistent with our aforementioned hypothesis. Network analysis of protein-protein interactions (PPIs) identified two modules enriched with RefMap genes. These modules are enriched with biological functions localized to the distal axon of MNs, suggesting that neurotoxicity may be initiated in this subcompartment, which is consistent with previous literature15,16. Finally, we have further characterized a new ALS gene, i.e., KANK1. Common and rare genetic variants that alter KANK1 expression were shown to be associated with ALS and neuronal toxicity. RefMap provides a promising framework to pinpoint the genetic bases of human complex traits and diseases based on GWAS data.
RESULTS
Transcriptomic and epigenetic profiling of iPSC-derived motor neurons
To identify genomic regions key to motor neuron function, we performed transcriptomic and epigenetic profiling of iPSC-derived motor neurons from neurologically normal individuals (Supplementary Fig. 1). The cells exhibited homogenous expression of the lower motor neuron markers, including TUJ1, Chat, SMI, MAP2 and NeuN (Supplementary Fig. 1a). We prepared RNA-seq17, ATAC-seq18, H3K27ac, H3K4me1 and H3K4me3 ChIP-seq19, as well as Hi-C20 libraries using two technical replicates and three biological replicates per assay. Sequencing data were processed and quality control (QC) was performed according to the ENCODE 4 standards21, and all samples exceeded ENCODE standard QC measures (Supplementary Tables 1-4).
ATAC-seq identifies open and functional chromatin regions, which is complementary to the profiling of transcript expression by RNA-seq. H3K27ac, H3K4me1 and H3K4me3 ChIP-seq assays pinpoint active enhancer22 regions, which are important noncoding regions for the regulation of gene expression. Hi-C profiling of three-dimensional (3D) genome structure is essential to map regulatory regions including enhancers, to their target genes. Our MN epigenetic profiling successfully reduced the search space for ALS-associated genetic variation by >90%. Specifically, total ATAC-seq peak regions across all biological replicates covered 4.9% of the genome.
To measure the consistency between distinct motor neuron profiles, we used our RNA-seq dataset to identify promoter regions for high (>90th centile) and low (<10th centile) expressed transcripts. We compared enrichment of ATAC-seq and histone ChIP-seq peak regions, and Hi-C loops in high versus low expressed promoters. Significant enrichment within highly expressed promoters was confirmed for ATAC-seq (P=1.1e-182, odds ratio (OR)=1.9, Fisher’s exact test), H3K27ac ChIP-seq (P=2.0e-57, OR=2.2, Fisher’s exact test), H3K4me1 ChIP-seq (P=8.5e-57, OR=1.9, Fisher’s exact test), H3K4me3 ChIP-seq (P=4.8e-196, OR=2.6, Fisher’s exact test), and Hi-C loops (P=4.0e-14, OR=1.3, Fisher’s exact test) (Fig. 1b). Similarly, epigenetic peak regions were enriched in MN Hi-C loops: ATAC-seq (P<1.0e-198, OR=1.9, Fisher’s exact test), H3K27ac ChIP-seq (P<1.0e-198, OR=2.0, Fisher’s exact test), H3K4me1 ChIP-seq (P<1.0e-198, OR=2.0, Fisher’s exact test), and H3K4me3 ChIP-seq (P<1.0e-198, OR=1.7, Fisher’s exact test). These observations confirm that our epigenetic profiling captured functionally significant genomic variation, and that our epigenetic profiles were internally consistent.
RefMap identifies ALS risk genes
Mismatch between the relatively small number of characterized ALS risk genes and the estimate of high heritability suggests that a new approach is required to discover more ALS-associated genetic variation. Here, we designed a hierarchical Bayesian network named RefMap that exploits the epigenetic profiling of MNs to reduce the search space and so improve the statistical power to discover ALS-associated loci across the genome. Specifically, RefMap integrates the prior probability of significance derived from the epigenome of MNs, with allele effect sizes estimated from GWAS (Figs. 1a and 1c, Methods). Based on a linear genotype-phenotype model (Supplementary Notes), RefMap first disentangles effect sizes from GWAS Z-scores, which are confounded by the structure of linkage disequilibrium (LD). Effect sizes are then summarized across genomic regions in individual LD blocks. Those regions that are within active chromatin, and where the distributions of allele effect sizes are shifted from the null distribution, are prioritized by the algorithm (Methods).
In our study, the Z-scores were calculated based on the largest published ALS GWAS study4,5, including genotyping of 12,577 sporadic ALS patients and 23,475 controls. An epigenetic signal was calculated from a linear combination of MN chromatin accessibility and histone marks specific to active enhancer regions (Methods). We defined LD blocks as 1Mb windows, where we assumed significant internal LD but negligible external LD23. Within LD blocks, SNP correlations were estimated based on the European population (EUR) data from the 1000 Genomes Project24. With this information, RefMap scanned the genome in 1kb windows and identified all regions that are likely to harbor ALS-associated genetic variation (Figs. 1c and 1d, Methods, and Supplementary Table 5).
Next, we mapped ALS-associated regions identified by RefMap to expressed transcripts in MNs (RNA-seq, TPM>=1), based on their regulation targets. We defined regulation targets as genes that overlap either ALS-associated regions by extension, or via their Hi-C loop anchors (Methods). This resulted in 690 ALS-associated genes (Supplementary Table 6). Among this list, we discovered well-known ALS genes, including C9orf7225 and ATXN226 (Fig. 1d). Indeed, RefMap genes are enriched with an independently curated list (Supplementary Table 7) of ALS genes including previous GWAS hits (P=5.20e-3, OR=2.07, Fisher’s exact test) and also with clinically reportable (ClinVar27) ALS genes (P=0.03, OR=3.06, Fisher’s exact test). Interestingly, certain ALS genes, such as UNC13A28,29, are missing from RefMap genes, but their paralogues are present, including UNC13B, which is consistent with a functional overlap. If we consider paralogues as equivalent to ALS genes, then the enrichment of RefMap genes with known ALS genes is further increased (curated: P=6.12e-43, OR=8.71; ClinVar: P=6.40e-14, OR=12.26; Fisher’s exact test).
As a negative control, we randomly shuffled SNP Z-scores, in which case there was no overlap between RefMap outputs and known ALS genes. Additional shuffling of epigenetic features disrupted the signal further such that there were no significant RefMap outputs. This illustrates the dependence of RefMap on the two primary inputs: GWAS Z-scores and MN epigenetic features.
Conservation analysis demonstrates the functional importance of RefMap genes
A large proportion of RefMap ALS genes were identified because of ALS-associated genetic variation within noncoding regulatory regions. We hypothesized that the functional consequence of pathogenic genetic variation within regulatory regions is likely to be reduced expression of the target genes. A conservation analysis was first carried out, revealing that change in the expression of RefMap ALS genes is likely to be pathogenic based on population genetics.
Conservation refers to DNA sequences that are preserved in the population presumably because disruption would be deleterious. Conservation can be quantified by the haploinsufficiency (HI) score, which is a measure of functional similarity to known haplosufficient and haploinsufficient genes30. Conservation is also related to intolerance scores, in which the rate of observed mutation of a gene in the population is compared to the expected rate in the absence of negative selection31,32,33. In particular, a lower than expected mutation rate implies intolerance to mutation. We discovered that RefMap genes are significantly haploinsufficient based on their HI score (P=2.59e-19, one-sided Wilcoxon rank-sum test; Fig. 2a), and intolerant to loss of function mutations within the Exome Aggregation Consortium (ExAC) dataset34 (LoFtool score31: P=2.28e-4, one-sided Wilcoxon rank-sum test; Fig. 2b). They are also intolerant to other mutation types (RVIS score32: P=8.08e-13, one-sided Wilcoxon rank-sum test; Fig. 2c), as well as within the larger gnomAD (v.2.1) dataset (o/e score33: P=4.08e-10, one-sided Wilcoxon rank-sum test; Fig. 2d). Taken together, these results support the functional significance of RefMap ALS genes.

(a-d) Comparison of (a) haploinsufficiency score, (b) LoFtool percentile, (c) RVIS-ExAC percentile and (d) o/e score between RefMap genes and all the genes in the transcriptome. All comparisons were performed using the one-sided Wilcoxon rank-sum test. RefMap genes showed a significant increase in HI score (a) and a decrease in LoFtool percentile (b), RVIS-ExAC percentile (c) and o/e score (d). The bottom and top of the boxes indicate the first and third quartiles, respectively, where the black line in between indicates the median. The whiskers denote the minimal value within 1.5 interquartile range (IQR) of the lower quartile and the maximum value within 1.5 IQR of the upper quartile. The plus symbols represent outliers. In e, the black dashed lines indicate the lower and upper limits of the regions with regular scale. Outliers outside of the black dashed lines are visualized with compressed scale in regions surrounded by gray lines for better visualization.
Transcriptome analysis supports functional significance of RefMap genes in motor neurons and in ALS
We have hypothesized that the ALS-associated genetic variation identified by RefMap is likely to be pathogenic through altered expression of the 690 RefMap genes. We have also demonstrated, based on population genetics, that the function of RefMap genes is highly sensitive to changes in expression. To explore this possibility further, we examined whether change in the expression of RefMap genes is associated with ALS, using transcriptome data from patient-derived MNs, central nervous system (CNS) tissues and an ALS animal model.
First, we inspected the expression of RefMap genes in our iPSC-derived MNs from neurologically normal individuals. RefMap genes were upregulated (P=3.07e-17, one-sided Wilcoxon rank-sum test; Fig. 3a) compared to the overall transcriptome, indicating their importance in normal MN function. No differential expression was observed for genes derived from RefMap using randomly shuffled Z-scores.

(a) RefMap genes were upregulated compared to the transcriptome in iPSC-derived motor neurons from neurologically normal individuals (n=3). For a fair comparison, we only considered those genes with expressed transcripts (TPM>=1) in the transcriptome, following a similar procedure in mapping ALS-associated regions to their targets. (b) RefMap genes were downregulated in post-mortem CNS tissue from C9orf72-ALS (n=8) and sporadic ALS (n=10) patients compared to neurologically normal controls (n=17). FC=Frontal Cortex; CB=Cerebellum. (c) RefMap genes were downregulated in iPSC-derived motor neurons from ALS patients (n=55) compared to neurologically normal controls (n=15). All comparisons in a-c were performed using the one-sided Wilcoxon rank-sum test, and the Benjamini-Hochberg (BH) correction was carried out in b. In a-c, the bottom and top of the boxes indicate the first and third quartiles, respectively, where the black line in between indicates the median. The whiskers denote the minimal value within 1.5 IQR of the lower quartile and the maximum value within 1.5 IQR of the upper quartile. The plus symbols represent outliers. In b, the black dashed lines indicate the lower and upper limits of the regions with regular scale. Outliers outside of the black dashed lines are visualized with compressed scale in regions surrounded by gray lines for better visualization. (d) Hierarchical clustering of expression changes of RefMap genes during disease progression based on the SOD1-G93A mouse model. RefMap genes were mapped to their mouse homologs (n=510). Gene expression levels were estimated using the β scores calculated in 37, and were averaged across different sections of spinal cords at each time point. Time points p30, p70, p100, and p120 represent presymptomatic, onset, symptomatic and end-stage, respectively. Difference of gene expressions between SOD1-G93A and SOD1-WT mice at each time point was quantified by the difference of corresponding β (Δβ). Before clustering, Δβ were standardized across genes, and one minus correlation was used as the clustering distance. (e) Two distinct expression patterns (C1: 286 genes; C2: 224 genes) of RefMap genes identified after clustering. The larger cluster C1 was progressively downregulated during ALS progression. Solid plot represents the mean of expressions within each cluster, and the standard error was shown as shading. (f) Gene ontology analysis of C1, showing that C1 is enriched with functions related to the motor neuron distal axon and synapse. GOBP=Gene Ontology Biological Process; GOCC=Gene Ontology Cellular Compartment. Dashed line represents P=0.05.
Next, we examined the expression of RefMap ALS genes in CNS tissues derived from ALS patients (n=18) and controls (n=17)35. We hypothesized that RefMap genes would be downregulated in ALS patient tissues. As expected, a significant decrease in the expression of RefMap genes was observed in both frontal cortex (C9orf72-ALS (cALS): false discovery rate (FDR)=0.002, one-sided Wilcoxon rank-sum test) and cerebellum (C9orf72-ALS: FDR=0.002; sporadic ALS: FDR=0.005) of ALS patients compared to the overall transcriptome (Fig. 3b). As an independent validation, we analyzed gene expression within iPSC-derived MNs from ALS patients (n=55, https://www.answerals.org/), and confirmed that RefMap genes were downregulated (P=3.85e-04, one-sided Wilcoxon rank-sum test; Fig. 3c) compared to neurologically normal controls (n=15).
Finally, we used longitudinal data to infer whether changes in expression of RefMap ALS genes occur upstream or downstream in the development of neuronal toxicity. To achieve this, we utilized the SOD1-G93A-ALS mouse model, which is the best characterized ALS model to date36 and the only model featuring consistent and reproducible loss of spinal cord MNs that mirrors the human disease. We examined longitudinal gene expression averaged across spinal cord sections from SOD1-G93A (n=32) and SOD1-WT (n=24) mice37. Four time points were sampled, including presymptomatic (p30), onset (p70), symptomatic (p100) and end-stage (p120). The model-estimated expression levels (β)37 were adopted to quantify the gene expression difference (Δβ) between diseased and control mice at different time points. To determine the expression changes of RefMap genes over the course of ALS pathogenesis, we first mapped RefMap genes to their mouse homologs (n=510), and then performed unsupervised clustering on gene expressions over time. We identified two different expression patterns for RefMap homologs (Figs. 3d and 3e) with verified clustering quality (Supplementary Fig. 2). Strikingly, the largest group (286/510) of RefMap homologs were progressively downregulated through consecutive disease stages (C1; Figs. 3d and 3e, Supplementary Table 8), consistent with our human observations. Functional enrichment analysis38 of C1 genes revealed significant enrichment with functions associated with motor neuron biology (Fig. 3f), including ‘cholinergic synapse’, ‘axon’ and ‘cytoskeleton’, which is consistent with known ALS biology13 and with the prevailing view of ALS as a distal axonopathy15,16. C2 genes do not contain significant functional enrichment (data not shown).
Systems analysis dissect ALS-associated functional modules
We have used RefMap to extend the number of ALS-associated risk genes to 690. We aimed to assess whether these genes are functionally consistent with current knowledge regarding the biology of MNs and ALS. Genes do not function in isolation and therefore, rather than examining individual genes, we mapped RefMap ALS genes to the global protein-protein interaction (PPI) network and inspected functional enrichment of ALS-associated network modules.
We first extracted high-confidence (combined score >700) PPIs from STRING v11.039, which include 17,161 proteins and 839,522 protein interactions. To eliminate the bias of hub genes40, we performed the random walk with restart algorithm over the raw PPI network to construct a smoothed network based on those edges with weights in the top 5% (Supplementary Table 9, Methods). Next, this smoothed PPI network was decomposed into non-overlapping subnetworks using the Louvain algorithm41 that maximizes the modularity to detect communities from a network. This process yielded 912 different modules (Supplementary Table 10), in which genes within modules were densely connected with each other but sparsely connected with genes in other modules. As a negative control, we constructed 100 shuffled networks by randomly rewiring the PPI network while keeping the same number of neighbors. None of the randomized networks achieved the same modularity of our smoothed network after clustering, demonstrating the significance of our derived gene modules (P<0.01; Supplementary Fig. 3a).
RefMap ALS genes were then mapped to individual modules, and two modules were found to be significantly enriched with RefMap genes: M421 (721 genes; FDR<0.1, hypergeometric test; Fig. 4a) and M604 (308 genes; FDR<0.1, hypergeometric test; Fig. 4b) (Supplementary Table 10). Functionally M421 is enriched with GO/KEGG terms related to the distal axon, including synapse and axonal function within motor neurons (Fig. 4c). M421 is also enriched with genes related to relevant neurodegenerative diseases, including ‘amyotrophic lateral sclerosis’ and ‘Alzheimer’s disease’. M604 is enriched with GO/KEGG terms related to the actin cytoskeleton and axonal function (Fig. 4d). Notably, the actin cytoskeleton is key for neuronal function and for axonal function in particular. Overall, the functional enrichment of both modules highlights an important role of the distal axon in ALS etiology (Fig. 4e), which is consistent with previous literature15,16. Finally, both M421 and M604 were overexpressed in control iPSC-derived MNs (Fig. 4f), in a similar manner to the total set of RefMap genes. Interestingly, many functions ascribed to M421 and M604 overlap with the functions of the C1 cluster from our analysis of the SOD1-G93A mouse model (Fig. 3f), demonstrating a functional convergence of RefMap ALS genes.

(a-b) PPI network analysis revealed two modules that are significantly (FDR<0.1) enriched with RefMap genes: (a) M421 (721 genes) and (b) M604 (308 genes). Hypergeometric test was performed to quantify the enrichment followed by the BH correction. Module nodes were colored to demonstrate RefMap enrichment, where RefMap genes are in blue and other module genes are in yellow. Edge thickness is proportional to STRING confidence score (>700). (c-d) RefMap modules, including (c) M421 and (d) M604, are enriched for motor neuron functions localized within the distal axon. GOBP=Gene Ontology Biological Process; GOCC=Gene Ontology Cellular Compartment. Dashed line represents P=0.05. (e) Representation of pathways enriched in each module (c and d) in MNs. (f) RefMap modules were highly expressed within control motor neurons, consistent with an important role in motor neuron function. All comparisons were performed using the one-sided Wilcoxon rank-sum test. The bottom and top of the boxes indicate the first and third quartiles, respectively, where the black line in between indicates the median. The whiskers denote the minimal value within 1.5 IQR of the lower quartile and the maximum value within 1.5 IQR of the upper quartile. The plus symbols represent outliers. The black dashed lines indicate the lower and upper limits of the regions with regular scale. Outliers outside of the black dashed lines are visualized with compressed scale in regions surrounded by gray lines for better visualization.
Rare variant burden analysis is consistent with KANK1 as a novel ALS risk gene
Among all ALS-associated active regions identified by RefMap, chr9:663,001-664,000 has the highest concentration of ALS risk SNPs (22 SNPs). This region lies within intron 2 of KANK1 and consists of independently annotated ENSEMBL regulatory features, including an enhancer element (ENSR00000873709) and a CTCF binding site (ENSR00000873710) (Fig. 5a). Overlap with independently annotated features supports the utility of RefMap to identify functional regulatory regions within noncoding DNA. We hypothesized that ALS-associated genetic variation within chr9:663,001-664,000 would reduce the expression of KANK1, leading to MN toxicity. Existing biological characterization of KANK1 is consistent with our hypothesis: KANK1 is expressed in motor neurons, functions in actin polymerization and deletion of this gene results in a severe developmental phenotype with MN loss42.
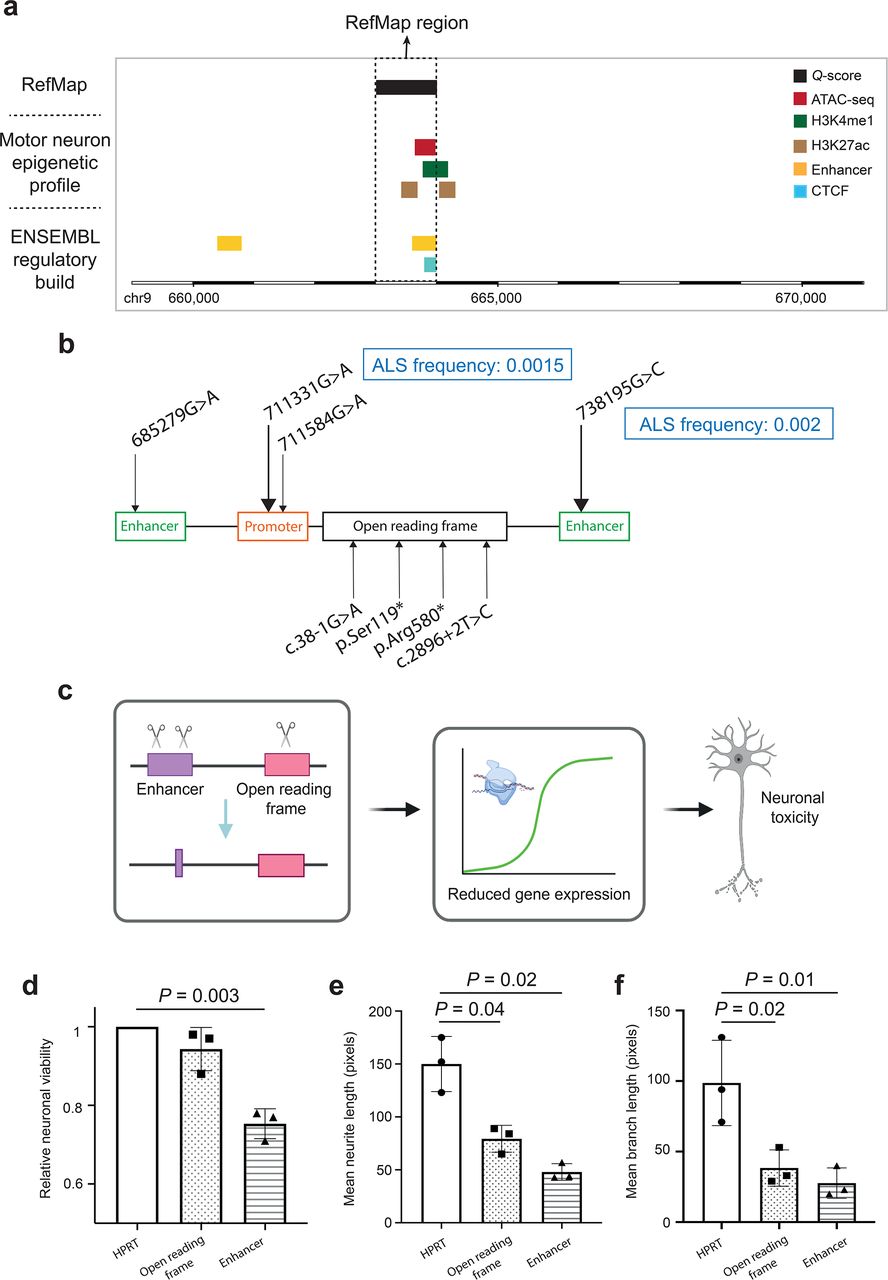
(a) We identified a high density of ALS-associated genetic variants within a region at chr9:663001-664000, which overlaps with the regulatory regions in iPSC-derived control motor neurons as well as in the ENSEMBL regulatory build. (b) Whole genome sequencing data from sporadic ALS patients (n=5,594) and neurologically normal controls (2,238) was analyzed to determine the frequency of rare deleterious variants within KANK1 coding and regulatory sequences. ALS-associated rare variants are shown. All variants were present in a single patient unless stated. No variant was found in a control individual. (c) To experimentally evaluate ALS-associated KANK1 variants, we performed CRISPR/Cas9 perturbation proximate to patient mutations in enhancer and coding regions within SH-SY5Y neurons, including resection of the chr9:663001-664000 region. Edited neurons revealed (d) reduced viability, (e) reduced axonal length and (f) reduced axonal-branch length compared to HPRT-edited controls. Data shown is mean and standard deviation. Neuronal viability was quantified relative to HPRT-edited controls.
If reduced expression of KANK1 is linked to MN toxicity, then it is reasonable to expect other loss-of-function (LoF) KANK1 mutations to be associated with an increased risk of ALS. Thus far RefMap has utilized common genetic variants from a GWAS study4 so, to further investigate KANK1, here we performed rare variant burden tests. Rare variant analysis utilized whole-genome sequencing (WGS) data from 5,594 sporadic ALS patients and 2,238 controls43. We filtered for rare, deleterious variants within KANK1 enhancer, promoter and coding regions based on evolutionary conservation, functional annotations and population frequency33,44–46 (Methods). Enhancer and promoter regions for KANK1 were defined as previously described8,47. Enhancer and promoter regions were independently enriched with ALS-associated rare deleterious variants (P<0.05, SKAT48,49; Fig. 5b), and nonsense coding variants were absent from controls and present in a small number (n=4) of ALS patients. Across all three regions, there was significant enrichment of rare deleterious variants in ALS patients compared to controls (P=0.003, Stouffer’s method50; Fig. 5b). The observation of both rare and common ALS-associated genetic variation in independent datasets utilizing independent methodology strongly suggests KANK1 is a new ALS risk gene.
KANK1 was located within a distinct module (M826, 687 genes; Supplementary Fig. 3b) in our network analysis, and this module is enriched with RefMap genes (P=5.6e-3, hypergeometric test), but not after multiple testing correction. Functionally the KANK1-module is highly expressed in normal MNs (Fig. 4f), and is enriched for biological functions centered on the distal axon and synapse (Supplementary Fig. 3c), which are consistent with other RefMap-enriched modules.
Experimental validation of KANK1 in ALS development
To further investigate the role of KANK1 in ALS, we experimentally determined the effect of ALS-associated genetic variation on gene expression and neuronal health (Fig. 5c). We used CRISPR/SpCas9 editing of SH-SY5Y neurons to recapitulate ALS-associated regulatory and coding mutations.
We discovered a high density of ALS-associated genetic variants within a region at chr9:663001-664000, which also contains an independently validated enhancer element (Fig. 5a). To replicate disruption of this sequence, we designed gRNAs to target protospacer adjacent motif (PAM) sites up- and downstream so as to delete the entire region51 (Methods). In addition, our rare variant analysis identified ALS-associated nonsense mutations in ALS cases but not in controls, therefore we also targeted a PAM site within KANK1 exon 2 so as to introduce a series of indels (Methods). Sanger sequencing and waveform decomposition analysis52 in undifferentiated SH-SY5Y cells confirmed the exon 2 editing efficiency (Supplementary Figs. 4a and 4b) and the deletion of the enhancer sequence (Supplementary Fig. 4c). For experimental evaluation, a commercially available control gRNA targeting HPRT served as a negative control. CRISPR/SpCas9-edited SH-SY5Y cells were differentiated to a neuronal phenotype, and successful differentiation was confirmed by altered expression of PAX6 (Supplementary Fig. 4dand53) and increased total dendritic length (P=0.046, paired Student’s t-test; Supplementary Fig. 4e and53). Differentiated cells were harvested and RNA was extracted for qPCR. We confirmed the reduced expression of KANK1 mRNA in both exon and enhancer edited neurons (Supplementary Fig. 4f). Furthermore, the reduction in KANK1 expression was associated with a trend towards reduced neuronal viability in exon edited cells, and with a significant reduction in neuronal viability in enhancer edited cells (exon: P=0.1, enhancer: P=0.003, paired Student’s t-test; Fig. 5d). Finally, neurons with reduced expression of KANK1 exhibited shorter neurites (exon: P=0.04, enhancer: P=0.02, paired Student’s t-test; Fig. 5e) with reduced branch length (exon: P=0.02, enhancer: P=0.01, paired Student’s t-test; Fig. 5f). In all instances, measures of neuronal toxicity are correlated with KANK1 expression (Supplementary Fig. 4f), which in turn reflects editing efficiency (Supplementary Figs. 4a–c). These experimental observations collectively demonstrate the neuronal toxicity focused on the axon caused by ALS-associated genetic variants in KANK1, and further support KANK1 as a new ALS risk gene.
DISCUSSION
Study of the genetic architectures of complex diseases has been greatly advanced by large GWAS studies. However, many of these studies have not considered cell-type-specific aspects of genomic function, which is particularly relevant for noncoding regulatory sequence10. This may explain why diseases such as ALS have been linked to relatively few risk genes despite substantial estimates of heritability2,3. Fine-mapping methods have been proposed to disentangle causal SNPs from genetic associations54–59, but these approaches are not integrated with cell-type-specific biology55,58, or assume a fixed number of causal SNPs per locus54,56,57, limiting their power for gene discovery. We have characterized epigenetic features within MNs, which are the key cell type for ALS pathogenesis. Integrating MN epigenetic features with ALS GWAS data in our RefMap model has discovered 690 ALS risk genes, which extends the list of candidate ALS genes by two orders of magnitude. Others have performed more limited epigenetic profiling of motor neurons60, but our data are unique with respect to the depth and number of assessments.
Consistent with previous literature, RefMap ALS genes are functionally associated with the distal axon15,16. Several known ALS risk genes are related to axonal function and axonal transport in particular61. Unlike previous literature, our work is based on a comprehensive genome-wide screening and not on a small number of rare variants. As a result, our data suggest that the distal axon may be the site of disease initiation in most ALS patients, and should be the focus of future translational research.
RefMap ALS genes include KANK1, which is enriched with common and rare ALS-associated genetic variation across multiple domains and datasets. KANK1 is functionally related to a number of known ALS genes that are important for cytoskeletal function, including PFN1, KIF5A and TUBA4A. In particular, PFN1, like KANK1, is implicated in actin polymerization62. Disruption of actin polymerization has been associated with alterations in synaptic organization63, including the neuromuscular junction (NMJ)64, but also with nucleocytoplasmic transport defects65. We have experimentally verified the link between variants identified by RefMap to ALS, and KANK1 expression. Moreover, we have demonstrated that the reduced expression of KANK1 in a human CNS-relevant neuron is toxic and produces axonopathy. By contrast, KANK1 upregulation could be a new therapeutic target for ALS patients with mutations that reduce KANK1 expression, and possibly more broadly.
In summary, our study provides a general framework for the identification of risk genes involved in complex diseases. With the expansion of genotyping data and increasing understanding of cell-type-specific functions, it should prove valuable to the identification of the genetic underpinnings of many such diseases.
SUPPLEMENTARY INFORMATION

(a) are morphologically consistent with lower motor neurons including expression of appropriate markers. (b) iPSC cells were derived from control fibroblasts.

for clusters (a) C1 and (b) C2. The correlations of Δβ for individual genes and the mean of the cluster were calculated. The comparisons were performed using the Wilcoxon rank-sum test. Significantly increased between-cluster distance and significantly decreased in-cluster distance were observed, demonstrating the high quality of the clustering.

(a) Distribution of modularities after Louvain for the smoothed PPI network (red) and 100 randomized networks (blue). The modularity of our smoothed network is significantly shifted from the randomized network. (b) M826 contains KANK1. M826 is enriched with RefMap genes (P=5.6e-3, hypergeometric test) but not after multiple testing correction. (c) M826 is functionally enriched for vesicle transport within the motor neuron axon. GOBP=Gene Ontology Biological Process. Dashed line represents P=0.05.

(a) Sanger sequencing traces demonstrating spCas9 cut site adjacent to PAM and subsequent waveform decomposition in KANK1 open reading frame edited cells. (b) Indel distribution within KANK1 open reading frame CRISPR-edited SH-SY5Y cells. (c) PCR amplification of the relevant genomic segment in enhancer CRISPR-edited SH-SY5Y cells reveals that the chr9:663001-664000 region has been resected compared to HPRT-edited control cells. (d) Altered PAX6 expression and (e) increased dendrite length confirm the successful neuronal differentiation of SH-SY5Y cells. (f) pPCR reveals that the expression of KANK1 mRNA was reduced in CRISPR-edited SH-SY5Y neurons.
Supplementary Tables 1
Quality control measures for RNA-seq of iPSC-derived motor neurons
Supplementary Tables 2
Quality control measures for ATAC-seq of iPSC-derived motor neurons
Supplementary Tables 3
Quality control measures for histone ChIP-seq of iPSC-derived motor neurons
Supplementary Tables 4
Quality control measures for Hi-C of iPSC-derived motor neurons
Supplementary Table 5
ALS-associated regions identified by RefMap including Q-scores
Supplementary Table 6
690 ALS-associated genes identified by RefMap
Supplementary Table 7
Manually curated ALS gene list with evidence for association including references
Supplementary Table 8
Clusters of RefMap homologs in transcriptome data from SOD1-G93A ALS mouse model
Supplementary Table 9
Smoothed PPI network after preserving top 5% edges predicted by random walk with restart
Supplementary Table 10
Gene modules detected from network analysis
Supplementary Table 11
Project MinE ALS Sequencing Consortium
Supplementary Notes
Mathematical and technical details of RefMap
AUTHOR CONTRIBUTIONS
S.Z., J.C.K. and M.P.S. conceived and designed the study. S.Z. contributed to the design, theoretical analysis and implementation of RefMap. S.Z., J.C.K., A.K.W., M.S., T.M., C.H., H.G.N., J.F., C.S.S., L.F., P.J.S. and M.P.S. were responsible for data acquisition. S.Z., J.C.K., A.K.W., M.S., T.M., C.H., H.G.N., J.F., C.S.S., C.W., J.L., C.E., E.H., L.F., P.J.S. and M.P.S. were responsible for analysis of data. S.Z., J.C.K., A.K.W., M.S., T.M., C.H., H.G.N., J.F., C.S.S., C.W., J.L., C.E., E.H., K.P.K., J.V., L.F., P.J.S. and M.P.S. were responsible for interpretation of data. The Project MinE ALS Sequencing Consortium (Supplementary Table 11) was involved in data acquisition and analysis. S.Z., J.C.K. and M.P.S. prepared the manuscript with assistance from all authors. All authors meet the four ICMJE authorship criteria, and were responsible for revising the manuscript, approving the final version for publication, and for accuracy and integrity of the work.
DECLARATION OF INTERESTS
M.P.S. is a cofounder of Personalis, Qbio, Sensomics, Filtricine, Mirvie and January. He is on the scientific advisory of these companies and Genapsys. No other authors have competing interests.
METHODS
Study cohorts
iPSC-cells were derived from fibroblasts obtained from three neurologically normal controls of different ages: 55-year old male, a 52-year old female and a 6-year old male (Supplementary Fig. 1b). GWAS summary statistics were previously published4. The 6,180 patients and 2,370 controls included in this study were recruited at specialized neuromuscular centers in the UK, Belgium, Germany, Ireland, Italy, Spain, Turkey, the United States and the Netherlands43. Patients were diagnosed with possible, probable or definite ALS according to the 1994 El-Escorial criteria66. All controls were free of neuromuscular diseases and matched for age, sex and geographical location.
Cell culture
Human induced pluripotent stem cells iPSCs were maintained in Matrigel-coated plates (Corning®, Cat.: #356230) according to the manufacturer’s recommendations in complete mTeSR™-Plus™ Medium (StemCell Technologies, Cat.: #05825). The culture medium was replaced daily and confirmed mycoplasma free. Cells were passaged every four to six days as clumps using ReLeSR™ an enzyme-free reagent for dissociation (StemCell Technologies, Cat.: #05872) according to the manufacturer’s recommendations. For all the experiments in this study, iPSCs were between passage 20 and 32.
iPSC-derived motor neuron differentiation
iPSCs derived from unaffected controls were differentiated to motor neurons using the modified version of the dual SMAD inhibition protocol67. Briefly iPCS cells were transferred for Matrigel-coated plate (Corning® Matrigel® Growth Factor Reduced). On the day after plating (day 1), after the cells had reached ~100% confluence, the cells were washed once with PBS and then the medium was replaced for neural medium (50% of KnockOut™ DMEM/F-12 Cat.: #12660012, 50% of Neurobasal ThermoFisher Cat.: #12660012), 0.5× N2 supplement (ThermoFisher, Cat.: #17502001), 1x Gibco® GlutaMAX™ Supplement (ThermoFisher, Cat.: #35050061), 0.5x B-27 (ThermoFisher, Cat.: #17504001), 50 U ml−1 penicillin and 50 mg ml−1 streptomycin, supplemented with SMAD inhibitors (DMH-1 2 μM Tocris, Cat.: #4423; SB431542-10 μM Tocris, Cat.: #1614 and CHIR99021 3 μM, CHIR Tocris, Cat.: #4423).
The medium was changed every day for 6 days, on day 7, the medium was replaced for neural medium supplemented with DMH-1 2 μM, SB431542-10 μM and CHIR 1 μM, All-Trans Retinoic Acid 0.1 μM (RA, STEMCELL Technologies, Cat.: #72262), and Purmorphamine 0.5 μM (PMN, Tocris, Cat.: #4551), the cells were kept in this medium until day 12 when is possible to see a uniform neuroepithelial sheet, the cells were split 1:6 with Accutase (StemPro® Accutase® Cell Dissociation Reagent, Gibco™ A1110501), onto matrigel substrate in the presence of 10 μM of rock inhibitor (Y-27632 dihydrochloride, Tocris), giving rise to a sheet of neural progenitor cells (NPC). After 24 hours of incubation the medium was changed for neural medium supplemented with RA 0.5 μM and PMN 0.1 μM, the medium was changed every day for more 6 days. On day 19 the motor neuron progenitors were split with accutase onto to matrigel-coated plates and the medium was replaced for neural medium supplemented with RA 0.5 μM, PMN 0.1 μM, compound E 0.1 μM (Cpd E, Tocris, Cat.: #6476), BDNF 10ng/mL (ThermoFisher, Cat.: #PHC7074), CNTF 10ng/mL (ThermoFisher, Cat.: #PHC7015) and IGF 10ng/mL (ThermoFisher, Cat.: #PHG0078) until day 28. On day 29, the media was replaced for Neuronal media (Neurobasal media supplemented with 1% of B27, BDNF 10ng/mL, CNTF 10ng/mL and IGF 10ng/mL). The cells were then fed alternate days with neuronal medium until day 40.
ATAC-seq
50,000 viable motor neurons were spun down at 500 RCF at 4°C for 5 min. Supernatant was discarded. 50 μl cold ATAC Resuspension Buffer (RSB) (10 mM Tris-HCl pH 7.4, 10 mM NaCl, 3 mM MgCl2, sterile H2O) containing 0.1% NP40, 0.1% Tween-20, and 0.01% Digitonin was added and carefully mixed. Tubes were incubated on ice for 3 min. 1 ml of cold ATAC-RSB containing 0.1% Tween-20 was added and the tubes were inverted three times. Nuclei were spun down at 500 RCF for 10 min at 4°C. Supernatant was aspirated. Cell pellet was resuspended in 50 μl of transposition mix (25 μl 2x TD buffer, 2.5μl transposase (100 nM final), 16.5 μl PBS, 0.5 μl 1% digitonin, 0.5 μl 10% Tween-20, 5 μl H2O) by pipetting up and down 6 times. TD buffer consists of 20 mM Tris-HCl pH 7.6, 10 mM MgCl2, 20% DMF, sterile H2O. pH was adjusted with acetic acid before adding DMF. The reaction was incubated at 37°C for 30 minutes in a thermomixer while shaking at 1000 RPM. Reaction was cleaned up with a Qiagen MiElute kit. DNA was eluted in 20 μL elution buffer. DNA was amplified using the NEBNext 2xMasterMix (M0541). Cycling conditions: 5 min at 72°C, 30 sec at 98°C, followed by 5 cycles of 10 sec at 98°C, 30 sec at 63°C and 1 min at 72°C, hold at 4°C. 5μl (10% of the pre-amplified mixture) were used for qPCR to determine the number of additional cycles needed (3.76 μL H2O, 0.5 μL 25 μM Primer1, 0.5 μL 25 μM Primer2, μL 25x SYBR Green, 5 μL NEBNext MasterMix). Cycling conditions: 30 sec at 98°C, followed by 20 cycles of 10 sec at 98°C, 30 sec at 63°C and 1 min at 72°C, hold at 4°C. Amplification profiles were assessed as previously described18. The remainder of the pre-amplified DNA (45μL) was used to run the required number of additional cycles. The final PCR reaction was cleaned up using Qiagen MinElute kit and eluted in 20 μl H2O. Libraries were quantified with the KAPA Library Quantification kit (Roche) and sequenced on a NovaSeq 6000 system (Illumina). Raw data were processed with the ENCODE 4 pipeline for ATAC-seq according to ENCODE 4 standards (https://www.encodeproject.org/atac-seq/). All samples exceeded ENCODE 4 standards for % mapped reads, enrichment of transcription start sites, the fraction of reads that fall within peak regions (FRiP), and reproducibility between technical replicates (Supplementary Table 1).
Files are available at encodeproject.org with the following accession numbers: ENCSR065CER, ENCSR410DWV, ENCSR812ZKP, ENCSR634WYX, ENCSR459PVP, ENCSR913OWV, ENCSR704VZY, ENCSR131HOY, ENCSR516YAD, ENCSR709QRD.
Histone ChIP-seq
5 million motor neurons were crosslinked and resuspended in 10 mL of cold L1 buffer (50mM Hepes KOH, pH 7.5, 140mM NaCl, 1mM EDTA, 10% Glycerol, 0.5% NP-40, % Triton X-100, dH2O, 1 protease inhibitor tablet (Roche Complete cat #1 697 498) per 50ml buffer). Cells were incubated on a rocking platform at 4°C for 10 minutes and spun down at 3000 rpm at 4°C for 10 minutes. Pellets were resuspended in 10 mL of L2 buffer (200mM NaCl 1mM EDTA pH 8 0.5mM EGTA 10mM Tris, pH 8, dH2O, 1 protease inhibitor tablet (Roche Complete cat #1 697 498) per 50ml buffer, room temperature). Tubes were incubated at room temperature for 10 minutes and spun down at 3000 rpm for 10 minutes at 4°C. Nuclei were resuspended in 3 mL 1X RIPA buffer and incubated on ice for 30 minutes. Samples were sonicated with Branson 250 Sonifier to shear the chromatin. 3 mL of sheared chromatin lysate were transferred to two 2 mL tubes and spun down at 14,000 rpm at 4°C for 15 minutes. 50 μL were saved from each replicate and pooled as input (no antibody added, kept at −20°C). 2 μL histone modification antibody was added to each 3 mL lysates and incubated at 4°C on a neutator for 12-16 hours. The following antibodies were used: H3K4me1 (#5326S, lot 3, Cell Signaling Technologies), H3K4me3 (#9751S, lot 10, Cell signaling technologies), H3K27ac (#93133, lot 28518012, ActiveMotif). 80 μL of Protein A/G-agarose for each sample were washed twice with 1 mL of ice cold 1X RIPA buffer, spun down at 5000 rpm for 1 minute at 4°C and resuspended in 80μL in 1x RIPA buffer. Beads were added to tubes containing Ag-Ab complex (80 μ L 1X RIPA to wash out the beads) and incubated for 1 hour at 4°C with neutator rocking. Tubes were spun down at 1500 rpm for 3 minutes, beads were washed 3 times 15 minutes each with 10 mL of fresh, ice cold 1x RIPA buffer supplemented per 50 mL with 1 protease inhibitor tablet, 250 μL of 100 mM PMSF, 50 μL of 1M DTT, 2 ml of phosphatase inhibitor (sodium pyrophosphate 1mM, sodium orthovanadate 2mM, sodium fluoride 10mM). Afterwards, beads were washed once with ice cold 1 × PBS for 15 minutes. Beads were resuspended in 1200 μL ice cold 1x PBS, transferred to an 1.5mL Eppendorf tube and spun down at 5000 rpm for 1 minute. PBS was removed and 100 μL of Elute 1 solution (1% SDS, 1x TE, dH2O) was added to resuspend beads and tubes were incubated at 65°C for 10 minutes with gentle mixing every 2 minutes. Beads were spun down at 5000 rpm for 1 minute at room temperature and the supernatant was kept as Elute 1. 150 μL of Elute 2 solution (0.67% SDS, 1x TE) was added to the bead pellets and incubated at 65°C for 10 minutes with gentle vortexing. After spinning down for 1 minute at 5000 rpm, the second elute was combined with the first. Input DNA was thawed and 150 μL of Elute 1 solution was added. All samples incubated at 65°C overnight to reverse cross-linking. 250 μL 1X TE containing 100 μg RNase was added to each sample and incubated for 30 minutes at 37°C. 5 μL of 20 mg/mL Proteinase K was added to each sample and incubated at 45°C for 30 minutes. After transferring samples to 15 mL tubes, DNA was purified (PCR purification kit, Quiagen). DNA was eluted in elution buffer (50μL for input, 35μL for ChIP sample).
The following components were combined and mixed in a microfuge tube: ChIP DNA to be end-repaired (25ng) 34 μL, 5 μL 10X End-Repair Buffer, 5 μL 2.5 mM dNTP Mix, 5 μL10 mM ATP, 1 μL End-Repair Enzyme Mix. The mixture was incubated at room temperature for 45 minutes. DNA was purified (MinElute PCR purification kit, Quiagen) and eluted in 19 μL EB. Adapter ligated DNA was run on a 2% EX-Gel and excised in the range of 450-650 bp with a clean scalpel. DNA was purified (Gel extraction kit, Quiagen) and eluted in 20 μL EB. The following components were mixed in a PCR tube: 20 μL of purified DNA, 25 μL KAPA HiFi HotStart ReadyMix (2X), 5 μL KAPA Library Amplification Primer Mix (10X). DNA was amplified with the following conditions: 45 sec at 98°C, 15x [15 sec at 98°C, 30 sec at 60°C, 30 sec at 72°C], 60 sec at 72°C, hold at 4°C. The PCR product was purified (MinElute PCR purification kit, Quiagen) and eluted in 19 μL EB. DNA was run on a 2% EX-Gel and excised in the range of 300-450 bp (or brightest smear) with a clean scalpel. DNA was purified (Gel extraction kit, Quiagen) and eluted in 12 μL EB. Library concentration was measured using Qubit and each library was run on the Bioanalyzer. Equal concentrations of different barcoded libraries were pooled and sequenced on a NovaSeq 6000 system (Illumina). Raw data were processed with the ENCODE 4 pipeline for Histone ChIP-seq according to ENCODE 4 standards (https://www.encodeproject.org/chip-seq/histone/). All samples exceeded ENCODE standards for % mapped reads, the fraction of reads that fall within peak regions (FRiP), and reproducibility between technical replicates (Supplementary Table 2)
Files are available at encodeproject.org with the following accession numbers: ENCSR754DRC, ENCSR672RKZ, ENCSR571HAY, ENCSR503HWR, ENCSR207VLY, ENCSR962OTG, ENCSR745TRI, ENCSR595HWK, ENCSR312HLG, ENCSR682BFG, ENCSR680IWU, ENCSR564EFE, ENCSR358AOC, ENCSR698HPK, ENCSR778FKK, ENCSR425FUS, ENCSR489LNU, ENCSR540KQC
Hi-C
We generated Hi-C libraries following the protocol previously described68,69. In brief, 2-5 million cells were crosslinked with formaldehyde. Nuclei were permeabilized and DNA was digested with 100U of MboI. DNA fragments were labelled with biotinylated nucleotides. Ligated DNA was purified and sheared to a length of 300-500 bp after reverse cross-linking. Ligation junctions were pulled-down with magnetic streptavidin beads. Libraries were amplified by PCR and purified. Library concentrations were measured (Qubit). Hi-C libraries were paired-end sequenced on a NovaSeq 6000 system (Illumina). Raw data were processed with the ENCODE 4 pipeline for Hi-C according to ENCODE 4 standards (https://www.encodeproject.org/documents/75926e4b-77aa-4959-8ca7-87efcba39d79/).
RNA-seq
RNA libraries were prepared by first depleting ribosomal RNA using the Illumina Ribo-Zero rRNA depletion kit. Strand-specific libraries were then prepared using NEBext Ultra RNA prep kit. RNAseq libraries were paired-end sequences on a NovaSeq 6000 system (Illumina). Minimum 80 million reads were obtained per sample. The raw Fastq files were trimmed for the presence of Illumina adapter sequences using Cutadapt v1.2.170. The reads were further trimmed using Sickle v1.200 (https://github.com/najoshi/sickle) with a minimum window quality score of 20. Reads shorter than 15 bp after trimming were removed. If only one of a read pair passed this filter, it was included in the R0 file. Reads were aligned to hg19 transcripts (n=180,253) using Kallisto v0.46.071.
Model design and inference of RefMap
In this study, allele Z-scores were calculated as Z=b/se, where b and se are effect size and standard error, respectively, and they were estimated from a mixed linear model in the ALS GWAS study4,5. Given allele Z-scores and the epigenetic profiling of iPSC-derived motor neurons, we were interested in predicting causal associations of individual genomic regions with ALS risk. Suppose we have K 1Mb LD blocks with non-zero alleles, whose approximate between-block independence has been verified in previous literature23. Also suppose each LD block contains Jk(k=1, …, K) 1kb regions and each region harbors Ij,k(j=1, …, Jk, Ij,k>0) SNPs. We further denote the Z-score for the i-th SNP in the j-th region of the k-th block as zi,j,k (i=1, …, Ij,k). Under a linearity hypothesis, we can prove that zk follows a multivariate normal distribution (Supplementary Notes), i.e.,
 in which uk are the effect sizes of individual SNPs that can be expressed as

Moreover, in Eq. (1)  represents the in-sample LD matrix comprising of the pairwise Pearson correlation coefficients between SNPs within the k-th block, where Ik is the total number of SNPs given by
  . Here, since we have no access to the individual genotypes, we used EUR samples from the 1000 Genomes Project to estimate ∑k (i.e., out-sample LD matrix).
Here, the latent variables uk can be treated as the disentangled Z-scores from LD confounding, leaving the right place for independence assumption and facilitating downstream modelling. Indeed, we assume ui,j,k (i=1, …, Ij,k) are independent and identically distributed (i.i.d.), following a normal distribution given by
 where the precision λj,k follows a Gamma distribution, i.e.,

Moreover, to characterize the shift of the expectation in Eq. (3) from the background due to its functional effect, we model mj,k by a three-component Gaussian mixture model, i.e.,
 where the precisions follow
 and v−1 and v+1 are non-negative variables quantifying the absolute values of effect size shifts for the negative and positive components, respectively.
To impose non-negativity over v−1 and v+1, here we employ the rectification nonlinearity technique proposed in72. In particular, we assume v−1 and v+1 follow

 in which the rectified Gaussian distribution is defined via a dumb variable. Specifically, we first define v−1 and v+1 by

 which guarantee that v−1 and v+1 are non-negative. The dump variable r−1 and r+1 follow Gaussian distributions given by

 where and m± and λ± follow the Gaussian-Gamma distributions, i.e.,


The indicator variables in Eq. (5) denote whether that region is ALS-associated or not. Indeed, we define the region to be disease-associated if  or
or  , and to be non-associated otherwise. To simplify the analysis, we put a symmetry over and
  , and
, and  define the distribution by

Furthermore, the probability parameter πj,k in Eq. (15) is given by
 where σ(·) is the sigmoid function, sj,k is the vector of epigenetic features for the j-th region in the k-th LD block, and the weight vector w follows a multivariate normal distribution, i.e.,
 and Λ follows

In our study, the epigenetic features sj,k were calculated as the overlapping ratios of that region with the narrow peaks of ATAC-seq and histone ChIP-seq, respectively.
Based on Eqs. (1) to (18), we are interested in calculating p(T | Z, S) wherein the calculation of integrals is intractable. Here we seek for approximate inference based on the mean-field variational inference (MFVI)73. To reduce false positives, we reduce false positives, we set a hard threshold for  with respect to the ATAC-seq signal, where we set
  if the corresponding region overlaps no ATAC-seq peak. This was motivated by our particular interest in active regions. More technical details, including a coordinate ascent-based inference algorithm, were provided in Supplementary Notes.
In this study, we ran the inference algorithm per chromosome to accelerate the computation. The Q+− and Q−-scores were defined as q(t( +1) = 1) = 1 and q(t( −1) = 1) = 1, respectively, and we also defined the Q-score as Q=Q++Q−. To prioritize RefMap-scored regions, we set a cutoff of 0.95 and defined those regions with either Q+− or Q−-score larger than the cutoff as significant regions (i.e., ALS-associated regions) (Supplementary Table 5).
Code relevant to RefMap is available on request.
Target gene identification
After identifying ALS-associated regions based on RefMap, we mapped those active regions to their target genes for a better understanding of their functions. In particular, we performed such mapping according to to two principles: (i) assign to a gene if the region overlaps the gene or the region up to 10kb either side of the gene body; (ii) assign to a gene if the region overlaps a loop anchor harboring the transcription start site (TSS) of that gene. The loops were called from the Hi-C data sequenced from the iPSC-derived MNs. Note the only transcripts with TPM>=1 were kept for downstream analysis.
Network analysis
We first downloaded the human PPIs from STRING v11, including 19,567 proteins and 11,759,455 protein interactions. To eliminate the bias caused by hub proteins, we first carried out the random walk with restart algorithm74 over the PPI network, wherein the restart probability was set to 0.5, resulting in a smoothed network after preserving the top 5% predicted edges. To decompose the network into different subnetworks/modules, we performed the widely-used Louvain algorithm75, a classic community detection algorithm that searches for densely connected modules by optimizing the modularity. After the algorithm converged, we obtained 912 modules with an average size of 18.39 nodes (Supplementary Table 10). Two modules (M421 and M604) were significantly enriched (FDR<0.1) with our RefMap genes based on the hypergeometric test followed by the BH correction (Supplementary Table 10).
To test whether the network modularity could be observed by chance, we randomly shuffled the edges of the network while preserving the number of neighbors for each node76. We generated 100 such randomized networks followed by the Louvain decomposition, against which the modularity of the smoothed PPI network was tested.
Rare variant burden tests
ALS features a polygenic rare variant architecture4, therefore, all searches for pathogenic variants in enhancer and coding regions featured a filter for MAF within the Genome Aggregation Database (gnomAD) of <1/100 control alleles34. Additional filtering varied reflecting differences in function between enhancer, promoter and coding sequence. In enhancer regions, variants were included only if evolutionary conserved based on a LINSIGHT score >0.844. We also utilized an independently compiled score for ALS-associated regulatory variation77: variants were excluded with a DIVAN score <0.5. In promoter regions, we utilized two independent scores for functionality and pathogenicity: variants were included in burden testing if their CADD45 score >25 and GWAVA46 score >0.5. In coding regions, we filtered for variants with impact on protein function as defined by snpeff78: variants annotated HIGH/MODERATE/LOW impact were included, but we excluded variants annotated ‘synonymous’ or ‘TF_binding_site_variant’ because these functions are independent of amino acid sequence.
The optimal unified test (SKAT-O) was used to perform burden testing in enhancer and promoter regions because it is optimized for large numbers of samples and for regions where a significant number of variants may not be causal49. SKAT tests upweight significance of rare variants according to a beta density function of MAF in which wj = Beta(pj, a1, a2), where pj is the estimated MAF for SNPj using all cases and controls, parameters a1 and a2 are prespecified, and a2=2500 was chosen for all statistical tests. To adjust for confounders including population structure, burden testing used the first ten eigenvectors generated by principal components analysis of common variant profiles, sequencing platform and sex as covariates.
CRISPR/Cas9 editing of SH-SY5Y cells
Guide RNAs (gRNAs) were designed using the Crispor tool (http://crispor.tefor.net/) to target KANK1 regulatory and coding regions. Design was guided by proximity to patient enhancer mutation sites, available protospacer adjacent motifs (PAM), and predicted on- and off-target efficiencies. gRNAs targeting within 30bp either side of the patient enhancer mutation site (chr9:663,001-664,000, hg19) were considered and screened for editing efficiency. One pair of guide sequences (5’-UCAUGGGAACUCUUCAAAUA-3’ and 5’-UCAUGGGAACUCUUCAAAUA-3’) was most efficient and chosen for subsequent experimentation. Validated, commercially available CRISPR control targeting HPRT (IDT) and KANK1 exon-targeting (ThermoFisher Scientific, 5’-GUCUAGUUGAUAACCAUAGG-3’) gRNAs were also obtained. gRNA duplexes were assembled from tracrRNA and crRNA in a thermocycler according to manufacturer’s instructions under RNAse-free conditions. Cells were cultured to ensure 70-90% confluency on the day of transfection. 1ml antibiotic-free DMEM (Lonza) was prepared and incubated in 24-well plates at 37°C. CRISPR/Cas9 Ribonucleoproteins were formed by complexing 240ng gRNA duplex with 1250ng Alt-R V3 Cas9 Protein (IDT) in 10μL buffer R (from 10μL Neon transfection kit, ThermoFisher Scientific) - a 1:1 molar ratio - for 10 minutes. 100,000 viable cells were aliquoted per transfection and centrifuged at 400 × g for 4 minutes. Cells were washed in calcium- and magnesium-free Dulbecco’s Phosphate Buffered Saline (Sigma) and centrifuged at 400 × g for 4 minutes. Cell pellets were resuspended in 10μL buffer R containing Cas9 protein and gRNA duplexes. 2μL of 10.8μM electroporation enhancer (IDT) was added and the solution mixed thoroughly to ensure a suspension of single cells. 10μL of this mixture was loaded into a Neon transfection system (ThermoFisher Scientific) and electroporated according to manufacturer’s instructions (1200V, 3 pulse, 20s pulse width for SH-SY5Y cells). Cells were then transferred to pre-warmed media in 24-well plates.
Determining CRISPR editing efficiency
Genomic DNA was isolated from CRISPR-edited and control cells using a GenElute Mammalian DNA Miniprep Kit (Sigma) according to manufacturer’s instructions. A ~400bp region around the expected cas9 cut site was amplified by polymerase chain reaction using VeriFi mix (PCRbio). Expected amplification was confirmed using gel electrophoresis, and the products were Sanger-sequenced. Sequencing trace files were uploaded to ICE (https://ice.synthego.com) and an indel efficiency calculated.
Quantitative PCR (RT-PCR)
Cells were cultured until at least 70% confluent, lysed on ice using an appropriate volume of Tri Reagent (Sigma) for 5 minutes and transferred to 1.5ml RNAse-free tubes. Total RNA was extracted using a Direct-zol RNA Miniprep Kit (Zymo) according to manufacturer’s instructions, and RNA concentration confirmed using a NanoDrop spectrophotometer (ThermoFisher Scientific). 2μg of total RNA was then converted to cDNA by adding 1μL 10mM dNTPs, 1μL 40μM random hexamer primer (ThermoFisher Scientific), and DNAse/RNAse-free water to a total volume of 14μL. This mixture was heated for 5 minutes at 70°C then placed on ice for 5 minutes. 4μL of 5x FS buffer, 2μL 0.1M DTT, and 1μL M-MLV reverse transcriptase (ThermoFisher Scientific) were then added and cDNA conversion performed in a PCR thermocycler (37°C for 50 minutes, 70°C for 10 minutes). cDNA was amplified using RT-PCR with Brilliant III SYBR Green (Agilent) as per manufacturer’s instructions. Ct analysis was performed using CFX Maestro software (BioRad). GAPDH was chosen as a reference gene because expression is relatively stable in SH-SY5Y cells79. Relative mRNA expression values were then calculated using the 2−ΔΔCT method80.
SH-SY5Y neuronal differentiation and assessment of neurite length
Human SH-SY5Y neuroblastoma cells were seeded at densities of either 5×10⁴ cells per well of a 6-well culture plate, or 2×10³ cells per well of a 96-well culture plate in DMEM (Lonza) supplemented with 10% (v/v) FBS, 50 units/mL penicillin and 50 μg/mL of streptomycin. 24 hours after seeding the media was changed to DMEM supplemented with 5% (v/v) FBS, 50 units/mL penicillin, 50 μg/mL of streptomycin, 4mM l-glutamine and 10μM retinoic acid. After 72 hours, the medium was switched to neurobasal media (ThermoFisher Scientific) containing 1% (v/v) N-2 supplement 100x, 50 units/mL penicillin, 50 μg/mL of streptomycin, 1% l-glutamine and 50ng/mL human BDNF. Cells were cultured for an additional 3 days until fully differentiated.
To confirm neuronal differentiation and to assess for changes consistent with axonopathy, semi-automated analysis of neurite length was performed using the SimpleNeuriteTracer plugin for FIJI81. 2D images were converted to 8-bit grayscale and successive points along the midline of a neural process were selected. The software automatically identified the path between the two points. Tracing accuracy was improved using Hessian-based analysis of image curvatures. The AnalyzeSkeleton plugin82 was used to quantify the morphology of the traces including the length of neurites. In the case of joined neurites the shorter path length was assigned to ‘branches’. To determine whether observed changes in neurite length are significant three fields of view were analyzed and differences were assessed by a t-test, where a one-tailed test was chosen based on the hypothesis that ALS-associated mutations would reduce neurite length.
Immunocytochemistry
SH-SY5Y cells were fixed with 4% paraformaldehyde for 15 minutes and washed 3x with PBS. Cells were blocked in 5% normal horse serum containing 0.1% Triton X-100 for 1 hour at RT. All primary antibodies were diluted in blocking solution (α-tubulin, 1:2000; anti-Pax6, 1:200). Cells were incubated in the primary antibody for 2 hours at RT and washed 3x in PBS before incubation in the appropriate secondary antibody (1:1000 in PBS) for 1 hour at RT. Nuclear counterstain (Hoechst 33342) was applied for 10 minutes followed by a 3x wash in PBS. Cells were imaged using an Opera Phenix High Content Screening System (PerkinElmer).
MTT assays
A colorimetric assay using 3-(4, 5-dimethylthiazol-2-yl)-2, 5-diphenyltetrazolium bromide (MTT) dye was used to assess neuronally differentiated SH-SY5Y cellular metabolic activity and hence neuronal viability. 55 μL of 5mg/mL of MTT reagent in PBS was added per well of a 24-well culture plate and incubated at 37°C for 1 hour. 550 μL of un-precipitated 20% SDS in 50% di-methyl formamide (DMF) + dH2O (pH 7.4) was added per well and mixed thoroughly to lyse the cells. Cells were incubated in a dark environment on an orbital shaker for 1 hour. The colorimetric change was measured using a PHERAstar FS spectrophotometer (BMG Biotech), and absorbance readings taken at 590nm were normalized to media-only wells. Mean absorbance readings were calculated for each biological repeat and expressed as a percentage of controls.
ACKNOWLEDGEMENTS
This work used the Genome Sequencing Service Center by Stanford Center for Genomics and Personalized Medicine Sequencing Center, supported by the grant award NIH S10OD025212, and NIH/NIDDK P30DK116074. We acknowledge the Stanford Genetics Bioinformatics Service Center for providing computational infrastructure for this study. We thank W. Rheenen for the explanation of ALS GWAS data. We thank J. Adrian for the help to initiate the project. We also thank J. Zhai and X. Yang for the help with histone ChIP-seq assays, and I. Gabdank and M. Kagda for running the Hi-C pipeline. This project has received funding from the European Research Council (ERC) under the European Union’s Horizon 2020 research and innovation programme (grant agreement n° 772376 - EScORIAL. The collaboration project is co-funded by the PPP Allowance made available by Health~Holland, Top Sector Life Sciences & Health, to stimulate public-private partnerships. This study was also supported by the ALS Foundation Netherlands, by research grants from IWT (n° 140935), the ALS Liga België, the National Lottery of Belgium, the KU Leuven Opening the Future Fund, the National Institutes of Health (CEGS 5P50HG00773504, 1P50HL083800, 1R01HL101388, 1R01-HL122939, S10OD025212, and P30DK116074, UM1HG009442 to M.P.S.), the Wellcome Trust (216596/Z/19/Z to J.C.K.) and NIHR (P.J.S.). We acknowledge support from a Kingsland fellowship (T.M.), the My Name’5 Doddie Foundation (J.F.), and the NIHR Sheffield Biomedical Research Centre for Translational Neuroscience. Biosample collection was supported by the MND Association and the Wellcome Trust (P.J.S.). We are very grateful to those ALS patients and control subjects who generously donated biosamples. We acknowledge transcriptome data provided by the AnswerALS Consortium.
REFERENCES
- 1.↵
- 2.↵
- 3.↵
- 4.↵
- 5.↵
- 6.↵
- 7.↵
- 8.↵
- 9.↵
- 10.↵
- 11.↵
- 12.↵
- 13.↵
- 14.↵
- 15.↵
- 16.↵
- 17.↵
- 18.↵
- 19.↵
- 20.↵
- 21.↵
- 22.↵
- 23.↵
- 24.↵
- 25.↵
- 26.↵
- 27.↵
- 28.↵
- 29.↵
- 30.↵
- 31.↵
- 32.↵
- 33.↵
- 34.↵
- 35.↵
- 36.↵
- 37.↵
- 38.↵
- 39.↵
- 40.↵
- 41.↵
- 42.↵
- 43.↵
- 44.↵
- 45.↵
- 46.↵
- 47.↵
- 48.↵
- 49.↵
- 50.↵
- 51.↵
- 52.↵
- 53.↵
- 54.↵
- 55.↵
- 56.↵
- 57.↵
- 58.↵
- 59.↵
- 60.↵
- 61.↵
- 62.↵
- 63.↵
- 64.↵
- 65.↵
- 66.↵
- 67.↵
- 68.↵
- 69.↵
- 70.↵
- 71.↵
- 72.↵
- 73.↵
- 74.↵
- 75.↵
- 76.↵
- 77.↵
- 78.↵
- 79.↵
- 80.↵
- 81.↵
- 82.↵


