

Summary
ER+ breast cancer exhibits a strong bone-tropism in metastasis. How the bone microenvironment impacts the ER signaling and endocrine therapies remains poorly understood. Here, we discover that the osteogenic niche transiently and reversibly reduces ER expression and activities specifically in bone micrometastases (BMMs), leading to endocrine resistance. As BMMs progress, the ER reduction and endocrine resistance may partially recover in cancer cells away from the osteogenic niche, creating phenotypic heterogeneity in macrometases. Using multiple approaches including an evolving barcoding strategy, we demonstrated that this process is independent of clonal selection, and represents an EZH2-mediated epigenomic reprogramming. EZH2 drives ER+ BMMs toward a basal and stem-like state. EZH2 inhibition reverses endocrine resistance. These data exemplify how epigenomic adaptation to the bone microenvironment drives phenotypic plasticity of metastatic seeds, fosters intra-metastatic heterogeneity, and alters therapeutic responses. Our study provides insights into the clinical enigma of ER+ metastatic recurrences despite endocrine therapies.
INTRODUCTION
Estrogen receptor positive (ER+) breast cancer accounts for over 70% of all breast cancers, and after recurring, causes over 24,000 deaths per year in the US. Adjuvant endocrine therapies target ER and significantly reduce metastatic recurrences. However, 20-40% of patients still develop metastases, often after a prolonged latency (Lim et al., 2012; Zhang et al., 2013). Thus, it is imperative to understand how disseminated ER+ cancer cells escape endocrine therapies in distant organs and to identify therapies that can eliminate these cells.
Bone is the most frequently affected organ by ER+ breast cancer, which is usually luminal-like. Compared to the basal-like subtype, luminal A/B breast cancer exhibits a 2.5-fold increased frequency of bone metastasis, but a 2.5-fold decreased frequency of lung metastasis (Kennecke et al., 2010; Smid et al., 2008). Bone metastases of luminal-like breast cancer are usually late-onset, occurring beyond 5 years after surgery. Current tumor-intrinsic biomarkers based on primary tumors can predict recurrences within 5 years, but cannot predict late-onset recurrences after 5 years (Sgroi et al., 2013), suggesting that the capacity of developing late-onset metastasis is not encoded in cancer cells. Thus, there appear to be unique interactions between the bone microenvironment and ER+ disseminated tumor cells that allow them to survive adjuvant endocrine therapies and persist for a prolonged time.
Very little is known about how the bone microenvironment affects ER+ breast cancer cells in terms of key signaling pathways (e.g., ER signaling itself), therapeutic responses, and the evolution process. Seemingly, conflicting findings were reported, suggesting profound uncharacterized biology. For instance, a few studies revealed a paradoxically high disconcordance rate of ER status between primary tumors and DTCs, suggesting loss of ER in DTCs, which may be related to resistance to endocrine therapies (Fehm et al., 2008; Jäger et al., 2015). On the other hand, it was also noted that most clinically-detectable macroscopic bone metastases (>85%) remain positive for ER (Hoefnagel et al., 2013), seemingly contradicting the DTC findings. ER+ bone metastases still respond to endocrine therapies in many cases, although resistance almost invariably develops. These clinical observations cry for mechanistic studies, which are hindered by the lack of ER+ bone metastasis models, as well as technical limitations of detecting/investigating metastatic cells at a single cell resolution.
We have previously developed a series of models and techniques to investigate cancer-bone interaction at a single cell resolution. We discovered that bone micrometastases are usually localized in close contact with osteogenic cells including mesenchymal stem cells (MSCs) and osteoblasts (OBs)(Wang et al., 2015). Direct interaction between cancer and osteogenic cells is mediated by adherens and gap junctions, which stimulate mTOR and calcium signaling in cancer cells, respectively (Wang et al., 2015, 2018). This interaction precedes the onset of osteolytic vicious cycle that has been well characterized before, and represents an intermediate stage of bone colonization between dormant single DTCs and overt macrometastases. Herein, by combining our techniques with an array of ER+ breast cancer models, we aimed to understand how the bone microenvironment may dictate the evolution of ER+ breast cancer cells, leading to unexpected cellular alterations and therapeutic responses.
RESULTS
Microscopic bone lesions transiently lose ER expression
To study how ER+ breast cancer cells interact with the bone microenvironment, we identified two patient-derived xenograft models (PDXs), HCI011 and WHIM9, which were developed from patients with bone metastases (Derose et al., 2011; Li et al., 2013) and exhibited spontaneous metastasis from mammary glands to bone in immunodeficient mice 5-6 months after orthotopic tumors are removed (Figure 1A). When we attempted to use human-specific ER as a marker to distinguish ER+ metastases from bone cells, we noticed that spontaneous bone metastases exhibited reduced ER expression in both PDX models (Figure 1B). In both models, the sizes of bone metastases are diverse and display an interesting positive correlation with intensity of nuclear ER by IHC staining (Figure S1A and S1B). These observations raised an interesting possibility that the bone microenvironment may influence ER expression in ER+ breast cancer cells.

A. ER IHC staining of various stages of spontaneous bone metastases from the ER+ PDX WHIM9. Representative pictures depict metastatic lesions at different stages are shown. Scale bar: 50μm.
B. ER IHC of various stages of spontaneous bone metastases from the ER+ PDX HCI011. Representative pictures of metastatic lesions of different sizes are shown. Scale bar: 50μm.
C. Scatter plots showing Pearson correlation (r) between bone metastasis sizes (cell count) and ER IF intensity. Images were acquired with 40x oil objective lens (Leica TCS SP5 confocal microscope). Each dot represents an image (n=22 for HCI011; n=21 for WHIM9; n=34 for MCF7; n=12 for SCP2). P- values: two-tailed paired sample t-test.
D. Scatter plots showing Pearson correlations (r) between orthotopic tumor sizes (cell count) and ER IF intensity. Images were acquired with 40x oil objective lens (Leica TCS SP5 confocal microscope). Each dot represents an image (n=8 for HCI011; n=6 for WHIM9; n= 7 For MCF). P-values: two-tailed paired sample t-test.
E. Pie chart depicting the purity of single cell-derived populations based on whole exome sequencing (WES) analysis. Single nucleotide variations (SNV) and copy number variations (CNV) were used to evaluated subpopulations from (Andor et al., 2014).
F. Gaussian curved showing ER distribution in MCF7 and SCP cells as indicated. Nuclear ER staining was quantified from 3D organoids and shown in figure 3F.
G. Scatter plots showing Pearson correlation (r) between bone metastasis sizes (cell count) and ER IF intensity from SCP2 cells. Images were acquired with 40x oil objective lens (Leica TCS SP5 confocal microscope). Each dot represents an image (n=12 for SCP2). P-values: two-tailed paired sample t- test.
H. Scatter plots showing Pearson correlations (r) between orthotopic tumor sizes (cell count) and ER IF intensity from SCP2 cells. Images were acquired with 40x oil objective lens (Leica TCS SP5 confocal microscope). Each dot represents an image (n=8 for HCI011; n=6 for WHIM9; n= 7 For MCF). P-values: two tailed paired sample t-test.
I. Coronal, sagittal, and axial view or representative PET/CT images depicting the uptake of radiolabeled fluorodeoxyglucose(18F-FDG) and fluoroestradiol (18F-FES) in small and large lesions of MCF7 orthotopic and bone metastasis. Small lesions (Week 1) and larger lesions (Week 7) were used to depict early and late stage of tumor formation. Red arrows indicate expected tumor location in bone and mammary gland. Color scales for early lesions (Week 1): 0.2-0.5 SUV-bw; Color scales for large lesions (Week 7): 100-200 SUV-bw.
J. Representative BLI images of IIA-induced bone metastases and orthotopic tumors models of MCF7 previously detected by PET in imaging as shown in I.
K. Evaluation of bone metastasis detection by BLI, PET/CT and H&E. Scatter plot was used to depict the correlation between BLI and PET for the detection of bone metastasis.

A. Representative H&E staining of spontaneous metastases of HCI011 and WHM9 tumors to spine and hind limb, respectively. Scale bar: 100μm.
B. Human-specific ER IHC staining are shown for spontaneous metastasis of HCI011 and WHIM9, respectively. Bone matrix is annotated. Scale bar: 50μm.
C. Confocal images showing immunofluorescence (IF) staining of ER (green), keratin 8 [k8] (red), and DAPI (blue) in orthotopic (mammary) and IIA-induced bone metastasis models of ER+ PDXs (HCI011 and WHIM9). Scale bars: 100µM. Representative images were captured with a 40x oil objective lens.
D. Representative IF images of MCF7 cells following orthotopic and bone transplantation in nude mice. Changes in ER expression are illustrated in primary tumor and bone metastasis at different stages of tumor progression. Early, intermediate and late phases are depicted from left to right. Green, red and blue represent IF staining of estrogen receptor (ER), cytokeratin (K8) and nucleus (DAPI). Scale bars, 50μm. Representative images were captured with a 40x oil objective lens.
E. Dot plot depicting the quantification of nuclear ER intensity in orthotopic and bone metastasis specimens from PDXs (HCI011, WHIM9) and cell lines (MCF7, ZR75-1). Following IF staining as illustrated in Figure 1C and D. Bone lesions were classified into “small” and “big” groups based on cell numbers captured by a same field with the cutoffs being < median – 0.5xS.D. (small) or > median + 0.5xS.D. (big). Dot represent the fluorescence intensity of ER in single cells. Cells from 3-6 different animals are plotted. P-values derive from a two-tailed paired Student’s t-test.
F. Dot plot depicting quantification of nuclear ER intensity in primary tumor and bone metastasis specimens from MCF7 single cell-derived population 2 (SCP2). Bone lesions were classified into “small” and “big” groups as defined in (B). Dots represent the fluorescence intensity of ER in single cells. Cells from 4 different animals are plotted. P-value derive from a two-tailed paired Student’s t-test
G. Dot plot showing the mean-normalized ER intensity of all cancer models using from Figure 1A to 1F. P-values derive from a two-tailed paired Student’s t-test.
H. Boxplot showing changes in ESR1 early signature in matched bone metastases and primary specimens from breast cancer patients ((https://github.com/npriedig/). All images were captured with Leica TCS SP5 confocal microscope. A 40x or 63x oil objective lens were used to capture all images (Immersion oil refractive index n=1.51). All quantifications were performed using ImageJ (Fiji). All statistical analyses represent a two-tailed unpaired Student’s t-test except when specified otherwise.
I. Diagram showing the experimental design for positron emission tomography–computed tomography (PET-CT) imaging of MCF7 cells transplanted orthotopically or to bone via IIA injection. Two rounds of imaging were performed at week 1 and week 7 post tumor transplantation using 18F-Fluoroestradiol (18F-FES) and 18F-Fluorodeoxyglucose (18F-FDG) with 2 days apart.
J. Representative PET/CT scans showing the maximum intensity projection (MIP) visualization of radiolabeled 18F-Fluorodeoxyglucose (18F-FDG) and 18F-Fluoroestradiol (18F-FES) in bone. Early time point (Week 1) and late time point (Week 7) were used to depict the micro-metastasis stage (small) and the macrometastasis stage (large). MCF7 bone metastases were generated using IIA injection. Red arrows indicate tumor location (Joint area). A smaller scale (0.2-0.5 SUV-bw) was used for week 1 images to allow detection of small lesions while a scale of 100-200 SUV-bw was used for the macrometastasis stage.
K. Axial view of representative PET/CT scans depicting the uptake of radiolabeled fluorodeoxyglucose (18F-FDG) and fluoroestradiol (18F-FES) in small and large lesions of MCF7 orthotopic tumors. Early time point (Week 1) and late time point (Week 7) were used to depict non palpable orthotopic tumor stage (small < 2mm) and the palpable tumor stage. Red arrows indicate expected tumor location (mammary gland). Color scales for early lesions (Week 1): 0.2-0.5 SUV-bw; Color scales for large lesions (Week 7): 100-200 SUV-bw.
L. Relative quantification of radiolabeled 18F-FES uptake in small and large lesions of orthotopic and bone metastases. Each dot represents the mean standard uptake values (mean SUV-bw) of 18F-FES normalized to the mean SUV of 18F-FDG for each mouse. Mann Whitney U-test is used for statistical analysis. n=5 mice per group.
To further pursue the impact of bone microenvironment on ER+ breast cancer cells, we performed intra-iliac artery (IIA) injection of dissociated PDX cells as well as established ER+ cell lines (MCF-7 and ZR75-1) to introduce experimental bone metastases to investigate early-stage bone colonization. This approach synchronizes the onset of colonization and enriches microscopic metastases, thereby allowing quantitative examination of bone colonization of relatively indolent cancer cells at different temporal stages (Figure 1C,D) (Yu et al., 2016).
Like in spontaneous bone metastases, a strong correlation was found between ER expression and the size of IIA-induced bone metastases (Figure S1C) but not orthotopic tumors (Figure S1D). When we classified tumors as micrometastasis (small) and macrometastasis (large) by cell counts, the expression of ER appeared to diminish in microscopic bone lesions compared to mammary tumors of the same models but was restored as bone lesions further progress into macroscopic bone metastases. (Figure 1E). Thus, in multiple ER+ PDX and cell line models, there appears to be an association between size of bone metastatic lesions and expression level of ER (Figure 1E-G).
Two possible mechanisms might explain the differences in ER expression between bone lesions of different sizes. First, genetically distinct ER-low and ER-high cancer cell clones may pre- exist, and the former progresses at a much slower rate and only form small lesions. Second, there may be a transient and reversible loss of ER in ER+ cancer cells in the bone microenvironment. To distinguish these possibilities, we collected single cell-derived populations (SCPs) from MCF-7 cells. A SCP was expanded from a single cell, and therefore, is much more homogeneous genetically. Four SCPs were developed with variable tumorigenicity in mammary glands or bones. Exome sequencing was performed to validate their genetic homogeneity. By single nucleotide variation (SNV) or copy number variation (CNV), a much lower heterogeneity can be detected (Figure S1E), which may be caused by de novo mutations during the cell expansion process in vitro. When both SNV and CNV are considered, the clonality can be confirmed for all four SCPs (Figure S1E). Taken together, SCPs seem to possess dramatically reduced genetic heterogeneity compared to the parental population. The expression of ER in SCPs is still variable from cell to cell, although to a much lesser degree compared to parental cells (Figure S1F), suggesting that a considerable proportion of ER regulation occurs at the epigenomic level. Using an SCP that exhibits the best genetic clonal purity (SCP2), we generated bone metastases and orthotopic tumors and compared the ER expression between micro- and macro-metastases. As for parental MCF7 cells, we observed transient decrease in ER expression in bone micrometastases (Figure 1F, S1G and S1H). Taken together, data obtained from multiple models supported that the bone microenvironment induces a loss of ER expression specifically in micrometastases (Figure 1G). Importantly, this loss may be transient and reversible.
The loss of ER was also observed on clinical specimens in previous studies (Hirata et al., 2009; Schrijver et al., 2018). In particular, in a study comparing gene expression profiles between patient-matched primary and bone metastases, ESR1 was found to be one of the top genes down-regulated in bone metastases (Priedigkeit et al., 2017). Gene Set Variation Analysis (GSVA) further suggests that there is an even stronger down-regulation of acute ER signaling (Figure 1H). Together with the experimental observations, these data provide an explanation for the discrepant findings in previous literatures, arguing that early-stage colonization of ER+ breast cancer cells in the bone is associated with a transient and reversible down-regulation of ER.
We next sought to monitor ER signaling alteration during bone metastasis progression in a longitudinal fashion. Positron emission tomography–computed tomography (PET-CT) imaging has been used in clinic to detect bone metastases and evaluate tumor responses to endocrine therapy (Dehdashti et al., 2009). To demonstrate the transient reduction in ER expression in live mice with experimental bone metastases, a radiolabeled 18F-Fluoroestradiol (18F-FES) PET/CT imaging strategy was adopted (Figure 1I and S1I-K). 18F-FES binds ER enriched tumors and can be quantified in parallel with glucose uptake (18F-FDG) to estimate changes in ER expression (Kurland et al., 2017). We found a significant reduction in estrogen uptake in early lesions of bone metastasis (Figure 1J), comparatively to similar lesions in mammary glands (Figure 1K and S1I). The discrepancy was reduced in advanced stages of tumors formation –larger tumors (Figure 1L), suggesting a bone specific effect on micrometastatic lesions.
An evolving barcode strategy to trace clonal evolution of ER+ breast cancer cells in bone
Heterogeneity of ER expression is often observed in the clinic, and > 1% of positivity has been used as a cutoff to define ER+ tumors (Hammond et al., 2010). However, the clonal relationship between ER+ and ER-cancer cells in an ER+ breast tumor has not been unambiguously defined. Remarkably, our observation suggests that this heterogeneity can be both temporal and spatial in the bone, which prompted us to perform more sophisticated lineage-tracing experiments to delineate the clonal evolution process of ER+ breast cancer in the bone.
We adopted an evolving barcode system developed by Kalhor and colleagues (Kalhor et al., 2017, 2018). Briefly, this is a variation of the widely used CRISPR-Cas9 system. PAM site is mutated to allow Cas9 to home to the genetic locus encoding guide RNAs (home-guiding RNAs or hgRNAs) and introduce mutations. Thus, the guide RNA locus evolves as a function of time once Cas9 expression is initiated. This system provides us with an opportunity for multiple parallel lineage tracing.
The evolving barcode system was introduced to MCF-7 cells, and allowed to accumulate mutations before tumor transplantation to the bone by IIA injection (Figure 2A). This initial evolution created a baseline barcode diversity so that independent clones in the bone can be distinguished. We reasoned that further evolution after IIA injection will help deduce parent-child relationship throughout clonal evolution based on Shannon entropy. When bone metastasis was established, we performed laser-captured microdissection (LCM) to isolate individual lesions and cancer cell clusters from both femur and tibia (Figure 2B and Figure S2A). DNA purification and PCR-mediated enrichment of hgRNA sequences were performed before library preparation and sequencing (Figure 2A, 2B, and S2A). The hgRNAs of each lesion were then analyzed to deduce clonal relationships among different lesions (Figure 2C and S2B). A consecutive section of the bone was used for quantitative immunofluorescence staining of ER so that the nuclear ER expression of each lesion can be superimposed with the barcodes. Interestingly, ER expression was highly variable across different lesions of the femur (Figure 2D and S2C) and the tibia (Figure S2D), indicating a phenotypic heterogeneity of the bone metastasis.

A. Exact representative map of mouse tibia before and after laser capture microdissection (LCM) of MCF7-derived bone lesions
B. Heatmap showing hierarchical clustering of bone lesion collected in S2A (tibia), based on hgRNA A21 barcodes mutations.
C. Distribution of ER expression in MCF7 bone metastasis lesions of the femur. Each curve represents a Gaussian distribution of nuclear ER expression in single cells and the peaks represent the mean expression of each lesion.
D. Expression and distribution of ER on lesions developed in the tibia.
E. Heatmap showing hierarchical clustering of bone lesion collected from all lesions of the same hind limb (femur and tibia) using the normalized mutual information (NMI). The analysis is based on mutation identified from hgRNA A21 evolving barcode.
F. Modular organization of lesions collected for tibia (#13-19) based on hgRNA A21 muations. The circle size indicates the mean expression of ER in each lesion.
G. Circus plots showing insertions, mutations and DNA alteration summary in parental (#20) and module 1 associated lesions (#1, #4, #5, #7).
H. Barcode-based map showing modular organization of MCF7 lesions in femur. All 3 clusters are physically distinct.
I. Raw BLI at week 4 post IIA injection of control, low-GFP or high-GFP MCF7 cells.
J. Heterogeneous expression of ER in bone metastasis derived for low-GFP cells.
K. Scatter plot showing Pearson correlation (r) between nuclear ER intensity and lesion size in bone. Bone metastases derived from IIA-induced ERE-GFPLow MCF7 cells. Samples #2 was excluded as sole out layer (over 200 cells).
L. HD images femur-bearing bone metastasis. Calcein injection was used to depict areas with new bone deposition (green), and evaluate potential associations with tumor location.
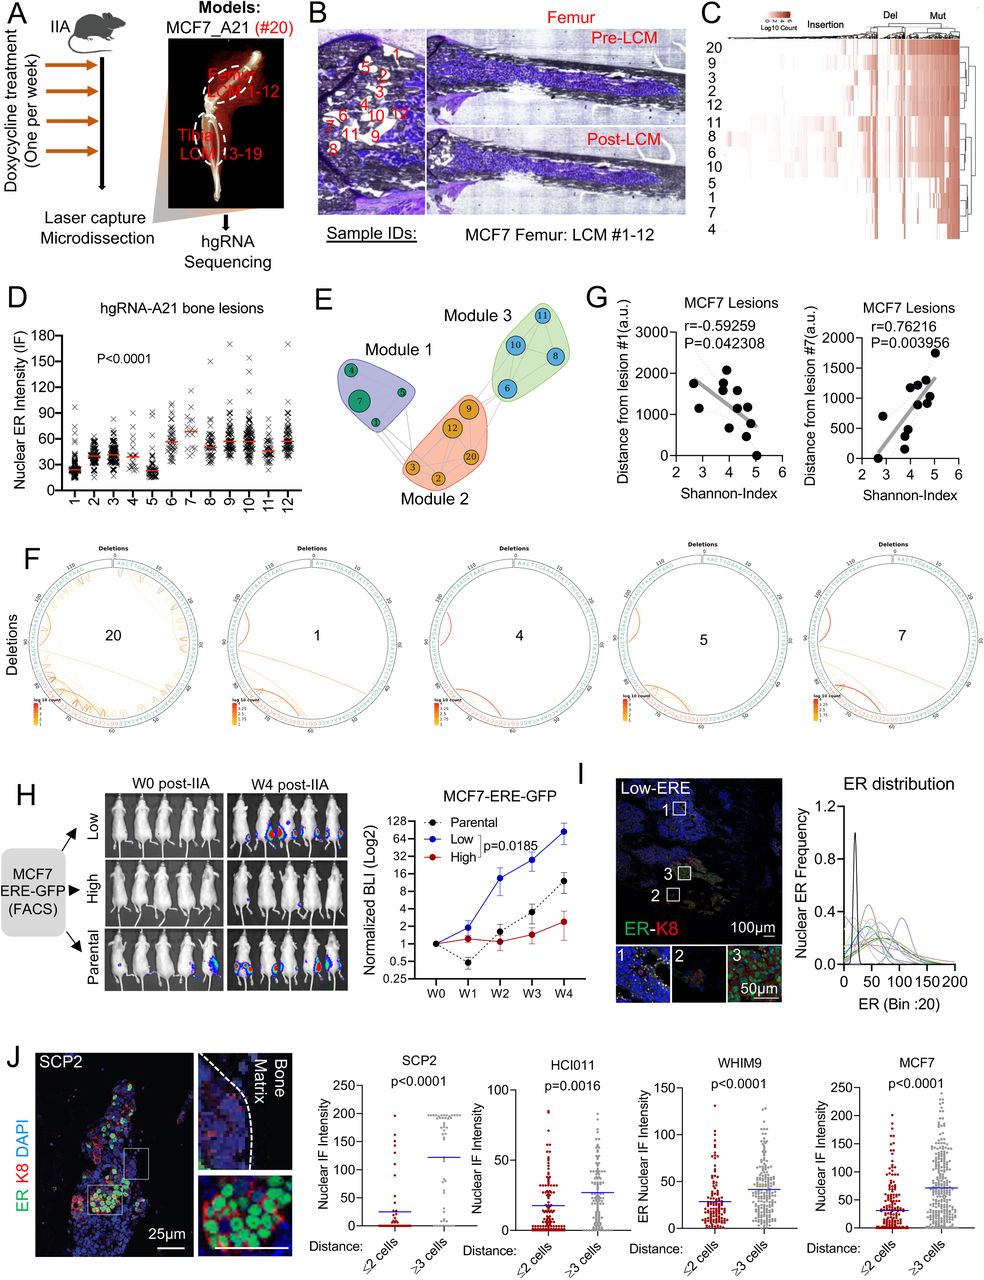
A. Experimental design for bone metastasis tracing using an inducible CRISPR-Cas9 hgRNA evolving barcoding system. iCas9-expressing MCF7 cells were stably transduced with homing guide RNA A21 (hgRNA A21) before transplantation to bone via IIA injection. Cas9 expression was induced weekly for four weeks before laser capture microdissection (LCM) was performed on harvested frozen sections. DNA was collected from independent lesions of the same hindlimb for targeted sequencing. We collected 19 lesions from femur (#1-12) and tibia (#13-19). The barcoded parental MCF7 cells injected to bone were labelled as #20.
B. Exact representative map of mouse femur before and after laser capture microdissection (LCM) of MCF7 bone lesions. All 12 lesions captured by LCM were used for downstream analysis.
C. Heatmap showing hierarchical clustering of bone lesion collected in B, based on hgRNA A21 barcodes mutations.
D. Quantification of nuclear ER expression from metastatic lesions harvested by laser capture microdissection (LCM). Immunofluorescence was performed on slides adjacent to the one used in for LCM (Figure B).
E. High dimensional undirected analysis of mutations revealed a modular network from femur-derived lesions (# 1-12). 3 major modules were identified based on Gaussianized NMI distance between lesions. The mean intensity of ER expression was represented as a circle for each lesion; larger circles indicate higher ER expression.
F. Circus plot showing hgRNA deletions in bone lesions clustered in module 1 (shown in E). Sample #20 represents the pre-injected cells (parental).
G. Scatter plot showing Pearson correlation (r) between the Shannon diversity of bone lesions and their relative distance to lesion #1 or #7. Distance was estimated using imageJ (arbitrary units were used). A two-tailed test was used for statistical analysis.
H. IIA-induced bone metastasis from ERE-GFP sorted MCF7 cells showing variation in tumor growth based on Estrogen-Response-Element (ERE)-GFP reporter. Tumor growth was measured by Bioluminescence. ERE-GFPLow, and ERE-GFPhigh MCF7 cells were sorted based of their GFP expression.
I. IF staining of ER in bone metastasis derived from ERE-GFPLow MCF7 cells. The Gaussianized ER distribution is based on nuclear intensity at a single cell level, and the peaks represent the mean expression of each lesion. A Two-Way ANOVA (column factor) was used for statistical analysis of tumor growth curves.
J. Representative confocal image of SCP2-derived bone lesions displaying a spatial distribution of ER based on cancer cells location relatively to the bone matrix. ER, keratin 8 and nuclei are depicted in green, red and blue as indicated. Scale bars: 25µm. Dot plots represent nuclear ER expression in cells proximal (≤ 2 cell distance) or distal (≥3 distance) to the bone matrix. P-values represent two-tailed unpaired Student’s t-tests.
Based on barcode mutations found in each lesion, we identified several robust clusters (Figure S2E). In the metaphyseal area of femur, 12 lesions can be grouped into three clusters. Interestingly, ER expression varies within each cluster, which provides strong evidence against genetic traits as a determinant of ER level in bone metastasis (Figure 2E). Similar observations were found in lesions derived from tibia (Figure S2F). A notable example was the module 1, a cluster formed by Lesions No. 1, 4, 5 and 7. The barcodes of these lesions are highly similar (Figure 2F, S2G), indicating that they are derived from the same clone. Additionally, these lesions have a distinct regional distribution with close proximity to the growth plate (Figure S2H). Lesion No. 1 exhibited a low ER expression but the highest Shannon entropy among all 12 lesions, whereas lesion #7 was just the opposite. Both ER expression and Shannon entropy of other lesions vary as functions of distance to these two extreme lesions (Figure 2G). Considering that the Shannon entropy is correlated with the “age” of a lesion #1 is likely to be parental to lesions No. 4, 5, and 7. The fact that their ER level greatly varies, support our hypothesis that ER expression is not determined genetically, and ER-lesions may give rise to ER+ lesions as bone metastasis progresses.
The analysis of all lesions (#1-19) derived from the same hind limb revealed surprising similarities between lesions from femur and tibia (Figure S2E). Despite physical barriers, lesion No. 15 from tibia shares similar mutations with lesions No. 6, 8, 10, and 11 from femur, suggesting a femur-to-tibia seeding (Figure S2E). To further understand this intriguing observation, we initiated more investigation on the metastasis-to-metastasis seeding as shown shown in our co-submitted manuscript (Zhang et al. 2019).
ERE-GFP-cells drive bone metastatic progression and reconstitute ER heterogeneity
As an independent approach to trace the fate of ER-cancer cells in bone metastasis, we introduced a reporter system, namely GFP expression driven by the estrogen-responsive-elements (ERE-GFP) that we cloned into a pWPXL vector (Plasmid #12257). We sorted ERE-GFP+ and ERE-GFP-cells, and performed IIA injection of these cells, respectively. The bone colonization capacity of ERE-GFP-cells is over 30-fold higher compared to ERE-GFP+ cells (Figure 2H and S2I), which is consistent with the previous report that the ER-subset of MCF-7 cells enrich cancer stem cell activities (Fillmore et al., 2010). Interestingly, bone metastases derived from ERE-GFP-cells exhibited heterogeneous ER expression, similar to those derived from parental cells (Figure 2I and S2J) and lesion sizes were associated with ER expression (Figure S2K). This experiment provides additional support for the conclusion that ER-cells within an ER+ breast tumor may re-populate ER+ metastatic cells in the bone microenvironment.
To seek mechanistic clues of how ER is transiently lost during bone metastatic progression, and based on observations that breast cancer lesions tend to associate with areas of new bone deposition (Figure S2L), we scrutinized the spatial distribution of ER expression in bone lesions. Interestingly, it appeared that cancer cells apart from lesion borders were more likely to restore ER expression as compared to those at the border (Figure 2J). This observation suggests that ER recovery tends to occur first toward the center of a bone metastatic lesion, thereby leading to the hypothesis that the interactions between metastatic cells and adjacent bone cells drive the transient loss of ER.
Direct interaction with osteogenic cells mediates the loss of ER expression
To identify the cell type that causes ER loss in cancer cells, we assessed the spatial relationship between ER expression and various bone cells including osteoclasts (RANK+), endothelial cells (CD31+), myofibroblasts/bone stromal cells (αSMA+) and osteogenic (ALP+). In WHIM9, HCI011 and MCF-7 models, RANK expression exhibited a positive association with nuclear ER intensity at a single cell level (Figure 3A). In contrast, negative associations were observed for endothelial, fibroblasts, and osteogenic cells (Figure 3B and 3C). Among these, the correlation between ALP+ osteogenic cells and ER intensity is most consistent across different models (Figure 3C). Indeed, our previous research demonstrated that the osteogenic cells are the major components of the microenvironment niche of bone micrometastases that are proliferative (Wang et al., 2015). Taken together, these data suggest that the osteogenic cells may be the major microenvironment components responsible for the loss of ER.

A. Representative confocal images of bone metastases showing association between ER expression in PDXs (HCI011 and WHIM9) and MCF7 cancer cells and Receptor activator of nuclear factor-κB (RANK) expression in osteoclasts. RANK, ER, and nuclei (DAPI) are shown as green, red, and blue, respectively. Scale bars: 100µm. ER quantification was represented as dot plots for each metastatic model. P-values derive from two-tailed unpaired Student’s t-test.
B. Representative confocal images of bone metastases showing association between ER expression in PDXs (HCI011 and WHIM9) and MCF7 cancer cells, alpha smooth muscle actin (aSMA) expression in cancer associated fibroblasts, and cluster of differentiation 31 (CD31) expression in endothelial cells. aSMA, CD31, ER, and keratin 8 (K8) are shown as green, grey, purple, and blue, respectively. Scale bars: 100µm. ER quantification was represented as dot plots for each metastatic model. P-values derive from two-tailed unpaired Student’s t-test.
C. Representative confocal images of bone metastases showing association between ER expression in PDXs (HCI011 and WHIM9) and MCF7 cancer cells, alkaline phosphatase (ALP) expression in osteogenic cells. ALP, ER, and keratin 8 (K8) are shown as green, purple, and blue, respectively. Scale bars: 100µm. ER quantification was represented as dot plots for each metastatic model. P-values derive from two-tailed unpaired Student’s t-test.
D. Representative IF images of HCI011-derived primary cells and MCF7 cells in 3D monoculture and co-culture with human fetal osteoblast cell line (FOB) and mesenchymal stem cell line (MSC). ER, keratin 8 (K8) and nuclei (DAPI) are represented in red, grey, and blue, respectively. Scale bars: 100µm.
E. Heatmap showing the mean intensity of ER in primary cells (HCI011) and breast cancer cell lines (MDA-MB-361, MCF7, ZR75-1, T47D, ZR75-30) in 3D monoculture (control) or co-culture with osteoclast precursors (U937), bone marrow stromal cells (Hs5), mouse pre-osteoblasts (MC3T3), human mesenchymal stem cells (MSC) and human pre-osteoblast (FOB). All co-cultures were performed in triplicate and images were captured with a 40x oil objective lens. ER expression in monoculture versus co-culture of multiple cell lines with osteoclast precursors (U937) or pre-osteoblasts (FOB) was represented (bottom). P-value results from a two-tailed unpaired Student’s t-test. 3 separated experiments were used. Error bars: mean +/− standard deviation.
F. Representative confocal images showing ER expression (red) in MCF7 single cell-derived populations (SCPs) in 3D monoculture or co-culture with FOB cells. Vimentin (VIM), Keratin 8 (CK8), and DAPI were used to identify osteoblasts (Green), cancer cells (grey) and cell nuclei (blue), respectively. Scale bars: 50µm.
G. Quantified ER expression from confocal images of single cell-derived populations (SCP1-SCP4). A two-tailed unpaired Student’s t-test analysis was used to evaluate the correlation (r) between monoculture and FOB co-cultures (right panel n=5). Error bars: +/− standard error of the mean. Each dot represents a cell from 3 different images.
H. Graph representing ER expression in cancer cells alone or in co-cultured with FOB cells. All co-cultures were performed in triplicate and images were captured with a 40x oil objective lens. ER expression in monoculture versus co-culture of multiple cell lines with FOB was represented (bottom). The p-value derived from Spearman correlation (r) represents a two-tailed paired Student’s t-test. 3 separated experiments were used. Error bars: mean +/− standard errors.
To further dissect this interaction, we employed a fetal osteoblast cell line (FOB) and a human mesenchymal cell line (MSC) to represent osteogenic cells. Luminal-like cancer cells and osteogenic cells form heterotypic organoids in 3D suspension co-culture, which successfully recapitulated several aspects of cancer-niche interaction (Wang et al., 2015). Co-staining of ER and keratin 8 (K8, a marker of luminal cancer cells) in 3D co-cultures revealed a loss of ER in MCF-7 cell line and HCI011 PDX-derived organoids (Figure 3D) similar to in vivo bone micrometastases, suggesting that interaction with osteogenic cells in vitro can recapitulate the ER down-regulation in bone micrometastasis (BMMs).
We also tested several other ER+ models in the 3D co-culture assays. MSCs and FOB both induced consistent loss of ER expression across multiple models (Figure 3E). In contrast, U937, a human monocytic cell line that is often used to model osteoclast precursors, did not cause the same changes to the ER expression, supporting the specificity of osteogenic cells (Figure 3E).
Importantly, the MCF7 SCPs also exhibited the same alterations upon interacting with FOB (Figure 3F and 3G). In SCP2, SCP3 and SCP4, the degree of ER down-regulation is comparable to parental MCF-7 cells. SCP1, on the other hand, exhibited a lesser decrease (Figure 3G and 3H). Interaction with osteogenic cells confers growth advantage on cancer cells as shown in our previous studies (Wang et al., 2015, 2018). Similarly to MCF-7 cells (Figure S3A and S3B), SCP1, SCP2, and SCP3 also displayed such advantage in 3D co-cultures as compared to mono-cultures. In contrast, the growth of SCP4 appeared to be suppressed by FOB (Figure S3C). Thus, different SCPs from MCF-7 cells possess variable capacity of orthotopic tumor-initiation, bone colonization, and FOB-mediated growth promotion and ER down-regulation (Figure S3D). This pre-existing heterogeneity supports the importance of clonal selection in metastasis (e.g., in the bone microenvironment, SCP2 and SCP3 are expected to be enriched because of their ability to take advantage of interactions with osteogenic cells), which has been repeatedly demonstrated in previous studies (Bos et al., 2009; Kang et al., 2003; Minn et al., 2005). However, an unappreciated process is the microenvironment-induced, adaptive changes that occur to most SCPs (Figure 3F-H), independent from the clonal selection.
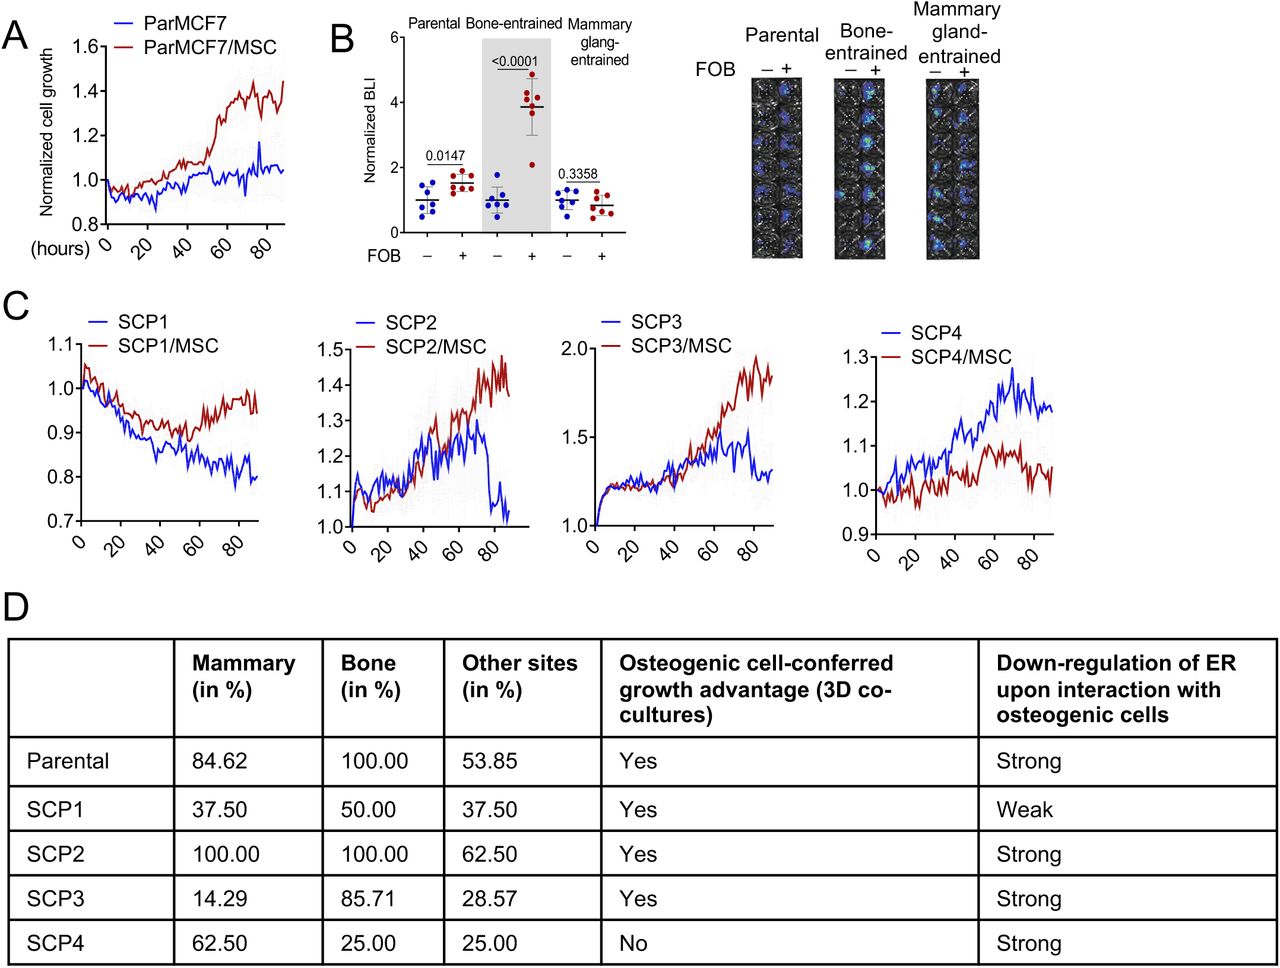
A. Growth curves of MCF7 and single cell-derived populations (SCP1-4) in 3D monoculture and co-culture with osteoprogenitor cells (MSC) in complete growth medium (10% FBS). Real-time images were acquired hourly using Incucyte. Values represent epifluorescence normalized to the earliest time point of co-culture. Error bars: +/−standard error of the mean (SEM).
B. Dot plot representing the BL intensity of bone-entrained (MCF7-Bo), mammary gland-entrained (MCF7-Ma) and naïve MCF7 cells (parental) after 10 days of 3D monoculture (blue) and FOB co-culture (red). Grey area highlight bone-derived (bone-entrained) MCF7 cells. Error bars: mean +/− standard deviation. P-values: two-tailed unpaired Student t-test
C. Growth curves of single cell-derived populations (SCP1-4) in 3D monoculture and co-culture with osteoprogenitors (MSC) in complete growth medium (10% FBS). Real-time images were acquired hourly using Incucyte. Values represent epifluorescence normalized to the earliest time point of co-culture. Error bars: +/−standard error of the mean (SEM).
D. Table summarizing metastatic characteristics of MCF7 (Parental) and SCPs in vivo and in 3D co-culture
Down-regulation of ER leads to reduced ER signaling activities
Hyperactive ER activities can lead to ER protein degradation (Nawaz et al., 1999). Therefore, decreased ER expression could paradoxically suggest an enhanced ER signaling. To examine this possibility, we used real-time qPCR to measure ER at transcription level and found it decreased upon co-culturing with FOB (Figure 4A). Moreover, using a luciferase reporter driven by a promoter containing Estrogen-responsive elements (ERE-luciferase), we discovered that co-culturing with FOB and MSCs indeed decreased ER transcriptional activity (Figure 4B). Finally, the expression of an important ER target gene, progesterone receptor (PR), was significantly reduced in bone microenvironment (Figure 4C), suggesting diminished ER transcriptional activities. These data demonstrate that the transient loss of ER is not an indicator of high ER activity, but rather the cause of decreased ER signaling in cancer cells.

A. Relative mRNA expression of ESR1 in 3D monoculture or co-culture of MCF7 with FOB. Data result from MCF7 cells only (FACS sorted). P-values: two-tailed unpaired Student’s t-test.
B. Dot plot representing ER transcriptional activity in MCF7 cells expressing pGL2 ERE-luciferase reporter. MCF7 cells were cultured in 3D with or without osteogenic cells (FOB and MSC) for 7 days. Luciferase activity was assessed using IVIS Lumina II in vivo system; n=10 technical replicates. P-values: two-tailed unpaired Student’s t-test. Error bars: mean +/− standard deviation.
C. Confocal images showing the expression of progesterone receptor (PR), in IIA-induced bone metastasis from MCF7 cells and PDX HCI011 (PR: green). Cancer cells are depicted with keratin 8 (K8) in red. DAPI (blue) was used for nuclear staining. Dot plots show PR quantification based on IF. P-values: two-tailed unpaired Student’s t-test.
D. Dot plots depicting ER intensity in 3D monoculture and co-culture of MCF7 cells with FOB following 24 hours treatment with 10nM 17β-estradiol, 20nM fulvestrant and 100nM tamoxifen. Data represent the average of 5 different images.
E. Violin plot showing the response of luciferase-labelled MCF7 and ZR75-1 cells to 100nM of tamoxifen (4-Hydroxytamoxifen) and 20nM of fulvestrant in 3D monoculture or co-culture with osteogenic cells (FOB). Bioluminescence was acquired 72 hours post treatment using the IVIS Lumina II. Two-tailed unpaired Student’s t-test was used for statistical analysis (n=12 for MCF7; n=10 for ZR75-1).
F. Graphs representing the proliferation of MCF7 (Par) and single cell-derived populations (SCP1-4) in monoculture and MSC co-culture following 1 week of treatment with 20nM fulvestrant and 100nM tamoxifen. n= 5 different cell lines. Two-tailed paired Student’s t-test was used for statistical analysis.
G. Time course experiment depicting growth kinetics of naïve (un-entrained) and bone-entrained SCP2 cells in vehicle or 20nM fulvestrant conditions. n=6 technical replicates. Real-time images were obtained using Incucyte S3 system for 5 days.
H. Growth curve showing response of MCF7-derived bone metastases to estrogen depletion. All ovariectomized mice were additionally treated with Letrozole (OV+AI), daily, to ensure both endocrine and paracrine estrogen production are blocked. Sham surgery was performed on control mice. Results are based on bioluminescence intensity (BLI). A Two-Way ANOVA (mixed-effects model with Geisser-greenhouse correction) was used for statistical analysis
I. Dot plot showing growth differences of bone metastases between control and OV+AI mice at early (week 2) and late time point (week 5) following tumor transplantation. n=10 mice per group. A two-tailed unpaired Student’s t-test was used for statistical analysis.
J. Representative H&E staining showing MCF7 metastatic lesions in both control (WT-mice) and ovariectomized + letrozole-treated (OV+AI) groups.
K. Growth curve depicting the response of ZR75-1-derived bone metastasis as in H. Two-Way ANOVA was used for statistical analysis.
L. Dot plot statistical growth differences in ZR75-1 as in I.
M. Representative H&E staining of ZR75-1 metastatic lesions as in J.
Interaction with osteogenic cells in the bone microenvironment leads to resistance to endocrine therapies
Downregulation of ER may impact endocrine therapies. To test this hypothesis, we examined the effects of fulvestrant, tamoxifen, and estradiol on ER+ cancer cells with or without co-culture of FOB. The presence of FOB diminished the effects of these agents on ER nuclear localization (Figure 4D) and blunted the anti-proliferative effects of tamoxifen and fulvestrant in co-cultures (Figure 4E). The same results were also observed using SCPs of MCF-7 (Figure 4F), indicating a clonal selection-independent process. To further test this notion, we examined the reversibility of “bone-entrained” effects. Specifically, we inoculated SCP2 cells into bone via IIA. Before osteolytic metastases were established, hind limbs were extracted to retrieve cancer cells, resulting in a “bone-entrained” version of SCP2 (SCP2-Bo) (Figure S4A). SCP2-Bo cells remained resistant to fulvestrant in early passages in vitro, but this resistance diminished as cells were expanded in cultures (Figure 4G). Thus, the phenotypic shift caused by the bone microenvironment is not stably inherited, arguing against genetic selection.

A. Graphical representation of procedures used to generate bone-entrained cells from bone metastatic lesions. The parental cells were also sorted in parallel with bone-entrained cells and labelled as un-entrained.
B. Experimental design to assess the effect of estrogen depletion on bone metastasis growth. Following IIA injection, mice were treated with estrogen (E2-in-water) for 2 weeks to allow for tumor initiation before ovary removal and letrozole treatment. Bone metastasis progression was measured using tumor BLI.
C. Normalized BLI and orthotopic tumor weight from MCF7 cells at week 2 and week 5 (post-harvest), respectively. P-values: two tailed Paired Sample t-test.
D. Normalized BLI and orthotopic tumor weight from ZR75-1 cells at week 2 and week 5 (post-harvest), respectively. P-values: two tailed Paired Sample t-test.
E. Representative confocal images depicting the expression of progesterone receptor (PR) in mammary gland and bone metastasis deriving from ZR75-1 cells.
F. Dot plot showing changes in nuclear PR expression based on IF images as shown in E. PR expression was not fully recovered in either wild-type (control) or ovariectomized + letrozole-treated mice. P-values: one way ANOVA t-test.
We next performed in vivo experiments to examine differential responses of ER+ cancer cells to estrogen deprivation in the bone microenvironment (Figure S4B). Combined overiectomy and letrozole treatment could significantly impede orthotopic tumor growth in mammary fat pads in both MCF-7 and ZR75-1 models (Figure S4C and S4D), but failed to reduce metastatic colonization of these cells in the bone at early time points (Figure 4H-4M). Upon further dissection of this process, it was noted that responses to estrogen deprivation partially recovered in MCF-7 cells after Week 3 (Figure 4H and 4I), further supporting that the endocrine resistance in early-stage bone metastases may be reversible as metastases further progress. However, ZR75-1 bone lesions remained resistant in later time points (Figure 4K and 4L). Thus, sensitivity to endocrine therapies may be restored in some bone macrometastases but not all. This may reflect the highly variable responses of ER+ bone lesions to endocrine therapies under the metastatic setting. In seeking a potential mechanism for the persistent resistance in the ZR75-1 model, we discovered that despite the partial reversion of ER expression in macrometastases, PR expression remained repressed (Figure S4E and S4F). This observation suggested that ER signaling may not recover along with ER expression during bone metastasis progression. Therefore, loss of ER dependence in early-stage bone colonization may lead to transient or permanent endocrine resistance in overt metastases later on.
Down-regulation of ER in the bone microenvironment is partially mediated by direct cell-cell contact and gap junctions
We previously reported that heterotypic gap junctions between cancer cells and osteogenic cells mediate calcium influx to the former and activates calcium signaling (Wang et al., 2018). We asked if the gap junction and calcium signaling may mediate ER downregulation and endocrine resistance. This hypothesis was partially validated through western blots showing that suppression of gap junction by a peptide inhibitor, GAP19, or calcium signaling by a small molecule inhibitor, FK506, both partially restore ER expression in co-cultures with FOBs (Figure S5A). This effect was small but noticeable, and was further supported by a converse experiment in which high [Ca2+] in the medium decreased ER expression in MCF7 and ZR75-1 cells (Figure S5B). At the functional level, inhibition of calcium signaling reduced the grow advantage conferred by osteogenic cells (FOB) (Figure S5C), and enhanced endocrine therapies in bone-in-culture array (BICA) (Figure S5D), which is an ex vivo platform that faithfully recapitulated bone microenvironment and cancer-niche interactions (Wang et al., 2017). Taken together, we provide evidence supporting gap junctions and calcium signaling as one of the mechanisms inhibiting ER expression in bone micrometastases (BMMs).
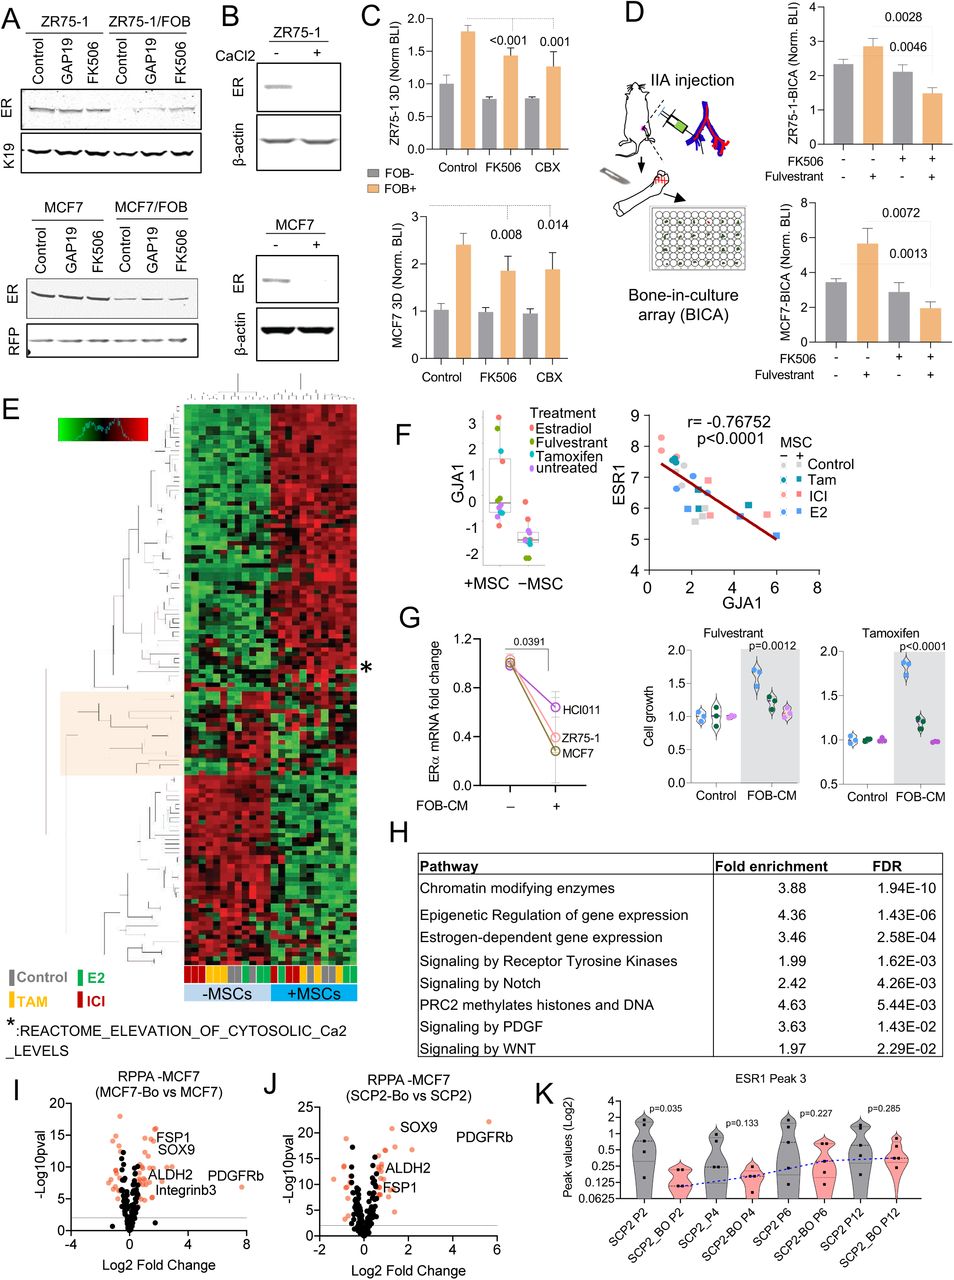
A. Immunoblotting showing ER expression in ZR75-1 and MCF7 in monoculture or FOB-co-culture after 24h treatment with 1uM CX43 inhibitor (GAP19) and 1uM calcium signaling inhibitor (FK506). Keratin 19 and RFP were used for loading control specific to cancer cells.
B. Immunoblotting showing the effect of 2mM Calcium (CaCl2) on ER expression in ZR75-1 and MCF7 cells.
C. Histogram plots depicting the inhibitory effect of calcium signaling disruptors (1µM FK506 and 10µM Carbenoxolone-CBX) on osteoblast-induced breast cancer cell growth (ZR75-1 and MCF7). Cancer cells were cultured in 3D without (grey) or with (orange) osteogenic cells (FOB). Bioluminescence intensity (BLI) was acquired 72h post treatment. Data results from 3 different experiments with 4-6 technical replicates. Two-tailed unpaired Student’s t-test was used for statistical analysis.
D. Histograms plots showing effect fulvestrant (anti-ER) and FK506 (Calcium signaling inhibitor) combination on MCF7 and ZR75-1 cells grown in bone using BICA (Bone-In-Culture-Array). Cells were injected to bone using intra-iliac artery (IIA) injection. Hind limbs were harvested, and bone pieces were cultures ex vivo. Bioluminescence intensity (BLI) was assessed using IVIS Lumina II in vivo system. n= 6-18 bone pieces for each treatment group. A two-tailed unpaired Student’s t-test was used for statistical analysis.
E. Heatmap depicting molecular pathways (PANTHERS) altered in MCF7 when cultured alone or in 3D with MSC and treated with vehicle (control), 10nM 17B-estradiol (E2), 10nM fulvestrant (ICI) or 100nM tamoxifen (Tam) for 24h. Data results from Translating Ribosome Affinity Purification (TRAP) sequencing analysis.
F. Boxplot showing the promoting effect of osteogenic cells (MSC) on CX43 gene (GJA1) expression in 3D co-cultures of MCF7 (left). Scatter plot showing Pearson (r) correlation between GJA1 and ESR1 gene (right). All values result from Translating Ribosome Affinity Purification (TRAP) sequencing data. Colors are specific to treatment conditions.
G. Effect of FOB conditioned media on ESR1 (ER) expression and endocrine response of PDX HCI011, MCF7, and ZR75-1 cells in 3D. n= 3 biological and technical replicates. P values: two-tailed paired Student t- test was used.
H. Table depicting signaling pathways involved in osteogenic cell-mediated breast cancer cell reprogramming based on MCF7 Translating Ribosome Affinity Purification (TRAP) sequencing analyzed.
I. Volcano plot indicating differentially altered protein expression between bone-derived MCF7 cells (MCF7-Bo) and parental cells (MCF7) based on expression fold change (Log2) and p-value (-Log10).
J. Volcano plot indicating differentially altered protein between bone-derived SCP2 cells (SCP2-Bo) and parental cells (SCP2) based on expression fold change (Log2) and p-value (-Log10) from RPPA analysis.
K. Violin plot depicting changes in chromatin accessibility at the ESR1 gene (Peak 3) over multiple passages of control and bone-derived SCP2 cells in vitro. P-values represent unpaired Student t-tests between parental (SCP2) and bone-derived (SCP2-BO) cells.
Unbiased profiling uncovered global phenotypic shift of ER+ cancer cells that persists after dissociation from the bone microenvironment
To identify additional molecular mechanisms underlying ER down-regulation, we used multiple approaches including 1) translating ribosome affinity purification (TRAP) followed by RNA-seq to profile transcriptome in cancer cells that are interacting with osteogenic cells in 3D suspension co-cultures without dissociating the two cell types, 2) reverse phase protein array (RPPA) to profile over 300 key proteins and phospho-proteins in cancer cells that have been extracted from the bone microenvironment, and 3) Assay for Transposase-Accessible Chromatin using sequencing(ATAC-seq) to evaluate epigenetic changes occurring at the chromatin level of cancer cells extracted from bone (Figure 5A). In 1), we also applied fulvestrant, tamoxifen and estradiol to the co-cultures to perturb ER signaling. In 2 and 3, we included SCP2, a genetically homogenous population that exhibits enhanced ability of bone colonization (Figure S1E and S3D).

A. Diagram summarizing strategies used to evaluate molecular changes occurring in cancer cells when exposed to the bone microenvironment. Translating Ribosome Affinity Purification (TRAP) was used to generate and sequence breast cancer cell specific transcriptomes without alteration of cell-cell interaction in 3D co-culture of cancer cells (MCF7) and osteogenic cells (FOB). Reverse Phase Protein Arrays (RPPA) was used to assess protein alterations between un-entrained (MCF7 and SCP2) and bone-entrained cells (MCF7-Bo and SCP2-Bo). Assay for Transposase-Accessible Chromatin sequencing (ATAC-seq) was used to assess epigenetic changes in un-entrained (MCF7 and SCP2) or bone-entrained cells (MCF7-Bo and SCP2-Bo).
B. Box plot depicting gene signature alternations in MCF7 monoculture (MSC-) and co-cultures (MSC) from TRAP sequencing. Analysis was performed using a non-parametric and unsupervised Gene Set Variation Analysis (GSVA)(Hänzelmann et al., 2013). Specific colors represent different treatment conditions as indicated. A two-tailed unpaired Student’s t-test was used for statistical analysis.
C. Waterfall plot showing the gene ontology analysis of TRAP sequencing data PANTHER classification system. Signaling pathways were organized based on their false discovery rate (FDR).
D. Heatmap depicting expression changes in luminal and stemness-related markers from RPPA data. Parental cells (MCF7 and SCP2), and bone-entrained breast cancer cells (MCF7-Bo and SCP2-Bo) are compared. 4 biological replicates and 3 technical replicates were used for each cell line (See Supplementary Table 1).
E. Heatmap depicting expression changes in EMT/MET markers from RPPA data as describes in H.
F. Heatmap depicting expression changes in receptor tyrosine kinases from RPPA data as described in H.
G. Confocal images depiction a localized expression of EMT marker vimentin (red) proximally to the bone matrix in MCF7 and ZR75-1 IIA-induced bone metastases. E-cadherin expression (green) remained homogeneous in bone lesions. Keratin 8 (blue) was used to depict cancer cells from stroma.
H. Volcano plot showing epigenetic reprogramming of bone-entrained SCP2 cells based on differentially enriched peaks from ATAC sequencing analysis. A total of 2644 peaks were significantly altered in bone-entrained SCP2 (FDR ≤0.050).
I. volcano plot based on opened promotors identified by ATAC-seq analysis. FDR < 0.05 is highlighted in pink.
J. Pie chart depicting the genomic distribution of differentially altered peak between un-entrained and bone-entrained SCP2 cells.
K. Heatmaps and summary plots showing chromatin opening near the transcription start site TSS. 5000 bp before and after TSS are represented.
L. Genomic track showing peak variation in the ESR1 gene of parental and bone-derived SCP2 cells (SCP2-Bo). Images were generated using IGV. 3 majors peaks are highlighted to illustrate the reversibility of bone-microenvironment-induced chromatin changes in SCP2-Bo over multiple passages in vitro.
Unbiased hierarchical clustering of TRAP profiling results revealed that in the presence of MSCs the impact of endocrine perturbations became much less evident on ER+ cancer cells as reflected by diminished differences between fulvestrant- and tamoxifen-treated samples and control and estradiol-treated ones (Figure S5E). This supports our previous conclusion that MSCs blunted endocrine responses. We also validated that GJA1, the gene encoding connexin 43, was upregulated by MSCs in co-cultures and exhibited a strong inverse correlation with ER expression (Figure S5F), further indicating a role of gap junctions in down-regulating ER. However, conditioned medium of osteogenic cells also causes ER down-regulation and endocrine resistance (Figure S5G), indicating additional mechanisms based on paracrine signaling.
According to TRAP profiling, over 1,100 genes are significantly increased by MSC co-cultures (FDR < 0.05 and fold change > 2), which is a large number and indicates a global phenotypic alteration. Indeed, using PAM50 signatures, we observed a dramatic shift from luminal to basal subtype (Figure 5B). Consistently, examination of the 50 HALLMARK pathways in MSigDB uncovered several significant changes including the decrease of ER signaling and increase of epithelial to mesenchymal transition (EMT) and STAT3 signaling (Figure 5B), all of which indicated dedifferentiation and stem-like activities(Mani et al., 2008; Marotta et al., 2011; Pfefferle et al., 2015). PANTHER classification system identified a number of pathways overrepresented in the altered genes, including several related to epigenomic regulation of gene expression (e.g., PRC2 activity), stemness-related pathways (e.g., WNT and Notch signaling), and receptor tyrosine kinase (RTK) signaling (Figure 5C and S5H). Some of these pathways have previously been implicated in bone metastasis and therapeutic resistance (Andrade et al., 2017; Esposito et al., 2019; Sethi et al., 2011; Zheng et al., 2017). These findings indicate that the osteogenic microenvironment induces an epigenomic landscape alteration in ER+ breast cancer cells toward more ER-independent and stem-like states.
We used reverse phase protein arrays (RPPA) to molecularly dissect the impact of bone microenvironment that persists even after cancer cells are extracted. We compared the original MCF-7 parental cells and SCP2 with their derivatives that were extracted from bone lesions, which we named “bone-entrained” cells. The proteins and phospho-proteins that are significantly altered were isolated for careful examination (Figure S5I and S5J). The bone-entrained cells, compared to their corresponding controls, exhibited reduced ER signaling or luminal markers (Figure 5D), enhanced stemness (Figure 5D), increased mesenchymal properties (Figure 5E), and strikingly, increased RTK expression (Figure 5F). The most up-regulated protein in both bone-entrained MCF-7 and SCP2 cells are PDGFRβ (Figure S5J and S5J). Overall, these indicated a global phenotypic shift toward a more dedifferentiated status (Ginestier et al., 2007; Guo et al., 2012; Mani et al., 2008; Tam et al., 2013; Trastuzumab et al., 2013). Some proteins are expressed at significantly different levels between MCF7 and SCP2, and not altered in bone-entrained cells (e.g., Her3, E-cadherin and Kit), suggesting unique properties of SCP2 which may underlie its enhanced bone colonization capacity. Some other proteins, including PDGFRβ, FGFR1, EGFR, Her2, and c-Met, are significantly upregulated in bone-entrained MCF7 cells. A few of these proteins are already expressed at a higher level in SCP2 (e.g., Her2 and FGFR1), but many exhibited similar elevation in bone-entrained SCP2 (e.g., PDGFRβ, SOX9, pSTAT3, and Zeb1) (Figure 5D-5F). Taken together, the RPPA profiles suggested a mixed action of clonal selection and short-term adaptation during bone colonization.
One notable osteogenic cell-induced change is the acquisition of a hybrid EMT status (Figure 5E). To further explore this alteration, we performed simultaneous immunofluorescence staining of epithelial markers (E-cadherin and cytokeratin 8) and a mesenchymal marker (Vimentin). Interestingly, a small proportion of double-positive cells were observed, usually located at the border between metastases and surface of bone matrix, where osteogenic cells are located (Figure 5G). Thus, the interaction with osteogenic cells does not simply cause EMT to metastatic cells, but rather induce phenotypic plasticity and confer stemness.
Reversibility of epigenetic changes in bone-entrained cells
To better pinpoint the origin of phenotypic changes seen in bone-entrained cells, we evaluated chromatin accessibility following cancer cell exposure to the bone microenvironment, using ATAC-sequencing (Buenrostro et al., 2015). The differentially accessible regions (DAR) between un-entrained and bone-entrained cells were mostly decreased in bone-entrained cells (Figure 5H-5J), indicating a global shift in heterochromatin formation. This was further supported by a global decrease in chromatin accessibility at the genomic level (Figure 5K). Using ESR1 as an example, we identified several major peaks with reduced chromatin accessible in bone-entrained cells (Figure 5L). Interestingly, some of these repressed peaks (e.g. Peak 3) displayed reversibility over multiple passages of bone-entrained cells in vitro (Figure 5L and S5K). Thus, the epigenetic reversibility on the ESR1 gene supports the transient loss of ER in bone. Overall, these results argue for an epigenetic reprogramming of cancer cells exposed to the bone microenvironment.
FGFR and PDGFR pathways contribute to phenotypic changes in BMMs
Among all pathways altered in the bone microenvironment, PDGFRβ and FGFR1 pathways are of particular interest because of their specific implications in breast cancer biology. PDGFRβ exhibited the highest fold change in both models (Figure S5I and 5J) and was shown to determine the subtype of breast cancer and mediate cancer stem cell activities (Lehmann et al., 2011; Tam et al., 2013). Multiple FGF ligands and receptors were found up-regulated in human bone metastases compared to matched primary tumors (Priedigkeit et al., 2017). FGF signaling was also implicated in regulation of stem cell compartment in ER+ breast cancer (Fillmore et al., 2010). This previous knowledge prompted us to further investigate mechanistic links of FGFR and PDGFR signaling to the observed effects induced by the bone microenvironment. Using a literature-based network analysis platform (https://string-db.org/)(von Mering et al., 2005), we found that FGF2 connects ER, FGFR1 and PDGFRB (Figure 6A), suggesting a pivotal role of FGF2 in regulating ER downregulation and endocrine resistance.

A. Network depicting functional protein association between FGFR1, PDGFRB and ER using the STRING database. Kmeans clustering (k=3) was used to represent 3 major centroids (depicted as red, green, and cyan spheres) and their most closely associated proteins based on unsupervised data mining.
B. Graph showing the expression of all human 22 fibroblast growth factor (FGF) family proteins (FGF1-23) in osteogenic cells (FOB). RNA sequencing from each sample are presented in technical triplicate.
C. Representative confocal image of Alkaline Phosphatase (ALP) and basic fibroblast growth factor (FGF2/bFGF) in normal bone tissue. Nuclei is shown in blue (DAPI). Scale bar: 50µm
D. Representative confocal images showing decreased ER expression (yellow) in tumors established in FGF2 (green) enriched bone microenvironments. Keratin 8 (red) is used to identify breast cancer cells.
E. The scatter dot plot represents ER quantification from tumors according to FGF2 enrichment (Low and High) in adjacent stromal cells (n=3-4 samples). Mean expression is represented in blue. P-value represents a two-tailed unpaired Student t-test. The Gaussianized curve simulates ER distribution based on its nuclear intensity, and each peak representing the mean expression of ER.
F. Immunoblots depicting the inhibitory effect of recombinant FGF2 (20ng/ml) on ER expression in multiple breast cancer models including PDX HCI011. Cells were treated for 24h. ER expression is summarized in dot plots for 7 cell lines. Data represent normalized ER over β-actin protein expression from 3 separate immunoblotting experiments. Quantification was performed using imageJ. P-values represent unpaired student t-tests.
G. Histogram showing effect of FGF2 recombinant (20ng/ml) on MCF7 and ZR75-1 cell growth in 3D. n=6 technical replicates. P-values represent unpaired student t-tests.
H. Bone-In-Culture-Array (BICA) assay showing synergistic effects between 2.5µM FGF2 inhibitor (BGJ398) and 20nM fulvestrant in MCF7 and ZR75-1 models. n=6 technical replicates. P-values represent unpaired student t-tests.
I. Annotated barplot showing the association of histone modifications with basic FGF (FGF2) gene signatures using the Enrichr platform (https://amp.pharm.mssm.edu/Enrichr/). Processed ChIP-sequencing data was obtained from epigenomic roadmap project (Roadmap Epigenomics Consortium et al., 2015). Histograms represent the association score with FGF2 signaling. Signatures are sorted based on p-value ranking. Only p-values < 0.05 and <0.01 were shown for the top and bottom panel, respectively.
J. Immunoblotting showing alteration of EZH2 expression in multiple cells following a 24h treatment with 1µM pan FGFR inhibitor (BGJ398) or 20nM FGF2 recombinant (FGF2r). Actin-β was used as loading control, respectively. Primary cells generated from HCI011 (ER+ PDX) were cultured in 3D and treated with 1µM pan FGFR inhibitor (BGJ398) or vehicle for 24h. Representative images depict EZH2 expression in indicated conditions. Data was quantified using imageJ and normalized EZH2 expression was shown as dot plots. P-value represents a one-tailed unpaired Student t-test.
K. Dot plots indicating the effect of 20nM recombinant FGF2 on histone 3 lysine 27 trimethylation (H3k27me3) of multiple ER+ breast cancer models, based on quantified immunofluorescent images (n=3). Cells were cultures I 3D and image were acquired with a 40x oil objective lens. P-values represent One-tailed paired Student t-tests.
L. IF quantification of EZH2 expression in multiple metastases and primary tumor originating from the same mouse. 2×10⁵ MCF7 cells were transplanted to bone (via IIA-injection) and to mammary gland of nude mice, which led to tumor formation at multiples sites including lung, ovary, bone and mammary gland. Metastatic tissues were harvested for immunofluorescence quantification and shown as a dot plot graph. Mean expression of EZH2 is indicated in blue. P-values; unpaired Student t-tests.
M. Representative confocal images showing co-expression of ER (purple) and EZH2 (Green) in 3D monocultures and co-cultures (+FOB) models of MCF7 and PDX HCI011. Keratin 8 -K8 (red) and DAPI (blue) were used to identify epithelial cells and cell nuclei. Scale bars: 5oum.
N. Heatmap showing relative expression of nuclear ER and EZH2 in immunostained single cells from MCF7 and PDX HCI011. Cells were cultured in 3D mono or co-cultures with osteogenic cells (FOB). Keratin 8 -K8 (red) and DAPI (blue) were used to identify epithelial cells and cell nuclei. One way ANOVA was used for statistical analysis.
O. Dot plots showing IF quantification of EZH2 and ER in MCF7-derived bone micro- and macro-metastases. Micrometastases (micro) represent early stages while macrometastases (overt) represent advanced stages of bone metastasis. P-value represents a two-tailed unpaired Student t-test.
P. Quantitative PCR showing the effect of the EZH2 inhibitor EPZ011989 on ESR1 expression after 24 hours of treatment. n=4 cell lines. P-value represent two-tailed unpaired Student’s t-test between vehicle and EPZ011989-treated cells
Q. Reversility of epigenetic silencing of ESR1 gene based post-translational modification (PTM) analysis. The percent changes in H3k27me3 between parental cells (MCF7), SCP2 and bone-derived (MCF7-Bo and SCP2-Bo) over multiple passages in vitro (Passages: P0 to P10) is shown. P-values relatively to parental cells is shown for each sample. A connected scatter plot I used to depict passage-specific changes for MCF7 and SCP2 cells.
Indeed, FGF2 is the highest expressed FGF ligands by FOB cells (Figure 6B). Immunofluorescence staining of FGF2 on bone specimens revealed a positive correlation with ALP+ osteogenic cells (Figure 6C and S6A) and an inverse correlation with nuclear intensity of ER in BMMs (Figure 6D and 6E). Functionally, recombinant FGF2 treatment decreased ER expression in multiple cell lines (Figure 6F) including SCPs, and induced resistance to fulvestrant (Figure 6G). In contrast, a potent FGFR inhibitor, BGJ398, reversed fulvestrant resistance of ER+ cancer cells in BICA (Figure 6H).

A. Scatter plot showing Pearson correlation (r) between FGF2 and ALP-expression cells in mouse bone.
B. Immunoblotting showing the expression of PDGFRβ in parental (MCF7 and SCP2) and bone-entrained (MCF7-Bo and SCP2-Bo) cells. Histogram showing changes in PDGFRβ mRNA expression between parental and bone-entrained MCF7 and SCP2 cells. (n= 3 technical replicates)
C. Histogram showing the effect of direct cell-cell interaction between pre-osteoblast (FOB) and ER+ cancer cells on PDGFRb expression in cancer cells. FOB-derived conditioned media (CM) was used to evaluate the effect of paracrine factors on PDGFRβ expression.
D. Violin plot showing the effect of 20ng/ml PDGF recombinants (PDGF-BB, PDGF-CC, PDGF-DD) on bone-entrained MCF7 (MCF7-Bo) and SCP2 (SCP2-Bo) response to fulvestrant. BLI was assessed after 72h of treatment.
E. Histograms showing endocrine resistance promoting effect of PDGFs in 3D cultures of MCF7 and ZR75-1 cells. A two-way unpaired student t-test was used for statistical analysis.
F. Immunoblotting showing the effects of indicated PDGF recombinants on ER expression in MCF7 and ZR75-1 after 24h treatment.
G. Histogram showing normalized ER over β-actin protein expression from Immunoblot quantification as shown in E.
H. Violin plot showing the effect of the pan FGFR inhibitor (BGJ398), and the PDGFRβ inhibitor (sunitinib) on osteoblast (FOB)-mediated MCF7 and ZR75-1 cell growth in 3D.
I. Immunoblotting showing the promoting effect of FGF2 and PDGF-DD recombinants on histone 3 lysine 27 tri-methylation in homogeneous SCP2. Cells were treated with 20ng/ml recombinant for 24h.
J. Immunoblotting showing the effect of FGF2 and PDGF-DD recombinant on other histone modifications in SCP2 cells. Cells were treated with 20ng/ml recombinant for 24h as in H.
K. Quantitative PCR showing the promoting effect of Calcium on EZH2 expression in MCF7 cells (n= 3 independent experiments).
L. Box plot representing the gene set variation score (GSVA) of EZH2 target genes (Lu et al.) in MCF7 monoculture (MSC-) and co-culture with MSCs (MSC+) from TRAP-sequencing. Each color represents a specific treatment as indicated. Cells were cultured (estrogen-free medium) in 3D and treated with 10nM estradiol and fulvestrant, and 100nM tamoxifen for 24h.
M. Graph shows reductions in EZH2 target gene expression in MCF7 cells following 3D monoculture (-MSC) and co-culture (+MSC) and TRAP sequencing. EZH2 signature genes were selected from previous studies (Varambally et al., 2002).
N. Quantitative PCR of stemness-related genes in MCF7 cells from 3D monoculture and co-culture with FOB (osteoblast), human bone marrow (marrow), and U937 (osteoclast) cells. All conditions were FACS-sorted for RFP-labeled MCF7cells before mRNA extraction and qPCR.
On the other hand, PDGFRB is highly expressed in the bone-entrained cells at both protein and mRNA levels (Figure S6B). We found that direct interacting between cancer cells and osteogenic cells was required for PDGFRB upregulation (Figure 6C). Among all PDGF ligands, PDGF-DD, but not PDGF-BB and PDGF-CC, seemed to significantly promote the therapeutic resistance of bone-entrained (Figure S6D) and parental cells (Figure S6E), while down-regulating ER expression (Figure S6F and S6G). Like the inhibition of FGFR, the inhibition of PDGFR signaling by sunitinib also partially abolished the promoting effects of FOB cells on cancer cell growth in 3D co-cultures (Figure S6H), further supporting the important roles of both FGFR and PDGFR signaling in the interaction between cancer cells and the osteogenic niche.
Taken together, multiple RTK pathways may be activated in the bone microenvironment to mediate endocrine resistance.
The complicated impact of bone microenvironment converges on an EZH2-mediated phenotypic-shift of ER+ breast cancer cells
We next asked how the discovered pathways cooperate to influence the epigenomic landscape of ER+ bone micrometastases, and in turn silence ER and cause a luminal-to-basal phenotypic shift. Using the Epigenomic Roadmap database, we discovered that FGF2-regulated genes are predominantly enriched with tri-methylation of H3K27, and sensitive to perturbation of EZH2 (Figure 6I). This is consistent with the finding that PRC2 methyltransferase activity is enhanced in cancer cells co-cultured with MSCs (Figure 5G). Indeed, treatment of both recombinant FGF2 increased H3K27me3 and EZH2 expression in multiple models (Figure 6J-K and S6I), but do not significantly affect other H3 modifications (Figure S6J). Conversely, treatment of BGJ398 decreased EZH2 expression in 3D cancer-MSC co-cultures (Figure 6J). PDGF-DD could achieve similar effects (Figure S6I and S6J). Furthermore, it appeared that calcium signaling may also affect EZH2 expression at the RNA level (Figure S6K). Thus, the pathways that were discovered to downregulate ER seem to converge on the regulation of EZH2.
The downstream PRC2 target genes are concertedly downregulated by co-culturing of MSCs (Figure S6L and S6M). EZH2 is a reliable marker for cancer stemness (Kim and Roberts, 2016; Zhou et al., 2002). Consistently, a stemness signature exhibited markedly increased expression in co-cultures with osteoblasts and bone marrow cell including MSCs, but not with osteoclasts (Figure S6N). In addition, EZH2 expression appeared to be specifically enhanced in cancer cells residing in the bone microenvironment as compared to the same cancer cells in other organs (Figure 6L). Together, these data confirmed enhanced EZH2 activities in the bone microenvironment, which are mediated by interaction with osteogenic cells.
EZH2 has been shown to silence ER expression in previous studies (Reijm et al., 2011). Here, our study suggested a pivotal role of EZH2 in downregulating ER expression specifically in bone micrometastases. To validate the roles of EZH2, we carried out IF staining in 3D co-cultures and revealed that EZH2 expression inversely correlates with ER expression both in 3D cultures and in bone lesions at a single cell level (Figure 6M and 6N). The inverse changes of ER and EZH2 were also observed in vivo by comparing micrometastases and macrometastases (Figure 6O). Inhibition of EZH2 enzymatic activity by EZH2 inhibitor (EPZ011989) (Campbell et al., 2015) led to restoration of ER expression at the RNA level (Figure 6P).
EZH2 inhibition induced ER expression in a murine model, which is abolished by osteogenic cells in bone lesions
We set out to validate our findings in immunocompetent context. Most murine breast cancer cell lines are either ER negative or fail to response to endocrine therapy if ER+, thereby limiting the possibility to perform syngeneic experiments. This is a field-wide problem (Derose et al., 2011). However, some murine models express ER in early-stage of tumor progression (e.g., MMTV-PyMT) (Lin et al., 2003; Medina et al., 2002). AT3 is a cell line derived from MMTV-PyMT (Guy et al., 1992). We reasoned that it might express ER at some stage of its life history, and examined if EZH2 inhibition could restore ER expression in AT3. Indeed, the treatment of EZH2 inhibitor increased ER expression to a level exceeding the threshold defining ER+ tumors mammary (Figure 7A, 7B and S7A). Although the re-expression of ER may not restore downstream estrogen signaling, it recapitulated upstream regulation of ER expression by EZH2. Therefore, we went on to determine how the aberrant expression of ER in AT3 cells might respond to the bone microenvironment. After IIA injection, ER expression in AT3 was lost again in syngeneic mice, and this loss was especially pronounced in regions adjacent to bone matrix (Figure 7C and 7D). Importantly, inducible depletion of osterix-expressing osteoprecursor cells (and therefore also their decedent osteoblasts) abolished the loss of ER (Figure 7C and 7D). Taken together, these data validated our findings that the osteogenic cells suppress ER expression in the bone microenvironment.

A. Dot plot showing increased ER expression in orthotopic tumors deriving from EPZ011989 pre-treated AT3. AT3 cells were pre-treated for 2 weeks with 1uM EPZ before mammary fat pad transplantation. Orthotopic tumors were collected 10 days post-transplantation. A two-tailed Student t-test was used for statistical analysis.
B. LOEWE analysis of fulvestrant and EZH2 inhibitor (EPZ011989) combination in 3D co-culture of mammary gland-entrained (MCF7-Ma) and bone-entrained (MCF7-Bo) MCF7 cells. Graphs were generated using the Combenefit interactive platform (Di Veroli et al., 2016).
C. Representative Bioluminescence (BLI) and microCT images from EPZ011989 and fulvestrant pre-clinical experiment. Scatter plot with Pearson correlation reveals a strong correlation between BLI and microCT for the detection of bone metastasis. P-values: two-tailed paired sample t-test.
D. Representative microCT and H&E images from different treatment conditions as indicated, and a scatter plot between both approaches for the detection of bone metastases. P-values: two-tailed paired sample t- test.
E. Diagram showing experimental procedures and treatment conditions used to assess therapeutic effects of EZH2 inhibitor (EPZ011989) on spontaneous metastases of HCI011 PDXs when used in combination with fulvestrant.

A. Design to evaluate ER loss in syngeneic murine models. AT3 cells were pre-treated with EZH2 inhibitor (EPZ011989) for 2 weeks before being transplanted to bone of wild-type or osterix-depleted C57BL/6 mice (Osx-creERT2 ROSA-LoxP-DTR).
B. IHC staining depicting increased in ER expression orthotopic tumors derived from EZP011989 pretreated AT3 cells.
C. IHC staining of ER in bone metastasis models presented in A.
D. Dot plots showing ER expression in IIA-induced AT3 bone metastasis control (WT-mice) and osteoprogenitor-depleted (osx-cre) mice. P values: two tailed paired Student t Test.
E. Progression free survival (PFS) curve of bone metastases following single agent treatment or combination treatment with EZH2 inhibitor EPZ011989 and ER inhibitor fulvestrant. Four different groups were randomly formed for treatment. Group #1: vehicle-treated (veh/Veh). Group #2: EPZ011989-pretreated for 3 weeks followed by vehicle treatment (EPZ/Veh). Group #3: vehicle-pretreated followed by fulvestrant treatment (Fulv). Group #4: combination treatment consisting of EPZ011989-pretreatment followed by fulvestrant treatment (EPZ/Fulv). EPZ011989 was used as a neoadjuvant for 3 weeks (125mg/kg; oral gavage; twice a day) before fulvestrant treatment (250mg/kg; subcutaneous injection, once per week for 2 weeks). Representative bioluminescence images showing beneficial effects of combination treatment (fulvestrant and EPZ011989) on IIA-induced bone metastases.
F. Representative microCT and H&E images depicting tumor burden after pre-clinical experiment described in E. All groups revealed bone metastasis formation except for combination treatment group (EPZ > Fulvestrant).
G. Growth curve showing the effect of EPZ011989 pretreatment on the fulvestrant response of endocrine resistant ZR75-1 bone metastases. Single agent and combination treatment groups are shown in blue and red, respectively. Multiple ANOVA was used for statistical analysis. The bioluminescence intensity of metastatic burden at week 8 was shown as dot plot. P-values: two tailed unpaired Student t Test.
H. Representative PET-CT images showing 18F-FDG uptake in spontaneous bone metastases following single agent (fulvestrant) and combination (EPZ011989 + fulvestrant) treatment. 2×10⁵ dissociated tumors cells from freshly harvested PDXs (HCI011) were injected to mammary gland of nude mice. A week after primary tumors were removed, EPZ011989 treatment (125mg/kg; oral gavage; twice a day) started for 3 weeks, followed by fulvestrant treatment (250mg/kg; subcutaneous injection, once per week) for 2 weeks. Residual tumors were challenged with estrogen supplementation in drink water before PET-CT imaging. 18F-FDG uptake (mean SUV-bw) in hind limbs was quantified to evaluate spontaneous metastasis from HCI011 PDXs. A 90% thresholding of the maximum standard uptake value (SUV-bw) was used to remove background signals. Two-tailed unpaired Student’s t-test was used for statistical analysis.
I. Graphical abstract illustrating the mechanisms involved in breast cancer bone metastasis and endocrine resistance. While most ER+ breast cancer cells do not survive the bone microenvironment, cells that disseminate to the osteogenic niche increase their odds for survival. Herein, we found that the osteoblast-secreted FGF2 leads to a local enrichment of FGF2 which amplifies FGFR signaling in a paracrine manner, leading to a transient induction of EZH2 expression and a global epigenetic reprogramming in cancer cells. As a result, micrometastases acquire stemness features with decreased expression of estrogen receptor (ER), all of which promote estrogen-independent growth of micrometastases. Calcium signaling also contributes to this phenotypic adaptation of micrometastasis by affect EZH2 expression. Additionally, the direct interaction of cancer cells with osteoblasts induces PDGFRB expression, another marker of stemness maintenance which persists outside of the bone microenvironment. However, the gradual loss of proximity between osteoblasts and cancer cells, and the recruitment of other stromal cells (e.g. osteoclasts) during macrometastasis formation results in ER re-expression that may associates with partial sensitivity to endocrine therapy in overt bone metastasis. Overall, we demonstrate a phenotypic plasticity of ER+ breast cancer which is driven by the bone microenvironment in both temporal and spatial manner.
Short-term inhibition of EZH2 restores sensitivity of bone micrometastases to endocrine therapies
Since EZH2 mediates bone microenvironment-induced endocrine resistance, we hypothesize that inhibition of EZH2 should reverse this resistance and synergize with endocrine therapies. Using the EZH2 inhibitor EZP011989, we confirmed our hypothesis in vitro using bone and mammary gland-entrained MCF-7 cells. The synergy is especially strong on bone-entrained cells (Figure S7B). We also conducted in vivo experiments to test this hypothesis. A four-arm experiment was used to specifically ask if combinatory treatment of EPZ011989 and fulvestrant at the microscopic metastasis stage (to mimic adjuvant therapy) could lead to decreased bone colonization. EPZ011989 and fulvestrant had little to modest effects when used as single agents. However, the combined treatment strongly inhibited bone colonization and rendered 50% of animals tumor-free by the end of experiment based on assessment of bioluminescence signals (Figure 7E), which was subsequently validated by micro-CT (Figure 7F, S7C, and S7D). This is a remarkable effect considering that EPZ011989 treatment only last for 3 weeks. EPZ011989 treatment also sensitized ZR75-1 bone lesions to fulvestrant treatment (Figure 7G). Finally, we tested the combinatory treatment on PDX-based spontaneous bone metastasis models using PET imaging. Pretreatment of mice with EPZ011989 inhibited spontaneous metastasis to bone as shown by the reduced 18F-FDG update (Figure 7H, S7E).
DISCUSSION
Phenotypic plasticity has been increasingly recognized as a major driving force of normal development, tumor initiation, and tumor progression (Dravis et al., 2018; Gupta et al., 2019; Lambert et al., 2017). In this study, we have uncovered that the osteogenic cells trigger a global epigenomic change in ER+ metastatic seeds through both paracrine signaling and direct cell-cell contact. Importantly, this global change represents an adaption to the bone microenvironment, and leads to increased phenotypic plasticity and therapeutic resistance. These changes form a transient and reversible effect on cancer cells, even those that are genetically homogeneous, which distinguishes this process from clonal selection, which has been intensively investigated in the past (Bos et al., 2009; Kang et al., 2003; Minn et al., 2005). Indeed, our data support a coordinated action between epigenomic adaptation and genetic selection. Specifically, genetic traits (e.g., expression of FGFR1) may determine the capacity of a cancer cell to undergo further epigenomic alteration (e.g., up-regulation of PDGFR and EZH2). Moreover, our findings were supported by ER+ PDX models of bone metastasis, which remains unprecedented to our knowledge.
Our study identified a number of pathways that are altered in cancer cells by the bone microenvironment. Among these pathways, EZH2-mediated epigenomic reprogramming is a leading candidate for therapeutic intervention. It integrates multiple signals from osteogenic cells (e.g., FGF2 and PDGF-DD), and in turn, broadly impacts several downstream pathways related to cancer stemness and metastasis (e.g., WNT and Notch)(Gonzalez et al., 2014; Shi et al., 2007). Moreover, potent and selective EZH2 inhibitors are available and being clinically investigated in other diseases (Italiano et al., 2018), making it relatively easy for future clinical applications. Pharmacological inhibition of EZH2 promotes a global landscape change of histone marks (Huang et al., 2018). Tumors developed resistance to histone demethylase KDM5A/B had increased EZH2 expression (Hinohara et al., 2018). Hence, the bone microenvironment induction of EZH2 in BMMs may trigger an epigenomic disturbance beyond H3K27me3.
The loss of ER expression during bone metastasis appears to be transient. In the advanced stage when the osteolytic vicious cycle starts (Boyce et al., 1999; Kozlow and Guise, 2005; Weilbaecher et al., 2011), ER expression seems to recover, which might be caused by the opposite effects of several other cell types that are recruited to metastases later. The positive spatial correlation between RANK and ER supports this possibility. However, the microenvironment-conferred endocrine resistance may persist in some cases. Thus, overt bone metastases may be heterogeneous, including a subset whose ER signaling remains repressed, which may be responsible for rapid reappearance of resistance. This possibility is supported by our initial observation in spontaneous bone metastasis from PDX tumors (Figure S1A). Alternatively, endocrine resistance may be driven by additional ER-independent mechanisms, and therefore, recovery of ER cannot fully restore sensitivity. In either case, overt bone metastases may be ER+ and partially sensitive to endocrine therapies, but resistance can quickly develop – a phenomenon mimicking the clinical reality (Johnston, 2010).
Unlike FGFR1 which is expressed at a higher level in some SCPs before reaching the bone, PDGFRB expression appears to be activated by the bone microenvironment. Functionally, PDGFRB was shown to mediate stem cell-specific signaling and drive stroma-induced subtype-shift (Roswall et al., 2018; Tam et al., 2013). Here, our data suggest that it contributes to phenotypic plasticity and endocrine resistance. It might also be used as a cell surface marker of cancer cells ever lodged to the bone. Similar approaches may be applied to identify markers of epigenetic imprints on metastatic cancer cells in other organs. Ultimately, this information may allow us to predict the location of metastasis by examining these imprints on CTCs.
Although our experiments focused on bone metastases, we are not ignoring the fact that other metastases also need to be prevented and cured. Recent genomic analyses revealed frequent metastasis-to-metastasis seeding (Brown et al., 2017; Ullah et al., 2018), suggesting that bone may not be the final destination for cancer cell dissemination. In fact, over two-thirds of bone-only metastases subsequently develop other metastases (Coleman, 2001). The finding that stem cell signaling is elevated in the bone microenvironment actually raises the possibility that bone may invigorate disseminated tumor cells for further metastases, and this possibility has recently gained support in our co-submitted manuscript (Zhang et al., 2019). Therefore, investigations on bone metastasis may have broader impact.
Author contributions
Conceptualization, I.B., G.M.W., H.S, H.W., P.S, and X.H.-F.Z.; Methodology: I.B., H.W., P.S., W.Z., Z.X., Z.G., Z.L., Y.W., J.L., W.U., H.C.L, A.M., M.J., I.K., S.S., A.G., P.Si., H.S., G.M.W., R.C., M.J.E., X.H-F.Z; Software and Data Curation, I.B., H.W., Z.L., Y.W., J.H., L.L, H.H.J., and X.H-F.Z. Resources, M.J.E, and X.H.-F.Z.; Writing-original Draft: I.B., and X.H.-F.Z.; Writing – Review & Editing, I.B., H.W., W.Z., and X.H.-F.Z.; Visualization, I.B. and X.H.-F.Z.; Project Administration, I.B., J.L. and X.H.-F.Z.; Supervision and Funding Acquisition, X.H.-F.Z.
Declaration of Interests
The authors declare no competing interests
STAR Methods
CONTACT FOR REAGENT AND RESOURCE SHARING
Further information and requests for resources or reagents should be directed to the lead contact Dr. Xiang H.-F. Zhang at xiangz{at}bcm.edu
Animal studies
All animal experiments were in compliance with Institutional Animal care and Use Committee of Baylor College of Medicine. Nude mice [Athymic Nude-Foxn1nu] and Scid/Beige mice [C.B-17/IcrHsd-Prkdc scid Lyst bg-J] were purchased from Envigo. Osx1-GFP-cre/iDTR was generated from Osx1-GFP-cre [B6.Cg-Tg(Sp7-tTA,tetO-EGFP/cre)1Amc/J] and STP-iDTR mice [C57BL/6-Gt(ROSA)26Sortm1(HBEGF) Awai/J] originally obtained from Jackson Laboratory.
Patients derived xenografts (PDXs) and Primary cells
ER+ PDX models were kindly provided by Alana L. Welm (HCI011) and Matthew Ellis (WHIM9). All PDXs were maintained in SCID/Beige mice. PDX-HCI011 primary cell line was successfully generated from freshly harvested orthotopic tumors in RPMI medium supplemented with 15-20% FBS, 1X antibiotics Penicillin/Streptomycin and 1X antimycotic Amphotericin (Gibco#15240062). Media was changed every 48 hours.
Cell lines
Human estrogen receptor positive (ER+) breast cancer cell lines MCF7, T47D, MDA-MB-361 and ZR75-30, pre-osteoblast cells hFOB-1.19, mesenchymal stem cells MSC, pre-osteoclast U937, and the mouse pre-osteoblast MC3T3-E1 were purchased from American Type Culture Collection (ATCC). The Human ER+ breast cancer cell line ZR75-1 was kindly provided by Dr. Rachel Schiff. MCF7 sub-clonal populations SCP1, SCP2, SCP3, and SCP4 were generated from single clones of parental MCF7 cells. The mouse cell line AT3 was a kind gift of S.I. Abrams at Roswell Park Cancer Institute.
Ovariectomy and aromatase inhibition
Mouse ovaries were removed using the previously described surgical procedure (Ström et al., 2012). Briefly, mice were anaesthetized with 2% isoflurane, and placed on a temperature-regulated heat pad. The dorsal area covering the lumbar vertebrae was shaved to display a 3×3 cm and disinfected. A 1 cm mid incision was performed on the skin and a 0.5 cm incision in the peritoneum allowed access to the ovary. Each ovary was cauterized, removed and peritoneum closed using an absorbable suture (Ethicon Vicryl #J497G). Skin closure was completed using EZ clips (Stoelting # 59027) and mice were monitored for recovery. Paracrine estrogen was blocked with oral administration of 0.5mg/kg Letrozole as previously described (Brodie et al., 2005).
Intra-Iliac-Artery (IIA) and mammary fat pad (MFP) injections
Intra-iliac-artery (IIA) injection was performed as previously described (Yu et al., 2016). Breast cancer cells were trypsinized, pelleted, washed twice with PBS, collected in cold PBS and kept on ice. For established breast cancer cell lines such as MCF7 and ZR75, 5×10⁵ cells were injected into the internal iliac artery to generate bone lesions. For PDX models, 2×10⁵ cells were injected except when specified otherwise. For the syngeneic and aggressive model AT3, 1×10⁵ cells were injected. Mammary fat pad (MFP) injections was performed as previously described (Zhang et al., 2019). Cells were prepared as for IIA injection. For all xenograft models except for the spontaneous metastasis from PDX-HCI011 (figure 7), estrogen was provided through drink water to reduce deleterious side effects. Based on previous studies, 8µg/ml of 17-β-estradiol was added to mouse water bottles and replaced twice a week (Levin-Allerhand et al., 2003; Welsch et al., 1981). In experiments involving dual IIA and MFP injections as in figure 1D, the same cell number was injected to bone and mammary gland, respectively.
Spontaneous metastasis from PDX models
To evaluate spontaneous metastases from PDX-HCI011, Foxn1nu mice were orthotopically transplanted with 5×10⁵ cells from freshly dissociated and purified tumor (Mouse Cell Depletion Kit; miltenyibiotec #130-104-694). Estrogen pellets were subcutaneously implanted to increase the tumor take rate. When tumors reached 1×1 cm, a survival surgery was performed to remove both the primary tumors and the remaining estrogen pellets. A three-week treatment with vehicle or EPZ011989 (125mg/kg; oral gavage; twice daily) was started two weeks after orthotopic tumor removal. Then, 250mg/kg of fulvestrant was administered weekly via subcutaneous injection to both EPZ011989- and vehicle pretreated groups for 3 consecutive weeks. Mice were monitored for 3 months before 18F-Fluorodeoxyglucose positron emission tomography (PET) and computed tomography (CT) scans were performed.
Drug treatments
In vivo: The selective estrogen receptors degrader (SERD) fulvestrant (Selleckchem #S1191) was solubilized in 5% DMSO and 95% corn oil and administered subcutaneously at 250 mg/kg per mouse, once a week for 2 consecutive weeks. Letrozole was purchased from Selleckchem (#S1235), diluted in 0.5% Sodium carboxymethyl cellulose (NaCMC), and administered at 0.5mg/kg via oral gavage. EPZ-110989 was kindly provided by Epizyme and stock solutions were prepared following the company’s recommendations, using 0.5% Sodium carboxymethyl cellulose (NaCMC) and 0.1% Tween-80 as vehicle. A dosage of 125 mg/kg of EPZ-011989 or vehicle was administered twice daily by oral gavage for 3 weeks.
In vitro: Tamoxifen and fulvestrant were used in vitro at a contration of 100nM and 20nM per well, respectively. 1-4uM EPZ011989 was used for coculture experiments. For calcium signaling studies, we used 1uM of GAP19 (cat#5353) to inhibit gap junction (CX43), and 1umM of FK506/Tacrolimus (cat#S5003) to block calcineurin. Similarly, 2.5 µM BGJ398 (selleckchem #S2183) and 10 µM Sunitinib (Selleckchem #S7781) were used to inhibit FGF receptors and PDGFRB, respectively.
METHOD DETAILS
Immunohistochemistry, Immunofluorescence and immunoblotting
IHC/IF: Tissues were processed with the help of the Breast Center Pathology core at Baylor College of Medicine. Immunohistochemistry staining and immunoblotting were performed using antibodies against human ERα (D8H8 and 6F11), Progesterone receptor (H-190), EZH2 (D2C9), Cytokeratin 8 (TROMA-I), α-Smooth Muscle Actin (D4K9N), Vimentin (D21H3), RANK (64C1385), ALP (ab75635), FGF2 (C2, #sc-74412), CD31 (AF3628), PDGFRβ (28E1), H3K27me3 (C36B11). Western blot: Proteins extraction was performed using RIPA buffer as previously described(Rajapaksa et al., 2015). Proteins electrophoresis and transfer were performed using the XCell SureLock and the iblot system (Invitrogen), respectively. Immunoblotting was performed by using antibodies against Estrogen Receptor α (D8H8), cytokeratin 19 (BA-17), Red Fluorescent Protein (Rockland-Fisher), and β-actin (8H10D10), H3K27me3 (Millipore Cat# 07-449), H3K27Ac (D5E4), H3K36me3 (D5A7), H3K9me3 (D4W1U), H4K20me3 (D84D2), H3K4me3 (C42D8), Histone 3 (D1H2). Images were captured using the Odyssey system (Li-cor).
Image acquisition and quantification
Images were acquired with the Leica TCS SP5 or the Zeiss LSM 880 with Airyscan FAST Confocal Microscope. A 40X objective was used to capture images for immunofluorescence quantifications except when specified otherwise. We compared only sets of images that were captured under the same microscopic setting. To further reduce technical biases and batch effects, compared samples were in most cases processed and stained in parallel. All images were quantified using ImageJ 1.52i.
Tumor classification
Based on size: metastases were classified based on cell number. In average, micro-metastases were defined as lesions below 100 cells. The average maximum cell number from all model combined was 142 for macrometastases (Large lesions) and 87 for micrometastases (small lesions) which gives a fold change superior to > 1.5 between the two experiments stages of metastasis. The tumor size between different models (HCI011, WHIM9, MCF7, ZR75-1 and SCP2) of bone metastasis was variable due to differences in tumor aggressiveness.
Accordingly, we used the fold change (1.5 +/− 0.2) as a more consistent variable to segregate tumors into micrometastasis and macrometastasis. Based on location: cancer cells were classified as proximal if they were directly interacting with the bone matrix or separated from it by less than two cells (≤2 cell distance), or classified as distal if separated from the bone matrix by 3 cells or more (≥3 cell distance).
Recombinant protein and calcium treatments
All experiments involving protein recombinants were performed in low serum media (2% serum). Protein recombinants for FGF2 (#130093838), PDGF-BB (100-14B), PDGF-CC (100-00CC), PDGF-DD (1159-SB-025) were diluted in PBS and used at a concentration of 20 or 100ng/ml. To evaluate the endocrine resistance attribute of FGF2 and PDGF recombinants, cells were starved for 48 hours in 2% charcoal stripped media before a 20nM fulvestrant treatment. All experiments involving cells growth were performed in 3D culture and bioluminescence was assessed 72h post treatment. For western blot, short term treatments were performed for 24 hours and long-term ones were up to 72 hours. Western blot experiments were performed in 2D in most cases, except when specified otherwise. Calcium treatment: 2×10⁶ cells (MCF7 or ZR75-1) were cultured in regular medium for 24 hours. Regular medium was replaced with calcium-free minimum essential medium (S-MEM) and treated with vehicle or 2 mM Calcium chloride for 24h. After collecting all cells, we extracted protein lysates to assess the effect of calcium on ER expression by western blot.
Live imaging
For in vivo experiments, all cells were pre-labelled with Luciferase fused to GFP or RFP as previously described (Wang et al., 2015). 5×10⁵ breast cancer cells were injected in bone or mammary fat pad, except when specified otherwise. Tumors growth was monitored using the IVIS Lumina II system. Briefly, mice were anesthetized in isoflurane chamber (2%) and 100 µl of D-Luciferin was administered through retro-orbital injection to each mouse before image acquisition. For in vitro experiments, 10,000 cells were plated in low attachment 96 well plates to assess cell growth at 72 or 96 hours post-treatment. For conditions demanding estrogen depleted media and starvation, 20,000 cells were cultured per well. Images were acquired after adding 1X concentration of D-luciferin containing media to each well.
Reverse phase protein arrays (RPPA)
MCF7 and SCP2 cell lines were injected to bone using intra-iliac artery injection. After 5 weeks of metastasis formation, bones were collected in aseptic conditions and dissociated to generate bone-entrained MCF7-Bo and SCP2-Bo cell lines. Cells were cultured in DMEM 10% FBS supplemented with 1X antibiotics (penicillin, streptomycin) and antimycotics (Amphotericin). Bone-educated cells were FACS-sorted and maintained in 2D culture. Approximately 5×10⁶ non-entrained and bone-entrained MCF7 and SCP2 cells were harvested in freshly prepared RPPA lysis buffer containing protease and phosphatase inhibitors. Protein lysate was cleared twice via centrifugation (14,000g for 15min at 4°C). A BCA assay was adopted for protein quantification (ThermoFisher #23225). All samples were diluted in RPPA solution and SDS to a final concentration of 0.5mg/ml and heated for 8min at 100°C for protein denaturation. RPPA was performed as previously described (Welte et al., 2016). In brief, samples and control lysates were spotted onto nitrocellulose-coated slides (Grace Bio-labs; array format of 960 lysates/slide or 2880 spots/slide). The automated slide stainer Autolink 48 (Dako) was used to probe 236 antibodies (against total and phosphor-proteins) on slides. Control slides were incubated with antibody diluent. A biotinylated secondary antibody was probed by streptavidin-conjugated IRDye680 fluorophore (LI-COR Biosciences) and total protein was detected with Sypro Ruby Protein Blot Stain according to the manufacturer’s instructions (Molecular Probes). All slides were scanned on a GenePix 4400 AL scanner and images were analyzed with GenePix Pro 7.0 (Molecular Devices). Samples were normalized as previously described (Chang et al., 2015). After quality control 233 antibodies remained and were used for subsequent data analysis.
PET/CT Imaging and Analysis
Radiopharmaceuticals and Small-Animal PET-CT
Flourine-18 labeled fluorodeoxyglucose (18F-FDG), fluoroestradiol (18F-FES), and sodium fluoride (18F-NaF) was purchased from (Cyclotope, Houston, TX). All CT and PET images were acquired using an Inveon scanner (Siemens AG, Knoxville, TN). The mice were injected with 9.25 MBq (250 µCi) of FES and 11.1 MBq (300 µCi) of either 18F-FDG or 18F-NaF radiotracers at any given time. To identify skeletal metastases or measure tumor metabolic activities, 18F-NaF or 18F-FDG were injected intra peritoneally, and to measure estrogen activity 18F-FES was injected intravenously via tail vein. Before 18F-FDG administration, the mice were fasted for approximately 12 hours. PET and CT was performed one hour after injection of radioisotopes. During imaging, a respiratory pad was placed under the abdomen of the animal to monitor respiration (Biovet, Newark, NJ). Mice were anesthetized with isoflurane gas (1-3%) mixed with oxygen at a flow rate of 0.5-1 L/minute, and adjusted accordingly during imaging to maintain normal breathing rates. A CT scan was acquired with the following specifications: 220 acquired projections except for the 18F-NaF imaging which was 360 full scan. Each projection was 290 ms with x-ray tube voltage and current set at 60 kVp and 500 µA, respectively. A 30-minute PET scan was immediately acquired afterward. The PET scans were reconstructed using OSEM3D reconstruction method and registered to the CT scan for attenuation correction. PET Image Analysis: The PET images were quantified using Inveon Research Workspace IRW (IRW, Siemens AG, Knoxville, TN). Using the reconstructed PET scan, bone (hind limbs) and mammary fat pads were manually selected to form regions of interest (ROI) on the PET-CT images. Activity measurements (Bq/cm3) were divided by the decay-corrected injected dose (Bq) and multiplied by 100 to calculate tissue uptake index represented as percentage injected dose per gram of tissue. The data was represented as standardized uptake value (SUV) normalized to body weight. For PDX spontaneous metastasis to bone, a 90% SUVmax thresholding was applied to ROI.
microCT imaging and analysis
A microPET/CT scanner (Siemens Medical Solutions USA, Inc; Malvern, PA; USA) was used to acquire microtomography images. Paired murine hindlimb specimens with bone metastasis were imaged with a spatial resolution of 20 microns. Images were converted to Dicom format using Inveon software (version 4.2; Siemens) and bone analyses (volume and mineral density) and three-dimensional reconstruction/visualization performed using Skyscan CTAn and CTVox software packages by Bruker (version 1.19 and 2.3.2; Kontich; Belgium).
Mammosphere and coculture assays
5×10⁵ cells were plated in low attachment 6 well plates (Greiner) using regular (10% FBS) of serum free DMEM/F12 media supplemented with 2-3% dextran-coated Charcoal stripped. We used a 1/1 ratio for cocultures between cancer cells and stromal cells except when specified otherwise. Cells were collected after 24, 48 or 72 hours of culture for downstream analyses. For immunofluorescence, cells were fixed with 2% PFA for 24 hours, washed 3 times with PBS, embedded in paraffin, and sectioned for imaging.
Quantitative real-time PCR
Total RNA was extracted using the Direct-zol Zymo according to the manufacturer protocol. Copy DNA was synthesized using the iScript cDNA Synthesis Kit (Biorad). All primers are indicated in supplementary table. Real-time PCR was performed on the CFX connect system (Biorad) using PowerUP SYBR Green master mix (ThermoFisher, #A25780) for amplification.
Bulk ATAC sequencing (ATAC-seq) and analysis
ATAC-seq Assay: ATAC-seq was performed as previously described (Buenrostro et al., 2015). Here, we collected 50,000 cells from parental (SCP2) and bone-entrained (SCP2-Bo) cells at different passages (#2, #4, #6 and #12). DNA transposition was performed on freshly collected cells using the Nextera Tn5 Transposase from Illumina. Purified DNA was stored at −80 for each passage before library preparation. All experiments were performed in parallel in both parental and bone-entrained cells.
ATAC-seq Analysis
Peak Generation Pipeline
Analysis was conducted with a modified version of the Encode Consortium’s ATAC-Seq Pipeline. Adapters were trimmed from input FASTQ files using cutadapt. Alignment was performed using Bowtie2. Samtools and Picard were used for post alignment filtering to remove duplicate, unmapped, and mitochondrial reads. Pseudo-replicates were generated for both individual replicates and pooled replicates by randomly dividing the input into two equal length files. The MACS2 peak caller was utilized to generate peaksets for all true replicates and pseudo replicates. Peaks with p-value less than 10-5 were retained for further analysis. Peaks in the Encode DCC consensus blacklist regions were also removed. Then, pairwise comparisons between each pair of biological replicates, the two pseudo-replicates generated from the pooled replicate file, and pseudo-replicates generated from each replicate were conducted. The Encode IDR (irreproducible discovery rate) was used to rank the consistency of each peak region; only peaks with IDR<0.05 were retained. Further analysis was conducted using the overlap IDR thresholded peaks between pooled pseudo-replicates.
Post-peak analysis
A consensus peakset was then generated by merging all the peak regions for the samples of interest using BedTools (Quinlan and Hall, 2010). Promoter regions were retrieved from the UCSC genome browser and were defined as 5000 bases up and 1000 bases down from the TSS. Heatmaps and profile plots for the peak and promoter regions were generated using the DeepTools (Ramírez et al., 2014) utility. The IGV (Thorvaldsdóttir et al., 2013) utility was utilized to generate visualizations for specific gene regions. Further analysis utilized the DiffBind (Stark and Brown, 2011) suite to identify differentially accessible regions (DAR). Both promoter and consensus peak regions were used as peaksets for occupancy and differential binding affinity analysis. DiffBind utilizes DeSeq2 to identify and calculate log fold change and p-values for DAR. Contrasts were established between the MFP parental and Bone-MFP samples and the SCP and Bone SCP samples while controlling for passage number as a confounding factor. DiffBind was also used to generate the PCA and Volcano Plots. DAR generated from Diffbind were then labelled with genes based on the nearest TSS using HOMER(Heinz et al., 2010). HOMER’s findMotifGenome module was also utilized to conduct motif analysis. The input file consisted of regions with lower binding in Bone-SCP compared to SCP with an FDR cutoff of <0.05. A region size of 200 and the masked genome setting were used. All other settings used the default HOMER options.
Whole exome sequencing (WES)
WES library was prepared using the Nextera DNA exome kit (Illumina # 20020616) per manufacturer’s instructions and sequenced on a Novaseq 6000 platform at ∼100x depth (paired end 100bp, 50 million reads per sample). FastQC and mulitQc were used for quality control. After adaptor removal using cutadapt and trim galore, reads were aligned to reference genome (hg19) using BWA-MEM. BAM files were filtered, and duplicate reads removed using samtools (Li et al., 2009) and Picard. A normal whole exome sequencing sample was downloaded for 1000-Genomes (ERR031938), aligned to the reference genome (hg19), and downsampled (http://broadinstitute.github.io/picard/). We generated pileups from BAM files using samtools mpileup. Varscan 2 was used to call copy numbers and somatic mutations (Koboldt et al., 2012, 2013). Only variant calls with p-value < 10-2 were used for downstream analyses. Data processing was performed on public server (Afgan et al., 2018). To evaluate the heterogeneity and subclonality of all SCP cells, we used the Expands package (http://cran.r-project.org/web/packages/expands). For each sample, a Z-score analysis was performed using the matrix of predicted subpopulation. Dominant subpopulations with a positive Z-score were used to assess tumor heterogeneity represented by pie charts.
Histone Protein post-Translational Modification (PTM) analysis
Un-entrained (MCF7 and SCP2), cells directly purified from bone (Passage 0: P0), and cells purified from bone and cultured in vitro for 10 passages (P10). Each sample was washed 3 times with PBS and snap frozen pellets were shipped to Active Motif for PTM quantitation (www.activemotif.com). Briefly, a pilot study was performed to determine the optimal histone extraction method for the client’s samples. Using the additional 6 samples, three lysis methods were evaluated: 1) A one-step method wherein histones are acid extracted directly from the frozen cell pellet, 2) A two-step method using a sucrose based hypotonic buffer is used to lyse the cells and histones acid extracted from isolated nuclei, or 3) A two-step method using an IGEPAL containing hypotonic buffer is used to lyse the cells and histones acid extracted from isolated nuclei. Acid extraction was performed for two hours at 4 °C, cellular debris was pelleted, and lysate aliquots were frozen in a methanol-dry ice bath and stored at - 80 C until testing. Histone yields for the three methods were evaluated using the Histone H3 Total bead and a two-fold five-point dilution series of the samples. The IGEPAL - containing hypotonic lysis buffer method gave the highest yield and was selected for use with the experimental samples. Lysate Preparation: Histones were extracted from the experimental samples using the method described above. Cellular debris was pelleted, and lysate aliquots were frozen in a methanol-dry ice bath and stored at - 80°C until testing. Next relative histone H3 concentrations in the samples was determined using the H3 Total bead. Multiplex assays were performed with the beads of interest using sample volumes normalized for histone H3 concentration. Assay protocol: 1) Beads were added to wells in 25 µl Assay Buffer supplemented with Inhibitor Cocktails (ABIC) for proteases, phosphatases and HDACs. 2) Samples as a four-point 1.4 dilution series were added to wells in 25 µl ABIC in duplicate and incubated for 1 hour at room temperature. 3) Three 100 µl washes with 1X Wash Buffer (PBS containing 0.05% Tween-20) were performed using plate magnet to retain beads. 4) 50 µl biotinylated Histone H3 antibody diluted 1:500 in Assay Buffer was added for the high abundance PTM multiplex assay for 1 hour with agitation. 50 µl biotinylated Histone H3 antibody diluted 1:250 in Assay Buffer was added for the low abundance PTM multiplex assay for 1 hour with agitation. 5) Washes were performed as above. 6) 50 µl of SAPE diluted 1:100 in Assay Buffer was added to each well and incubated for 30 min with agitation. 7) Beads were collected on a plate magnet and the SAPE solution discarded. 8) The assay plate was removed from the plate magnet and beads resuspended in 100 µl 1X Wash Buffer and read on the Luminex L×100 Instrument. Data analysis: Histone H3 Total matched data sets were used to determine PTM/H3 ratios, the PTM percent change relative to each other and Student t-test p-values.
Translating Ribosome Affinity Purification (TRAP) sequencing (TRAPseq)
TRAP assay was adopted from previous studies(Heiman et al., 2014). Here, we performed all experiments in 3D. We stably labeled MCF7 cells with GFP-RPL10a plasmids kindly provided by Dr. William Pu from Harvard. Cells were sorted using FACSAria II to enrich for GFP-positive cells. GFP-RPL10a-expressing MCF7 cells were maintained in 2% charcoal stripped medium for 48 hours upon which, 1 million cells were seeded in 100 mm low attachment plates (Corning, cat #05-539-101) alone or in coculture with human mesenchymal stem cells (MSCs), incubated overnight and treated with 10nM 17β-estradiol, fulvestrant or 100nM Tamoxifen 24h hours. Cells were collected for TRAP sequencing. Library was prepared using illumina Nextera XT Kit and paired-end sequencing was performed on a Nextseq 550 System. All sequencing experiments were performed at the Genomic and RNA Profiling core (GARP) at Baylor College of Medicine.
Tracing Metastasis Expansion in Bone using CRISPR-Cas9/hgRNA System
CRISPR-Cas9 barcoding
The hgRNA A21 vector was previously characterized and published (Kalhor et al., 2017). MCF7 cells were stably infected with Lenti-iCas9-neo (Addgene #85400) and hgRNA-A21 (Addgene #100570) using Neomycin/puromycin antibiotic selection before intra-iliac artery injection (IIA). To activate cas9 expression, mice were administered 2mg/kg of doxycycline via i.p. injection at day 1 post-IIA. Doxycycline treatment was repeated once a week for 3 more weeks (see experimental design Figure 1A).
Laser capture micro-dissection (LCM) and barcode sequencing
Bone was harvested and processed for LCM. More specifically, the tumor bearing limb (femur and tibia) was isolated, embedded in Tissue-Tek O.C.T., snap-frozen in liquid nitrogen, and stored at −80 degree until sectioning. 10 µm cryosections of each bone were generated using Leica CM3050S cryotome equipped with a low-profile microtome blade. The chamber temperature was set at −26 degree. Sectioning was facilitated with the CryoJane Tape Transfer System and then placed on the PET membrane slides (MMI, Prod. No. 50103). Sections were fixed in ethanol and stained with DAPI and ArcturusTM HistoGeneTM solution (Applied biosystems) according to the instruction manual. Microdissection was performed using Leica LMD7000 instrument. DNA was purified from each LCM-derived lesion using the Quick-DNA/RNA Microprep Plus Kit from Zymo (D7005). The evolving barcode library was generated as previously described (Kalhor et al., 2017). A paired-end sequencing was performed using the Hiseq 4000 system.
Bioinformatic Analysis of the evolving barcode system
The R1 sequences are aligned and annotated using the TraceQC package (https://github.com/LiuzLab/TraceQC). First, the CRISPR barcode sequences were aligned to the hgRNA_A21 reference construct using the following score system: match +2, mismatch −2, gap opening −6, gap extension −0.1. After annotating the aligned sequences, the adapters were trimmed off and sequences with low alignment scores (<200) were filtered out. Sequences with less than 10 count were subsequently filtered out. TraceQC extracted mutation events from the sequence into 4 attributes: 1) the mutation type (insertion, deletion or point mutation), 2) the starting position of mutation, 3) the length of mutation, and 4) the altered sequence. We combined the mutation events for all the samples into a mutation count matrix and normalized samples using the read count per million (RPM) approach. The hierarchical clustering based on mutations revealed 3 major modules. Within each module, the mutation count matrix was binarized into whether each mutation event exists in the samples or not: TRUE (mutation present) or FALSE (mutation absent). Then, we used maximum parsimony to establish the lineage relations within each module. To build the cell lineage network, we performed graphic LASSO using the Huge package. First, the mutation count matrix was Gaussianized using non-paranormal transformation provided by Huge package. Then, the graphic LASSO was applied to the Gaussianized mutation count matrix. We selected lambda = 0.52 to make the graph have the maximum sparsity while remaining fully connected. Next, we applied a random walk-based community detection algorithm to detect the 3 modules in the graph. The algorithm is provided by the iGraph package. Detailed analysis pipeline is accessible at: https://github.com/LiuzLab/ER_positive_breast_cancer-manuscirpt.
Quantification and Statistical Analysis
Most statistical analysis were performed using Graphpad Prism 8. Specific statistical approaches are indicated for each figure in figure legend. In brief, a two-tailed unpaired Student’s t test was single cell quantitative immunofluorescence analyses. A paired Student’s t test or two-way ANOVA was used for all graphs involving multiple cell lines and in vivo. For PET imaging, Mann Whitney U-test was used for statistical analysis. Pearson correlation was used for correlation studies.
Bioinformatics Analysis
We use the previously published clinical datasets to confirm the association of bone metastasis with downregulation of ER signaling (https://github.com/npriedig/).
DATA AND SOFTWARE AVAILABILITY
Data analysis was conducted in GraphPad Prism (v8.0.1) and R (version 3.4 R). Dataset were deposited in Gene Expression Omnibus(Edgar, 2002), with the following GEO accession numbers (GSE137245; GSE137270, GSE160566, GSE160582,and GSE161181). The GEO Reference Series connecting all datasets is GSE160583.
Acknowledgements
We thank all members of the Zhang Lab for their insightful contributions. Our thanks also go to the Breast Center Pathology Core, the RPPA core, the Small Animal Imaging Facility (SAIF), and the Genomic and RNA Profiling core (GARP) for their technical support, and to all members of Lester and Sue Smith Breast Center. We express our gratitude to Dr. Rosen Jeffrey for his invaluable assistance and guidance, to Drs. Michael Lewis, Keith Chen, Fotis Nikolo, Xi Chen, Jin Cao, Fabio Stossi, Michael Mancini, and to Lacey Dobrolecki for their advice and technical support. We also thank Epizyme (Cambridge, MA) for kindly providing the EZH2 inhibitor EPZ-011989.
Footnotes
↵10 Lead Contact


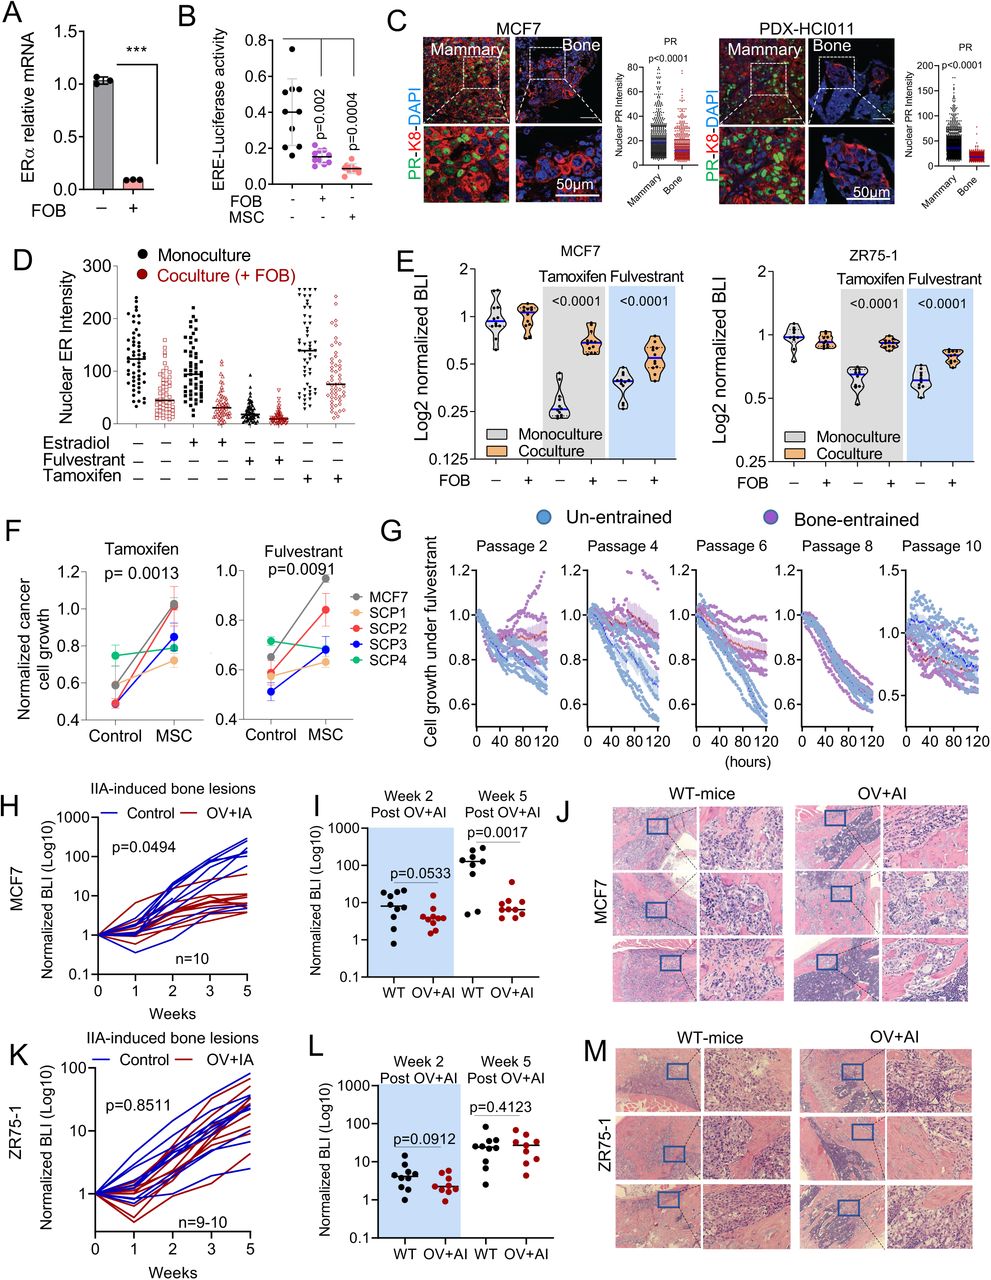
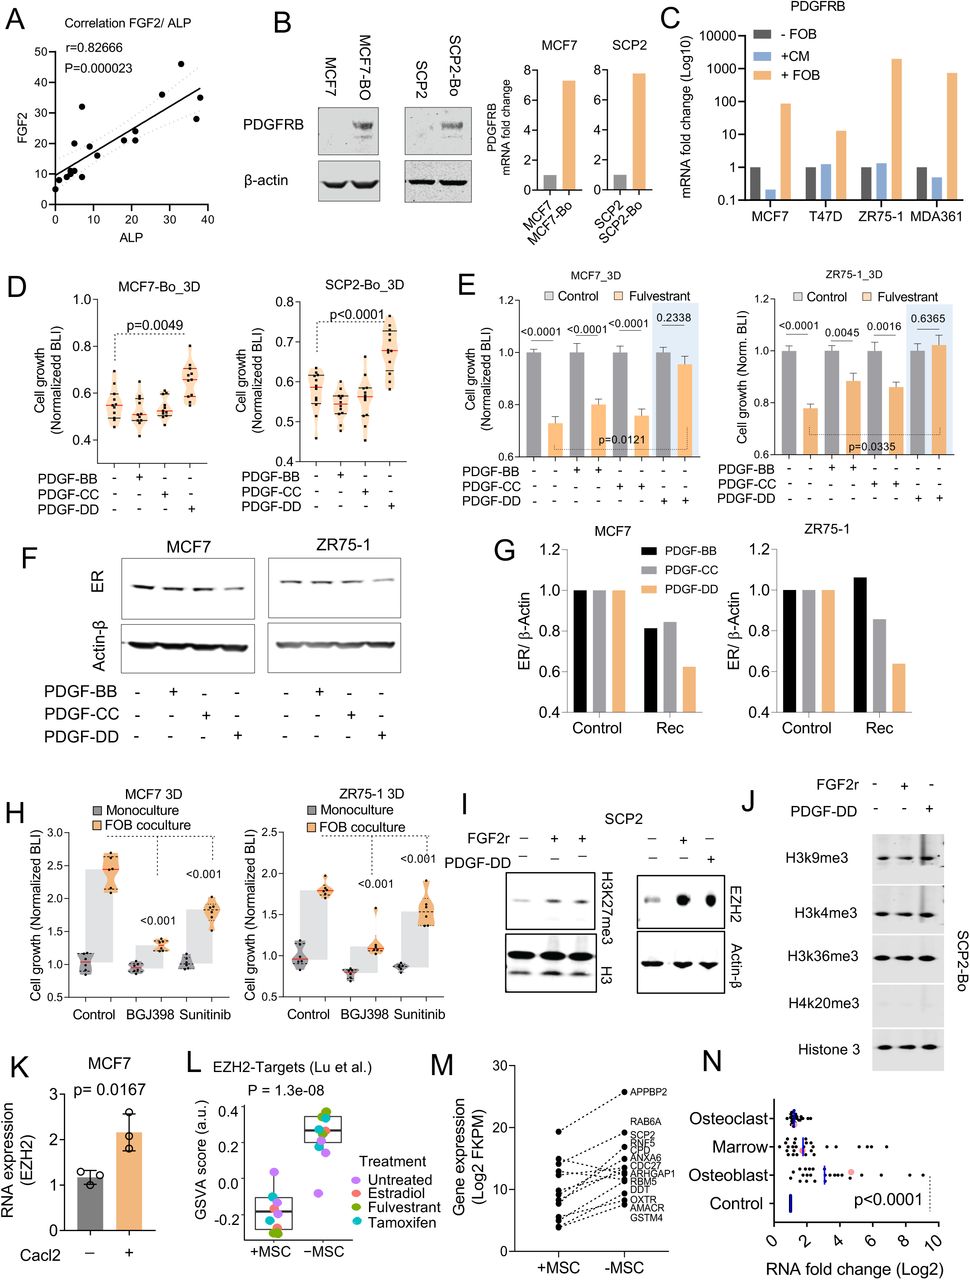
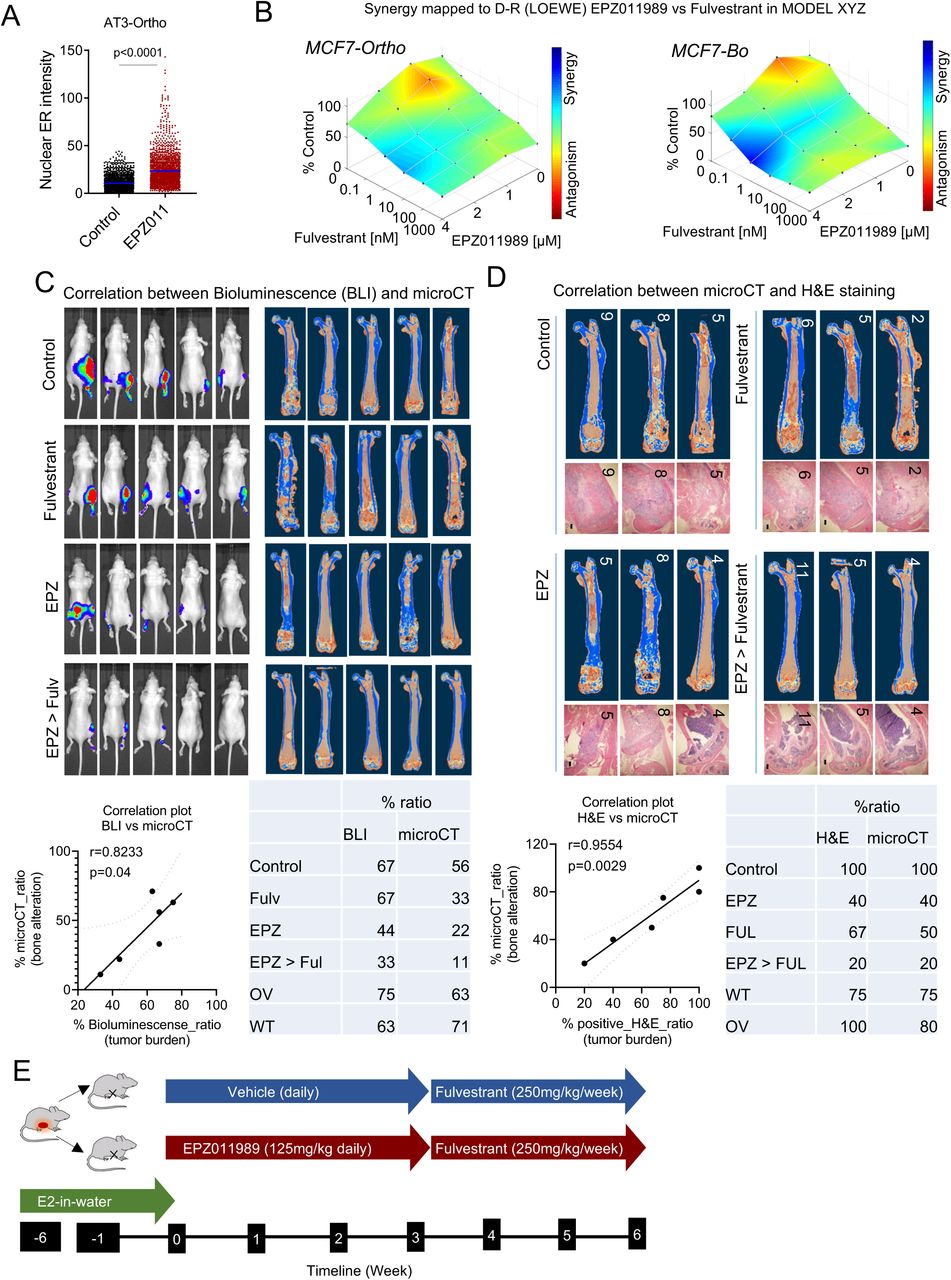