

Abstract
Cells display complex intracellular organization through compartmentalization of metabolic processes into organelles, yet neither the resolution of these structures in the native tissue context nor its functional consequences are well understood. Here, we resolved the 3-dimensional organelle structural organization in large (at least 2.8×105μm3) volumes of intact liver tissue (15 partial or full hepatocytes per condition) in high resolution (8nm isotropic pixel size) by utilizing enhanced Focused Ion Beam Scanning Electron Microscopy (FIB-SEM) imaging, followed by deep-learning-based image segmentation and 3D reconstruction. We also performed a comparative analysis of subcellular structures in liver tissue of lean and obese animals and found that hepatic endoplasmic reticulum (ER) undergoes massive structural re-organization in obesity characterized by marked disorganization of stacks of ER sheets and predominance of ER tubules. Finally, we demonstrated the functional importance of these structural changes upon experimental recovery of the subcellular organization and its marked impact on local and systemic metabolism. We conclude that hepatic subcellular organization and ER’s architecture is highly dynamic, integrated with the metabolic state, and critical for adaptive homeostasis and tissue health.
Organs and tissues exhibit distinct features of structural organization at various scales to meet functional demands and adapt to challenges to maintain homeostasis and viability. At the subcellular level, metabolically specialized cells also present distinct spatial organization of organelles, which likely plays a role in compartmentalizing and partitioning of metabolic processes to sub-domains of the cell to increase functional diversity and provide metabolic flexibility. Therefore, intracellular architectural organization of organelles is directly related to the cell’s specialized function. However, the nature of these structural properties and how they are regulated to adapt to physiological or pathological challenges in their native tissue environment, in health and disease remains largely unknown. Most of the studies on organelle architecture and cellular organization have been performed in model organisms such as yeast or cultured cells. However, specialized cells of mammals, such as liver cells, in their native tissue environment present a more complex organization that may not be fully and accurately captured in these systems. A major challenge is the extreme difficulty in establishing the relationship between structure and function in the native tissue context in vivo, especially for organelles with complex architecture such as endoplasmic reticulum. This is in part due to technical limitation to resolve at high spatial resolution in large volumes of tissue with the existing and commonly used microscopy approaches and analytical platforms.
Here, we utilized extensive enhanced FIB-SEM imaging and convolutional neural networks-based image segmentation to be able to resolve and quantify the fine details of hepatocyte organelle structure in its native tissue context, in vivo. We focused on ER structure in this study and chose to study hepatocytes in the liver tissue, as these cells carry out highly pleiotropic metabolic functions and present highly heterogenous architecture to support their multifunctionality. Thus, hepatocytes offer a unique opportunity to explore the relation between ER architectural organization and metabolic function in homeostasis or disease in vivo. We resolved these structures in normal lean mice and also performed a comparative analysis to explore the impact of a pathological condition, obesity, on organelle architecture.
Comparative definition of general subcellular organizational landscape in liver
To initiate resolution of hepatocyte subcellular structures in liver and explore a comparative analysis of normal and obese tissue, as well as impact of nutritional fluctuations, we first performed extensive transmission electron microscopy (TEM) of liver tissue sections derived from lean (Wt) and obese (leptin deficient, ob/ob) mice in both fed and fasted conditions. In all of the experiments, we sampled the same location of the liver and performed our imaging studies in hepatocytes located at the intermediary zone of the liver between a central and portal vein (Extended Data Fig. 1A) to ensure consistency in our comparative analysis. Since the ER is a vast membranous compartment with high degree of structural diversity and carries out critical and pleiotropic functions for cellular homeostasis, our initial focus was on this organelle.

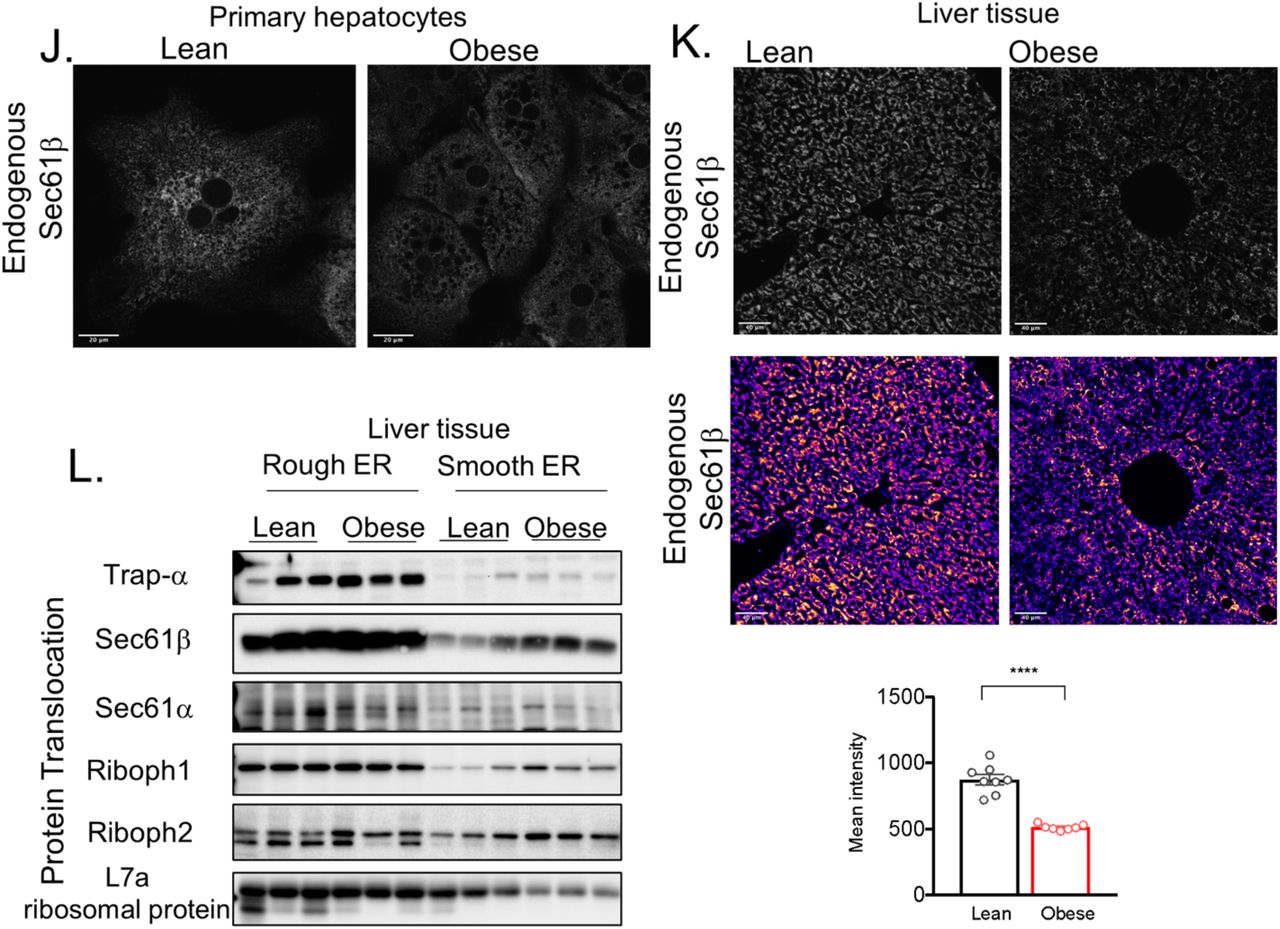
(A) Scheme showing liver zonation and highlighting the area selected for sample collection for TEM and FIB-SEM analysis. (B) Workflow for manual annotation and quantification of parallel organized ER sheets (C) TEM of acinar cell section used as a positive control for training the algorithm (D) TEM of Hepa 1-6 cell used as a negative control for training the algorithm (E) Quantification of the length of total parallel ER sheets traces (***p=0.0006, *p=0.015) (F) Quantification of the total ER length (G) Quantification of total cell area (*p=<0.04) (H) Quantification of the length of parallel ER stacks normalized by cell area (***p=<0.0001, **p=0.0043, *p=0.0457). (I) Quantification of length of total ER traces normalized by cell area (*p<0.018). Quantification for (E-I) are representative of lean fed n=12, lean fasted n=12, obese fed n=15 and obese fasted n=7 whole hepatocyte mid-cross-sections at 1500x magnification per condition from 2 different mice per group (J) Confocal images of immunofluorescence staining for endogenous Sec61β in primary hepatocytes from lean and obese mice. (K) Upper panel: Confocal images of immunofluorescence staining for endogenous Sec61β in liver sections from lean (Wt) and obese (ob/ob) mice. Lower panel: Quantification of fluorescence intensity of immunofluorescence staining for endogenous Sec61β in liver sections from lean and obese mice. n=8 fields (Wt) and 7 fields for ob/ob mice, representative of 2 mice per group (****p=0.0001). (L) Immunoblot analysis of indicated proteins in Rough and Smooth ER fractions from liver tissue derived from lean and obese mice.
In the liver sections of lean animals at the fed state, the ER is composed of a vast array of parallel stacked ER sheets spanning both the perinuclear region and also the cell periphery (Figure 1A). The tubular structure is less visible in this type of analysis and is often seen as “round vesicles” reflecting a cross section of a tubule (Figure 1A, inset). Interestingly, following fasting, the ER morphology undergoes a significant remodeling with a decrease in the quantity of parallel stacked ER sheets (Figure 1B). Strikingly, in liver sections derived from obese mice (10-week-old), the stacks of ER sheets were drastically reduced in both fed and fasted animals (Figure 1C and 1D). In an attempt to quantify these alterations, we acquired extensive TEM images from livers, where the whole hepatocyte mid-cross-sectional area is captured (around 15 full hepatocytes per condition). We then manually annotated the ER, generated binary ER masks and applied an algorithm to segment the ER traces that are found in parallel-arrayed organization (Figure 1 E-H and Extended Data Fig. 1B). To validate the algorithm, we used acinar cells as a positive control, given that these cells are strongly enriched in parallel organized ER sheets (Extended Data Fig. 1C) and we used a mouse hepatocyte cell line (Hepa1-6) as a negative control, since these cells are devoid of parallel organized ER sheets (Extended Data Fig. 1D). We considered two neighboring ER sheet as “parallel” if more than 50% of the two neighboring ER traces are within in 55-225 nm distance range (5-20 pixel range) from each other. Based on this algorithm, we observed that both fasting and obesity leads to a reduction in parallel-stacked organization of ER sheets in regard to the total ER (Figure 1I and 1J, Extended Data Fig. E-G). Similar reduction is observed when the length or number of ER sheets is normalized by total cell area (Extended Data Fig. 1H and I).
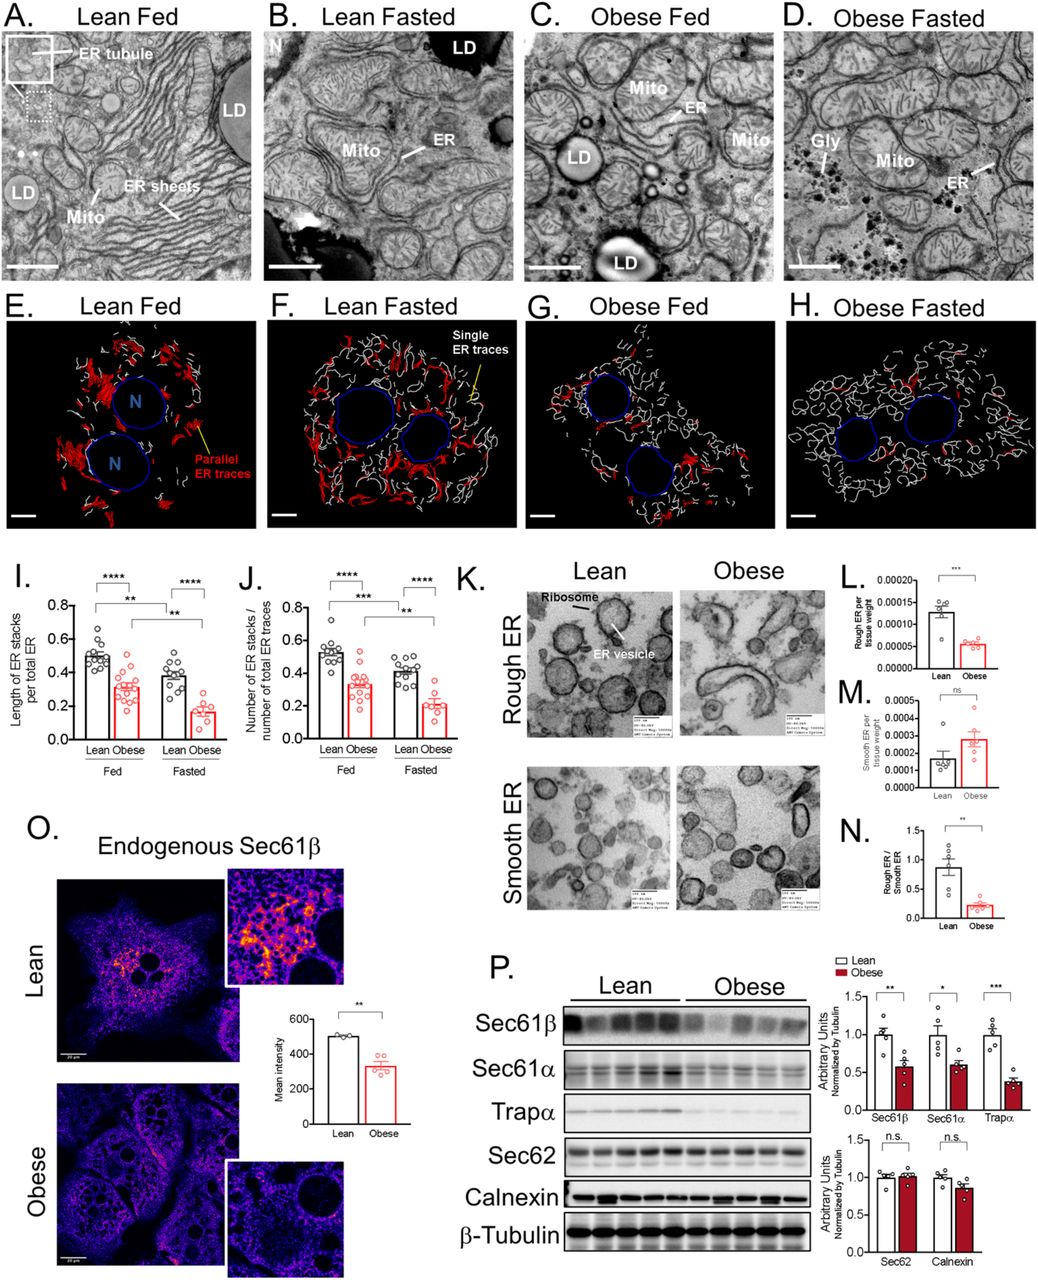
(A and B) Representative transmission electron microscopy (TEM) images of liver sections derived from lean in fed and overnight fasted state. (C and D) Representative TEM of liver sections derived from obese (10 weeks of age) in fed and overnight fasted state. ER (endoplasmic reticulum), Mito (mitochondria), LD (lipid droplet). Scale bar: 2.236um. (E-H) Binary masks of manually annotated ER from the TEM images acquired in 1500x mag. White and red represent ER traces, where parallel organized ER is segmented in red, blue: nucleus (N). (I) Quantification of the length of parallel ER stacks normalized by total ER length (****p<0.0001, **p<0.0011) (J) number of parallel ER stacks normalized by total number of ER traces (****p<0.0001, ***p=0.0010, **p=0.0067) (K) TEM of rough (upper panel) and smooth (lower panel) ER vesicles isolated from livers derived from lean and obese mice. (L) milligrams of rough (***p=0.0004) and (M) smooth (p=0.0917) ER vesicles recovered by subcellular fractionation normalized by milligram of liver (N) Ratio between abundance of rough divided by smooth ER vesicles (**p=0.0014). The graphs represent average of 6 mice for lean and 6 mice for obese. (O) Confocal images and quantification of immunofluorescence staining for endogenous Sec61β in primary hepatocytes from lean and obese mice. n=3 fields lean and n=5 fields obese, representative of 3 independent hepatocytes isolations (**p=0.0018). (P) Left panel: Immunoblot analysis of the indicated proteins in total liver lysates from lean and obese mice. Right panel: Quantification of the immunoblots. n=5 mice per group, representative of 3 independent cohorts. In all panels error bars denote s.e.m.
In liver, ER sheets are often studded with ribosomes forming the rough ER, while the ER tubules are mostly devoid of ribosomes1. Given the striking decrease in parallel organized stacks of ER sheets in obese livers observed in our ultrastructure analysis, we evaluated the abundance of the rough and smooth ER. We performed differential centrifugation analysis using discontinuous sucrose gradient and purified rough and smooth ER from liver tissue derived from lean and obese mice. To validate the efficiency of subcellular fractionation method, we imaged the recovered fractions by TEM. As shown in Figure 1K, the ER recovered in the denser sucrose fraction is enriched in ribosomes in both lean and obese samples (Figure 1K upper panel), while the smooth ER fraction was characterized by microsomes vesicles devoid of ribosomes (Figure 1K lower panel). In accordance with the decreased number of parallel organized stacks of ER sheets in the TEM, we observed that the amount of rough ER normalized by tissue weight was significantly reduced in livers from obese mice (Figure 1L) while the amount of smooth ER tends to be higher (Figure 1M). Accordingly, the ratio between rough ER normalized by smooth ER was significantly lower in obese livers (Figure 1N).
As an alternative approach to evaluate ER sheets content in primary hepatocytes and liver sections derived from lean and obese mice, we determined the abundance of the ER translocon complex, a protein complex preferentially localized to sheets that is involved in the translocation of the nascent unfolded peptides from cytosolic space in to the ER lumen. The core of the translocon complex is formed by the Sec61 channel which is found together with the Sec62–Sec63 dimer and associated with the translocon-associated protein (TRAPα) and others. Endogenous staining of Sec61β in primary hepatocytes derived from lean mice showed that Sec61β is segregated in patches located at the perinuclear ER and cell periphery corresponding to the location of the ER sheets, thus confirming that these proteins are ER sheet markers (Figure 1O and Extended Data Fig. 1J). In primary hepatocytes from obese mice however, the expression of Sec61β is largely decreased and diffused through the whole ER (Figure 1O and Extended Data Fig. 1J). Similar profile was observed in endogenous staining of Sec61β in liver sections from lean and obese mice (Extended Data Fig. 1K). In accordance with the immunofluorescence imaging, the expression levels of Sec61β and Sec61α, measured by western blots, were also significantly decreased in total liver lysates obtained from obese mice. Moreover, the expression of TRAPα was also markedly decreased in obese livers while Sec62 and calnexin expression levels were not changed (Figure 1P). Notably, the expression levels of Sec61α, Sec61β and TRAPα were not different in the rough ER fraction isolated from livers derived from lean and obese animals indicating that the decreased total levels of these proteins may reflect primarily the loss of ER sheets rather than a decrease in the translocon complex per rough ER unit (Extended Data Fig. 1L).
Large volume 3D imaging of liver ER architecture at high isotropic resolution reveals marked alterations in ER architecture in obesity
While instrumental in defining the general framework, single section TEM presents significant limitations in exploring tissue subcellular morphological organization. It provides only 2-dimensional resolution of the organelle structure, which introduces a problematic bias in single sections for not capturing the subcellular architectural heterogeneity and organizational complexity in 3D space. Additionally, hepatic ER architecture is much more intricate to resolve compared to cell lines, where most of the ER structural studies have been performed. Other important limitations include the inability to quantitate total ER volume or resolve tubular ER structures in native environment. Thus, in order to obtain a detailed 3D information of the hepatic ER’s authentic structural organization in vivo and investigate the alterations that occur in obesity, we took advantage of Focused Ion Beam Scanning Electron Microscopy (FIB-SEM) imaging, a technique that has high isotropic resolution, although its large volume imaging application to tissues is particularly challenging.
FIB-SEM uses scanning electron microscopy to scan the surface of a volume, followed by milling of the surface with a focused ion beam. The strength of the technique lies on the resolution of its Z-axis, where the focused ion beam allows for sectioning with nanometer accuracy. Furthermore, the block face approach enables defect-free and easy-to-align image stacks. Such isotropic datasets are well suited for automated segmentation, which is essential for data analysis of large volumes. Recent advances in FIB-SEM imaging technology2–4 substantially expand the imaging volume while maintaining isotropic nanometer resolution, thus allowing us to image large intact liver volumes derived from lean and obese animals at voxel size of 8 nm in x, y, and z dimensions. For the liver derived from lean mice, we obtained a volume of 96μm(x), 64μm(y), 45μm(z) comprising 5638 consecutive images (Figure 2A and 2B and Movie 1). For the obese condition, we obtained liver volumes from two different obese mice. The first sample consisted of 81μm(x), 73μm(y), 63μm(z) comprising 7896 consecutive images (Figure 2D and 2E and Movie 2) and the second sample was 64μm(x), 64μm(y), 68μm(z) comprising 8501 consecutive images (Extended Data Fig. 3A and 3B).

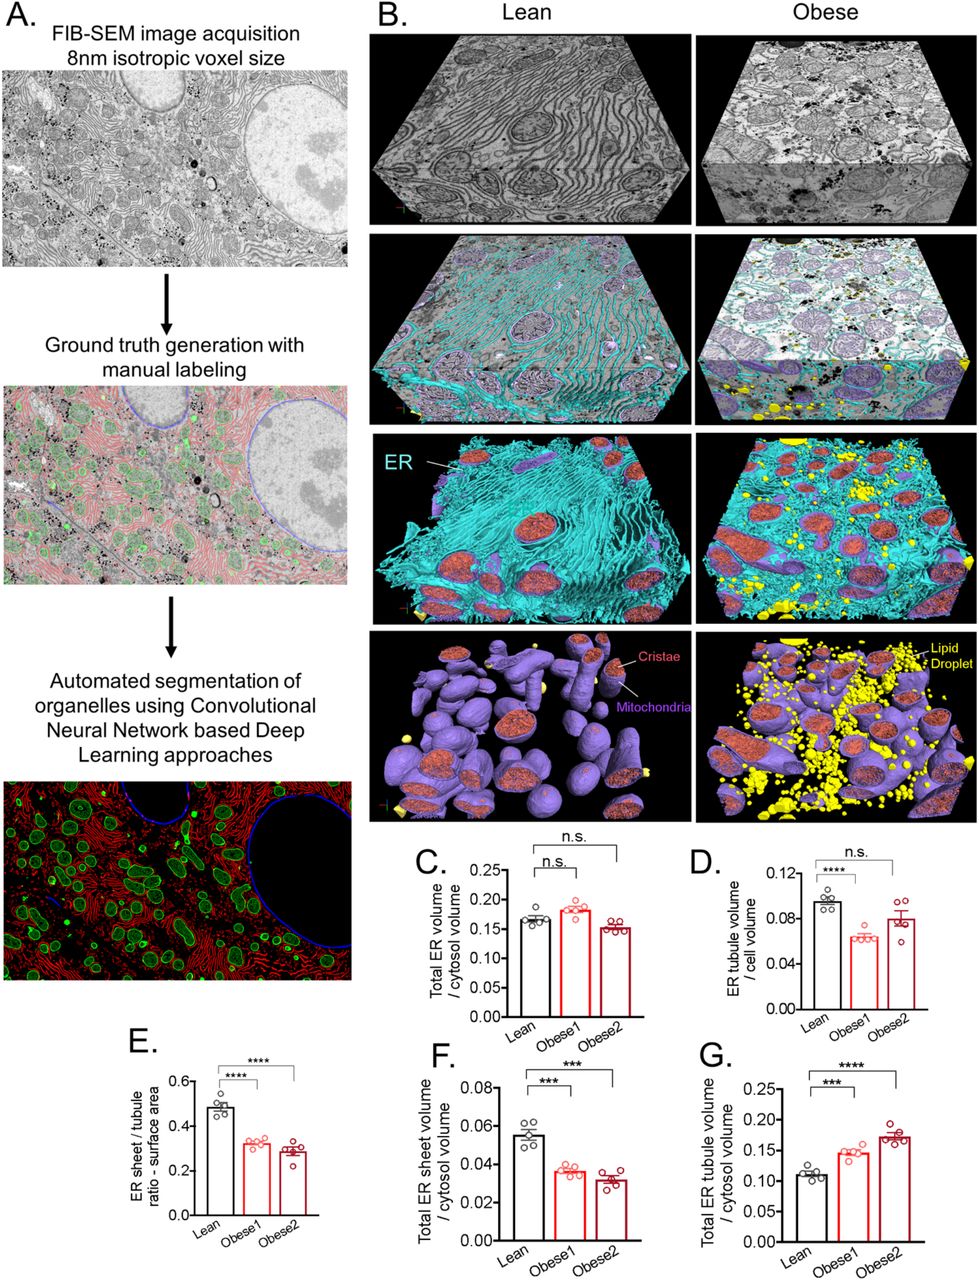
(A and D) Single section SEM of liver from lean and obese mice liver in fed state at 8 nm pixel size. Inset in A highlights the tubular ER structure. (B and E) 3D reconstruction of FIB-SEM images derived from liver volumes from lean (B) and obese mice (E). (C and F) Convolutional neural network based automated segmentation of liver volumes derived from lean (C) and obese (F) mice. The dimensions of the volumes are depicted in the figure. ER (endoplasmic reticulum, blue), Mito (mitochondria, purple) LD (lipid droplet, yellow), Nucleus (gray). (G and H) Reconstruction of 5 full or partial hepatocyte volumes present in the liver volume imaged by FIB-SEM. The volumes of the cells are depicted in the figure. All the reconstructions were performed in Arivis Vision 4D software. (I) Quantification of total ER volume normalized by cell volume in 5 different cells derived from lean and obese mouse 1 and obese mouse 2 (***p=0.0001). (J) Percent of organelle volume normalized by total cell volume; n=5 cells for lean and for 2 obese.
An additional major challenge using this method is the identification, segmentation and quantification of each sub-cellular structure within the cell they belong as it is not possible to achieve this task in a high-throughput manner with manual annotation or the standard segmentation techniques such as thresholding, K-means clustering or edge detection. In order to overcome this challenge, we took advantage of machine learning based approaches and utilized convolutional neural networks to segment organelles, plasma membrane and the nucleus in a volume of 5.4×10¹¹ voxels in lean and 7.3×10¹¹ voxels in obese liver (Figure 2C and 2F, Movie 3 and Movie 4 and Supplementary Table 1), following the pipeline in Extended Data Fig. 2A and 2B. The success rate of segmentation for all classes was measured by the Jaccard Index or evaluating the object-level precision and f1-score. In order to exclude the non-cell volume occupied by blood vessels and sinusoids, we quantified the segmented organelles in the 5 largest cell volumes in each dataset as shown in Figure 2G and 2H and Extended Data Fig. 3D. A whole hepatocyte volume from the lean tissue was around 19×103μm3, whereas obese cell was 40×103μm3. Using this approach, we observed that the total ER volume corresponds to ~ 12% of total cell volume in the lean hepatocytes and decreased to ~5%-8% in the hepatocytes from obese mice (Figure 2I). However, when we normalized the total ER volume present in the cells per cytosolic volume by excluding the lipid droplet, mitochondria and ER volume from the total cell volumes, we verified that lean and obese cells present comparable ER volumes (Extended Data Fig. 2C). These results indicate that obesity does not alter the amount of total ER volume per se and the apparent decreased ratio can be attributed by the increase in cell size. In fact, the lipid droplets content was less than 1% in the cells from lean mice and increased dramatically to 30 to 34% in the obese cells. The mitochondria volume corresponded to 16% in lean and 13%-16% in obese cells (Figure 2J).

(A) Workflow for automated segmentation of organelles using convolution neuronal network-based machine learning. (B) Section of the liver volume from lean (right) and obese (left) with ER (blue), mitochondria (purple), cristae (pink) and lipid droplet (yellow) annotation and reconstruction. (C) Quantification of total ER volume area normalized by cytosol volume (here cytosol was considered the cell volume minus the volume occupied by lipid droplets, mitochondria and ER). n=5 for each group (D) Quantification of ER tubule volume area normalized by cell volume. n=5 for each group (****p<0.0001). (E) Quantification of total ER surface area normalized by cell surface area in 5 different cells derived from Wt and ob/ob liver (****p<0.0001). (F) Quantification of ER sheet volume normalized by cytosol volume. n=5 per group (****p<0.0001). (G) Quantification of ER tubule volume normalized by cytosol volume. n=5 per group (***p=0.0006, ****p<0.0001).

(A) Single section SEM of liver from obese (ob/ob – 2nd dataset) mice liver in fed state at 8 nm pixel size. (B) 3D reconstruction of FIB-SEM images derived from obese liver volume. (C) Convolutional neural network based automated segmentation of liver volumes derived from obese mice. The dimensions of the volume are depicted in the figure. ER (endoplasmic reticulum, blue), Mito (mitochondria, purple), LD (lipid droplet, yellow), Nucleus (gray). (D) Reconstruction of 5 full or partial hepatocyte volumes present in the liver volume imaged by FIB-SEM. The volumes of the cells are depicted in the figure. All the reconstructions were performed in Arivis Vision 4D software. (E) Section of the liver from obese mice segmented with ER (blue), mitochondria (purple), cristae (pink) and lipid droplet (yellow) annotation and reconstruction. (F) Sub-segmentation and 3D reconstruction of ER sheets (red) and tubules (gray) from obese (ob/ob) mice.
(all Mus musculus)
We next examined the structure of the subdomains of the ER and their architectural organization from lean and obese mice in great detail. As shown in Figures 3A-3B and Movies 5-6 the resolution of ER sheets and tubules in hepatocytes is unprecedented and clearly illustrates the complexity of hepatic ER. Using this approach, we observed predominance of the well-organized parallel sheets of the ER in cells from lean tissue and the dramatic reduction and disorganization in these structures in obese tissue, along with the enrichment in tubules (Figure 3C and 3D, Movie 7-9). In order to quantify these transitions in ER morphology, we re-segmented the ER volume separating the ER sheets from tubules. For that, we manually labeled around 20 consecutive binary ER mask images, generated grand truth and utilized a U-Net neural-network-based approach to separate ER into these 2 domains (Figure 3E and 3F). As shown in Figure 3G, the percent of ER sheets per total cell volume is significantly decreased in obese hepatocytes while the total ER tubules are not significantly different (Extended Data Fig. 2D). In liver tissue derived from lean animal in the fed state, the ER sheets corresponded to 49-55% of tubular ER volume (Figure 3H and 3I) and 50% of surface area (Extended Data Fig. 2E). This was expected given that these cells are found both in a synthetic and anabolic state. In obesity however, we detected a marked reduction of ER sheets that now correspond to ~20 to 30% of the tubular ER volume (Figure 3H and 3I). In addition to the decreased abundance of ER sheets, we observed that the organization and parallelism of the sheets were also disturbed in obesity (Figure 3J and 3K). The tubular structure, which we believe to be the first time to be resolved in this detail is shown to be similar in organization between the two datasets (Figure 3L and 3M). Altogether these data suggest that the transition in the liver state from physiological to pathological condition in obesity is associated with drastic changes in ER architecture with a significant decrease in hepatic ER sheet to tubule ratio.

(A and B) Partial reconstruction of segmented ER and mitochondria on raw FIB-SEM data derived from hepatocytes from lean (A) and obese mice (B). (C and D) 3D reconstruction of segmented ER morphology from lean (C) and obese (D) liver (1000×1000×400 pixels – 8×8×3.2um3). 3D reconstruction images were generated using Houdini (SideFX) software. Inset show the ER sheets and tubules in higher magnification (E and F) Sub-segmentation and 3D reconstruction of ER sheets (red) and tubules (gray) from lean (E) and obese (F) mice. (G) Quantification of ER sheet volume normalized by cell volume. n=5 cells for the 3 datasets (****p<0.0001). (H) Quantification of percent of ER sheets (red) and tubules (black) relative to total ER from lean and obese cells. n=5 cells in each group. (I) Ratio between ER sheets and tubule volume (****p<0.0001). (J and K) 100×100×100 pixel3 representation of ER sheets from lean (left) and obese (right). (L and M) 100×100×100 pixel3 representation of ER tubules from lean (left) and obese (right).
Loss of ER sheets in obesity is associated with alterations in ER shaping proteins
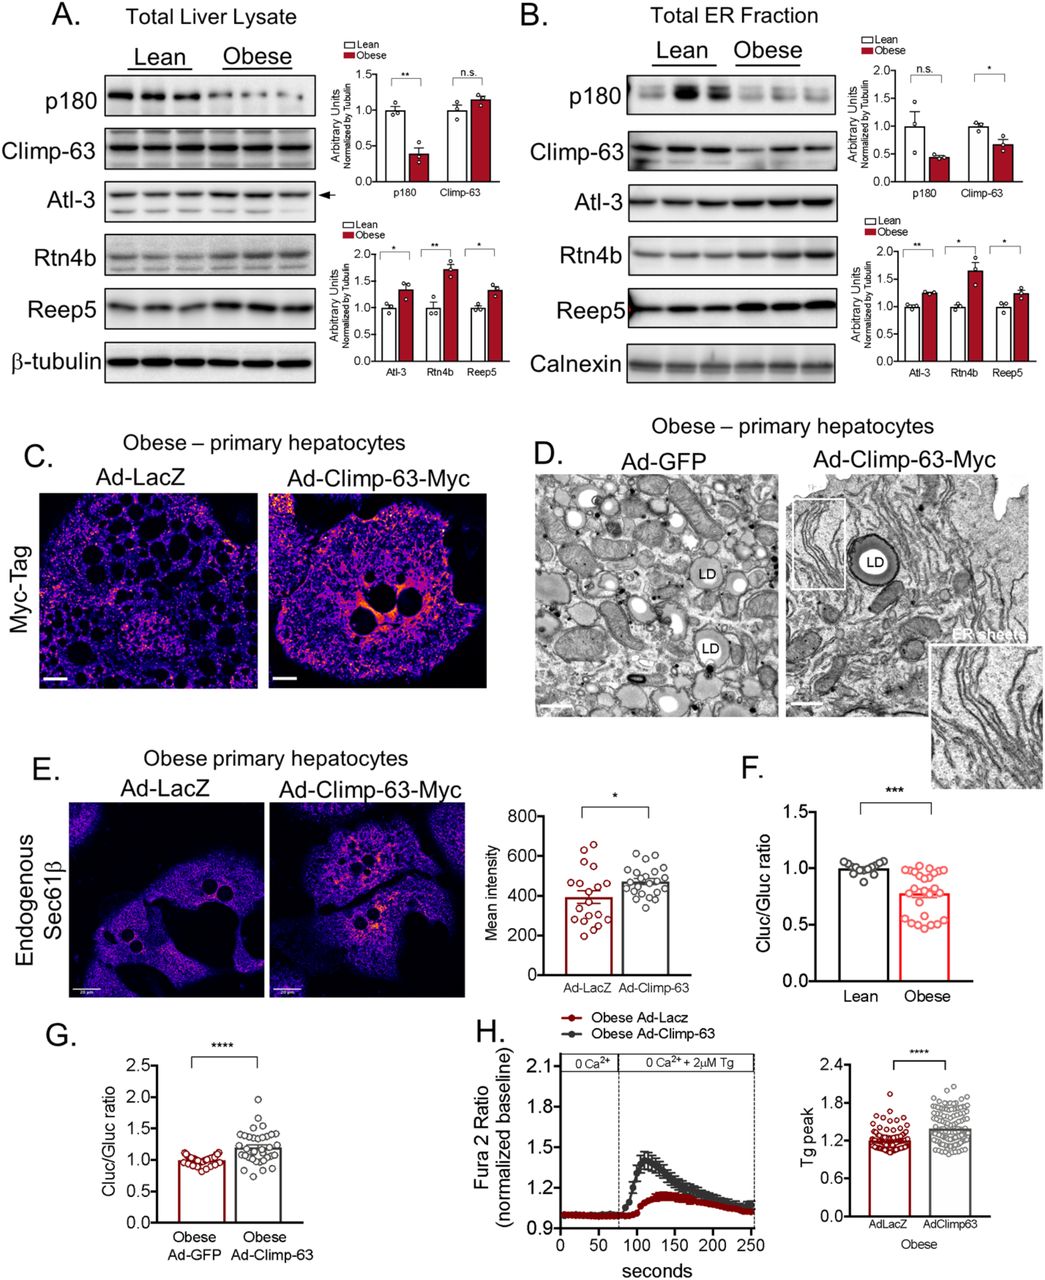
The shape of the ER sheets and tubules is determined by several factors including the relative abundance of ER membrane shaping proteins. In mammalian cells, the structure of the tubular ER is determined by the Reticulons and REEPs5–7. The ER tubules are subjected to membrane fusion in three-way junctions, a process facilitated by the dynamin like proteins called Atlastins8. The proteins involved in the formation of ER sheets are less understood. It’s known that the intraluminal space formed between the two ER membranes is established by the presence of a protein called Cytoskeleton-Linking Membrane Protein 63, Climp-63 (or CKAP4)9–11. This protein contains a single transmembrane segment and a luminal coiled-coil domain that homo-oligomerize in an anti-parallel manner forming intraluminal bridges ~50nm apart in mammalian cells. Other proteins shown to influence or stabilize ER sheets are the RRBP1 (p180) and Kinectin9,12. In order to determine whether the loss of ER sheets observed in obese livers is related to alterations in the expression/function of the ER shaping proteins, we determined their expression profile in total liver lysates and in isolated ER microsomes from lean and obese mice. As shown in Figure 4A and 4B, the expression of p180 was significantly decreased in total liver lysates of obese animals when compared with their lean counterparts. Although no significant differences were observed in Climp-63 expression levels in total lysates, this protein was significantly decreased in the total ER fraction. As previously described, we found that the expression of Climp-63 and p180 are enriched in the rough ER (Extended Data Fig. 4A). In contrast, the expression levels of proteins involved in tubular ER formation such as Atlastin3, Reticulon4b and Reep5 were increased in obese both in the total lysates and total ER fraction (Figure 4A and 4B). These proteins were preferentially found in our smooth ER fractions (Extended Data Fig. 4A). All the antibodies used for these experiments were validated using either positive (overexpression) or negative controls (deletion) as shown in Extended Data Fig. 4B-F. We then profiled the mRNA expression levels of multiple genes that encode ER membrane shaping proteins. The increased levels of REEPs and Reticulon 4 were paralleled by increased mRNA expression levels in liver tissues of obese mice (Extended Data Fig. 4G). Interestingly, while the Climp-63 was significantly upregulated at the mRNA level (Extended Data Fig. 4G), possibly indicating a compensating mechanism. Thus, the regulation of the shaping proteins promoted by obesity is likely a mechanism through which obesity shift the balance of ER sheets/tubules abundance.

(A) Immunoblot analysis of indicated proteins in rough and smooth ER fractions from livers derived from lean and obese mice. (B) Immunoblot analysis for Reticulon 4A and 4B in total lysates from Hepa1-6 cells overexpressing Rtn4A tagged with GFP and Hepa1-6 cells transfected with shRNA control (scrambled, Scr) and shRNA against Reticulon4. (C) Immunoblot analysis for Climp-63 in total lysates from Hepa1-6 cells expressing GFP control and Climp-63 tagged with RFP or Myc and Hepa 1-6 cells expressing shRNA control (scrambled, Scr) and shRNA against Climp-63. (D) Left panel: Immunoblot analysis for Atlastin-3 (Atl-3) in total lysates from Hepa1-6 cells overexpressing Atlastin-3 tagged with Myc. Right panel: Hepa1-6 cells expressing shRNA control (scrambled, Scr) and shRNA against Atlasntin-3. (E) Immunoblot analysis for Atlastin-2 (Atl-2) in total lysates from Hepa1-6 cells overexpressing Atlastin-2 tagged with GFP. (F) Immunoblot analysis for RRBP1 (p180) in total liver lysates derived from Wt and RRBP1 deficient mice. (G) mRNA expression levels for indicated genes measured by qPCR. cDNA samples derived from lean (Wt) and obese (ob/ob) mice livers. n=4 for lean and 4 for obese (*p<0.027, **p<0.004, ***p=0.0002).

(A) Left panel: Immunoblot analysis of indicated proteins in total liver lysates. Right panel: Quantification of the immunoblots. n=3 for lean and obese (*p<0.03, **p<0.005). (B) Left panel: Immunoblot analysis of indicated proteins from ER fraction isolated from livers from lean and obese. Right panel: Quantification of the immunoblots. n=3 for lean and obese (*p<0.025, **p=0.001). (C) Confocal images of immunofluorescence staining for Myc reflecting Climp-63-Myc expression in primary hepatocytes from obese mice, expressing LacZ or Climp-63-Myc Ad (adenovirus). Scale bar: 10.96 um. (D) Representative TEM from primary hepatocytes derived from obese mice exogenously expressing GFP (left) and Climp-63-Myc (right). (E) Left panel: Confocal images of immunofluorescence staining for endogenous Sec61β in primary hepatocytes from obese mice exogenously expressing LacZ (left) and Climp-63-Myc (right). Right panel: Quantification of fluorescence signal. n=19 fields for LacZ and n=23 fields for Climp-63 (*p=0.0241), representative of 3 experiments. (F) Quantification of the ratio between luminescence signal from Cluc normalized by luminescence signal derived from Gluc in lean and obese primary hepatocytes. n=14 for lean and n=26 for obese (***p=0.0002). Pooled data from 3 experiments. (G) Quantification of the ratio between luminescence signal from Cluc normalized by luminescence signal derived from Gluc in obese primary hepatocytes exogenously expressing GFP or Climp-63. n=36 for GFP and n=35 for Climp-63 (****p<0.0001). Pooled from 6 experiments. (H) Representative Fura-2AM based cytosolic Ca2+ measurements in primary hepatocytes isolated from obese mice, expressing LacZ (control) or Climp-63. ER Ca2+ stores were depleted with 2μM thapsigargin (Tg), a SERCA inhibitor. Right panel: quantification of Tg-induced Ca2+ release (reflecting ER Ca2+ content) on the measurements shown in left panel. n=96 cells for LacZ and n=131 cells for Climp-63. Representative of 3 independent experiments (****p<0.0001).
Reshaping hepatic ER by exogenous Climp-63 expression restores ER function
The relative ratio of ER sheets and tubules is a consequence of a tug of war between ER shaping proteins and it has been shown, in cultured cells, that overexpression of Reticulon-homology-domain containing proteins drive ER tubule formation and decrease the abundance of ER sheets, whereas overexpression of Climp-63 leads to enrichment in ER sheets7,9. Given the findings described above showing that obesity promoted a marked shift in ER structure mainly caused by loss of ER sheets, we asked whether manipulating ER shape in order to rescue the ER sheets would impact ER function in hepatocytes from obese mice in vitro and in vivo. For that, we used Climp-63 overexpression as a tool to re-shape the ER towards ER sheet proliferation. To confirm the induction of ER sheet proliferation upon exogenous delivery of Climp-63, we first overexpressed Climp-63 in Cos-7 (a monkey kidney derived cell line). Fluorescence images presented in Extended Data Fig. 5A, showed that exogenous expression of Climp-63 results in a massive increase in ER sheets (as patches around the nucleus) in Cos-7 cells as shown in previous reports9. We also examined the proliferation of ER sheets driven by Climp-63 overexpression by TEM, where we observed a striking proliferation of membrane sheets with a constant luminal space, stacked very closely together (Extended Data Fig. 5B). We then cloned Climp-63 in an adenovirus backbone in order to exogenously express this protein in primary hepatocytes isolated from lean and obese mice. As controls, we used adenoviruses expressing either LacZ or GFP. Exogenous expression of Climp-63 in primary hepatocytes lead to a wide proliferation of parallel stacks of ER sheets in primary hepatocytes both in lean (Extended Data Fig. 5C) and obese samples (Figure 4C) as examined by confocal microscopy and TEM (Figure 4D). We also detected that overexpression of Climp-63 in primary hepatocytes obtained from obese mice lead to a recovery of Sec61β localization to the ER sheets, as shown by endogenous staining for Sec61β in these cells (Figure 4E).

(A) Left panel: Confocal images from Cos-7 cells exogenously expressing Sec61β fused with GFP as a fluorescent general ER marker. Right panel: Overlay of images from Cos-7 cells exogenously expressing Sec61β fused with GFP (green) and Climp-63 fused with RFP (red). Overlay is shown in yellow. (B) Representative TEM from Cos-7 cell sections expressing control (pcDNA) or Climp-63-RFP constructs. (C) Endogenous staining of KDEL as an ER marker (in green) and Myc-tag (in far red) in lean primary hepatocytes expressing either Ad-LacZ or Ad-Climp-63-Myc. (D) Scheme depicting the function of ASGR folding reporters developed by Fu et al, 201513. (E) Representative TEM from liver sections derived from lean (Wt) control mice or lean mice overexpressing Climp-63-Myc in vivo.
We then tested whether inducing ER sheet proliferation in obese cells through Climp-63 impacts ER’s functional capacity in these cells. We first evaluated ER folding and secretory capacity by taking advantage of a phenotypic assay developed recently in our lab13. This assay is based on the folding of the membrane protein asialoglycoprotein receptor 1 (ASGR1), a slow-folding protein which secretion is decreased under ER stress conditions13. Conditions negatively affecting ER folding capacity result in lower levels of secretion of the ASGR-Cluc whereas improved ER folding capacity has the opposite effect (Extended Data Fig. 5D). To evaluate the structural changes on ER folding capacity in hepatocytes, we infected primary hepatocytes isolated from lean and obese animals with an adenovirus expressing the ASGR1 reporter. As shown in Figure 4F, the secretion of ASGR-Cluc is decreased in primary hepatocytes derived from obese animals compared with control primary hepatocytes. Exogenous expression of Climp-63 in hepatocytes from obese animals lead to increased folding capacity compared with obese cells expressing adenovirus LacZ control (Figure 4G).
We and others have previously shown that obesity negatively impacts ER ability to store Ca2+ an essential ion for chaperone function, protein folding and secretion14–16. To test if increased ER sheets promoted by Climp-63 overexpression results in changes in ER Ca2+ handling we also examined ER Ca2+ homeostasis by Fura-2 based Ca2+ imaging. First, we incubated the cells in Ca2+-free medium induced ER Ca2+ release by the addition of the SERCA inhibitor thapsigargin (Tg). The rise in cytosolic Ca2+ induced by Tg, which reflects the ER Ca2+ content, was significantly higher in obese hepatocytes overexpressing Climp-63 compared with cells expressing LacZ control (Figure 4H). Interestingly, these data suggest that although Climp-63 itself is not a calcium channel, re-structuring a sub-domain of ER in obese cells improves calcium handling. Altogether, these data suggest that re-structuring ER sheets is sufficient to improve ER Ca2+ handling which can be directly linked to ER’s folding capacity.
Reshaping the ER structure is sufficient to promote metabolic health in obesity
Given the positive effects of Climp-63 exogenous expression on ER function from primary hepatocytes from obese mice, we set out to test whether increasing ER sheets by exogenous Climp-63 expression in the liver could impact systemic metabolism in vivo. For that, we delivered LacZ (control) or Climp-63 to livers of 10 weeks old lean and obese (ob/ob) mice through adenovirus injection. As shown in Figure 5A and B and Extended Data Fig. 5E, overexpression of Climp-63 in vivo led to a significant increase in parallel ER sheet formation both in lean and obese mice. Noticeably, the sheets promoted by Climp-63 overexpression in liver tissue were decorated with ribosomes as endogenous ER sheets (Figure 5A inset). It’s interesting to note that the presence of ribosomes in exogenously induced ER sheet formation was not observed in Cos7 cells (Extended Data Fig. 5B). This illustrates the critical importance of native context in order to establish structure/function relationship.

(A) Representative TEM from livers derived from obese mice exogenously expressing GFP (left) and Climp-63-Myc (right) Ad: Adenovirus. Scale bar: 1.118um. Inset: High magnification image of ribosomes associated with ER sheets promoted by Climp-63 overexpression. (B) Quantification of parallel organized stacks of ER in liver sections presented in figure 5A. n=7 for GFP and n=24 Climp-63-myc EM sections (****p<0.0001). (C) Blood glucose levels from 11 weeks old obese mice exogenously expressing LacZ or Climp-63 after overnight fasting. n=8 for LacZ and n=10 for Climp-63-myc. Representative of 3 independent cohorts (**p=0.0098). (D) Left: Glucose tolerance test in obese mice exogenously expressing LacZ (control) and Climp-63-myc. Right panel: area under the curve of the experiment in left panel. n=8 ad-LacZ and n=10 ad-Climp-63-myc animals, representative of 3 independent experiments (***p=0.0002). (E) Blood glucose levels from 10 weeks old obese mice exogenously expressing LacZ and Climp-63-myc after 6 hours of food withdrawn. n=8 for LacZ and n=10 for Climp-63-myc. Representative of 3 independent experiments (****p<0.0001). (F) Insulin tolerance test in obese mice exogenously expressing LacZ (control) and Climp-63-myc. n=8 for LacZ and n=10 for Climp-63-myc. Representative of 3 independent experiments. (G) Histological analysis of liver sections derived from obese mice exogenously expressing GFP (left) and Climp-63 (right) stained with hematoxylin and Eosin (H&E). Scale bar: 65.4 um. (H) Liver triglyceride content and (I) 14C-Acetate driven de novo lipogenesis assay; scintillation counts per minute normalized by mg of liver tissue. n=8 liver lobes from 2 obese mice expressing LacZ and n=16 liver lobes from 4 obese mice expressing Climp-63 exogenously (H: ***p=0.0010), (I: ***p=0.0037). (J) Left panel: Immunoblot analysis of indicated proteins in total liver lysates. Right panel: Quantification of the immunoblots. n= 5 for LacZ and 6 for Climp-63-myc. (*p=0.03, **p=0.01, ****p<0.0001). For all graphs, error bars denote s.e.m.
As shown in Figure 5C, expression of Climp-63 in obese mice resulted in a significant decrease in blood glucose levels after 16h fasting and a striking improvement in glucose clearance evaluated by a glucose tolerance test (Figure 5D). Blood glucose levels were also markedly lower in obese mice overexpressing Climp-63 compared to the controls expressing LacZ in the fed state (Figure 5E). Insulin sensitivity was also improved by Climp-63 overexpression (Figure 5F). We observed a striking decrease in lipid accumulation in the liver by both histological examination (Figure 5G) and total triglyceride content in the liver (Figure 5H) upon exogenous Climp-63 expression in obese mice. To determine the reasons associated with decreased lipid accumulation driven by Climp-63 expression, we measured the rate of lipid synthesis in the liver. As shown in Figure 5I the decreased lipid accumulation seems to be a result at least in part from decreased lipogenic capacity measured through the incorporation of 14C-labeled-acetate in de novo lipogenesis in vivo assay. This result may be interpreted as a result of the decrease in lipid synthesis capacity due to the rescue of sheet/tubule ratio. We also observed that liver tissues of obese mice exogenously expressing Climp-63 shows less signs of stress as demonstrated by decreased levels of ATF4 and CHOP (Figure 5J). Thus, correcting the architectural organization of the ER in livers from obese mice is sufficient to improve ER function and hepatic and systemic metabolism.
Discussion
In all systems, structure is a critical determinant of function. In static systems, only a limited number of tasks can be achieved within the constraints of a rigid and inflexible construction. In living cells, the vast diversity and highly dynamic nature of tasks demand sub-cellular structural complexity as well as flexibility to support functional integrity and survival and to maximize the repertoire of proper and compartmentalized responses generated from biological infrastructure. Metabolic processes are also exceedingly complex and compartmentalized and demand high level of adaptive flexibility. However, how architectural regulation interfaces with metabolic response is a poorly understood aspect of biology, especially at the tissue level. Here, we used the ER as one of the central architectural assembly of the cells and examined structure-function relationship in the context of metabolic homeostasis in health and disease, using obesity as a model.
We performed extensive ultrastructure imaging including 3D reconstruction, and provide what we believe to be, the most detailed characterization of the subcellular architecture in liver tissue in both health and disease context. Our analyses include the imaging and segmentation of the organelle structures in 1.8 trillion voxels, covering more than 15 full or partial hepatocytes in liver tissue at 8nm isotropic pixel size under different metabolic conditions. These large-scale analyses demonstrated that alterations in the architectural organization of ER subdomains is a key determinant of dysfunction under metabolic stress in the context of obesity. We determined that in lean hepatocytes, ER is organized in parallel stacks of sheets and a network of tubules in 50% ratio. In hepatocytes from obese mice, ER displays a striking loss of parallel ER sheets which are mostly the rough ER and a decrease in sheet/tubule ratio to 20%. It’s important to note that the high isotropic resolution of the FIB-SEM and 3-dimensional analysis allowed the precise visualization and quantification of tubular ER ultrastructure, a complex structure which has been very challenging to capture in detail in tissue setting with other imaging approaches, and consequently, have not been studied with precision in vivo.
Importantly, we also showed here that restructuring ER sheets was sufficient to increase ER’s folding capacity and ER’s capacity to handle Ca2+ which had strikingly positive effects on cellular and systemic lipid and glucose metabolism in obesity. Hence, by simply changing ER structure, it is possible to improve hepatocyte function and metabolic homeostasis. The impact of the increased ER sheets on metabolism may occur as a consequence of the activity and abundance of proteins/enzymes that are housed in each ER subdomain. For example, we showed that rescuing ER sheets reflected in the recovery of the Sec61 translocon complex and polysome association with ER membrane. Other possibilities could also be envisioned regarding how exactly rescuing ER sheets with Climp-63 would result in altered ER function, including interactions with microtubules17–20 and restricting the lateral mobility of translocon complex1,18,21–23. Regardless, however, an exciting prospect of our observations is that structure is a prerequisite for metabolic programming in response to hormonal or nutritional cues, and such a regulatory circuit could open up new avenues in understanding endocrine and metabolic homeostasis.
The data generated by this work provide the field a significant amount of information that can be further explored with different questions related to subcellular architecture. It’s important to highlight that although the analysis involved extensive sample preparation, high resolution imaging, automated image segmentation and reconstruction, all of which were extremely demanding processes in terms of human labor and computing power, in our view this workflow allows precise understanding of the structure-function relationship in the native tissue context and how this could be possibly linked to metabolic function in health and disease.
Similar to all physical systems in the universe, this is in accordance with a tendency towards disorganization and randomness. Loss of structural integrity and functional capacity leads to aging and disease and accumulation of entropy slowly overwhelms the maintenance systems24. Thus, we suggest that preserving the architectural organization and flexibility of the hepatic ER may lead to diverse therapeutic opportunities.
Funding
This project is supported by the Sabri Ulker Center for Metabolic Research. GP is supported by an NIH training grant (5T32DK007529-32).
Author contributions
G.P. and A.P.A. formulated the questions, designed the project and performed the in vitro and in vivo experiments, analyzed the data, prepared the figures, and wrote and revised the manuscript. E.C., E.G, N.M, Y.L performed and assisted in vitro and in vivo experiments and part of the imaging analysis. S.P., C.S.X, and H.F.H. performed, supervised and executed collection of the FIB-SEM data. G.S.H. conceived, supervised and supported the project, designed experiments, interpreted results, and revised the manuscript.
Competing interests
C.S.X and H.F.H are the inventors of a US patent assigned to HHMI for the enhanced FIB-SEM systems used in this work: Xu, C.S., Hayworth K.J., Hess H.F. (2020) Enhanced FIB-SEM systems for large-volume 3D imaging. US Patent 10,600,615, 24 Mar 2020.
Supplementary Materials
Materials and Methods
Extended Data Fig. S1-S5
Tables S1-S2
Movies 1-9
Movie 1. 3D reconstruction and segmentation of FIB-SEM images derived from liver volume from lean mice. Reconstruction of 5638 consecutive images of a liver tissue volume corresponding to 96μm(x), 64μm(y), 45μm(z) at voxel size of 8 nm in x, y, and z dimensions. ER is segmented in green, mitochondria in purple and lipid droplets in yellow. (Figure 2B).
Movie 2. 3D reconstruction and segmentation of FIB-SEM images derived from liver volume from obese mice. Reconstruction of 7896 consecutive images of a liver tissue volume corresponding to 81μm(x), 73μm(y), 63μm(z) at voxel size of 8 nm in x, y, and z dimensions. ER is segmented in green, mitochondria in purple and lipid droplets in yellow. (Figure 2E).
Movie 3. Segmentation of organelles in liver volume from lean mice. ER (green), mitochondria (purple), lipid droplets (yellow) and nucleus (gray), in a volume of 5.4×10¹¹ voxels of liver tissue, were segmented using deep learning - convolutional neural networks (CNN). (Figure 2C).
Movie 4. Segmentation of organelles in liver volume from obese mice. ER (green), mitochondria (purple), lipid droplets (yellow) and nucleus (gray), in a volume of 7.3×10¹¹ voxels of liver tissue, were segmented using deep learning - convolutional neural networks (CNN). (Figure 2F).
Movie 5. Visualization of ER organization in sub-volume of a hepatocyte from lean mice. ER (green) and mitochondria (purple) highlighting the predominance of ER sheets in the sample (1000×1000×400 pixels). (Figure 3A).
Movie 6. Visualization of ER organization in sub-volume of a hepatocyte from obese mice. ER (green) and mitochondria (purple) highlighting the predominance of ER tubules in the sample (1000×1000×400 pixels) (Figure 3B).
Movie 7. Fly-through visualization of ER and mitochondria organization in liver volume from lean mice. A liver volume of 8×8×3.2 um3 was rendered using Houdini SideFX. Detailed views of ER sheets and tubules are shown in white and mitochondria and cristae are shown in red. (Figure 3C).
Movie 8 and 9. Fly-through visualization of ER and mitochondria organization in liver volume from obese mice. Liver volumes of 8×8×3.2 um3 from two separate obese mice were rendered using Houdini SideFX. Detailed views of ER sheets and tubules are shown in white and mitochondria and cristae are shown in red. (Figure 3D and Extended Data Fig. 3).
Material and Methods
General animal care, study design and animal models
All in vivo studies are approved by the Harvard Medical Area Standing Committee on Animals.The mice were maintained from 6 to 12 weeks old on a 12-hour-light /12-hour-dark cycle in the Harvard T.H. Chan School of Public Health pathogen-free barrier facility with free access to water and to a standard laboratory chow diet (PicoLab Mouse Diet 20 #5058, LabDiet). As an animal model of obesity, we used the leptin deficient B6.Cg-Lepob/J (ob/ob) mouse in the C57BL/6J genetic background (Stock no. 000632). As controls, we used aged and gender matched ob/+ hets (Stock no. 000632) and homozygous (+/+) (Stock no. 000664). These animals were purchased from Jackson Laboratories at 6-7 weeks of age and used for experimentation between 8-11 weeks of age. In animal experiments, all measurements were included in the analysis. The sample size and number of replicates for this study were chosen based on previous experiments performed in our lab and others 14. No specific power analysis was used to estimate sample size.
Adenovirus-mediated overexpression of Climp-63
For exogenous Climp-63 (CKAP4) expression, mouse Climp-63 tagged with Myc-DDK in the C terminal (Origene Catalog: MR215622) was cloned in an Ad5 backbone from Vector BioLabs. The adenovirus (serotype 5, Ad5) was generated, amplified and double purified in CsCl by Vector Biolabs. The adenovirus was administered to 8 weeks-old ob/ob mice retro-orbitally, at a titer of 1.2×10⁹ IFU/mouse. Metabolic studies were performed between day 7-12 after infection. The animals were sacrificed after 14 days of infection for ex vivo experiments.
Glucose and insulin tolerance tests
For glucose tolerance test, animals were overnight fasted and subjected to an intraperitoneal (i.p.) glucose injection (Wt: 1.5 g kg−1, ob/ob:1.0 g kg−1). Blood glucose levels were measured throughout the first 120 minutes of the glucose injection. For the insulin tolerance test, food was removed for 6 hours (from 9 am to 3 pm). Animals were subjected to an i.p. injection of insulin (Wt: 0.8 U/Kg and ob/ob 1.5U/Kg). Insulin was diluted and prepared in 0.1% BSA.
Liver triglyceride measurements
Liver tissues (~100mg) were homogenized in 1.2mL of water using a TissueLyser (Qiagen) for 5min, at 30f/s, 2 cycles at 4°C. Next, samples were vortexed and 100μL of the homogenate was transferred to a 1.5mL tube and 125μL of chloroform and 250μL of Methanol were added. Samples were vortexed briefly and incubated for 5 min. Additional 125μL of chloroform was added. Next, 125μL of water was added and samples were vortexed and centrifuged at 3000rpm for 20 min at 4°C. Around 150μL of the lower phase was collected in a 1.5mL tube and chloroform was evaporated in a heated vacuum oven. Lipids were then re-suspended in 300uL of ethanol. Triglyceride was measured by a Randox Tg Kit (catalog number TR213) from Randox Laboratories.
Lipogenesis assay
Obese (ob/ob) mice (~10 weeks old) in the fed state were injected with 1.5U/kg insulin. After 60 minutes, mice were injected with 10μM cold Acetate and 25μCi 14C-Acetate diluted in PBS in a total of 250uL. After 60 minutes, animals were sacrificed, total liver was weighted, and 4 pieces of different lobes were collected from each animal and frozen in liquid nitrogen. Lipids were extracted similarly described in Liver Tg Measurements section above and the lower phase was carefully transferred to 4 ml liquid scintillation fluid in a scintillation vial and 14C activity was measured.
Liver Histology
Livers were fixed in 10% zinc formalin overnight and then transferred to 70% ethanol for prolonged storage. Tissue processing, sectioning, and staining with hematoxylin and eosin was performed by the Dana Farber/Harvard Cancer Center rodent histopathology core.
Transmission electron microscopy (TEM)
Whole liver tissue: 8-10 weeks old Wt and ob/ob mice were anesthetized with 2mg/ml xylazine and 2mg/ml ketamine and perfused with 10mL of saline followed by 10mL of fixative buffer containing 2.5% glutaraldehyde, 2.5% paraformaldehyde in 0.1 M sodium cacodylate buffer (pH 7.4) (Electron Microscopy Sciences, catalog no: 15949). After perfusion, small pieces (1-2 mm3) of liver were immersed in the same fixative buffer described above and then sliced at 300-micron thickness with a compresstome (Precisionary Instruments, catalog no: VF-300-0Z). The first 3 slices (~900um) were discarded to reach the full-mid-section cut. The slices were transferred into a fresh fixative solution containing 4 parts of FP stock (2.5 % PFA, 0.06 % picric acid in 0.2M Sodium Cacodylate buffer pH 7.4) and 1 part of 25 % glutaraldehyde and incubated at 4C overnight. Primary hepatocytes: Cells were fixed in a 1:1 ratio in a fixative buffer and Williams Medium. The fixative buffer contained: 4 parts of FP stock (2.5 % PFA, 0.06 % picric acid in 0.2M Sodium Cacodylate buffer pH 7.4) and 1 part of 25 % glutaraldehyde for at least 2h. The tissue slices or cell pellets were then washed in 0.1M cacodylate buffer and post-fixed with 1% Osmiumtetroxide (OsO4) / 1.5% Potassiumferrocyanide (K2FeCN6) for 1 hour, washed two times in water and one time in 50mM maleate buffer pH 5.15 (MB), incubated in 1% uranyl acetate in MB for 1hr followed by 3 washes in MB and subsequent dehydration in grades of alcohol (10min each; 50%, 70%, 90%, 2×10min 100%) followed by incubation for 1hr in propylene oxide. The samples were incubated overnight at 4C in a 1:1 mixture of propylene oxide and TAAB Epon (TAAB Laboratories Equipment Ltd, https://taab.co.uk). The following day, samples were embedded in TAAB Epon and polymerized at 65C for 48 hrs. Sectioning and imaging: ultrathin sections (about 90nm) were generated using a Reichert Ultracut-S microtome and imaged with a JEOL 1200EX electron microscope at 80kV. Images were recorded with an AMT 2K CCD camera. For the whole liver, sections were imaged in low magnification and portal triad and central vein were located. The high magnification images were collected in the intermediary zone, in between the portal and central vein.
TEM analysis (Parallel and non-parallel organization of ER)
Whole hepatocyte mid-cross-sectional areas were captured at 1500x magnification with a JEOL 80Kb electron microscope. ER was manually annotated as a single pixel wide filament and binary masks of ER were generated with Fiji. Each filament of ER was searched for a nearby neighbor ER filament at the direction perpendicular to the tangent to the curve in a range of 5-20 pixels (corresponds to 55-225 nm distance at 1500x magnification) in Matlab. If more than 50% of the two neighboring ER traces were within the range search, they were accepted as parallel organized. Parallel organized and non-parallel organized ER traces were exported as Tiff images and ratios were calculated from these images using Fiji. The code can be downloaded at https://github.com/gparlakgul
FIB-SEM sample preparation
300um thick tissue samples were fixed and prepared as described in TEM section. Samples were washed in ice-cold 0.15 M Na-cacodylate buffer for 5 min, 3 times and then incubated in 0.15 M Na-cacodylate solution containing 1% OsO4 and 1.5% potassium ferrocyanide for 1h at 4C. Samples were rinsed with water 3 times and incubated for 20 min in 1% thiocarbohydrazide and rinsed again 3 × 5 min with water. Samples were incubated in 2% OsO4 for 30 min and then rinsed 3 × 5 min with water, followed by washing with 50mM maleate buffer pH 5.15 (MB) 3 times and incubated overnight at 4C in 1% uranyl acetate in MB. Next day, samples were washed and subsequently dehydrated in grades of alcohol (10min each; 50%, 70%, 90%, 2×10min 100%). Samples were embedded in increasing concentrations of Durcupan resin mixed with ethanol (30min each; 50%, 70%, 90% and 100% Durcupan) followed by a 4 hr incubation in 100% Durcupan. The samples were moved to fresh 100% Durcupan and polymerized at 65C for 24 hrs. Samples were each first mounted to the top of a 1 mm copper post which was in contact with the metal-stained sample for better charge dissipation, as previously described 4. A small vertical sample post was trimmed to the Region of Interest (ROI) with a width of 100~130 μm and a depth of 90~100 μm in the direction of the ion beam for each sample. The trimming was guided by X-ray tomography data obtained by a Zeiss Versa XRM-510 and optical inspection under a microtome. A thin layer of conductive material of 10-nm gold followed by 100-nm carbon was coated on the trimmed samples using a Gatan 682 High-Resolution Ion Beam Coater. The coating parameters were 6 keV, 200 nA on both argon gas plasma sources, 10 rpm sample rotation with 45-degree tilt.
3D large volume FIB-SEM imaging
Samples were imaged sequentially by three customized FIB-SEM systems, each with a Zeiss Capella FIB column mounted at 90° onto a Zeiss Merlin SEM. Details of the Enhanced FIB-SEM systems were previously described 2–4. Each block face was imaged by a 3nA electron beam with 1.2 keV landing energy at 2 or 3 MHz. A faster SEM scanning rate was applied on samples with stronger staining contrast. The x-y pixel size was set at 8 nm. A subsequently applied focused Ga+ beam of 15nA at 30 keV strafed across the top surface and ablated away 8 nm of the surface. The newly exposed surface was then imaged again. The ablation – imaging cycle continued about once every 60 (3 MHz) to 90 (2 MHz) seconds for two weeks to complete FIB-SEM imaging of one sample. The sequence of acquired images formed a raw imaged volume, followed by post processing of image registration and alignment using a Scale Invariant Feature Transform (SIFT) based algorithm.
FIB-SEM segmentation
The organelles, cells and nuclei have been segmented using the 3dEMtrace platform of ariadne.ai ag (https://ariadne.ai/). In brief, ground truth data was generated from the raw FIB-SEM images by manually annotating cells and organelles. Deep convolutional neural networks (CNNs) have been trained using the manually generated ground truth and fine-tuned until a good quality of segmentation was reached for automated segmentation in 3D. The accuracy of the segmentation has been validated by expert inspection. In addition, the accuracy has been quantified by calculating the Jaccard Index or evaluating the object-level recall/precision and f1-score in validation sub-volumes that have not been used for CNN training. Binary Tiff masks were generated for each organelle class separately. For the cells an instance segmentation was provided in order to assign a unique identifier to each cell. Post-segmentation proofreading and correction was done using the open-source software Knossos (https://knossos.app/) and the commercially available Arivis Vision 4D software.
FIB-SEM ER sheet and tubule sub-segmentation
The segmentation of the sub-compartments of endoplasmic reticulum (ER sheets and ER tubules) was done by using the binary ER masks: 12 images from different layers of each dataset were chosen randomly as training data. ER sheets and ER tubules were annotated manually as separate classes by labeling both lipid bilayer and also filling in the ER luminal space. U-Net-architecture-based machine learning approach has been utilized to train and segment the data by segmenting, for each dataset, each plane using that plane plus the previous and subsequent planes as input. The code can be downloaded at https://github.com/gparlakgul
FIB-SEM data analysis and visualization
Raw FIB-SEM data and binary Tiff stacks for each organelle class were uploaded to Arivis Vision 4D software as separate channels and .sis files were generated. Each individual cell and organelle were re-segmented in Vision 4D to create objects. Quantitative measures such as volume, voxel number, surface area and sphericity were calculated. Unspecific objects with less than 10 voxels were eliminated for organelle volume quantification. Movies were generated with Arivis Vision 4D, except Fig3C and Fig3D movies, which were generated in Houdini (SideFX) by Ho Man Leung (Refik Anadol Studio, CA).
Cell culture
Hepa 1-6 cells were cultured in DMEM with 10% CCS. Cos-7 cells were cultured in DMEM with 10% FBS. All cells were cultured at 37°C in a humidified incubator that was maintained at a CO2 level of 10%. For the overexpression, Climp-63-Myc plasmid was acquired from Origene (catalog no: MR215622). The plasmid was transfected into Hepa 1-6 and Cos-7 cells using lipofectamine LTX overnight in OptiMEM media and the experiments were done after 36-48h after transfection.
Primary hepatocyte isolation
Animals were anesthetized using 2 mg/ml xylazine and 2 mg/ml ketamine in PBS. The livers were perfused with 50 mL of buffer I (11 mM Glucose; 200 μM EGTA; 1.17 mM MgSO4 heptahydrated; 1.19 mM KH2PO4; 118 mM NaCl; 4.7 mM KCl; 25 mM NaHCO3, pH 7.32) through the portal vein with an osmotic pump set to the speed of ~4 mL/min until the liver turned pale. The speed was gradually increased until ~7 mL/min afterwards. When the entire buffer I had been infused, it was substituted for 50 mL of buffer II (11 mM Glucose; 2.55 mM CaCl2; 1.17 mM MgSO4 heptahydrated; 1.19 mM KH2PO4; 118 mM NaCl; 4.7 mM KCl; 25 mM NaHCO3; BSA (fatty acid free) 7.2 mg/mL; 0.18 mg/mL of Type IV Collagenase (Worthington Biochem Catalog: LS004188), BSA and collagenase were added immediately before use. The buffers were kept at ~37oC during the entire procedure. After perfusion, the primary hepatocytes were carefully released and sedimented at 500 rpm for 2 minutes, washed two times and suspended with Williams E medium supplemented with 5 % CCS and 1 mM glutamine (Invitrogen, CA). To separate live from dead cells, the solution of hepatocytes was layered on a 30% Percoll gradient and centrifuged ~1500 rpm for 15 minutes. The healthy cells were recovered at the bottom of the tube and plated for experimentation.
Total protein extraction and Immunoblotting
Liver tissues were homogenized in a polytron in cold lysis buffer containing 50 mM Tris-HCl (pH 7.4), 2 mM EGTA, 5 mM EDTA, 30 mM NaF, 10 mM Na3VO4, 10 mM Na4P2O7, 40 mM glycerophosphate, 1 % NP-40, and 1% protease inhibitor cocktail. After 20-30 minutes incubation on ice, the homogenates were centrifuged at 9000 rpm for 15 minutes to pellet cell debris. The supernatant was removed, and protein concentrations were determined by BCA. The samples were then diluted in 6x Laemmli buffer and heated at 95°C for 5 minutes. The protein lysates were subjected to SDS-polyacrylamide gel electrophoresis, as previously described (Fu et al, 2012). All the immunoblots were incubated with primary antibody overnight at 4°C, followed by incubation with secondary antibody conjugated with horseradish peroxidase (Cell Signaling Technologies) for 1-3 hour at room temperature. Individual membranes were visualized using the enhanced chemiluminescence system (Roche Diagnostics).
Primary antibody list
anti- Sec61β: Cell Signaling Technology, catalog no: 14648. anti-Sec61α: Cell Signaling Technology, catalog no: 14868. anti-Trapα: Santa Cruz Biotech., catalog no: sc-134987. anti-Calnexin: Santa Cruz Biotech., catalog no: sc-6465. anti-β-tubulin-HRP: Abcam, catalog no: ab21058 anti-Climp-63 (CKAP4): Novus Biologicals, catalog no: NBP1-26642 and Abcam, catalog no: ab84712. anti-p180 (RRBP1): Abcam, catalog no: ab95983. anti-Atlastin-3: home-made antibody, generously provided by Dr. Craig Blackstone’s lab at NIH. anti-Reticulon4 (Nogo): Novus Biologicals, catalog no: NB100-56681. anti-Reep5 (Dp1): Proteintech, catalog no: 14643-1-AP. anti-Ribophorin1: Santa Cruz Biotech., catalog no: sc-12164. anti-Ribophorin2: Santa Cruz Biotech., catalog no: sc-166421. anti-L7a: Cell Signaling Technologies, catalog no: 2415. anti-ATF4: Cell Signaling Technologies, catalog no: 11815. anti-CHOP: Cell Signaling Technologies, catalog no: 2895. anti-PDI: Cell Signaling Technologies, catalog no: 3501. anti-Myc-Tag: Cell Signaling Technologies, catalog no: 2278. anti-Myc-Tag - Alexa Fluor 647: Cell Signaling Technologies, catalog no: 2233. anti-KDEL - Alexa Fluor 488: Abcam, catalog no: ab184819.
Secondary antibody list
anti-rabbit IgG - HRP: Cell Signaling Technologies, catalog no: 7074. anti-mouse IgG - HRP: Cell Signaling Technologies, catalog no: 7076. anti-goat IgG - HRP: Santa Cruz Biotech, catalog no: sc-2020. anti-rabbit IgG Alexa Fluor 594: Cell Signaling Technologies, catalog no: 8889. anti-rabbit IgG Alexa Fluor 488: Cell Signaling Technologies, catalog no: 4412. anti-rabbit IgG Alexa Fluor 647: Cell Signaling Technologies, catalog no: 4414.
Gene expression analysis
Tissues were disrupted in TRIzol (Invitrogen) using TissueLyser (Qiagen). Chloroform was added to the Trizol homogenates, vortexed thoroughly and centrifuged 12000g for 20 min at 4oC. The top layer was transferred to another tube and mixed with isopropanol and centrifuged again at 12000g for 20 min at 4oC. The RNA found in the precipitate was washed twice with 70% Ethanol and diluted in RNAse free water. Complementary DNA was synthesized using iScript RT Supermix kit (Biorad). Quantitative real-time PCR reactions were performed in triplicates on a ViiA7 system (Applied Biosystems) using SYBR green and custom primers or primer sets based on Harvard Primer Bank. Gene of interest cycle thresholds (Cts) were normalized to TBP housekeeper levels by the ΔΔCt. Primers used are listed in Supplementary Table 2.
Endogenous protein staining and confocal imaging
Primary hepatocytes, Hepa1-6 or Cos-7 cells were seeded on 35 mm round glass bottom imaging dishes in Williams Medium in the presence of 5% CCS (for primary hepatocytes) and DMEM in the presence 10% CCS/FBS overnight at 37°C, 5% CO2. The following morning, cells were washed and fixed with 4% paraformaldehyde for 10 min at room temperature (RT) and washed 3x in PBS, before a 20 min permeabilization using 0.2% Triton-X100 in PBS at RT. Primary antibodies were diluted 1:200 for Sec61β antibody, Cell Signaling Technologies (14648) in PBS and the cells were incubated in this solution overnight at 4°C. Next day, cells were washed 3x with PBS, including one long wash for more than 10 min. Secondary antibody was diluted 1:1000 in PBS, and the cells were incubated with it at RT for 1h in the dark. The cells were washed 3x, including one long wash, and if needed, Hoechst was used as nuclear marker, diluted 1:5000 in PBS and incubated for 10 min at RT. Cells were imaged with a Yokogawa CSU-X1 spinning disk confocal system (Andor Technology, South Windsor, CT) with a Nikon Ti-E inverted microscope (Nikon Instruments, Melville, NY), using a 60x or 100x Plan Apo objective lens with a Zyla cMOS camera and NIS elements software was used for acquisition parameters, shutters, filter positions and focus control. Image analysis was performed using Fiji software. Raw single plane Tiff images were analyzed using a Macro and mean intensity values were calculated per image. Fiji Macro can be downloaded at https://github.com/gparlakgul
Cytosolic Ca2+ imaging
Primary hepatocytes were loaded with 4 μM Fura-2AM and 1 μM Pluronic F-127 in HBSS for ~30 min at room temperature. Before imaging, the cells were washed and kept for 5 min in a medium containing 10 mM Hepes, 150 mM NaCl, 4 mM KCl, 2 mM EGTA and 3 mM MgCl2, 10 mM D-glucose, pH 7.4. Cells were stimulated with 1 μM Thapsigargin (Tg) for indirect ER Ca2+ measurements. Ratio-metric Fura-2AM imaging was performed by alternatively illuminated with 340 and 380 nm light for 250ms using a Lambda DG-4; Sutter Instrument Co. Emission light > 510 nm was captured using a Zyla cMOS camera. Images of both channels were collected every 5 seconds with NIS elements software. Images were background corrected and analyzed in Fiji.
ASGR assay
The ASGR reporter plasmid described in Fu, S et al 201513 was cloned in an Adenovirus Ad5 backbone from Vector BioLabs. The adenovirus (serotype 5, Ad5) was generated and amplified by Vector Biolabs. For the experiments in primary hepatocytes, cells were infected with 30 MOI in 12 or 24 well plates with Ad-ASGR and Ad-LacZ or Ad-Climp-63 viruses. The next day, cells were changed to a fresh medium containing phenol-red-free Williams E supplemented with 5 % CCS and 1 mM glutamine (Invitrogen, CA) and incubated for 22 to 24 hours. 10 ul of supernatant was transferred to two 96-well white plates for luciferase assays following the manufacturer’s protocol. Briefly, 50 ul of luciferase substrate (1 uM Cypridina or 10 mM CTZ in 100 mM tris buffer, pH 7.5) was added to the 10 ul medium and incubated in the dark for 5 to 10 min. The luminescence was read on SpectraMax Paradigm plate reader (Molecular Devices).
Total ER and rough and smooth ER isolation
For the total microsome isolation: subcellular fractionation of the liver was done based on published protocols 14,15. Briefly, mice were sacrificed and 1g of liver was immediately weighed and washed in cold Buffer 1 (content described below). The tissue was minced and immersed in Buffer2. The tissue was filtered in order to eliminate the blood and transferred to a glass potter in 15mL of Buffer1 and further disrupted by Dounce homogenization. The homogenate was spun down at 740g for 5 min twice in a low-speed centrifuge; the supernatant was recovered and further centrifuged for 10 min at 10,000g, 3 times. The resulting pellet (crude mitochondrial fraction) was discarded and the supernatant was used for the collection of the ER fraction which was obtained by centrifuging the supernatant at 100.000g for 60 min. Buffer1: Mannitol 225mM, Sucrose 75mM, Tris-HCl 30mM, BSA 0.5% and EGTA 0.5mM, pH7.4. Buffer2: Mannitol 225mM, Sucrose 75mM, Tris-HCl 30mM, BSA 0.5%, pH 7.4. Buffer3: Mannitol 225mM, Sucrose 75mM, Tris-HCl 30mM, pH 7.4. For the rough and smooth ER fractionation: the fractionation protocol was based on Margolis, et al, 197925 with small modifications. Briefly, mice were sacrificed by cervical dislocation, the liver was excised, weighted and washed in a petri dish containing ice-cold sucrose buffer. Liver was transferred to a beaker containing in ice-cold fresh sucrose buffer and minced in small pieces. The buffer was removed through a mesh filter and a volume of sucrose buffer was added an equivalent to ~5 times volume to the weight of the livers. The liver pieces were then transferred to a 15mL Dounce homogenizer with a Teflon pestle and homogenized with 5 strokes. The mixture was centrifuged 2 times at 10.000g for 20 min in a slow speed centrifuge, rotor: JA-17. The pellet containing mitochondria, and other contaminants were discarded. CsCl was added to the supernatant to make a final concentration of 15mM CsCl with using 1M CsCl stock solution. The supernatant was then layered on top of 15ml of 1.3M sucrose + 15mM CsCl in an Beckman SW32 Ti centrifuge tube (Cat No: 344058).The solution was completed to 34ml.s with 0.25M sucrose buffer and centrifuged for 4 hours at 105,000g, 4°C (with Beckman SW32 rotor). The pellet will contain rough microsomes and the interface between 0.25-1.3M will contain smooth microsomes. The supernatant above the band was drawn off (soluble fraction) and saved on ice and the pellet was resuspended in 0.25 M sucrose by gentle homogenization in a glass homogenizer. Both subfractions were centrifuged in a Ti50 rotor at 225,000g for 1h (Beckman Type 70.1Ti rotor) at 4C. Final pellets were resuspended in 0.25 M sucrose. Sucrose buffer: 250mM Sucrose and 50mM Tris pH7.4 + protease inhibitor cocktail, pH’d 7.2 at 4C.
Statistical Analysis
Statistical significance was assessed using GraphPad Prism Version 7, using the Student’s t-test and P values are indicated in the figure legends. All data is mean ± SEM.
Acknowledgements
We are especially grateful for Ho Man Leung, Nicholas Boss and Refik Anadol for their artistic talent and vision, visualization of the data, generating videos and generously sharing the resources and expertise of the Refik Anadol Studio (Los Angeles, CA). We would like to thank Elizabeth Benecchi, Maria Ericsson and Louise Trakimas for their help in sample preparation for TEM. We appreciate Marcelo Cicconet for his help with generating the Matlab codes. We are thankful to Dr. Craig Blackstone for his generosity in providing the Atlastin antibodies. We would like to thank Christopher Zugates for his help and guidance in using the Arivis Vision 4D software. We appreciate Adrian Wanner, Jörgen Kornfeld and the whole Ariadne team’s effort and help with the segmentation. We thank all members of the Sabri Ulker Center and Hotamisligil Lab community for their continued support and encouragement.
Footnotes
Added supplemental videos and link
https://www.youtube.com/playlist?list=PLpzquMkvsJ9XZvqAKyHcz62iDQkoKxmpx
References


