

Abstract
Primary motor cortex (M1) undergoes protracted development in rodents, functioning initially as a sensory structure. As we reported previously in neonatal rats (Dooley and Blumberg, 2018), self-generated forelimb movements—especially the twitch movements that occur during active sleep—trigger sensory feedback (reafference) that strongly activates M1. Here, we expand our investigation by using a video-based approach to quantify the kinematic features of forelimb movements with sufficient precision to reveal receptive-field properties of individual M1 units. At postnatal day (P) 8, nearly all M1 units were strongly modulated by movement amplitude, but only during active sleep. By P12, the majority of M1 units no longer exhibited amplitude-dependence, regardless of sleepwake state. At both ages, movement direction produced changes in M1 activity, but to a much lesser extent than did movement amplitude. Finally, we observed that population spiking activity in M1 becomes more continuous and decorrelated between P8 and P12. Altogether, these findings reveal that M1 undergoes a sudden transition in its receptive field properties and population-level activity during the second postnatal week. This transition marks the onset of the next stage in M1 development before the emergence of its later-emerging capacity to influence motor outflow.
Introduction
Despite its name, primary motor cortex (M1) is increasingly appreciated as an integrator of sensory input and a contributor to the learning of new motor skills (Hatsopoulos and Suminski, 2011; Omrani et al., 2016; Heindorf et al., 2018; Kawai et al., 2015). The sensory-processing capabilities of M1 are especially evident in early development before it plays any role in the production of movement: At such ages, M1 functions exclusively as a prototypical sensory structure (Tiriac et al., 2014; Dooley and Blumberg, 2018; Chakrabarty and Martin, 2000). Indeed, in rats through at least postnatal day (P) 12, selfgenerated movements are not produced by M1, but rather by such midbrain structures as the red nucleus (Del Rio-Bermudez et al., 2015; Mukherjee et al., 2018). M1 activity increases only after movements have been generated, indicative of reafferent processing (Tiriac et al., 2014; Tiriac and Blumberg, 2016; Dooley and Blumberg, 2018). After P12, M1’s motor capabilities emerge gradually: Electrical stimulation of M1 does not reliably produce movement until P35 (Young et al., 2012), and the precise age at which M1 activity begins to precede self-generated movements remains unknown. Based on the available evidence, we have proposed that M1 initially develops a sensory foundation in support of its later-developing motor functions (Dooley and Blumberg, 2018).
In early development, reafferent activation of M1 neurons is modulated by behavioral state. Reafference arising from myoclonic twitches—the jerky movements of the limbs and whiskers that occur abundantly during active sleep—robustly and reliably triggers M1 activity, whereas sustained bouts of wake movements result in only weak activation (Tiriac and Blumberg, 2016; Dooley and Blumberg, 2018). Because myoclonic twitches are brief, discrete events that occur against a background of muscle atonia, they are able to convey high-fidelity somatic information to M1. By comparison, spontaneous limb movements during wake are more sustained than twitches and typically involve the simultaneous engagement of multiple muscle groups within and across limbs. As demonstrated in forelimbs, reafferent activity during wake is inhibited early in the processing stream at the level of the external cuneate nucleus (Tiriac and Blumberg, 2016; Dooley and Blumberg, 2018), perhaps to prevent a saturated reafferent signal from muddying downstream sensory representations that are still developing.
In our previous investigation of sensory responses of M1 neurons to self-generated movements (Dooley and Blumberg, 2018), we detected twitches using electromyography (EMG) in a single forelimb muscle (biceps brachii). Although EMG allows for the specific characterization of individual muscle activity, it is blind to muscle activity elsewhere in the limb and is insufficient for quantifying the kinematic features of limb movement. However, recent advances in behavioral analysis, including machine vision tools, now enable the efficient tracking of limb movement and the quantification of movement amplitude and direction (Mathis et al., 2018; Nath et al., 2019). Noting that M1 neurons in adult primates are tuned to amplitude and direction during the execution of a movement (Ashe and Georgopoulos, 1994; Schwartz et al., 1988) and that neurons in barrel somatosensory cortex in P5 rats are sensitive to the amplitude of whisker movements (Dooley et al.,2020), we hypothesized that the sensory responses of M1 neurons in infant rats are tuned to the kinematic features of forelimb movements. Here, recording M1 unit activity at P8, we demonstrate robust tuning to the amplitude of forelimb movements during active sleep, but not wake. However, by P12, most M1 units no longer exhibit amplitude-tuning, regardless of sleep-wake state. M1 units also demonstrate direction sensitivity at both ages, although this feature of M1 tuning is less robust than that of amplitude. Finally, neural activity becomes more continuous between P8 and P12, leading to less correlation—and less redundancy—in reafferent activity across M1 units. This developmental shift in kinematic tuning occurs contemporaneously with the emergence of inhibitory neural processing (Dooley and Blumberg, 2018; Alcantara et al., 1993; Ben-Ari et al., 2007), suggesting that the second postnatal week is a sensitive period during which M1 develops a sensory foundation in support of its later-emerging capacity to produce motor outflow and participate in motor learning.
Results
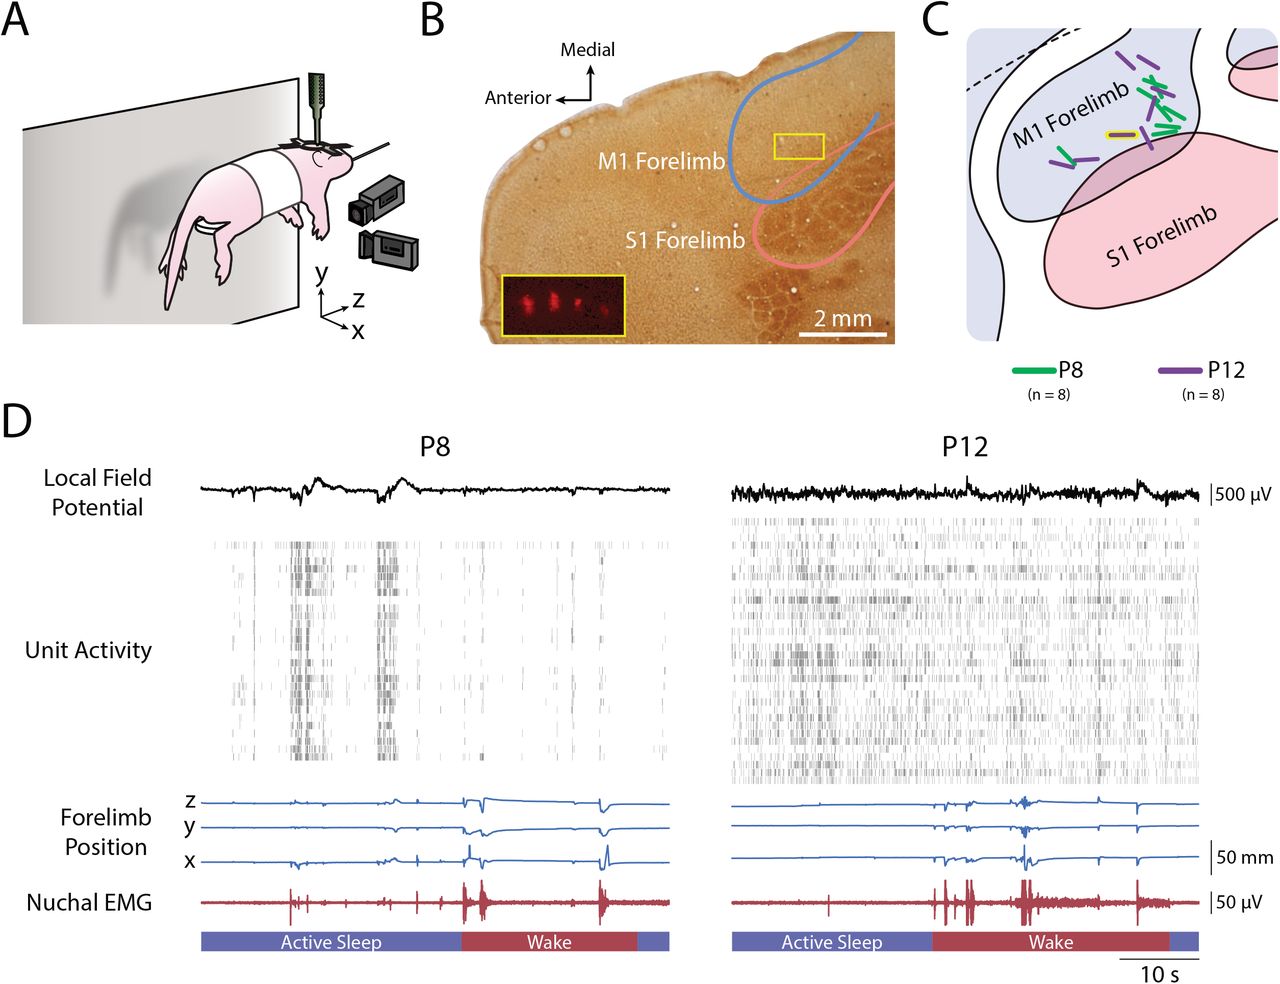
To characterize the relationship between movement kinematics and M1 activity, we tracked forelimb movements in three dimensions using two high-speed (100 frames/s) cameras oriented perpendicularly to each other (Figure 1A). At the same time, we collected single- and multi-unit extracellular recordings in the contralateral forelimb region of M1 (Figure 1B–C). Because preliminary analyses indicated similar results for single- and multi-units, all units were analyzed together. Figure 1D depicts representative behavioral and electrophysiological data collected at each age; most striking is the transition from discontinuous to continuous unit activity from P8 to P12.

(A) P8 and P12 rats were head-fixed, their torso supported, and their limbs left free to dangle. Two cameras were placed orthogonally: One front-view camera captured the x-dimension (medial-lateral) of right forelimb movements, and one side-view camera captured the y-dimension (dorsal-ventral) and z-dimension (anterior-posterior) of forelimb movements. A 4×4 silicon depth electrode was lowered into the forelimb region of contralateral M1 to record extracellular activity. (B) Photomicrograph of an electrode placement in M1. Cortical tissue was flattened before sectioning, followed by staining with cytochrome-oxidase to reveal the primary somatosensory cortical representations. The M1 and S1 forelimb boundaries are depicted as blue and pink lines, respectively. The yellow box in the M1 forelimb region delineates the location of the four-shank electrode for this pup. Inset: magnified view of the four-shank electrode revealed using fluorescence.(C) Electrode placements for the eight subjects at P8 and P12 represented as green and purple lines, respectively. The location of the electrode in (B) is shown with a yellow border. (D) Representative data from a P8 (left) and P12 (right) rat. From top to bottom: the local field potential (LFP) in M1; single- and multi-unit activity in M1, with each row denoting a different single-unit or multi-unit and each vertical tick denoting an action potential; traces of right forelimb position in the x-, y-, and z-dimensions; nuchal EMG activity; and active sleep (blue bars) and wake (red bars).
The trajectory of forelimb movements was quantified using DeepLabCut, a machine vision approach to behavioral analysis (Mathis et al., 2018; Nath et al., 2019). Movement amplitude of the forelimb was aggregated across three dimensions before analysis (Figure 2A). The amplitude of forelimb twitches was exponentially distributed at P8 and P12, with small twitches being more frequent than large twitches (Figure 2B). In contrast, the amplitude of wake movements followed a positively skewed normal distribution. Movement velocity and acceleration were highly correlated with movement amplitude and thus were not analyzed further (Figure 2—figure supplement 1A).

(A) Depiction of how forelimb movement amplitude was calculated. For each detected twitch and wake movement, the position across the x-, y-, and z-dimensions was summed using the Pythagorean theorem. Movement amplitude was defined as the difference between the peak position of the forelimb 0–250 ms after a movement and the median position of the forelimb at baseline (i.e., −0.5 to 0 s before a movement). (B) Mean (±SEM) of the percentage of forelimb twitches (blue) and wake movements (red) as a function of amplitude at P8 (left) and P12 (right). (C) Two-dimensional representation of twitch direction in polar space. The x-dimension (medial-lateral) and the z-dimension (anterior-posterior) are shown. (D) Left: Scatterplot showing the position of the right forelimb at peak twitch displacement for all twitches at P8 (top) and P12 (bottom). Right: Heatmap showing the most common position of the right forelimb at peak twitch displacement for all twitches at P8 and P12.
Analysis of movement direction was limited to the x- and z-dimensions (anterior-posterior and medial-lateral, respectively; Figure 2C). (The forelimb almost always traveled in the positive y-dimension, and therefore that dimension was excluded from the analysis of movement direction; see Figure 2—figure supplement 1B–C). Forelimb twitches occurred in all directions relative to the limb’s resting position (Figure 2D) but were most likely to travel anteriorly at P8 and anteriorly and medially at P12. Movement direction could not be assessed accurately for wake movements because such movements are typically produced in rapid succession with many direction changes.

(A) Bivariate correlations for all twitches (top row, blue) and wake movements (bottom row, red) for movement velocity vs. movement amplitude (left column), movement acceleration vs. movement amplitude (center column), and movement acceleration vs. movement velocity (right column). Twitches and wake movements are pooled within each age. All Pearson r values are significant at p < .05. (B) Relative frequency histograms depict the displacement of twitches (data from P8 and P12 rats combined) along the x- (left), y- (center), and z- (right) dimensions. Note the asymmetrical distribution of twitches in the positive y-dimension, which prompted the exclusion of this dimension in further direction analyses. (C) Side view of right-forelimb movements to show how pendular motion produces only a positive y-displacement.
M1 activity is strongly modulated by behavioral state
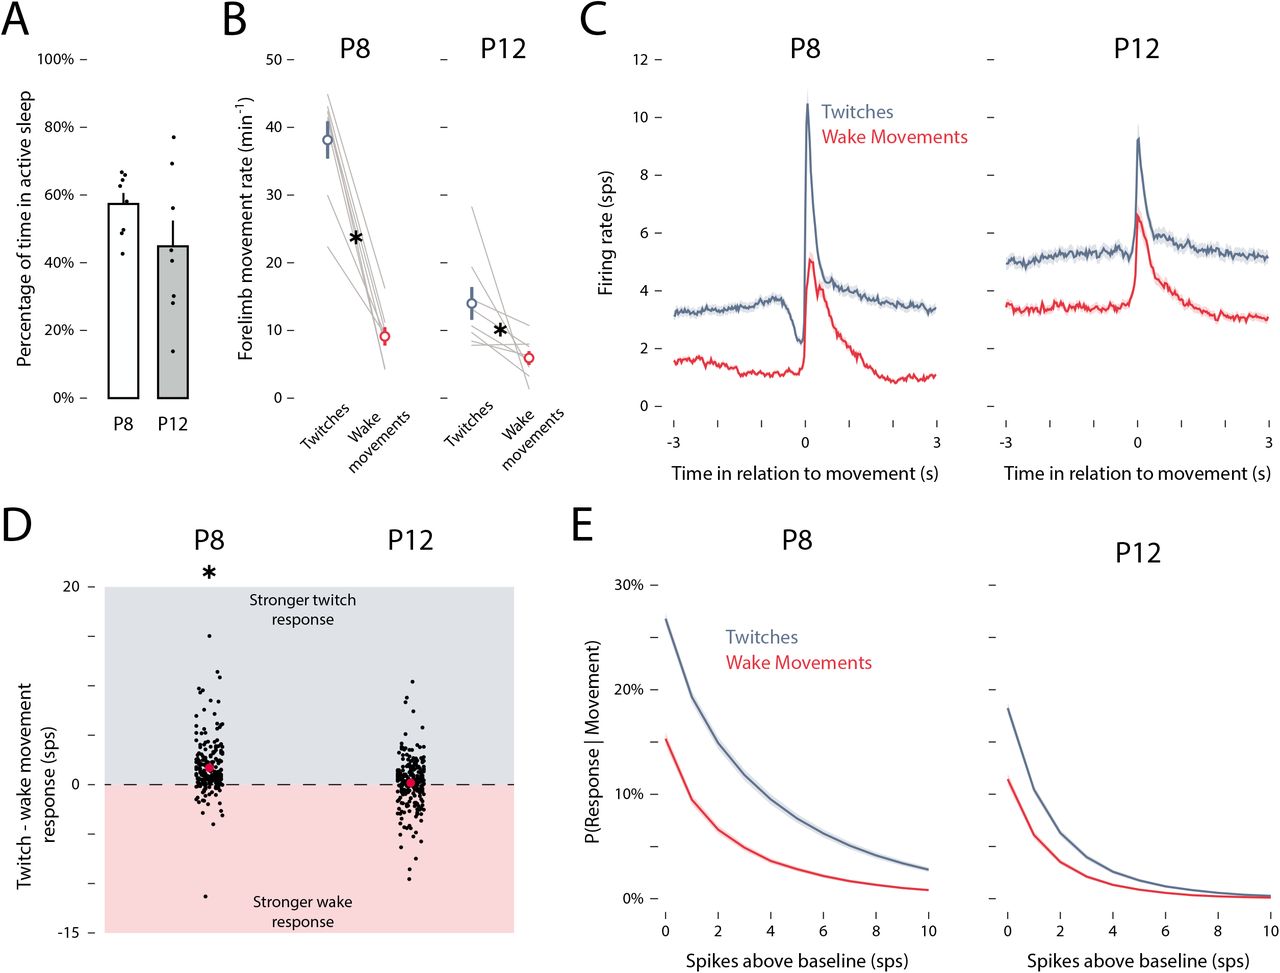
Over the 60-min recording periods, P8 and P12 rats spent 57.4 ± 3.2% and 44.8 ± 7.6% of the time in active sleep, respectively (t(14) = 1.51, p = .153, adj.  ; Figure 2— figure supplement 2A). Twitches occurred significantly more frequently than wake movements at both ages (F(1, 14) = 24.01, p < .001, adj.
  ). The relative abundance of active sleep and twitches, especially at P8, provides ample opportunity for reafference from twitching limbs to drive M1 activity.
Consistent with previous reports (Tiriac and Blumberg, 2016; Dooley and Blumberg, 2018), we found here at P8 that twitches drove relatively more M1 activity than did wake movements (Figure 2—figure supplement 2C). This state-dependence in reafferent activity was significant at P8, but not at P12 (P8: F(1, 216) = 86.14, p < .001, adj.  ; P12: (F(1, 249) = 1.36, p = .245, adj.
  ; Figure 2—figure supplement 2D). Compared with previous studies that relied on EMG to detect movement (Tiriac et al., 2014; Tiriac and Blumberg, 2016; Dooley and Blumberg, 2018), the use here of a videobased method substantially increased the number of twitches and wake movements that were detected. As a consequence, at P8 we now reliably detected more M1 activation in response to wake movements than previously reported (Dooley and Blumberg, 2018; Tiriac and Blumberg, 2016); nonetheless, reafferent responses to twitches were still larger than they were to wake movements. Moreover, at both ages, twitches were more likely than wake movements to trigger M1 activity (Figure 2—figure supplement 2E).
M1 units are highly sensitive to movement amplitude at P8
We recently reported in P5 rats that the amplitude of self-generated whisker movements reliably predicts increased activity in barrel somatosensory cortex (Dooley et al., 2020). Accordingly, we hypothesized here that M1 similarly codes for movement amplitude at P8 and P12. To test this hypothesis, twitches and wake movements were sorted into amplitude bins from 0–16 mm. Amplitude bins were scaled logarithmically in increments from 20 to 24 mm to account for the exponential distribution of twitches. To avoid bias, equal numbers of anterior/posterior and medial/lateral movements were selected at random for these analyses.
At P8, twitches of increasing amplitude triggered increasing unit activation in M1 (Figure 3A). This amplitude-tuning was not observed for wake movements at P8, nor for twitches or wake movements at P12. Figure 3B quantifies the relationship between movement amplitude and response strength—the difference between the firing rate 0–250 ms after a movement and the baseline firing rate (−3 to −2 s before a movement). At P8, response strength significantly increased with respect to increasing twitch, but not wake movement, amplitude (F(1, 216) = 250.27, p < .001, adj.  ). This was not the case at P12 (F(1,249) = 0.42, p = .520, adj.
  ).
).

(A) Peristimulus time histograms of mean firing rate of M1 units in relation to the onset of twitches (blue) and wake movements (red) at P8 (top row) and P12 (bottom row). From left to right, the columns present data for small- (0–1 mm), medium- (2–4 mm), and large- (8–16 mm) amplitude forelimb movements. (B) Mean (±SEM) response strength (Δfiring rate in relation to baseline) for twitches (blue) and wake movements (red) for all M1 units at P8 (left) and P12 (right). Shaded regions indicate 99% confidence intervals based on shuffled data. Asterisk indicates significant difference between twitches and wake movements at P8 (p < .05). (C) Representative example of an individual M1 unit’s relationship between response strength and movement amplitude at P8, and its fit to a logarithmic model. The observed data (blue solid line) and model data (black dashed line) are shown alongside the 99% confidence interval based on shuffled data (blue shaded region). The slope of the model (11.1 sps/mm) indicates the strength of the unit’s relationship with movement amplitude, and the r2 value (.96) represents the goodness-of-fit to the logarithmic function. (D) Applying the method in (C) to all M1 units, the slope and r2 value for each unit is shown for twitches (blue) and wake movements (red) at P8 and P12. The gray-shaded regions represent the 99% confidence based on shuffled data, and the dashed vertical lines represent an r2 threshold of .75. The shaded green regions to the right of the .75 threshold show units that are positively (slope > 0) and negatively (slope < 0) correlated with movement amplitude. (E) Based on the r2 threshold of .75 used in (D), stacked plots show the percentage of units at P8 and P12 that are positively tuned to movement amplitude for twitches (dark blue) and wake movements (dark red), negatively tuned for twitches (light blue) and wake movements (light red), or not tuned (white).

(A) Mean (±SEM) percentage of time spent in active sleep at P8 (white) and P12 (gray). Black dots show values for individual pups. (B) Mean (±SEM) rate of forelimb movements for twitches during active sleep (blue) and wake movements during wake (red) at P8 (left) and P12 (right). Gray lines show values for individual pups. Asterisks denote significance between twitches and wake movements for each age (p < .05). (C) Peristimulus time histograms of mean firing rate of M1 units in relation to twitches (blue) and wake movements (red) at P8 and P12. (D) Mean (±SEM) difference in the reafferent response (i.e., peak firing rate minus baseline firing rate) between twitches and wake movements (red dots) at P8 and P12. Black dots show values for individual units. Asterisks denote significant between twitches and wake movements at P8 (p < .05). (E) Mean probability that a twitch (blue) or wake movement (red) triggered a response in an individual M1 unit as a function of spiking threshold (i.e., firing rate above that unit’s baseline firing rate). Higher spiking thresholds yield smaller response probabilities.
Although wake movements at P8, and all movements at P12, did not show a significant relationship with amplitude when averaged across units, it is still possible that some individual units were amplitude-tuned. To characterize the relationship between movement amplitude and response strength on a unit-by-unit basis, each unit’s response strength was fit to a logarithmic model with respect to movement amplitude (Figure 3C). A logarithmic model was chosen based on the relationship between twitch amplitude and response strength observed at P8. Both the slope and the goodness-of-fit (r2) of the model were used to assess each unit’s relationship with movement amplitude. In Figure 3D, the r2 value and slope of the model for each M1 unit are shown. At P8, the vast majority of M1 units showed positive tuning to amplitude, with r2 values greater than .75 and slopes that exceeded the 99% confidence interval of shuffled data. In contrast, for wake movements at P8 and all movements at P12, only a fraction of M1 units met these criteria, and some units even displayed negative relationships with amplitude (i.e., negative tuning).
As shown in the stacked plots in Figure 3E, nearly all M1 units at P8 exhibited a positive tuning to amplitude (positive: 91.7%; negative: 0%); far fewer units exhibited amplitudetuning to wake movements (positive: 30.9%; negative: 4.2%). At P12, relatively few units exhibited tuning to twitch amplitude (positive: 14.0%; negative: 3.2%) or wake amplitude (positive: 29.6%; negative: 9.2%). Finally, to confirm that these findings were not driven by an arbitrary selection of an r2 threshold of .75, we repeated these tests using thresholds of .50 and .90 and found the same pattern of results (Figure 3—figure supplement 1A).
When positively and negatively tuned units are considered separately, only twitches showed an age-related change in tuning strength: Small twitches (0–2 mm) at P12 were better able than small twitches at P8 to drive M1 activity (F(1.31, 291.02) = 10.01, p = .001, adj.  ; Figure 3—figure supplement 1B). In contrast, amplitude-tuning for wake movements did not change with age for either positively or negatively tuned units. When response strength was standardized (Figure 3—figure supplement 1C), M1 units at P8 showed highly redundant responses to increasing twitch amplitude, but not wakemovement amplitude. At P12, M1 units did not show redundant responses to movement amplitude, regardless of sleep-wake state.
These findings extend previous reports (Tiriac and Blumberg, 2016; Dooley and Blumberg, 2018) by showing that forelimb twitches differentially trigger M1 activity across a range of movement amplitudes. This is the first demonstration of amplitude coding in rodent M1 and is consistent with similar findings in the infant rat whisker system (Dooley et al., 2020).
M1 units are sensitive to movement direction
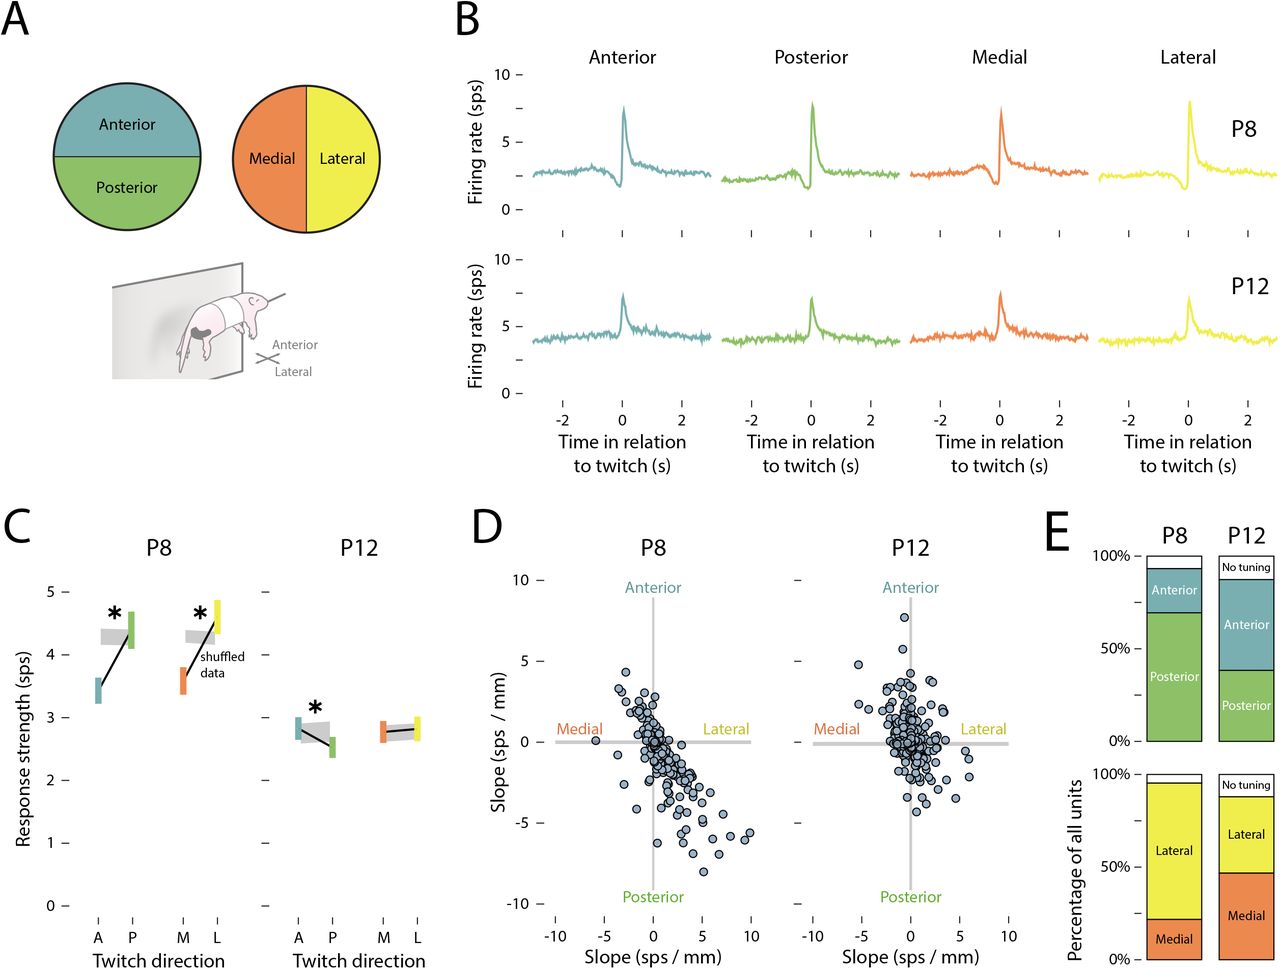
We next analyzed M1 activity as a function of twitch direction. (Because wake movements occur in prolonged bouts with multiple changes in direction, they could not be included in this analysis.) Twitch direction was analyzed separately along two dimensions: Anterior-posterior and medial-lateral (Figure 4A). Again, to avoid bias, we ensured that twitches in each direction had identical amplitude distributions. Twitches of the forelimb in each direction produced similar responses in M1 neurons at both P8 and P12 (Figure 4B).

(A) Individual forelimb twitches were classified as moving in anterior (blue), posterior (green), medial (orange), or lateral (yellow) directions. (B) Peristimulus time histograms of the mean (±SEM) firing rate of M1 units in relation to the onset time of (from left to right) anterior, posterior, medial, and lateral forelimb twitches at P8 (top) and P12 (bottom). (C) Mean (±SEM) response strength (Δfiring rate in relation to baseline) for anterior (blue) and posterior (green) twitches, and for medial (orange) and lateral (yellow) twitches at P8 (left) and P12 (right). The gray shaded regions indicate 99%confidence intervals based on shuffled data. Asterisks indicate a significant difference between movement directions (p < .05). (D) The slope (strength of the unit’s relationship with movement direction) for individual units is represented along the medial-lateral (x) and anterior-posterior (y) axes. The gray shaded regions indicate 99% confidence intervals based on shuffled data. (E) Top row: Stacked plots show the percentage of units tuned to anterior (blue) or posterior (green) twitches at P8 and P12. Bottom row: Stacked plots show the percentage of units tuned to medial (orange) or lateral (yellow) twitches at P8 and P12. The white regions indicate untuned units.

(A) As in Figure 3E, the percentage of units that are positively tuned to movement amplitude for twitches (dark blue) and wake movements (dark red), negatively tuned for twitches (light blue) and wake movements (light red), or not tuned (white). From left to right, two r2 thresholds are shown below (.50) and above (.90) the threshold of .75 used in Figure 3E. (B) As in Figure 3B, mean (±SEM) response strength is shown as a function of movement amplitude. Solid and dashed blue lines denote P8 and P12 twitches, respectively; solid and dashed red lines denote P8 and P12 wake movements, respectively. Positively and negatively tuned units were identified using an r2 threshold of .75. Asterisks indicate significant difference between P8 and P12 (p < .05). (C) As in Figure 3B, change in response strength (Δfiring rate in relation to baseline; z-scored) is shown for individual M1 units in response to twitches (blue) and wake movements (red) at P8 and P12. Positively and negatively tuned units are indicated in blue (twitches) and red (wake movements); untuned units are indicated in gray.
However, as shown in Figure 4C, the average response strength at P8 was significantly lower for anterior compared to posterior twitches (F(1, 216) = 51.05, p < .001, adj.  ) and medial compared to lateral twitches (F(1,216) = 53.75, p < .001, adj.
  ). At P12, there was a small but statistically significant difference in response strength between anterior and posterior twitches (F(1, 249) = 9.80, p = .002, adj.
  ), but not between medial and lateral twitches (F(1,249) = 0.28, p = .599, adj.
  ).
).
Again, the trends in direction-related response strength, averaged across all units, may have obscured the direction-tuning of individual units. Accordingly, the direction-tuning of individual units was assessed by measuring the difference in response strength between anterior/posterior and medial/lateral twitches. At P8, individual units tended to be responsive to twitches that traveled posteriorly and laterally (Figure 4D). By P12, receptive fields were more uniformly distributed across all four direction combinations. Indeed, at P8, the majority of units were tuned to posterior rather than anterior movements (69.6% and 24.0%, respectively) and to lateral rather than medial movements (73.3% and 22.1%, respectively; Figure 4E). At P12, however, direction-tuning was more evenly distributed (range: 38.4–49.2%).
Interestingly, although twitches most often traveled anteriorly and medially (see Figure 2D), M1 units at P8 were most responsive to twitches that traveled in the opposite direction. This is similar to the earlier finding that M1 units at P8 responded most strongly to large twitches even though most twitches were small. Together, these findings indicate a bias of M1 toward the detection of twitches that exhibit less common kinematic features. In contrast, at P12, both amplitude- and direction-tuning were more uniformly distributed, thereby reducing redundant coding across units.
Population spiking activity decorrelates from P8 to P12
Thus far, we have focused on the correlation between movement kinematics and the firing rate of individual units. However, the activity across units—that is, population spiking activity—also undergoes a marked developmental shift: Population activity is more continuous by P12 and, as illustrated in Figure 1D, less obviously shaped by reafference arising from self-generated movements. To characterize this developmental shift, we next measured the population spiking activity of all units in each pup (P8: 27.1 ± 1.8 units/pup, P12: 31.3 ± 2.6 units/pup) and its relationship with movement kinematics.
First, we found that from P8 to P12, movement-related spiking activity did not change (t(14) = 0.97, p = .346, adj.  ; Figure 5A), but non-movement-related spiking activity (defined here as spikes occurring outside of the 1-s window after movement onset) increased by 367% (t(14) = 7.95, p < .001, adj.
  ). Next, we characterized how the patterning of population activity changed across these ages by measuring sparsity (the degree to which action potentials are uniformly distributed across time) and entropy (the informational capacity available given the patterning of activity). Importantly, sparsity and entropy have been shown to interact so as to efficiently encode sensory features in cortical networks (Barranca et al., 2014). Indeed, across M1 units, both sparsity and entropy increased significantly from P8 to P12 (sparsity: t(10.89) = 5.97, p < .001, adj.
  ; entropy: t(14) = 4.71, p < .001, adj.
  ; Figure 5B-C), indicating an age-related decrease in bursty unit activity.

(A) Mean (±SEM) number of M1 spikes during 60-min sleep-wake recordings at P8 (white) and P12 (gray). Black dots show the values for individual pups. Movement-related spikes (left) are spikes occurring within 1 s of a movement, and nonmovement-related spikes (right) are all other spikes. Asterisk indicates significant difference between P8 and P12 (p < .05). (B) Mean (±SEM) values of sparsity for each P8 (white) and P12 (gray) rat. Black dots show the values for individual pups. Asterisk indicates significant difference between P8 and P12 (p < .05). (C) Mean (±SEM) entropy values for each P8 (white) and P12 (gray) rat. Black dots show the values for individual pups. Asterisk indicates significant difference between P8 and P12 (p < .05). (D) Spike rasters (each row represents an M1 unit) illustrate the two correlational analyses used: For time-based correlations (top), Pearson correlations were calculated for each pup across all (non-overlapping) 250-ms windows during a recording between all possible unit-unit pairs; for movement-based correlations (bottom), Pearson correlations were calculated for all possible unit-unit pairs within the 250-ms period (blue shaded region) after a movement (vertical red line). (E) Left: Representative time-based correlation matrices for each unit-unit pair (x- and y-axes) for a P8 (top) and P12 rat (bottom). Blue squares indicate correlations during active sleep and red squares indicate correlations during wake. Darker colors denote higher r2 values. Right: Mean (±SEM) time-based correlations for each pup is shown for periods of active sleep (blue dot) and wake (red dot) at P8 and P12. Gray lines show the values for individual pups. Gray-shaded regions indicate 99% confidence intervals based on shuffled data. Asterisk represents significance between P8 and P12 (p < .05). (F) Same as in (E), but for movement-based correlations.
To assess whether the increase in uniform, non-movement-related unit activity affected population dynamics in M1, we computed unit-by-unit correlations of activity using two approaches: A time-based approach in which correlations were computed throughout the recording session using non-overlapping 250-ms windows, and a movement-based approach in which correlations were computed within a 250-ms window after a movement (Figure 5D). Figure 5E shows two Pearson correlation matrices for representative pups at P8 and P12 using the time-based approach as well as the Pearson correlations averaged across all unit-unit pairs for each pup. Activity was significantly more correlated during active sleep than during wake (F(1, 14) = 16.84, p = .001, adj.  ) at both ages, but the most notable difference in time-based correlated activity was between P8 and P12 animals regardless of behavioral state (F(1, 14) = 76.96, p < .001, adj.
  ). Although activity was significantly less correlated at P12 than at P8, the observed correlations were stronger than expected (i.e., compared with shuffled data). That is to say, population spiking activity at P12 continued to exhibit an organized temporal structure.
Figure 5F shows two Pearson correlation matrices for representative pups at P8 and P12 using the movement-based approach as well as the Pearson correlations averaged across all unit-unit pairs for each pup. Similar to the time-based approach, units were significantly more correlated in their responses to twitches than to wake movements at either age (F(1, 14), = 12.16, p = .004, adj.  ), but the most notable difference in movement-based correlated activity was between P8 and P12 animals regardless of behavioral state (F(1, 14) = 140.40, p < .001, adj.
  ). Although the activity across M1 units in response to movements was less correlated at P12 than P8, the correlations at both ages were stronger than expected (i.e., compared with shuffled data).
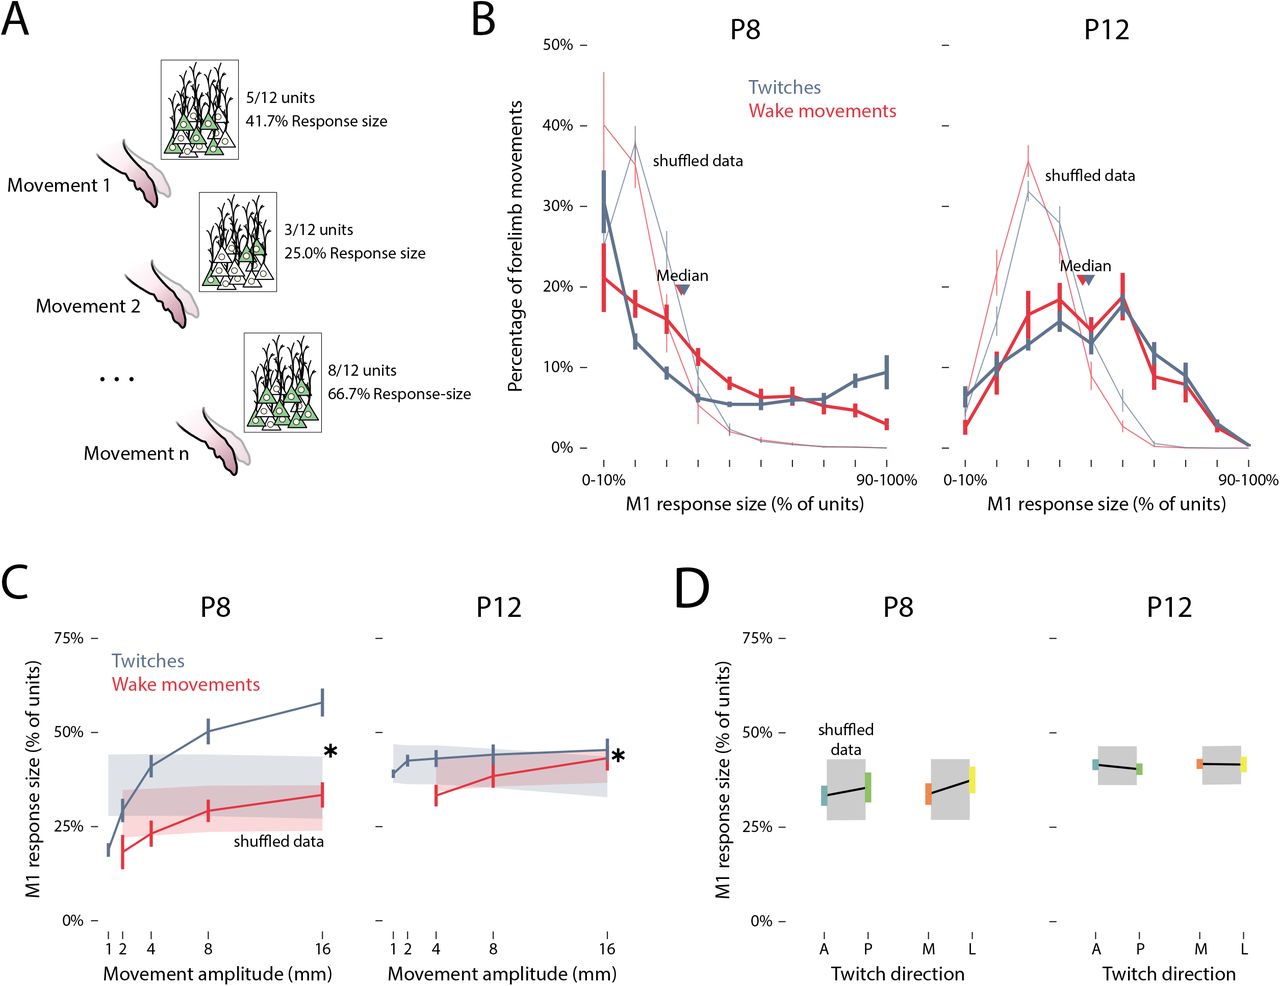
Next, we determined whether movement amplitude and direction predict the populationlevel activity of M1 units within each pup, especially at P8. For each given movement, an M1 unit was considered “responsive” if its firing rate increased significantly (i.e., exceeded the 95% confidence interval) relative to its baseline firing rate. If this threshold was not reached, the M1 unit was considered “unresponsive” to that particular movement. For each limb movement, then, the percentage of responsive M1 units—the response size— was calculated (Figure 6A). Figure 6B plots the mean percentage of forelimb movements across pups (y-axis) that triggered an M1 response of a given size (x-axis). Whereas behavioral state slightly increased the odds of a large M1 response size (F(1, 14) = 4.63, p = .049, adj. Up = .194), the most notable effect was that of age: Forelimb movements at P12 were significantly more likely to have a larger response size than were forelimb movements at P8 (F(3.51, 49.15) = 26.93, p < .001, adj.  ). Moreover, the M1 response size approximated an exponential distribution at P8, but approximated a normal distribution at P12. Indeed, six of the eight P8 rats—but none of the P12 rats—exhibited a significantly non-normal distribution (see Table 1).

(A) Illustration of the relationship between forelimb movements (1 through n) and response size, defined as the percentage of M1 units that responded to a given movement. (B) Mean (±SEM) percentage of twitches (blue) and wake movements (red) that yielded response sizes of 0–10% to 90–100% at P8 (left) and P12 (right). Median values for twitches (blue arrows) and wake movements (red arrows) are also shown. Light blue and red lines indicate shuffled data for twitches and wake movements, respectively. (C) Mean (±SEM) response size for M1 units as a function of the amplitude of twitches (blue) and wake movements (red) at P8 and P12. Shaded regions represent 99%confidence intervals based on shuffled data. Asterisks indicates significant difference between twitches and wake movements (p < .05). (D) Mean (±SEM) response strength of M1 units for anterior (blue), posterior (green), medial (orange), and lateral (yellow) twitches at P8 and P12. Gray shaded regions indicate 99% confidence intervals based on shuffled data.
Finally, because the distribution of M1 response size changed significantly from P8 to P12 for both twitches and wake movements—along with changes in amplitude- and direction-tuning in individual M1 units—we next determined whether movement kinematics predict M1 response size. As shown in Figure 6C, response size increased as a function of movement amplitude at both ages, but the state-dependence of this relationship was stronger at P8 (F(1, 14) = 22.06, p < .001, adj.  ) than at P12 (F(1, 14) = 9.37, p = .008, adj.
  ). Overall, large movements drove the most activity within and across M1 units, especially during active sleep at P8.
In contrast with movement amplitude, twitch direction was not significantly related to response size at either age (anterior vs. posterior: F(1, 14) = 2.26, p = .155, adj.  ; medial vs. lateral: F(1, 14) = 2.70, p = .123, adj.
  ; Figure 6D). This finding mirrors the small (though significant) differences in direction-tuning observed in individual M1 units at P8.
Thus, all together, we find that M1 population activity was less correlated and less sensitive to the kinematics of limb movements between P8 and P12—similar to the decrease in kinematic-driven responses observed in individual M1 units.
Kinematic tuning is not mediated by spindle bursts
Spindle bursts are brief thalamocortical oscillations (10–20 Hz; Figure 7A–B) that are thought to contribute to early cortical development (Hanganu et al., 2006; Tolner et al., 2012; Yang et al., 2013; Dooley et al., 2020). Because spindle bursts are readily detectable at P8 but not P12 (Shen and Colonnese, 2016), they could potentially mediate the effect of twitch amplitude on M1 activity at that earlier age. Indeed, spindle bursts were more likely to occur during active sleep than during wake (t(7) = 2.94, p = .022, adj.  ; Figure 7C). However, whereas twitches and wake movements occurred at a rate of 28.3 ± 4.6 min-1 and 11.7 ± 1.2 min-1, respectively, spindle bursts occurred at much lower rates (active sleep: 4.0 ± 0.7 min-1; wake: 2.5 ± 0.4 min-1). Consequently, only a small percentage of forelimb movements (10.0 ± 1.4%) occurred within ±0.5 s of a spindle burst.

(A) Representative data from a P8 rat. From top to bottom: A trace of the local field potential (LFP) in M1, including the onset of a spindle burst denoted with a black arrow; a filtered (5–40 Hz) LFP trace (red); single- and multi-unit activity in M1, with each row denoting a different single-unit or multi-unit and each vertical tick denoting an action potential; a trace of forelimb displacement (black), with twitches and wake movements denoted by blue and red arrows, respectively. (B) Time-frequency spectrogram of LFP activity in M1, averaged across all P8 rats. The analysis was triggered on the onset of detected spindle bursts. LFP power was normalized per each frequency. (C) The rate of spindle bursts during active sleep (blue) and wake (red), as well as the overall rate (black) is shown for P8 rats. Gray lines show the values for individual pups. Asterisk denotes statistical significance between sleep and wake (p < .05). (D) Same as in Figure 3B, but triggered only on movements that did not occur within ±0.5 s of a spindle burst. (E) Same as in Figure 4C, but triggered only on twitches that did not occur within ±0.5 s of a spindle burst. (F) Same as in Figure 6B, but triggered only on movements that did not occur within ±0.5 s of a spindle burst.
Figure 7D–E shows the response strength for M1 units, triggered on forelimb movements that did not occur within ±0.5 s of a spindle burst, as a function of movement amplitude and movement direction, respectively. Response strength was largely unchanged compared with the earlier analyses for movement amplitude (Figure 3B) and movement direction (Figure 4C). M1 activity across units (response size) was similarly unaffected when triggered only on forelimb movements that did not occur within ±0.5 s of a spindle burst (Figure 7F). All together, these findings indicate that the kinematic properties of M1 units observed at P8, and the shift in kinematic properties at P12, cannot not explained by spindle bursts.
Discussion
Twitches are a distinct class of movement: They are brief and discrete, occur against a background of muscle atonia, and are highly diverse in their trajectories (i.e., amplitude and direction). As such, twitches are well-suited to drive somatotopically precise activity in developing sensorimotor cortex. By contrast, wake movements are typically prolonged and complex, involving sustained activity within and across multiple limb muscles; consequently, the reafference that arises from wake movements may be counterproductive to the development of precise forelimb somatotopy in sensorimotor cortex. These features of wake movements may help to explain why wake-related reafference is initially gated by the external cuneate nucleus (ECN; Tiriac and Blumberg, 2016; Dooley and Blumberg, 2018), the primary recipient of ascending proprioceptive feedback from the forelimbs (Campbell et al., 1974).
Consistent with previous studies (Jouvet-Mounier et al., 1969; Seelke and Blumberg, 2008; Blumberg et al., 2014), we found that active sleep is the predominant behavioral state in P8 rats (see Figure 2—figure supplement 2). We also found at this age that twitches occurred three times more frequently than did wake movements and that twitches drove significantly more M1 activity than did wake movements. The increased frequency of twitches and their ability to significantly drive M1 activity suggests that they play an important role in the development of M1’s somatotopic map during the early postnatal period. In turn, this early sensory may provide a framework for the development of M1’s later-emerging motor map (Dooley and Blumberg, 2018).
Kinematic tuning in developing M1
Here, we extend previous work (Dooley and Blumberg, 2018) in newborn rats to demonstrate that M1 neurons are not only more responsive to twitch-than wake-related reafference, but they also respond more strongly to twitches that entail larger limb movements (see Figure 3). This is the second such demonstration of amplitudedependent sensory responding: In P5 rats, we similarly found that larger whisker twitches more strongly drive neural activity in somatosensory barrel cortex (Dooley et al., 2020). Thus, in early development, self-generated movements provide rate-coded information to developing sensorimotor cortex. Although spontaneous activity also occurs in the developing retina (Hanganu et al., 2006; Ackman et al., 2012) and cochlea (Tritsch et al., 2007), it is not known whether this activity produces rate-coded responses in visual and auditory cortex, respectively.
It is not yet clear whether the amplitude rate-coding found here in M1 is determined by the change in the position of the forelimb in space per se. Instead, it is possible that movement amplitude is a proxy for some other feature of the movement, such as the number of muscle spindles or Golgi tendon organs that are activated, or simply the number of forelimb muscles that are recruited to produce a movement. These possibilities cannot be disentangled using our video-based approach. Regardless, once this reafferent activity is conveyed to the brain, it is dynamically regulated in a state-dependent manner.
In fact, even though equally sized twitches and wake movements are presumably qualitatively similar in terms of their forelimb muscle activation, twitches nonetheless produce substantially greater neural activation in M1 (Figure 3B). This state-dependent amplitude tuning was particularly clear at the level of individual units: Of the 217 units recorded from at P8, 91% were tuned to twitch amplitude and 62% were tuned exclusively to twitch amplitude (Figure 3E).
At P8, nearly all M1 units were tuned to twitch direction (see Figure 4). Assuming that twitches in different directions are caused by recruitment of different combinations of muscles, this finding suggests that M1 neurons are responsive to specific forelimb muscles. Notably, twitches with uncommon trajectories (e.g., large twitches, posterior/lateral twitches) produced the most unit activity, suggesting that M1 is biased toward the detection of these twitches at P8. Thus, it may be that self-generated movements with relatively rare kinematic properties are amplified so as to ensure their representation in the forelimb region of M1. This issue could be explored further by monitoring the development of M1 tuning parameters in response to experimental manipulation of twitch amplitude or direction.
We also found that the informational content provided to M1 by twitch reafference increased from P8 to P12. At P8, amplitude and direction tuning were uniformly distributed across M1 units: 91% of units were tuned to twitch amplitude (Figure 3E) and 70-73% of units were tuned to a single twitch direction (Figure 4E). Thus, when considering all units together, the kinematic information about twitches was represented redundantly within M1. Redundancy decreased by P12: The number of amplitude-tuned units decreased to just 17% of all units, and at most 49% of units were tuned to a single direction. This decrease in redundancy, along with the increased responses of M1 units to small twitches at P12 (Figure 3—figure supplement 1B), indicates an increase in informational content at P12. Therefore, whereas the sensorimotor system at P8 seems to prioritize the detection of self-generated movements, the system at P12 seems to prioritize the most efficient and informative representation of those movements. Accordingly, P12 may represent the beginning of a new developmental phase in which reafferent activity in M1 becomes more efficiently organized.
Finally, spindle bursts, a predominant thalamocortical oscillation in neonatal rats (Hanganu et al., 2006; Tolner et al., 2012; Yang et al., 2013; Dooley et al., 2020), were too infrequent at P8 to mediate the observed effects of movement amplitude and direction on M1 activity (Figure 7C). Only 10% of forelimb movements coincided with spindle bursts, and exclusion of those movements from analysis did not alter the M1 response profiles (Figure 7D-F). Although one proposed role for spindle bursts is to strengthen developing thalamocortical circuitry (Tolner et al., 2012; Yang et al., 2013; Murata and Colonnese, 2016), it is unclear to what extent spindle bursts at P8 are contributing to this process compared with unit activity alone. However, because the rate of spindle bursts peaks in the first postnatal week and decreases thereafter (Hanganu et al., 2006; Yang et al., 2009; Shen and Colonnese, 2016), the pups tested here may have been too old to properly identify the relative contribution of spindle bursts to early M1 activity.
Population activity in developing M1
At P8, M1 activity is discontinuous, occurring primarily in discrete bursts (Figure 1D) similar to activity in developing primary visual cortex (Hanganu et al., 2006; Yang et al., 2009), primary somatosensory cortex (Khazipov et al., 2004; Golshani et al., 2009), and cerebellum (Watt et al., 2009; Del Rio-Bermudez et al., 2016). Moreover, in the first postnatal week, bursts of activity occur most often in response to reafference (Khazipov et al., 2004; Dooley et al., 2020).
Whereas these features of early cortical activity are apparent at the level of a single neuron, patterns of activity across populations of neurons are readily apparent and change considerably over the second postnatal week. Consistent with previous reports in barrel cortex (Golshani et al., 2009; van der Bourg et al., 2017) and visual cortex (Rochefort et al., 2009), we found that M1 activity is highly correlated across units at P8 (Figure 5). It has been hypothesized that correlated, bursting activity in developing cortex helps prioritize the detection of spontaneous peripheral activity (see Colonnese and Phillips, 2018), aiding in the activity-dependent development of these sensory networks (Katz and Shatz, 1996; Ackman et al., 2012; Blankenship and Feller, 2010).
At P12, however, correlated activity disappears as non-movement related activity, sparsity (a measure of the uniform distribution of action potentials), and entropy (a measure of informational capacity) increase. Such sparsification of cortical activity in M1 also occurs at P12 in barrel cortex (Golshani et al., 2009; van der Bourg et al., 2017) and primary visual cortex (Rochefort et al., 2009). Sparsification of cortical activity also occurs contemporaneously with the sudden emergence of local inhibition in cortex (Ben-Ari et al., 2007; Dooley and Blumberg, 2018; Colonnese, 2014). Given that inhibitory neurons modulate cortical sensory processing in adults (Wood et al., 2017; Azim and Seki, 2019), the emergence of inhibition in M1 may explain the developmental reduction in redundant tuning properties we observed here at P12.
It is possible that the onset of sparsification in M1 depends on the prior development of M1’s forelimb representation via sensory experience (i.e., reafference). Consequently, perturbing early sensory experience may disrupt the onset of sparsification in M1. Indeed, in neonatal mice, dark rearing (an example of sensory deprivation) delays sparsification in primary visual cortex by 2-3 days (Rochefort et al., 2009); in contrast, whisker plucking in neonatal mice does not delay sparsification in barrel cortex (Golshani et al., 2009). Given such conflicting results, more work is needed to clarify the conditions under which cortical sparsification is affected by early sensory experience.
The increase in variability in kinematic coding and population-level activity shown here foreshadows M1 functioning in adulthood: Adult M1 neurons are exquisitely versatile and heterogenous, with each neuron able to simultaneously represent multiple kinematic (as well as temporal) features of movement in both Cartesian and body-centered reference frames (Hatsopoulos et al., 2007; Wu and Hatsopoulos, 2006; Churchland and Shenoy, 2007). M1’s complexity in adulthood is partially supported by “sparse coding”—in which complex sensory input is reflected in precise, energetically efficient responses (Olshausen and Field, 2004). The sudden emergence of inhibition at P12, then, signifies an important transition toward the development of complex network properties, such as sparse coding, that will eventually enable M1 to produce complex movements and participate in motor learning.
Conclusion
M1 undergoes protracted sensory development before the onset of motor outflow and participation in motor learning. During this time, rate-coded sensory responses in M1 are driven by the kinematics of self-generated limb movements, especially those occurring during active sleep. Here, we reveal that amplitude- and direction-tuning in M1 undergoes a marked developmental shift at the end of the second postnatal week. At the same time, M1 activity becomes more continuous and decorrelated, indicative of a stage in networklevel activity characterized by increased complexity and efficiency in preparation for the emergence of M1’s motor capabilities.
Author Contributions
Conceptualization, R.M.G., J.C.D, G.S., and M.S.B.; Methodology, R.M.G., J.C.D, G.S., and M.S.B.; Software, R.M.G. and J.C.D.; Validation, R.M.G.; Formal Analysis, R.M.G.; Investigation, R.M.G.; Resources, G.S. and M.S.B.; Data Curation, R.M.G.; Writing – Original Draft, R.M.G.; Writing—Reviewing and Editing, R.M.G., J.C.D., G.S., and M.S.B.; Visualization, R.M.G. and M.S.B.; Supervision, G.S. and M.S.B.; Project Administration, G.S. and M.S.B.; Funding Acquisition, G.S. and M.S.B.
Declaration of Interests
The authors declare no competing interests.
Star Methods
Resource Availability
Lead Contact
Further information and requests for resources and code should be directed to, and will be fulfilled by, the lead contact, Dr. Mark Blumberg (mark-blumberg{at}uiowa.edu).
Materials Availability
This study did not generate new unique reagents.
Data and Code Availability
Raw data (action potential timestamps, behavioral event timestamps, and forelimb position time-series) will be uploaded to Dryad upon publication. Select custom MATLAB scripts used here can be found on Github (https://www.github.com/XXXXX). Additional scripts and data used will be made available upon request.
Experimental Model and Subject Details
Sprague-Dawley Norway rats (Rattus norvegicus) were used at P8–9 (n = 8, body weight: 18.8 ± 0.4 g; hereafter referred to as P8) and P12–13 (n = 8, body weight: 30.6 ± 0.7 g; hereafter referred to as P12). Equal numbers of males and females were used and all subjects were selected from separate litters. In total, 37 single-units and 180 multi-units were isolated at P8 and 106 single-units and 144 multi-units were isolated at P12. In preliminary analyses, multi-units showed parsimonious results with single units and thus were included in all analyses (217 and 250 combined units at P8 and P12, respectively).
Animals were housed in standard laboratory cages (48 × 20 × 26 cm) on a 12:12 lightdark cycle, with food and water available ad libitum. The day of birth was considered P0 and litters were culled to eight pups by P3. All experiments were conducted in accordance with the National Institutes of Health (NIH) Guide for the Care and Use of Laboratory Animals (NIH Publication No. 80–23) and were approved by the Institutional Animal Care and Use Committee of the University of Iowa.
Method Details
Surgery
As described previously (Dooley and Blumberg, 2018; Blumberg et al., 2015), a pup with a visible milk band was removed from the litter and anesthetized with isoflurane gas (3–5%; Phoenix Pharmaceuticals, Burlingame, CA). A custom-made bipolar hook electrode (0.002-inch diameter, epoxy coated; California Fine Wire, Grover Beach, CA) was inserted into the nuchal muscle for state determination. Carprofen (5 mg/kg SC; Putney, Portland, ME) was administered as an anti-inflammatory analgesic. After removing the skin above the skull, an analgesic was applied topically (bupivacaine; Pfizer, New York, NY). The skull was dried with bleach. Vetbond (3M, Minneapolis, MN) was applied to the skin around the skull and a head-plate (Neurotar, Helsinki, Finland) was secured to the skull using cyanoacrylate adhesive.
A trephine drill bit (1.8 mm; Fine Science Tools, Foster City, CA) was used to drill a hole into the skull above the left forelimb representation of M1 (1.0 mm anterior to bregma, 2.2–2.5 mm lateral from the sagittal suture). Two smaller holes were drilled distally to the recording site for insertion of a thermocouple and reference/ground electrode. A small amount of peanut oil was applied over the recording site to prevent drying of the cortical tissue. Surgical procedures lasted approximately 15 min.
The pup was then secured to a custom-made head-restraint apparatus inside a Faraday cage, with the animal’s torso supported on a narrow platform. Brain temperature was monitored using a fine-wire thermocouple (Omega Engineering, Stamford, CT) distal to the M1 recording site. The pup was allowed to recover from anesthesia and acclimate for at least 1 h. Recording did not begin until brain temperature was 36<37° C and the pup was cycling regularly between sleep and wake.
Electrophysiological Recordings
The nuchal EMG electrode was connected to a Lab Rat LR-10 acquisition system (Tucker Davis Technologies, Gainesville, FL). The EMG signal was sampled at approximately 1.5 kHz and high-pass filtered at 300 Hz.
A 16-channel silicon depth electrode (Model A4×4-3mm-100-125-177-A16; NeuroNexus, Ann Arbor, MI) was coated in fluorescent Dil (Vybrant Dil Cell-Labeling Solution; Life Techologies, Grand Island, NY) before insertion. The electrode was inserted 600–1000 μm into the forelimb representation of M1, angled 6° medially. A chlorinated Ag/Ag-Cl wire (0.25 mm diameter; Medwire, Mt. Vernon, NY) was inserted distal to the M1 recording site, serving as both a reference and a ground. The neural signal was sampled at approximately 25 kHz, with a high-pass (0.1 Hz) and a harmonic notch (60, 120, and 180 Hz) filter applied.
Electrode placement in the forelimb region of M1 was confirmed by manually stimulating the forelimb and observing exafferent neural activity. Neural activity from M1 was recorded for 1 h using SynapseLite (Tucker Davis Technologies) while the animal cycled between sleep and wake states.
Video Collection
In order to digitally reconstruct forelimb movements in three dimensions, video of the forelimb was recorded from front and side camera angles using two Blackfly-S cameras (FLIR Integrated Systems; Wilsonville, Oregon). Video was collected in SpinView (FLIR Integrated Systems) at 100 frames/s, with a 3000-μs exposure time and 720×540 pixel resolution. The two cameras were hardwired to acquire frames synchronously and were initiated using a common software trigger.
The synchronization of video and electrophysiological data was ensured by using an external time-locking stimulus. A red LED controlled by SynapseLite (Tucker Davis Technologies) was set to pulse every 3 s for a duration of 20 ms. The LED was positioned to be in view of both cameras. Each video was analyzed frame-by-frame with custom Matlab scripts to ensure an equal number of frames between LED pulses. Although infrequent, when the number of frames between pulses was less than expected, the video was adjusted by duplicating and inserting one adjacent frame at that timepoint so as to preserve timing across the recording. Thus, all videos were ensured to be time-locked to the electrophysiological data within 10 ms.
Histology
At the end of the recording period, the pup was euthanized with ketamine/xylazine (10:1; >0.08 mg/kg) and perfused with 0.1 M phosphate-buffered saline, followed by 4% paraformaldehyde. The brain was extracted and post-fixed in 4% paraformaldehyde for at least 24 h and was transferred to a 30% sucrose solution 24-48 h prior to sectioning.
In order to confirm the electrode’s location within the forelimb representation of M1, the left cortical hemisphere was dissected from the subcortical tissue and flattened between two glass slides (separated using two pennies) for 5-10 min. Small weights (10 g) applied light pressure to the top glass slide. The flattened cortex was sectioned tangentially to the pial surface. A freezing microtome (Leica Microsystems, Buffalo Grove, IL) was used to section the cortex (80-μm sections). Free-floating sections were imaged at 2.5x using a fluorescent microscope and digital camera (Leica Microsystems) to mark the location of the DiI.
Electrode placement in the forelimb region of M1 was confirmed by staining cortical sections for cytochrome oxidase (CO), which reliably delineates the divisions of primary sensory cortex at this age (Seelke et al., 2012). The M1 forelimb representation is immediately medial to (and partially overlaps) the primary sensory forelimb representation (see Figure 1B-C). Cytochrome C (0.3 mg/mL; Sigma-Aldrich), catalase (0.2 mg/mL; Sigma-Aldrich), and 3,3’-diaminobenzidine tetrahydrochloride (DAB; 0.5 mg/mL; Spectrum, Henderson, NV) were dissolved in a 1:1 dilution of 0.1 M phosphate buffer and distilled water. Sections were developed in 24-well plates on a shaker (35-40°C, 100 rpm) for 3-6 h, rinsed in PBS, and mounted on a glass slide. The stained sections were imaged at 2.5x or 5x magnification and composited with the fluorescent image to confirm the electrode tract within the forelimb region of M1.
Behavioral State and Forelimb Movements
As described previously (Tiriac et al., 2014; Dooley and Blumberg, 2018), nuchal EMG and behavior were used to assess behavioral state (the experimenter was blind to the neurophysiological record while scoring behavior). The wake state was defined by the presence of high-amplitude movements of the limbs against a background of high nuchal muscle tone. Active sleep was defined by the presence of discrete myoclonic twitches of the face, limbs, and tail against a background of nuchal muscle atonia.
Forelimb movements were quantified using DeepLabCut (DLC), a markerless tracking solution that uses a convolutional neural network to track features (e.g., limbs) of animals in a laboratory setting (Mathis et al., 2018; Nath et al., 2019). At least 200 manually labeled frames (tracking the wrist of the right forelimb) were used to initially train the network. After the initial training, newly analyzed frames with marker estimates that were deemed inaccurate were re-labeled and used to re-train the neural network until satisfactory tracking was achieved. Separate neural networks were trained for the frontfacing and side-facing camera angles. The networks reached a training root mean square error (RMSE) of 0.18 and 0.19 mm and a test RMSE of 0.28 and 0.42 mm, respectively. Forelimb twitches and wake movements were identified using custom Matlab scripts. Although infrequent (0.5 ± 0.1% of frames), individual frames in which the wrist position was associated with a low confidence value (< 0.80, identified by DLC) were removed and linearly interpolated from the position data of adjacent frames. Forelimb position data was derived to obtain forelimb velocity, and forelimb twitches and wake movements were detected by peak detection of forelimb velocities reaching 2x the standard deviation of quiet periods for twitches, and 3x the standard deviation of the quiet period for wake movements. All movements were required to be preceded by a 250-ms period of quiescence in the forelimb. Every forelimb twitch and wake movement was visually confirmed by the experimenter to identify and discard false positives.
For the analysis of movement amplitude, the forelimb position was summed across the x-, y-, and z-dimensions using the Pythagorean theorem (Figure 2A). The peak amplitude was measured as the difference between the point of maximum displacement (using a shared time point for each dimension) and the median baseline position from −0.5 to 0 s before the initiation of a twitch or wake movement. Because twitch amplitude follows an exponential distribution (see Figure 2B), movements were sorted into logarithmic bins of 0–1, 1–2, 2–4, 4–8, and 8–16 mm.
For the analysis of movement direction, the forelimb position was transformed into polar coordinates along the rostral-caudal and medial-lateral axes (see Figure 2C). Movements were sorted into anterior-posterior or medial-lateral bins. Because wake movements occur during sustained bouts of continuous activity and regularly involve multi-directional trajectories, they could not be analyzed for direction-tuning in M1.
Spindle Bursts
As described previously (Dooley et al., 2020), the neural signal was band-pass filtered at 5-40 Hz with a stopband attenuation of −60 dB and a 1-Hz transition gap. A Hilbert transformation was applied to the filtered waveform, and spindle burst onset was defined as the first point at which the waveform amplitude exceeded the median plus two standard deviations. Spindle bursts were defined as having a minimum duration of 150 ms.
Spike Sorting
SynapseLite files were converted to binary files using custom Matlab scripts and sorted with Kilosort (Pachitariu et al., 2016). Briefly, the 16 channels of neural data were whitened (covariance-standardized) and band-pass filtered (300–5000 Hz) before spike detection. Next, template matching was implemented to sort the event waveforms into clusters. The first-pass spike detection threshold was set to 6 standard deviations below the mean and the second-pass threshold was set to 5 standard deviations below the mean. The minimum allowable firing rate was set to 0.01 sps and the bin size for template detection set to 656,000 sample points for P8 animals and 262,400 sample points for P12 animals (approximately 27 s and 11 s, respectively). All other Kilosort parameters were left at their default values.
Clusters were visualized and sorted in Phy2 (Rossant and Harris, 2013). Putative single units (elsewhere referred to as “single-units”) were defined as having (1) spike waveforms that reliably fit within a well-isolated waveform template, (2) a distribution along seven principal components that was absent of clear outliers, and (3) an auto-correlogram with a decreased firing rate at time-lag 0 (indicative of a single-unit’s refractory period).
Clusters meeting the first two criteria but not the third were considered multi-units. Any cluster with a waveform template indicative of electrical noise, a significantly low firing rate (< 0.01 sps), or amplitude drift across the recording period was discarded.
Data Shuffling
Two shuffling procedures were used to approximate the null hypotheses in (1) movement-triggered analyses and (2) correlation analyses. First, for all movement-triggered analyses (i.e., those performed in Figures 3, 4, and 6), analyses were repeated 100 times on randomly selected twitches and wake movements, in proportion to the number of movements used in the main analysis. The 99% confidence interval was computed across the 100 trials to obtain the shuffled values. Second, for all correlation analyses (i.e., those performed in Figure 5), the inter-spike intervals of each spike train were resampled and used to create shuffled spike trains. This procedure conserves each unit’s overall firing rate and temporal dynamics (Rivlin-Etzion et al., 2006; Perkel et al., 1967). Analyses using the resampled spike trains were repeated 100 times and averaged to obtain the shuffled data.
Population Analyses
Movement-related spikes were defined as any spike within 1 s of the onset of a twitch or wake movement. Non-movement-related spikes were defined as all other spikes. Sparsity was defined according to Rolls and Tovee (1995)
 where n represents the number of forelimb movements of a given pup and ri represents the firing rate of a given unit from 0–250 ms after the ith forelimb movement.
Entropy (of a discrete random variable) was defined according to Shannon (1948)
 where n represents the number of possible states for a unit (based on its firing rate) and p(x) represents the probability distribution of a given unit in that state. Firing rate data were discretized according to procedures outlined in Timme and Lapish (2018). Briefly, a unit’s firing rate was calculated in 250-ms time windows, and each window was assigned to one of three possible states based on a uniform-width binning of the firing rate distribution.
For time-based correlation analyses, firing rates were binned in 250-ms time windows and a Pearson correlation coefficient was computed across time windows for every possible unit-unit pair. All Pearson coefficients for an animal were averaged together before comparison between P8 and P12. For movement-based correlation analyses, the same procedure was used, except that firing rate was calculated over the 0-250 ms period after a forelimb movement, corrected for baseline (i.e., −3 to −2 s before a forelimb movement) firing rate.
Response size was defined as the percentage of all units of a given pup that were “responsive” to a given forelimb movement. A unit was considered responsive if its firing rate significantly increased (i.e., above the 95% confidence interval of baseline firing rate) after a forelimb movement; otherwise, a unit was considered unresponsive.
Quantification and Statistical Analysis
Statistical Analysis
All data were tested for normality using the Shapiro-Wilk test, for equal variance using Levene’s test (for between-subjects variables), and for sphericity using Mauchly’s test (for within-subjects variables with >2 groups) prior to analysis. In analyses in which the variance between groups was not equal, a pooled error term was not used when generating simple main effects and post-hoc tests. In analyses in which sphericity was violated, a Huynh-Feldt correction was applied to the degrees of freedom. Probabilities and r2 values were arc-sin transformed prior to analysis. The mean and standard error of the mean (SEM) are used throughout as measures of central tendency and dispersion, respectively.
All analyses were performed as independent t tests, or two- or three-way mixed design ANOVAs. Throughout the Results section, simple main effects were only reported if the interaction term was significant. All main effects, interactions, simple main effects, and the results of any additional statistical tests can be found in Table 1.
In all analyses including a within-subjects variable, an adjusted partial eta-squared was used as an estimate of effect size that corrects for positive bias due to sampling variability (Mordkoff, 2019). For independent t tests, an adjusted eta-squared estimate of effect size was reported.
Supplementary Table 1
Twitch amplitude v. velocity: r(11358) = .95, p < .001
Twitch amplitude v. acceleration: r(11358) = .91, p < .001
Twitch velocity v. acceleration: r(11358) = .98, p < .001
Wake amplitude v. velocity: r(5511) = .82, p < .001
Wake amplitude v. acceleration: r(5511) = .71, p < .001
Wake velocity v. acceleration: r(5511) = .95, p < .001
t(14) = 1.51, p = .153, adj. 
State (Main Effect): F(1, 14) = 75.17, p < .001, adj. 
Age (Main Effect): F(1, 14) = 51.15, p < .001, adj. 
State x Age (Interaction): F(1, 14) = 24.01, p < .001, adj. 
State | P8 (Simple Main Effect): F(1, 14) = 92.08, p < .001, adj. 
State | P12 (Simple Main Effect): F(1, 14) = 7.11, p = .018, adj. 
State (Main Effect): F(1,465) = 63.10, p < .001, adj. 
Age (Main Effect): F(1,465) = 7.73, p = .006, adj. 
State x Age (Interaction): F(1,465) = 41.47, p < .001, adj. 
State | P8 (Simple Main Effect): F(1,216) = 86.14, p < .001, adj. 
State | P12 (Simple Main Effect): F(1,249) = 1.36, p = .245, adj. 
*Note: The slope of each individual unit (shown in Figure 3D) was compared across groups rather than each level of movement amplitude. This was done to circumvent missing data when animals did not produce enough movements of a given amplitude).
State (Main Effect): F(1,465) = 209.40, p < .001, adj. 
Age (Main Effect): F(1,465) = 127.83, p < .001, adj. 
State x Age (Interaction): F(1,465) = 190.57, p < .001, adj. 
State | P8 (Simple Main Effect): F(1,216) = 250.27, p < .001, adj. 
State | P12 (Simple Main Effect): F(1,249) = 0.42, p = .520, adj. 
*Note: Due to missing cells (explained above), an omnibus test was not performed. A mixed 2-way ANOVA was performed on the factors of Age and Twitch Amplitude for positively tuned units only.
Twitch Amplitude (Main Effect): F(1.31,291.02) = 104.92, p < .001, adj. 
Age (Main Effect): F(1,222) = 1.52, p = .219, adj. 
Twitch Amplitude x Age (Interaction): F(1.31,291.02) = 10.01, p = .001, adj. 
Age | 0-1 mm (Simple Main Effect): t(25.38) = 6.43, p < .001, adj. 
Age | 1-2 mm (Simple Main Effect): t(222) = 4.63, p < .001, adj. 
Age | 2-4 mm (Simple Main Effect): t(222) = 0.82, p = .416, adj. 
Age | 4-8 mm (Simple Main Effect): t(222) = 0.61, p = .541, adj. 
Age | 8-16 mm (Simple Main Effect): t(222) = 0.53, p = .594, adj. 
Anterior vs. Posterior
Direction (Main Effect): F(1,465) = 16.45, p < .001, adj. 
Age (Main Effect): F(1,465) = 17.84, p < .001, adj. 
Direction x Age (Interaction): F(1,465) = 60.37, p < .001, adj. 
Direction | P8 (Simple Main Effect): F(1,216) = 51.05, p < .001, adj. 
Direction | P12 (Simple Main Effect): F(1,249) = 9.80, p = .002, adj. 
Medial vs. Lateral
Direction (Main Effect): F(1,465) = 43.04, p < .001, adj. 
Age (Main Effect): F(1,465) = 19.47, p < .001, adj. 
Direction x Age (Interaction): F(1,465) = 35.59, p < .001, adj. 
Direction | P8 (Simple Main Effect): F(1,216) = 53.75, p < .001, adj. 
Direction | P12 (Simple Main Effect): F(1,249) = 0.28, p = .599, adj. 
Movement-related spikes: t(14) = 0.97, p = .346, adj. 
Non-movement-related spikes: t(14) = 7.95, p < .001, adj. 
t(10.89) = 5.97, p < .001, adj. 
t(14) = 4.71, p < .001, adj. 
State (Main Effect): F(1, 14) = 16.84, p = .001, adj. 
Age (Main Effect): F(1, 14) = 76.96, p < .001, adj. 
State x Age (Interaction): F(1, 14) < 0.01, p = .966, adj. 
State (Main Effect): F(1, 14) = 12.16, p = .004, adj. 
Age (Main Effect): F(1, 14) = 140.40, p < .001, adj. 
State x Age (Interaction): F(1, 14) = 2.18, p = .162, adj. 
Units (Main Effect): F(3.51,49.15) = 24.18, p < .001, adj. 
State (Main Effect): F(1, 14) = 13.30, p = .003, adj. 
Age (Main Effect): F(1, 14) = 6.26, p = .025, adj. 
Units x State (Interaction): F(3.02, 42.26) = 7.11, p = .001, adj. 
Units x Age (Interaction): F(3.51,49.15) = 26.93, p = .162, adj. 
State x Age (Interaction): F(1, 14) = 4.63, p = .049, adj. 
Units | P8 (Simple Main Effect): F(9, 126) = 18.77, p < .001, adj. 
Units | P12 (Simple Main Effect): F(9, 126) = 32.35, p < .001, adj. 
Figure 6B extended
*Note: Shapiro-Wilk test for each P8 and P12 rat (state differences are averaged).
P8: p = .001, p = .068, p = .030, p = .007, p < .001, p = .187, p < .001, p = .004
P12: p = .315, p = .577, p = .464, p = .631, p = .155, p = .936, p = .724, p = .781
State (Main Effect): F(1, 14) = 1.39, p = .267, adj. 
Age (Main Effect): F(1, 14) = 19.39, p = .001, adj. 
State x Age (Interaction): F(1, 14) = 30.08, p < .001, adj. 
State | P8 (Simple Main Effect): F(1, 14) = 22.06, p < .001, adj. 
State | P12 (Simple Main Effect): F(1, 14) = 9.37, p = .008, adj. 
Anterior vs. Posterior
Direction (Main Effect): F(1, 14) = 0.20, p = .665, adj. 
Age (Main Effect): F(1, 14) = 3.44, p = .085, adj. 
Direction x Age (Interaction): F(1, 14) = 2.26, p = .155, adj. 
Medial vs. Lateral
Direction (Main Effect): F(1, 14) = 2.27, p = .154, adj. 
Age (Main Effect): F(1, 14) = 3.06, p = .102, adj. 
Direction x Age (Interaction): F(1, 14) = 2.70, p = .123, adj. 
t(7) = 2.94, p = .022, adj. 
Acknowledgem ents
This research was supported by grants from the National Institutes of Health (R37-HD081168 to M.S.B.)
Footnotes
↵‡ Lead Contact: Mark S. Blumberg


