

Abstract
A novel coronavirus, SARS-CoV-2, has caused over 85 million cases and over 1.8 million deaths worldwide since it occurred twelve months ago in Wuhan, China. Here we conceptualized the time-series evolutionary and expansion dynamics of SARS-CoV-2 by taking a series of cross-sectional view of viral genomes from early outbreak in January in Wuhan to early phase of global ignition in early April, and finally to the subsequent global expansion by late December 2020. By scrutinizing cases from early outbreak, we found a viral genotype from the Seafood Market in Wuhan featured with two concurrent mutations has become the overwhelmingly dominant genotype (95.7%) of the pandemic. By analyzing 4,013 full-length SARS-CoV-2 genomes from different continents by early April, we were able to visualize the genomic diversity over a 14-week timespan since the outbreak in Wuhan. 2,954 unique nucleotide substitutions were identified with 31 of the 4,013 genomes remaining as ancestral type, and 952 (32.2%) mutations recurred in more than one genome. 11 major viral genotypes with unique geographic distributions were identified. As the pandemic has been unfolding for more than one year, we also used the same approach to analyze 261,323 full-length SARS-CoV-2 genomes from the world since the outbreak in Wuhan (i.e. including all the available viral genomes in the GISAID database as of 25 December 2020) in order to recapitulate our findings in a real-time fashion and to present a full catalogue of SARS-CoV-2 mutations. We demonstrated the viral genotypic dynamics from different geographic locations over one-year timespan reveal transmission routes and indicate subsequent expansion. This study, to our knowledge, is heretofore the largest and most comprehensive genomic study of SARS-CoV-2. It indicates the viral genotypes can be utilized as molecular barcodes in combination with epidemiologic data to monitor the spreading routes of the pandemic and evaluate the effectiveness of control measures. Moreover, the dynamics of viral mutational spectrum in the study may help the early identification of new strains in patients to reduce further spread of infection, and guide the development of molecular diagnosis and vaccines against COVID-19, and last but not the least help assess their accuracy and efficacy.
Evidence before this study As the COVID-19 pandemic continues, in order to mitigate the risk of further regional expansions as well as to estimate the effectiveness of control measures in various regions, viral genomic studies on its origins, transmission routes and expansion models have begun to surge. Several studies on the genomics of SARS-CoV-2 virus have offered clues of the origins, and transmission path of the disease. However, due to lack of early samples, a limited number of SARS-CoV-2 genomes, and/or focusing on specific geographic locations, we still lack a complete global view of the expansion of COVID-19 in the context of the viral mutational spectrum.
Added value of this study In this study we provide a global view of the mutation dynamic and transmission routes of SARS-CoV-2 with a foothold on the early phase of the pandemic. This is also the largest and the most comprehensive SARS-CoV-2019 viral genome study and molecular epidemiology study that provides an unprecedented time window to study mutations and evolution of SARS-CoV-2. The unique molecular barcodes defined by Strain of Origin (SOO) algorithm can be utilized to prospectively monitor the spreading trajectory and reveal the expansion of the ongoing pandemic. Our full catalogue of SARS-CoV-2 mutations can also guide the development and help assess the accuracy of molecular diagnosis and the efficacy of the vaccines against COVID-19.
Implications of all the available evidence The results that we presented here serve as a proof of concept to demonstrate the utility of large-scale viral genome sequencing during a novel pathogen outbreak. Ramping up sampling in a real-time manner may generate high-resolution maps of who-infected-whom transmission at community level and reveal the subsequent expansion patterns which are especially crucial for the most severely stricken countries and regions to promptly develop tailored mitigation plans.
1. Introduction
A severe respiratory disease, named as Coronavirus Disease 2019 (COVID-19) has swept the globe by causing over 85 million confirmed cases (∼1.1% world population) and over 1.8 million deaths since it was firstly reported from Wuhan, China in early December 2019 [1]. A novel betacoronavirus, severe acute respiratory syndrome coronavirus-2 (SARS-CoV-2), was identified as the etiologic agent of COVID-19 [2,3]. Genomic sequencing results indicate that the genome of SARS-CoV-2 is closely related to two bat-derived SARS-like coronaviruses, RaTG13 (with 96.2% identity) and RmYN02 (with 93.3% identity), respectively collected in 2013 and 2019 in Yunnan province, southwest China [4,5]. Phylogenetic analysis also demonstrates that SARS-CoV-2 is similar to the two bat-derived SARS-like coronaviruses but distinct from SARS-CoV and MERS-CoV [3,5]. Thus, it is speculated that bats might be the original host of SARS-CoV-2, and other non-bat mammals such as pangolins might have been the intermediate reservoir [6]. Moreover, the first reported patient cluster of COVID-19 was epidemiologically linked to a seafood wholesale market in Wuhan, China, so the market has been assumed as the origin of the outbreak by representing an intermediate reservoir of SARS-CoV-2 [7]. However, epidemiological evidence doubted the market was the birthplace of SARS-CoV-2 [8,9]. During the 2014-2015 Ebola outbreak, full-length EBOV genome sequences from different severely stricken countries/districts in West Africa have helped us to better understand the viral evolution and transmission dynamics of the outbreak [10–12]. Likewise, genomic studies of SARS-CoV-2 viral sequences may provide key insights into the transmission and evolution dynamics of the ongoing COVID-19 pandemic.
In this study, we firstly analyzed 4,013 full-length genome sequences of SARS-CoV-2 submitted to the GISAID EpiFlu™ database from all over the world (N = 4,002) and from NGDC database (N = 11) in China over a 14-week timespan since the outbreak in Wuhan, China (as of 7 April 2020). By mutation-based genotype characterization, we gain insights into the global evolutionary dynamics and genetic diversity of SARS-CoV-2 from the early phase of the pandemic. Moreover, we also used the same approach to analyze 261,323 full-length SARS-CoV-2 genomes from all over the world over 12 months since the outbreak (i.e. including all the available viral genomes in the database as of 25 December 2020) to recapitulate those insights in parallel with the unfolding pandemic. So this study not only provides an unprecedented window into the global transmission trajectory of SARS-CoV-2 in the early phase, but also reveals the subsequent expansion patterns of the pandemic.
2. Materials and methods
2.1 Genome sequence retrieval and cleaning
We retrieved 4,555 FASTA sequences of SARS-CoV-2 genomes from Global Initiative on Sharing All Influenza Data (GISAID) database (https://www.gisaid.org/) and 147 FASTA viral sequences from National Genomics Data Center (NGDC) database (https://bigd.big.ac.cn/ncov) in China as of 7 April 2020, the first cutoff point of this study. The reference genome Wuhan-Hu-1 (Genbank ID: MN908947.3) comprising 29,903 nucleotides with annotation of corresponding CDS regions was downloaded from Genbank (https://www.ncbi.nlm.nih.gov/genbank) as well as the related coronavirus genome sequences from bats and pangolins.
Partial SARS-CoV-2 genome sequences or gene-level only sequences were filtered out. Viral genome sequences from non-human hosts were also filtered out. Redundant sequences included in both databases, multiple samplings from the same patient, and re-submission of the identical sequences were excluded. Sequences with N for more than 3% of the total nucleotides (except 5’ and 3’ ends) were filtered out. After filtering, all the remaining sequences were mapped to the reference genome by a dual alignment software MAFFT (v7.450) which takes into consideration of both amino acid or nucleotide sequences. The genome sequences with >20 mismatches to the reference genome were further filtered out. After the filtering process, a total of 4,013 viral genome sequences (4,002 from GISAID and 11 from NGDC) were included in this study for further analysis.
Similarly, we retrieved 290,005 FASTA sequences of SARS-CoV-2 genomes from GISAID database as of 25 December 2020, the second cutoff point of this study. After the aforementioned filtering process (except the genome sequences with > 45 mismatches to the reference genome were filtered out here), a total of 261,323 viral genome sequences were included in this study for further analysis.
2.2 Estimation of possible bias introduced by sequencing errors
We filtered out low quality sequence data to ensure the high quality of the analyzed genome sequences. We examined the samples with only one of the concurrent mutations of M type at either position 8782 base or 28144 base to estimate the maximum sequencing errors that we can anticipate. Our hypothesis was that the inconsistency at the other position in those samples was caused by sequencing/assembling error. There were 16 out of 4,013 genomes showed only one of the two concurrent M type mutations. Six out of the 16 demonstrated an ambiguous base (N or “Y”) at the inconsistent site, so there were at most 10 errors at either of the two sites in the 4,013 genomes. If we assume sequencing errors occurred randomly along the viral genome, the maximum sequencing error rate for each base per genome can be calculated as 10/2/4013 = 0.00125. And the error rate was further divided by 3 given that each base was equiprobably recognized as one of the three erroneous bases (e.g. A->C, A->T, A->G), resulting in a final error rate of 0.00042. Based on this estimation, we can assume if any single mutation observed in this study had been caused by sequencing error, it was supposed to be found in no more than 1.68 genomes (calculated as 4013 genomes multiplied by 0.00042). Similarly, amongst 4013 genomes in the study, less than 0.001 genome was anticipated to acquire two concurrent mutations as M type by sequencing error (calculated as 4013 genomes multiplied by 0.00042^2).
2.3 Probability estimation of a multitude of identical genotypes by coincidence
As the evolutionary rate was estimated to be 27.1 subs per year, it may take 3321 years (30000 x 3 possible alternative bases /27.1 bases per year) for a viral genome to generate an identical mutation with another one through viral error-prone replication. Thus, less than one (0.4) out of 4,013 viral genomes was anticipated to acquire one identical mutation with another one by random mutation events during the past 4 months (calculated as 4013 genomes divided by 3321 years and multiplied by 1/3 year). In addition, as indicated previously, amongst the 4013 viral genomes, less than 0.001 genome was anticipated to acquire two concurrent mutations as M type by sequencing error.
2.4 Phylogenetic tree analysis
In order to find evolutionarily related coronavirus with SARS-CoV-2, the reference genome sequences (Genbank ID: MN908947.3) was used to perform BLAST via NCBI betacoronavirus sequence dataset (https://blast.ncbi.nlm.nih.gov/Blast.cgi). Nine coronavirus sequences from bats sharing the highest genomic identity with MN908947.3 were selected and downloaded. In addition, nine coronavirus sequences from pangolins (available at GISAID) were also selected to align with MN908947.3. Phylogenetic tree analysis was conducted with the neighbor-joining method in MEGA-X (v10.0) based on the alignment results. Six sequences (3 from bats and 3 from pangolins) that are most proximate to MN908947.3 in the tree were chosen for nucleotide alignment at the orthologous sites of 8782 base and 28144 base with the sequences of nine early Wuhan cases (eight linked with the Market and one not related to the Market). Since the reference genome MN908947.3 harbors the two concurrent mutations at 8782 base and 28144 base, we deliberately changed the position 8782 to T, and position 28144 to C in order to call the two M type mutations in all sequences in the study. The resulting sequences were used as the reference for all subsequent analyses in the study.
2.5 Mutation calling and clustering analysis
Mutations were detected by an in-house developed software, which comparing each sample’s alignment result to the reference genome sequence. The first 150 base at 5’ end and 80 base at the 3’ end were omitted, and the ambiguous bases were ignored. After mutation detection, the matrix of mutations for all samples was used to perform the unsupervised cluster analysis via Pheatmap (v1.0.12) package of R.
2.6 Strain of Origin (SOO) algorithm
19 genotypes were selected from clustering analysis and defined in the Pedigree chart (Fig. 3b). Samples with mutation profiles matching to any of the 19 defined genotypes were classified into the corresponding types, whereas samples with mutation profiles not fitting into any defined genotypes were assigned as Others. Samples with no mutations under the aforementioned mutation calling methods were defined as ancestral type.
3. Results
3.1 A super-dominant genotype of SARS-CoV-2 was characterized with two concurrent mutations
We identified two most abundant substitutions, C/T at location 8782 base (orf1ab: C8517T, synonymous) and T/C at location 28144 base (ORF8: T251C, L84S). The T8782 and C28144 genotypes were found to co-exist in 767 (19.1%) genomes, whereas the remaining 3,246 genomes (80.9%) were consistent with the first sequenced SARS-CoV-2 genome, Wuhan-Hu-1 (MN908947.3) at those two sites [2]. This finding was consistent with a previous study [13].
Next, to address the question of whether those two sites are evolutionarily conserved, we generated a phylogenetic tree of the seven patient samples linked with the Huanan Seafood Wholesale Market (hereinafter named as the Market) and the related coronaviruses from animal reservoirs by nucleotide sequence alignment [14]. Interestingly, we found the most related coronaviruses from pangolins and bats showed consensus at the orthologous sites of 8782 base as T and 28144 base as C. A complete linkage at both sites was also observed in these highly related coronaviruses including the most closely related bat coronavirus RaTG13 (96.2% identical) (Fig. 1a). This result suggests that the T8782 and C28144 genotype existing in 19.1% of SARS-CoV-2 genomes is more conserved during evolution as an ancestral genotype. On the opposite, the samples from the seven patients demonstrate identical concurrent mutations on those two sites (T8782C and C28144T). Coincidentally, all seven patients had worked or visited the Market before the onset of illness. Also worth mentioning is that the patient of sample Wuhan/WH04/2020 did not visit the market but stayed in a hotel nearby between 23 and 27 December, 2019 [2,7]. Different from the aforementioned seven Market samples, the genotype of this patient sample showed no mutations on the two sites (i.e. T8782 and C28144), suggesting this patient had been infected from somewhere else in Wuhan instead of the Market. Noteworthily, the first sequenced SARS-CoV-2 genome, Wuhan-Hu-1 which was from a worker at the Market, also acquired the two point mutations [2].

(a) Sequence alignment of SARS-CoV-2 and the most related coronaviruses from animal reservoirs at location 8782 and 28144. The 20 base frank sequences of site 8782 and 28144 (indicated with red triangle) from seven COVID-19 samples linked with the Market, one sample not directly linked with the Market (Wuhan/WH04/2020) (marked with red arrow), and seven closely related virus samples from bats and pangolins were aligned with the reference genome, Wuhan-Hu-1 (marked with red star). Bat/Yunnan/RaTG13/2013 is the closest coronavirus to SARS-CoV-2 with overall 3.8% genomic difference.
(b) Accumulative number and percentage change of M type cases over time. The percentage of M type cases at each time point was calculated by the accumulated number of M type cases against total accumulated cases.
Given limited sampling of viruses from the Market, we acknowledge that samples with concurrent T8782 and C28144 genotype from the Market might have been underrepresented. However, we are confident that a significant portion of samples from the Market were derived from an ancestral genotype, generating a distinctive genotype defined by two concurrent mutations, which we named as M type (T8782C/C28144T) hereinafter. It represented an overwhelming majority of all COVID-19 samples since the initial phase of the global pandemic (Fig. 1b). All the 16 samples collected prior to 01 January, 2020 have the M type mutations that coincides with the fact that market contact history was one of the diagnostic criteria of COVID-19 at the period of time (Table S1) [9]. In this study the M type was the most dominant genotype, accounting for 80.9% of 4,013 SARS-CoV-2 global genomes. Based on the phylogenetic analysis, viral genotypes and epidemiological data of early cases sampled in Wuhan, we speculated that the Market was not the origin where the pandemic initially started, but was an incubator of the M type at the early outbreak of the pandemic. It also echoes with a few previous studies that doubted the market was the origin, or the only origin, of COVID-19 outbreak [13].
3.2 The mutation spectrum and dynamics of SARS-CoV-2 genome
First, we estimated the impact of sequencing errors on mutation calling in this study. As described in detail in Methods, sequencing errors were very unlikely to confound the mutation analyses of 4,013 genomes. A total of 2,954 unique nucleotide substitutions were identified from the 4,013 SARS-CoV-2 genomes (Table S1) with relatively even distribution across the viral genome (Table S1). On average, there are 7.4±3.4 (mean±SD) mutations per genome. Only 31 genomes had no mutation (i.e. ancestral type), while 952 (32.2%) mutations were recurrent in more than one sample. There were 17 mutations that occurred in more than 10% samples (Fig. 2a, Table S1).


(a) Frequency histogram of common mutations identified 4,013 virus genomes (as of 7 April 2020). Mutations that shared by at least 10% samples were ranked from the most common (left) to least common (right) mutations.
(b) The relation between time of emergence and number of mutations per sample. All samples were classified into 15 groups by the number of mutations (ranging from 0 to 14) and the time of emergence was calculated as days from 23 December 2019 (Day 1) to the date of sample collection. The red line connected the mean time of emergence from each group.
(c) Symmetric matrix of concurence rate of 17 most frequent mutations among all samples. The number within each box represented the percentage of samples possessing the intersecting mutations against all samples.
(d) A Venn diagram showing the subsequence relationships of the 17 most frequent mutations.
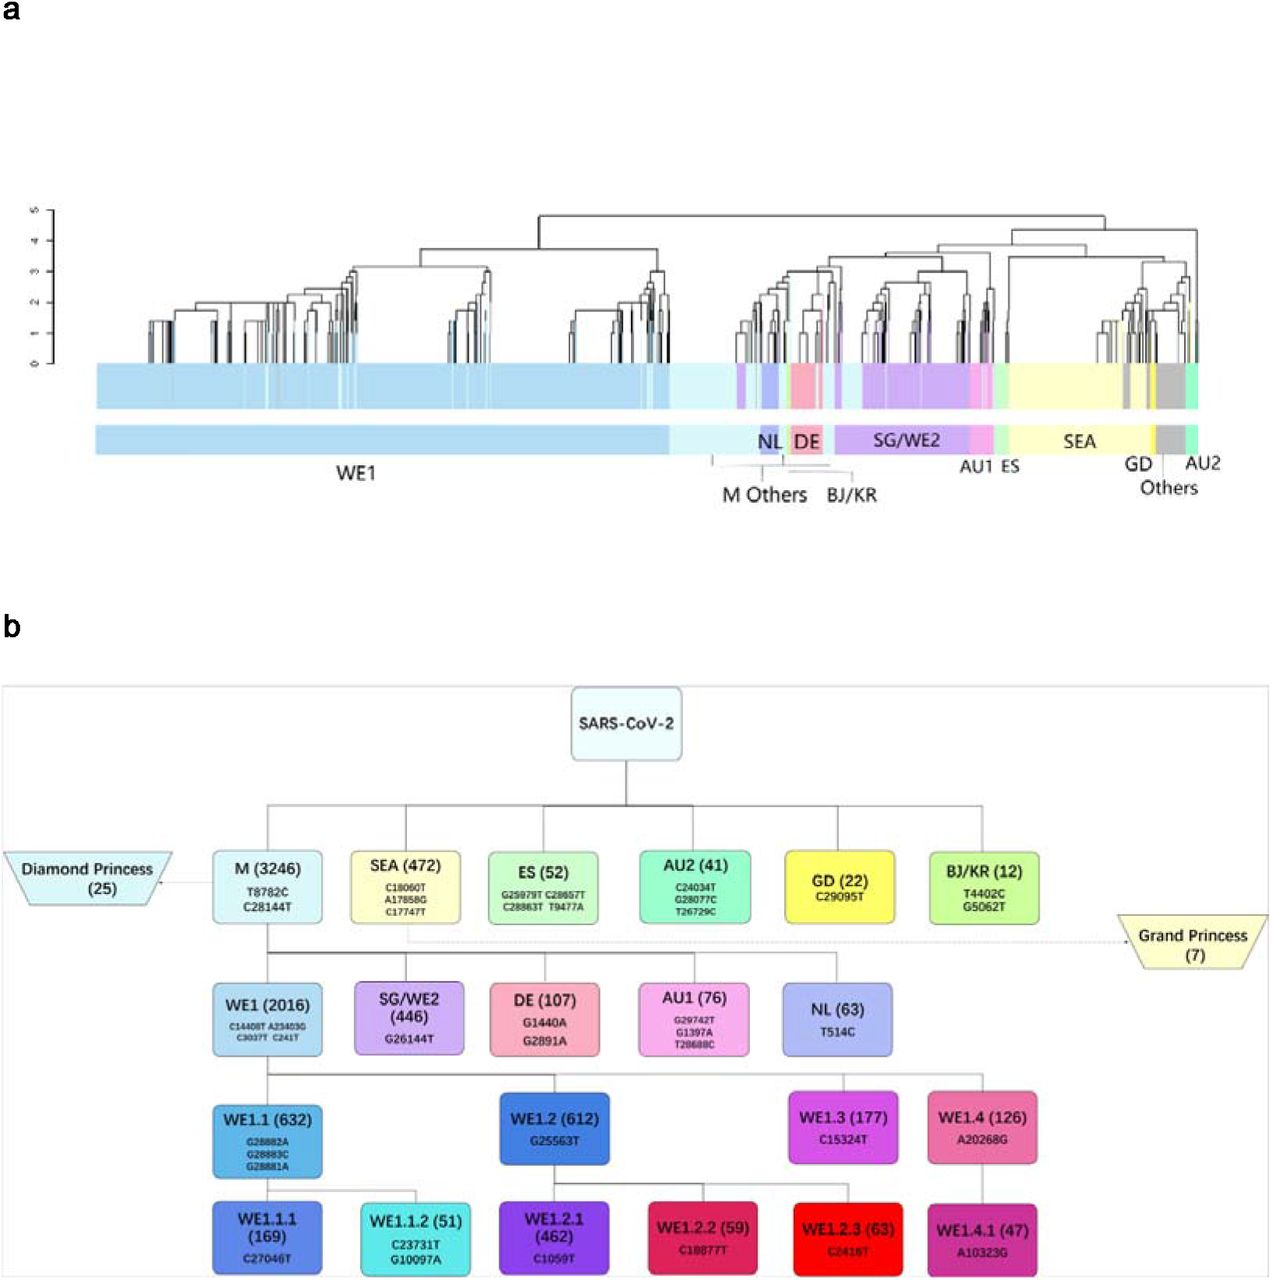

(a) Unsupervised mutaion clustering of all samples. Mutations concurently called from at least 5 samples were included. 11 distinctive major mutation profiles were identified based on clustering tree branches and were named mainly based on the geographic locations where a certain genotype was initially or mainly reported from. The two-letter ISO country codes were used to indicate the countries associated with the mutation profiles (as shown at lower color bar). The upper color bar demonstrates genotypic homogeneity within each clustering tree branch.
(b) Pedigree chart of major genotypes. In combination of mutation clustering and available epidemiologic information, 11 distinctive main genotypes were characterized and the pedigree chart demonstrated the relationship of each genotype. The genotypes from Diamond Princess and Grand Princess derived from M type and SEA type respectively, were indicated with dashed arrows.
(c) Temporal expansion of the major genotypes (Level-0 to Level-2). M-Others: the other minor genotypes in Level-2.
(d) Mutual exclusivity among the major genotypes of Level-1 (M, SEA, ES, AU2, GD and BJ/KR) and Level-2 (WE1, SG/WE2, DE, AU1 and NL). M-Others: the other minor genotypes in Level-2.
See also Fig. S1.
Interestingly, we found that mutations increased in individual samples during the course of evolution by plotting the number of mutations per sample with the time of sample emergence (Fig. 2b). Samples with more mutations were collected at a relatively later stage. A simple linear regression of the root-to-tip genetic distances against the sampling dates was performed to estimate the evolutionary rate of SARS-CoV-2 using the TempEst (v1.5.3) software. The evolutionary rate was estimated to be 27.1 subs per year, which was very similar to the evolutionary rate (26.7 subs per year) estimated by Nextstrain.org from 4616 viral genomes sampled between December 2019 and April 2020 (https://nextstrain.org/ncov/global?l=clock).
Like M type T8782C/C28144T mutations, concurrent mutations were also observed from the rest 15 most common single nucleotide mutations. A symmetric matrix plot by clustering analysis was generated from the 17 most abundant mutations to highlight the most common concurrent mutations (Fig. 2c). T8782C/C28144T were concomitant in 81% samples, followed by C14408T/A23403G/C3037T/C241T co-existing in 51% cases, G28881A/G28882A/G28883C (16%), C1059T/G25563T (12%), C17747T/A17858G/C18060T (12%) and G11083T/C14805T/G26144T (8%). G28881A/ G28882A/ G28883C and C1059T/G25563T were intersecting with C14408T/C241T/C3037T/A23403G since both were subsequent mutations of C14408T/C241T/C3037T/A23403G (Fig. 2d). Likewise, C14408T/C241T/C3037T/A23403G and G11083T/C14805T/G26144T were intersecting with T8782C/C28144T since both were subsequent mutations of T8782C/C28144T. C17747T/A17858G/C18060T didn’t intersect with any other concurrent mutations since it was a genotype derived directly from ancestral type and independent to T8782C/C28144T (M type).
3.3 The super spreading genotypes
952 mutations (32.2%) spread at least once as they were detected in more than one patient samples, and distinct genotypes can be characterized based on the prevalence of mutations (Table S1) in order to identify “super spreaders” with particular genotypes, who to a great extent determined the scale and trend of the ongoing pandemic. Super spreader genotype was methodically defined as the basal outbreak variant possessing certain common mutations, which caused the outbreak with a single introduction and subsequently transmission and evolution.
The biggest super spreader genotype was the variant carrying M type (T8782C/C28144T) mutations which was spread into 3,246 patients, counting for 80.9% of the cases in the study (Fig. 1b). It may worth pondering whether this “founder effect” was attributed to a single super spreader or a multitude of coincidentally identical super spreaders. Based on an evolutionary rate of 26.7 subs per year estimated from genomes sampled between December 2019 and April 2020 on Nextstrain (https://nextstrain.org/ncov/global?l=clock), our estimation (detailed in Methods) indicated that the chance to have a multitude of identical mutations by coincidence or sequencing error was next to none. Therefore, it is plausible to assume that the COVID-19 patient clusters from the Market during the early outbreak were very likely to be the descendants from literally one single ancestor, who might have been a vendor or a regular customer and probably spread the virus at the Market late November or early December according to the limited epidemiologic data.
In contrast, only 41 patients (1.0%) had unique genotypes that were not overlapping with any other mutations identified in the 4,013 viral genomes (i.e. singletons) (Table S1). These patients had not spread their viruses based on the sampled viral genomes in this study.
3.4 Mutation-based unsupervised clustering indicates temporal and spatial transmission and expansion trajectory of SARS-CoV-2
In order to trace the temporospatial transmission and regional expansion of COVID-19 pandemic, we conducted mutation-based unsupervised clustering of all the samples. As shown in Fig. 3a, the 4,013 samples were largely grouped by their mutation profiles. Based on the clustering result, a pedigree chart of five-level hierarchy was manually curated and illustrated to show how the most dominant descendent genotypes were derived from the ancestral genome of SARS-CoV-2 at the Level-0 of the hierarchy (Fig. 3b, Fig. S1). Six descendant genotypes, namely M type (concurrent T8782C/C28144T) starting from the Market, SEA type (concurrent C17747T/A17858G/C18060T) initially reported solely from the Greater Seattle area in USA, ES type (concurrent T9477A/G25979T/C28657T/C28863T) with more than 60% of cases reported from Spain, AU2 type (concurrent C24034T/T26729C/G28077C) with 22 out of 41 cases reported from Australia, GD type (C29095T) initially found in Guangdong Province, and BJ/KR type (12 cases with concurrent T4402C/G5062T mutations) reported from both Beijing and South Korea, were directly derived from the ancestral genome by acquiring corresponding mutations, and thus represented Level-1 of the hierarchy.
3.4.1 More than 80% of cases worldwide were derived from M type
The M type accounted for 80.9% of all global cases in the study. Although initially identified from the Market in Wuhan, China, it was subsequently reported in Western Europe, USA, and Australia with corresponding novel mutation signatures apart from T8782C/C28144T. Five descendant genotypes were further derived from M type, consisting of Level-2.
In particular, the most prevalent descendant genotype of M, WE1 type (named as Western European 1), represented a total of 2,016 cases, a half of all the cases (50.2%) in the study. Over 70% of WE1 cases were reported from Western European countries, with the United Kingdom (19.2%), Iceland (11.8%), Belgium (9.7%), France (8.5%), and Netherlands (5.0%) being the most severely stricken countries by WE1. The WE1 type was featured by four concurrent mutations (C241T/C3037T/C14408T/A23403G). Given geographic proximity among those countries, cross-border virus traffic might have occurred, leading to widespread transmission of SARS-CoV-2 in Western Europe. WE1 also represented 34.8% of the cases in the United States. Interestingly, among 4,013 samples, we found three early samples carrying three out of the four mutations of WE1 (C241T/C3037T/A23403G), with two (one from Germany and one from Shanghai) sampled on 28 Jan 2020 and one from Shanghai sampled on 31 Jan 2020. The one from Germany belonged to the first COVID-19 cluster reported from Bavaria, Germany, which was associated with a primary case with previous travel history from Wuhan [15].
SG/WE2 type was characterized by a single common mutation (G26144T). This type was first reported from Singapore and several Western European countries (UK, France, Switzerland and Netherlands) as of 17 March 2020. Over half of the SG/WE2 cases in this study were reported from UK (38.8%) and Australia (13.7%), followed by 9.6% from Iceland, 8.7% from Hong Kong and 4.7% from USA. The chronological difference of the early cases implied a Singapore to Western European case importation. Based on the new cases from Oceania, case importation from Singapore to Australia can also be inferred since Singapore is an important transit point for many international flights.
The third representative Level-2 genotype was DE type with two concurrent mutations (G1440A/G2891A). All early cases of the DE type were found in Germany, however, the majority (62.6%) of DE cases were reported from UK. In particular, 60 out of 67 DE cases in UK further developed a unique mutation (G28851T) defined as DE2 in Level-3, and 34 DE2 cases acquired another mutation (C25669T) on top of DE2, resulting in 4 concurrent mutations defined as DE2.1 in Level-4. So cross-border traffic of DE type from Germany to UK can be inferred.
The last two genotypes derived from M type at Level-2 were NL and AU1 type. NL type was mainly reported from Netherlands and featured with a single extra mutation, T514C. AU1 type was mainly found in Australia with three extra concurrent mutations (G1397A/T28688C/G29742T).
3.4.2 SEA type, the most dominant type in USA penetrated other three countries with various geographic distances
The SEA type was initially related to 41 cases in the Greater Seattle area and 7 cases on Grand Diamond cruise ship as of 17 March 2020. It was also seen from 41 cases in Australia, 26 cases in Canada and 11 case in Iceland in the cases reported later (as of 7 April 2020), apart from a total of 393 cases in USA, indicating case importation had occurred from USA to the other three countries before travel restrictions were implemented in those countries. Interestingly, this finding coincided with a recently study in which SEA type was referred to as the “Washington State outbreak clade”, since the majority (n=384, 84%) of the viruses sampled from the Washington State outbreak from 19 January to 15 March 2020 fall into this clade [16].
3.4.3 In contrast to M and SEA, four other genotypes in Level-1 were mostly circulated regionally among relatively small populations
ES type featured by concurrent T9477A/G25979T/C28657T/C28863T mutations, was mainly reported from Spain, with 20 out of 52 cases scattered among other countries. Likewise, 22 of 41 cases of AU2 type (concurrent C24034T/T26729C/G28077C) was reported from Australia. GD type was mainly reported from Guangdong Province, and the BJ/KR type was related to 4 patients in Beijing and 8 patients in South Korea. Similar to WE1, other genotypes at Level-2 developed descendant genotypes in Level-3 and Level-4 by accumulating more additional mutations from the corresponding Level-2 genotype (Fig. S1).
Fig. 3c illustrated the temporal expansion of the 11 major genotypes defined above. M type (WE1, SG/WE2, DE, AU1, NL and the rest of M type) remained as the overwhelmingly dominant genotype from the very beginning of the outbreak to early April. WE1 was spread to more than half of the total cases as of 7 April, becoming the most prevailing M-derived genotype in the globe. Next to WE1 type, SG/WE2 type was spread to 11.1% of global population. The major non-M type, SEA type, initially reported from the Greater Seattle area, was spread to 11.8% of global population.
As shown in Fig. 3d, six Level-1 genotypes (M, SEA, ES, AU2, GD and BJ/KR) derived directly from ancestral type were mutually exclusive, and five Level-2 genotypes derived from M type (WE1, SG/WE2, DE, AU1 and NL) were mutually exclusive as well. It implies mutations occurred randomly and independently in the genome of SARS-CoV-2 and the various genotypes carrying specific mutations were propagated during human-to-human transmission, not by accumulating hot-spot mutations during the replication of individual viral genomes. This also reflects the high quality of sequencing data applied in the study after filtering out low quality sequence data and the randomness of the mutations as well.
3.5 Major genotypes of SARS-CoV-2 in different countries indicated genotypic-epidemiologic relevance
Fig. 4a lays out the genotypic compositions of SARS-CoV-2 in ten representative countries and geographic locations (Wuhan City, China, USA, UK, Netherlands, Australia, Spain, Germany and two cruise ships) in this study. An in-depth mutation profiling of the cases from four areas of interest were also conducted to provide genotypic-epidemiologic connections within different countries and regions, which may help to restore a more complete picture of the unfolding pandemic (Fig. 4b-4c).


(a) Genotypic compositions of SARS-CoV-2 in China (as well as Wuhan), UK, Netherlands, Spain, Germany, Australia, USA and two cruise ships.
(b) Mutation profiles of 34 early samples from Wuhan. Row one: time of sample emergence calculated as week(s) since the week of 23 December 2019; Row two: Sample location. Samples linked with the Market were indicated as orange.
(c) Mutation profiles of the cases from USA. Row one: time of sample emergence calculated as week(s) since the week of 23 December 2019; Row two: Sample location. Bottom: sample names indicated with blue were early imported cases from Hubei Province.
(d) Mutation profiles of the cases from two cruise ships. Row one: time of sample emergence calculated as week(s) since the week of 23 December 2019; Row two: Sample location.
3.5.1 China, as the first severely stricken country, reflected a “spill-over” effect of Wuhan viral genotypes
The epicenter of COVID-19, Wuhan, was where the M type had originated. The M type samples accounted for 86% of all cases reported from the city. Population mobility from Wuhan to other parts of China during Spring Festival travel rush before Wuhan was locked down on 23 January 2020 might have caused nationwide prevalence (i.e. spill-over) of M type in China, which was subsequently diluted by regional expansion of other genotypes to a lower percentage of 57%.
Early cases reported from Wuhan was extremely critical to answer how the outbreak took place at the very beginning. In this study, we were able to collate 34 viral genomes sampled from Wuhan between December 24, 2019 to January 18, 2020, although the number of confirmed case by then were 121 according to Chinese officials (Fig. 4b). There were two distinct clusters of the 34 early samples. 30 out of 34 viral genomes were categorized into the M type (T8782C/C28144T) with a great extent of genetic diversity. Among these 30 genomes, 17 acquired extra mutations apart from two M type mutations resulting in 14 different genotypes. All of the 11 viral genomes linked with the Market (including 8 samples of patients who worked at the Market and 3 positive environmental samples collected from the Market) were in this cluster [7]. Although the M type was the dominant type during the early outbreak of COVID-19 in Wuhan, the non-Market genotypes from four patients forms the second cluster that also co-existed with M type cluster at that time. Two of them were ancestral type and the other two had their own unique mutations. Wuhan/WH04/2020 was a patient who had no direct Market exposure in the second cluster [7]. Taken together, these findings imply that the genetic pool of SARS-CoV-2 was already very diversified during the early outbreak in Wuhan as there were 18 different genotypes in total among the 34 early samples from Wuhan. The super-dominant Market lineage might have been initially transmitted to the market by a primary patient case infected with the M type virus. M type virus was rapidly propagated within the Market which had served as a big incubator of the outbreak considering its huge size (∼50,000 square meters and ∼1000 booths). This notion is also evidenced by the three positive environmental samples (Wuhan/IVDC-HB-envF13/2020, Wuhan/IVDC-HB-envF13-20/2020, and Wuhan/IVDC-HB-envF13-21/2020) collected from the booths and garbage truck of the Market in 1 January 2020 by China CDC. The viral genotypes of three environmental samples were also M type. In fact, 33 out of 585 environmental samples from the Market were tested positive for SARS-CoV-2 according to an investigation conducted by China CDC in January 2020.
3.5.2 Genetic dynamics of the cases in the United States might be attributed to early imported cases from Hubei
In general, on the contrary to the global dominance of M type, the non-M types were much more prevailing in USA than the M type (42 vs 19) as of 17 March 2020 (Fig. 4c). It is noticeable that the earliest cases reported from USA (samples collected between January 19 to February 11, 2020) were the patients who had been to Hubei Province before the illness onset (five in M type and seven in non-M types) and all cases were scattered around in different states of USA (sample names were indicated as blue at the bottom annotation in Fig. 4c. Moreover, each of the 12 imported cases from Hubei had a distinct genotype, suggesting early imported cases in US already possessed great genetic diversity.
All the cases with no Hubei travel history in the M type cluster (14 cases) were mainly from California (8 cases), Washington (4 cases) and New York (2 cases). Four samples had one additional C9924T mutation and three samples had three concurrent mutations (C3037T/C14408T/A23403G). All of the 42 patients with the SEA type (three concurrent mutations C17747T/A17858G/C18060T) in non-M clusters were from the Greater Seattle area. The first case of COVID-19 in the United States (USA/WA1/2020) had only C18060T mutation but not the C17747T/A17858G mutations of SEA type. This patient returned to the Greater Seattle area on 15 January, 2020 after traveling to visit family in Wuhan [17].
Thus 50.1% of cases in USA were SEA type originated from Seattle and 34.8% were WE1, the most dominant genotype in Western Europe, which was also the most dominant genotype in New York City (89.7%). Taken together, it indicates that USA endured the first wave of case importation from China and the second wave from Europe, which is consistent with the recent COVID-19 study of Washington State [16].
3.5.3 The genotypes from two cruise ships were very distinct
As shown in Fig. 4a and Fig. 4d, all the 25 Diamond Princess cruise ship cases harbored the two M type mutations (T8782C/C28144T). While eight of them had no extra mutations, the other 17 cases harbored additional mutations but none of them were identical (Fig. 4d).
All seven Grand Princess cruise ship cases possessed the SEA genotype (three concurrent mutations C17747T/A17858G/C18060T) and presented at least two extra mutations, while three cases carried three extra common mutations (A3046G/A16467G/C23185T) (Fig. 4d). Thus, the seed patient of Grand Princess might have been from the Greater Seattle area based on the overlapping mutations with the SEA genotype.
There were 25 different viral genotypes in total among the 32 cruise ship patients. Although both Diamond Princess and Grand Princess provided an occlusive environment for COVID-19 outbreak in a short time window, the heterogeneity of viral genetic pool of both cruise ships implies that SARS-CoV-2 maintained a noticeable mutation rate during person-to-person transmission.
3.5.4 The cross-border virus traffic was evident among Western European countries
Patients in three Western European countries, UK, Netherlands and Germany were overwhelmingly dominated by the M type (99.4% vs 96.6% vs 97.4%) (Fig. 4a). While WE1 was the most common genotype derived from the M type in all countries (53.5 vs 56.2% vs 52.6%), and each country had distinct the second most common genotypes: SG/WE2 (23.9%) in UK, NL (25.3%) in Netherlands and DE (31.6%) in Germany. In contrast to Netherlands and Germany, the M type only accounted for 44.3% of viral genotypic composition in Spain. A novel non-M type, ES, showed comparable prevalence to M type (40.5%) were mostly reported from Spain (Fig. 4a).
While cross-border virus traffic had likely occurred among three countries that contributing to widespread of WE1 type in the early outbreak across Europe, the existence of country-specific genotypes suggested control measures after the early outbreak were to some degrees effective in those countries.
3.5.5 Australia endured multiple waves of imported cases
The first viral genome in Australia (sampled on 22 Jan 2020) harbored two concurrent T8782C/C28144T mutations (i.e. M type). So a first wave of M type importation from China to Australia can be speculated (Fig. 3b). A subtype derived from M type, AU1, was mostly restricted to the patients reported from Australia at the early phase of the outbreak. As of early April, 78.5% of cases in Australia were still M type, but AU1 (6.7%) was no longer the largest subtype. Instead, WE1 (42.7%) and SG/WE2 (16.0%) were the most abundant subtypes (Fig. 4a), suggesting a second wave of importation from Western Europe. In addition, a noticeable emergence of SEA type (10.7%) inferred a third importation wave from USA. The ebbing tide of AU1 coincides with the China travel ban issued by Australian government on 1 February 2020, indicating the travel restriction from China might have been efficacious.
3.6 Genotype matching and strain of origin
By taking into account all of the well-defined 11 major genotypes in our study, we developed an algorithm, Strain of Origin (SOO), to match a particular SARS-CoV-2 viral genome to the known genotypes based on its mutation profile. The concordance of SOO was estimated in comparison with mutation clustering by assigning each of 4,013 samples included in the study to the corresponding genotype (Fig. 5). The overall concordance of genotypes assigned by SOO with those assigned by mutation clustering was 89.8%. Within Level-1 genotypes, the concordance ranged from 84.9% to 100.0% with an overall concordance of 86.5%. All the Level-2 genotypes represented major subtypes of M type and the overall concordance with clustering results at this level was 90.5%. The most abundant genotype at Level-2, WE1 showed 93.4% concordance. Thus, SOO represents a more accurate approach to define genotypes as it only takes into consideration the specific mutations of the particular genotypes with little influence from the rest random mutations.

Agreement of genotype assignment between the clustering (y-axis) and SOO (x-axis). Percent of correct assignment from the total samples for each genotype from clustering was indicated to the right of the plot.
3.7 Comparison of SOO classification and GISAID phylogenetic clades
There were seven phylogenetic clades of 5139 virus genomes sampled between December 2019 and September 2020 in GISAID global analysis (https://www.gisaid.org/epiflu-applications/hcov-19-genomic-epidemiology/) (Table S2). Since genomes were equally subsampled from each admin division per month, it should be acknowledged that countries with massive viral genome submissions were underrepresented. Thus conclusions regarding the global vision of the pandemic based on the GISAID global analysis should be drawn with caution.
Four clades (n=4077, 79.3%) from GISAID were well defined by the SOO classification (Table S3). The three most prevalent clades GR (n=1726, 33.6%), G (n=1252, 24.4%) and GH (n=977, 19.0%) were descendent from WE1 (n=3955, 77.0%), with GR referred to WE1.1, GH referred to WE1.2, and G referred to WE1 others by SOO classification. Moreover, V (n=122, 2.4%) was referred to SG/WE2 by SOO. Two other clades can not be directly referred to any SOO genotypes although L can be vaguely inferred as ancestral type and others, S be inferred as a mixture of non-M types including SEA, ES, AU2, and GD. On the other hand, the O (n=500, 9.7%) clade can not be equivocally inferred as any SOO genotypes. It is plausible since it was not presented as a unique branch as other clades but scattered all over other branches of the phylogeny, implying it was not a well-defined unique clade.
3.8 The mutation spectrum of the subsequent global expansion of COVID-19 pandemic
We analyzed all the available SARS-CoV-2 viral genomes in GISAID database as of 25 December 2020. A total of 10,392 unique nucleotide substitutions were identified from the 261,323 SARS-CoV-2 genomes (Table S4), which indicates roughly one out of three nucleotides in the viral genomes has mutated during the 12-month timespan of the viral evolution. A pedigree chart of the 100 most abundant mutations was generated to highlight the lineages of the most common concurrent mutations during the 12-month time window of the unfolding pandemic (Fig. 6, Table S5). A very tiny proportion (92 genomes, less than 0.04%) of viral genomes were ancestral type. 59 (64%) of them were reported from China between January and March 2020, among which seven were sampled from Wuhan in January 2020 (Table S6). Despite of the overwhelming dominance of M type (95.4%), other major genotypes at Level-1 hierarchy in the early phase gradually faded out as the pandemic unfolds (Fig. 3B, Fig. 6, Table S5). For example, SEA type was one of the most common viral genotypes in early April, account for 11.8% of the total samples. However, the percentage of SEA type drastically dropped to only 1.0% by the end of December (Fig. 6, Table S5). Moreover, the proportion of other non-M mutations (ES, AU2, GD and BJ/KR) at Level-1 were too small to be listed within the 100 most common mutations. Similarly, WE1 was still the major subtype (88.6%) of M while other subtypes (SG/WE2, DE, AU1, and NL) at Level-2 gradually faded out. But still, four subtypes of WE1, namely WE1.1 (34.3%), WE1.2 19.3%), WE1.3 (22.2%) and WE1.4 (6.1%) were reasonably represented. On the other hand, a subtype of WE1, named WE1.5 (19.9%) featured with additional seven concurrent mutations (T445C/C6286T/G21255C/C22227T/C26801G/C28932T/G29645T) had not emerged by early April but came to the surface during the subsequent expansion. Interestingly, one-time concurrence of more than four mutations like WE1.5 was seldomly represented in the early viral samples, but was more frequently observed in the later phase (Fig. 6).
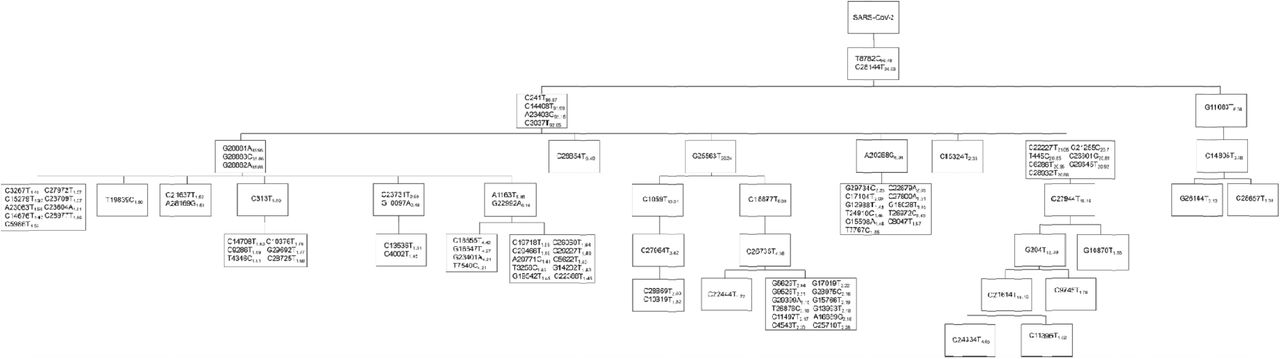
The number next to each mutation indicates the frequency of the mutation.
Noteworthily, in December 2020, the authorities of the UK and South Africa reported to WHO two variant strains of SARS-CoV-2 as Variant of Concern (VOC) respectively. Both strains were featured with a novel amino acid change (N501Y) caused by A23063T. In this study, a total of 4130 viral genomes harbored N501Y by 25 December 2020. Interestingly, they were generally categorized into two strains, with 3931 genomes as a subtype of WE1.1, and 188 genomes as a subtype of WE1.2 under SOO algorithm (Fig. 7a), with the former mainly reported from the UK (98.5%) and the latter mostly reported from South Africa (96.3%). It was coherent with a recent report from WHO that the UK variant N501Y V1 (i.e. B117) was a different virus variant from the one from South Africa N501Y V2 (i.e. B1351) by phylogenetic analysis [18]. The first genome of V1 in GISAID was from Victoria, Australia on 3 June 2020. A total of 31 V1 genomes were identified in June 2020, 30 of which were from Australia. This gave rise to the first wave of V1 in June. It followed by a spike beginning in November which was attributed to the wide spread of V1 in the UK at that time (Fig. 7b). The first genome of V2 was from New York City, USA on 21 April 2020, and V2 was later widely spread in South Africa as evidenced by a wave of V2 in November (Fig. 7b).

(a) The UK variant (N501Y V1) and South Africa variant (N501Y V2) were classified as two different strains by SOO. (b) The monthly frequency of V1 and V2 from April to December 2020.
3.9 Lineage analysis of SARS-CoV-2 virus in the early phase sheds light on subsequent expansion of COVID-19 pandemic
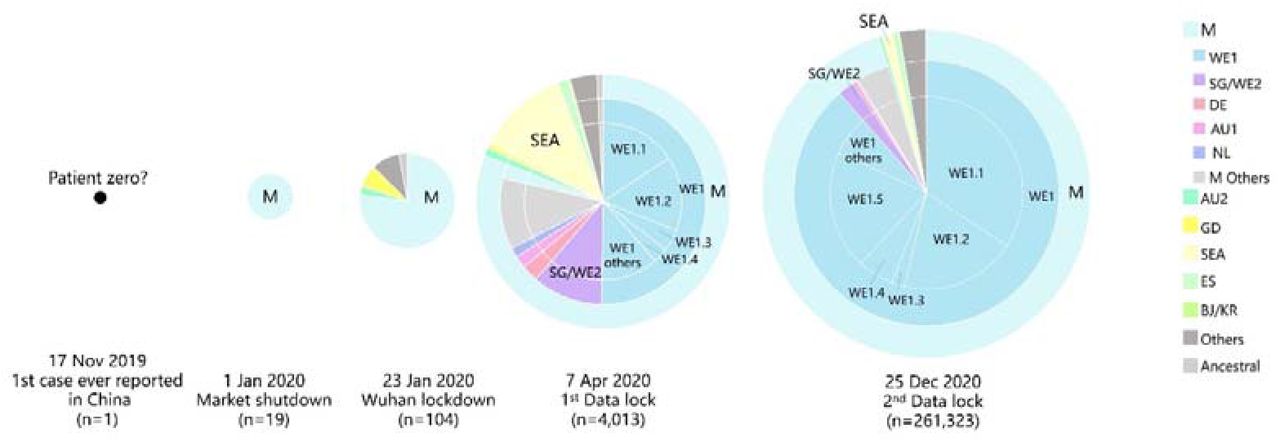
In order to virtualize the pandemic expansion patterns in the world over the last twelve months, we analyzed time-series genotypic compositions of SARS-CoV-2 at critical time points to piece the puzzle together (Fig. 8, Table S2-S3). First, to better visualize the whole story, a putative ‘patient zero’ harboring an ancestral viral genotype was added to build the first time point as 17 November 2019, on which date the earliest patient ever documented can be traced back to [19]. A total of 19 viral genomes were sampled by 1 January 2020, all of which were M type. As discussed before, M type cases had been populating at the Market for several weeks before it was shut down on 1 January 2020, resulting in an absolute overrepresentation of M type samples by this date. As the virus kept unfolding in Wuhan, the city was lock down on 23 January 2020. 80 of 104 (76.9%) viral samples by then were M type. Population mobility from Wuhan before its lockdown (e.g.: Spring Festival travel rush) caused the subsequent national-wide epidemic in China and ultimately the global pandemic. By 7 April 2020, over 80% of global cases were still M type. Noteworthily, a descendant genotype from M, WE1 type accounted for over a half of global cases. It firstly swept Western Europe in mid-February and later USA in late February, and became the most prevailing type worldwide. By 25 December 2020, 95.4% of global cases were M type and 88.6% of M-type cases were WE1. The overwhelming dominance of WE1 type and continuous expansion over the last 12 months was well captured and characterized throughout our study.
Genotypic compositions of genomes sampled by the dates of the first case ever reported, market shutdown, Wuhan lockdown, the first data lock and the second data lock of this study were analysed.
Thus, the M type expansion pattern well represented the pandemic expansion pattern: patient zero (17 November 2019, unknown%) → Market (1 January 2020, 100%) → Wuhan (23 January 2020, 76.9%) → World (7 April 2020, 80.9%; 25 December 2020, 95.4%).
4. Discussion
It has been over twelve months since Chinese health authorities first reported patient cases with pneumonia of unknown cause in Wuhan on 31 December 2019 [3]. As the pandemic continues, in order to mitigate the risk of further regional expansions as well as to estimate the effectiveness of control measures in various regions, researches on its origins, transmission routes and expansion models have begun to surge.
We acknowledge that the public available SARS-CoV-2 genomes included in this study are not sampled in strict proportion to the real-time global burden of COVID-19, however, we provide a global view of how the mutation patterns of SARS-CoV-2 genome vary over time in different countries and regions, which can shed light on the underlying temporospatial transmission and expansion pattern of COVID-19 worldwide. This is hitherto the largest and the most comprehensive SARS-CoV-2 viral genome study and molecular epidemiology study since COVID-19 outbreak in Wuhan, China. The 14-week time span since the outbreak gives us a sufficient time window to study the mutation profiles and molecular evolution of SARS-CoV-2 at the initial stage of the global pandemic.
SARS-CoV-2 virus is a positive-sense single-stranded RNA ((+)ssRNA) virus with a 30-kilobase genome, and like most other RNA viruses such as Ebola virus, SARS-CoV-2 can also quickly generate mutations through error-prone replication [2,3]. Considerable mutation events can be anticipated during the transmission and replication of the ongoing SARS-CoV-2 outbreak. Several studies on the genomics of SARS-CoV-2 virus have offered clues of the origins, and transmission path of the disease. However, due to lack of early samples, a limited number of SARS-CoV-2 genome and/or focusing on specific geographic locations [7,20–24], a complete global view of viral genomes in the context of their mutational spectrum is yet to be elucidated from any previous SARS-CoV-2 studies. Moreover, recent studies of SARS-CoV-2 viral genome evolution using phylogenetic analysis at the global scale have also generated conflicting conclusions in general [13,25-26].
The very early cases of COVID-19, especially those linked to the Market were the key to reveal the origin, the transmission paths as well as the evolution of the virus. Unfortunately, the viral samples and epidemiologic data from the early outbreak were largely mutilated. Here we meticulously collected the genomic data of the early cases from different databases and combed through the clinical data of those cases by not only in-depth review of early publications, but also reading news reports and social media in China, and by contacting the researchers who worked on the cases directly. We were able to collate 34 invaluable early cases from Wuhan including the cases of the mysterious patient cluster from the seafood Market. The genetic diversity observed from early Wuhan cases suggests the transmission had already been ongoing for some time at an inconspicuous pace before the clustered cases emerging from the Market were reported. The speculation can be reinforced by a report that the earliest patient can be traced back to 17 November 2019 [19].
Based on our time-series genotypic composition analysis, a super spreader genotype, M type, had ignited COVID-19 outbreak from the Market. The transmission continued for a few weeks or so without effective control measures until the final shutdown of the Market on January 1, 2020 [9]. As a consequence, the Market, with tens of thousands of people (workers and customers) in and out every day, became an incubator that catalyzed propagation of the M type in Wuhan during the early outbreak. Based on our lineage analysis, we can also conclude the explosion of the M type is the largest driving force for the global pandemic. However, it should be pointed out that this study is not equipped to address the natural origin of SARS-CoV-2 since there were no intermediate samples to link the most closely related bat coronavirus RaTG13 and human SARS-CoV-2.
The sequential increment of concurrent mutations from early lineages to descendent lineages as the pandemic unfolds still remains as an enigma. This phenomenon can be exemplified with M type. It initiated with 2 concurrent mutations followed by acquiring 4 concurrent mutations to become WE1, and further obtained 3 concurrent mutations to become WE1.1. Although it is roughly consistent with the estimated evolutionary rate (∼22 subs per year according to Nextstrain by December 2020), the underlying mechanism of those sequential increment of concurrent mutations is yet to be carefully addressed.
Intriguingly, A23403G in WE1 led to an amino acid change (D614G) in the viral spike protein (S protein), which has aroused a fierce debate − whether it is associated with increased transmission and/or virulence [27]. And more recently, a new variant of SARS-CoV-2 has been detected in the UK where, at the moment, the London government has imposed lockdown with restrictions on international travels. Its spreading rate has been estimated to be greater than 70% of cases compared to the normal SARS-CoV-2 virus, with an R index growth of 0.4 [28]. It is featured with a novel amino acid change (N501Y) caused by A23063T, which is located at the receptor binding domain (RBD) of the spike protein. This makes people wondering whether this mutation empowers the virus enhanced transmission ability and the capability of hinder vaccine-induced immunity [29]. Based on our study, we already know that the D614G variant emerged in Western Europe in February 2020 as it was one of the four concurrent mutations that were utilized to define WE1 in the study. In contrast, N501Y variant firstly emerged in 21 April 2020 from New York City, USA, and has surged to 4130 (1.6%) cases by late December. Vast majority (94.0%) of N501Y variants were sampled from UK and a small fraction (4.4%) were from South Africa. SOO algorithm classified the UK variant as a subtype of WE1.1 and South Africa variant as a subtype of WE1.2, indicating they were two different strains (i.e. occurred independently), which is consistent with our current knowledge on the two variants [18]. Yet, a sophisticated comparison of the two strains in combination with epidemiology and clinical representation information is needed.
Our study aligned with the notion that conclusions should be drawn with caution since it may be difficult to distinguish the neutral mutations (whose frequencies have increased through demographic processes such as founder effect) from adaptive mutations (which directly increase the virus’ transmission) [30-31]. Although we did not attempt to find any direct evidence or to build any mathematic models to address selection and fitness of SARS-CoV-2, the mutually exclusive mutation patterns of major viral genotypes in this study echoes with the other studies which implying no evidence for increased transmissibility, but appear to be evolutionary neutral and primarily induced by the human immune system via RNA editing [31]. However, the independent occurrence and the rapid expansion of the two N501Y strains imply that certain mutations may be able to increase the fitness of the virus.
As many Emergency Use Authorized (EUA) real-time RT-PCR diagnostic tests for SARS-CoV-2 have been widely used all over the world to screen for infected COVID-19 patients, various genomic regions were chosen by different agencies and manufacturers to design primers for the tests. For example, the three target regions of the diagnostic kit developed by US CDC are within the N region, whereas the test that China CDC developed for the initial investigation in Wuhan targeted ORF1ab as well as the N region, which is similar to the test used in Singapore [3, 32]. On the other hand, many manufacturers’ tests chose to target the S gene. For example, the Thermo Fisher Scientific and Applied DNA Sciences tests target the S gene. Thermo’s test also targets the N and ORF1ab genes, while Applied DNA’s test targets two regions in the S gene [33]. Since genetic variants of SARS-CoV-2 arise regularly, those tests may give rise to potential false negative results due to the mutations in the viral genome. A few tests have been reported with false negative issues like S-gene dropout or reduced sensitivity with the S-gene target in detecting variants with N501Y mutation [33]. Not to mention tests detecting a single target in the viral genome which may generate far more variable and equivocal results. Although tests with multiple genetic targets to determine a final result are less likely to be impacted by increased prevalence of genetic variants, ongoing analyses of viral genomes in a real-time fashion may help with early identification of new stains in patients to reduce further spread of infection, guide the development and assess the efficacy of SARS-CoV-2 vaccines [34]. Based on our study, it is evident that the common mutation loci should be avoided as targets when designing RT and PCR primers for SARS-CoV-2 tests. Similarly, when develop nucleotide-based vaccines of SARS-CoV-2, researchers should take into consideration of the mutation frequency in selecting viral genomic regions encoding antigen epitopes. Finally, it is imperative to reassure the vaccines can generate equivalent immunity against different genetic variants before inoculated in large population [34].
Our study also demonstrates the genotypes of SARS-CoV-2 are unique identifiers that can be used as molecular barcodes to trace the virus transmission retrospectively and to reveal its expansion prospectively at the molecular level. Our Strain of Origin (SOO) algorithm can match any particular SARS-CoV-2 viral genome to known genotypes with high accuracy based on its mutation profile. With the pandemic still ongoing, novel genotypes other than what we have characterized in this study may surface. Thus, we anticipate incorporating those newly emerging genotypes into the current algorithm may improve the performance of SOO in the future.
The United Kingdom launched a national SARS-CoV-2 Sequencing Consortium with £20M funding in March, aiming to investigate how coronavirus is spreading in the UK, to help guide treatments in the future, and to anticipate the impact of mitigating measures [35]. Israel and India have announced similar projects. The other countries are following the same strategy. The results that we presented here serve as a proof of concept to demonstrate the utility of large-scale viral genome sequencing during a novel pathogen outbreak. Ramping up sampling in a real-time manner like the UK viral genome sequencing consortium may generate high-resolution maps of who-infected-whom transmission at community level and reveal the subsequent expansion patterns which are especially crucial for the most severely stricken countries and regions to promptly develop tailored mitigation plans [36].
Funding sources
This study was self-initiated without any external funding support.
Author contributions
M.M. and Y.C. conceived and initiated the project. Under the guidance of M.M., S.L. and S.G. collected and analyzed the SARS-CoV-2 sequence data, and generated the figures and tables with the help from W.W.. M.M. and Y.C. interpreted and refined the main results. Y.C. wrote the manuscript with critical review from M.M..
Declaration of competing interests
The authors declare no competing interests.
Data availability
The authors declare that all the SARS-Cov-2 FASTA sequence data utilized in the study are available in GISAID database (https://www.gisaid.org/) and Chinese NGDC database (https://bigd.big.ac.cn/ncov?from=groupmessage&isappinstalled=0). The other data supporting the findings of this study are available within the paper and its supplementary information files.
Code availability
All the computer codes used in this study are listed as following, which are commercially available:
MAFFT v7.450 for sequence alignment;
Pheatmap (v1.0.12) R package for unsupervised cluster analysis;
MEGA-X v10.0 for phylogenetic analysis;
TempEst (v1.5.3) for evolutionary rate estimation.
Additional resources
None
Supplemental figure and table titles and legends
Fig. S1. Full pedigree chart of major genotypes and subsequent genotypes from the 4013 SARS-CoV-2 genomes (as of 7 April 2020).
Table S1.1. Summary of the mutations identified from the 4013 SARS-CoV-2 genomes (as of 7 April 2020). Related to Fig. 2.
Table S1.2. Summary of the 4013 SARS-CoV-2 genomes included in the study (as of 7 April 2020). Related to Fig. 2.
Table S2. Summary of 5139 virus genomes sampled between December 2019 and September 2020 in GISAID global analysis.
Comparison of SOO classification and GISAID phylogenetic clades.
Table S4. Summary of the mutations identified from the 261,349 SARS-CoV-2 genomes (as of 25 December 2020).
Table S5. Summary of the 100 most abundant mutations identified from the 261,349 SARS-CoV-2 genomes (as of 25 December 2020). Related to Fig. 6.
Table S6. Summary of 92 SARS-CoV-2 genomes with the ancestral type (as of 25 December 2020).
Acknowledgements
We first would like to express our gratitude to the GISAID database and the NGDC database for collecting and sharing the SARS-CoV-2 sequence data. We also thank all the medical and research institutions from all over the world that promptly submitted the SARS-CoV-2 sequences to the aforementioned databases. We thank Dr. Shuyu Li for helpful comments on the manuscript.
Footnotes
References


