

Abstract
The quality control system for messenger RNA is fundamental for cellular activities in eukaryotes. To elucidate the molecular mechanism of 3’-Phosphoinositide-Dependent Protein Kinase1 (PDK1), an essential regulator throughout growth and development of eukaryotes, a forward genetic approach was employed to screen for suppressors of the loss-of-function T-DNA insertional pdk1.1 pdk1.2 double mutant in Arabidopsis. Notably, the severe growth attenuation of pdk1.1 pdk1.2 is rescued by sop21 (suppressor of pdk1.1 pdk1.2) that harbours a loss-of-function mutation in PELOTA1 (PEL1). PEL1 is a homologue of mammalian PELOTA and yeast DOM34, which form a heterodimeric complex with the GTPase HBS1, responsible for ribosome rescue to assure the quality and fidelity of mRNA molecules. Genetic analysis further reveals that the dysfunction of PEL1-HBS complex fails to degrade the T-DNA-disrupted, truncated but functional PDK1 transcripts, thus rescuing pdk1.1 pdk1.2. Our studies demonstrate the functionality and identify the essential functions of a homologous PELOTA-HBS1 complex in higher plant, and provide novel insights into the mRNA quality control mechanism.
Introduction
Living organisms need to monitor both the quantity and the quality of biomolecules, such as nucleic acids and proteins, to accomplish various life activities. Protein quality control is ensured by multi-level regulations both translationally and post-translationally, of which, the messenger RNA (mRNA) quality is essential for the biosynthesis of correct corresponding proteins. The quality and fidelity of mRNAs are monitored by cells autonomously, and aberrant mRNAs need to be recognised by intrinsic molecular machineries, to release stalled ribosomes and get degraded themselves (1). According to current understandings, there are at least three different mechanisms for mRNA degradation: nonsense-mediated decay (NMD), no-stop decay (NSD), and no-go decay (NGD). NMD and NSD target mRNAs with premature stop codon (terminated too soon) and lacking stop codon (failing to terminate) respectively. In mammalian cells and yeasts, the PELOTA-HBS1 (Dom34p-HBS1p) complex plays an essential role in regulating NSD (2). However, little was known about the mRNA quality control in plants so far.
3’-Phosphoinositide-Dependent Protein Kinase1 (PDK1) is conserved in eukaryotes and plays important roles in regulating growth and development in various organisms. As a key member of the cAMP-dependent protein kinase A / protein kinase G / protein kinase C (AGC) kinase family (3), PDK1 is important for the activation of many AGC kinases and other substrates / regulators. Studies have revealed that PDK1 plays crucial roles in the signalling pathways activated by growth factors and hormones, sustains and regulates the balance between cell growth, division and apoptosis in mammals (3-5), thus being critical for normal development. However, loss-of-function mutant pdk1 in various species such as yeasts (6, 7), Drosophila (8) and mice (9), is lethal, which makes it challenging to study the downstream regulations, and functional mechanism of PDK1 is still not completely understood yet.
Differently from those of mammals, loss-of-function or knock-down pdk1 mutant plants are viable, despite exhibiting severe developmental defects, including rice (10), Arabidopsis (11–13) and moss (14). Therefore, it provides a plausible approach to further identify genetic interactors of PDK1. There are two PDK1 paralogues in Arabidopsis, PDK1.1 and PDK1.2, which have redundant functions (12, 15). PDK1 binds to phospholipids, which regulate its activity as well as its subcellular localization (12, 16, 17). As a master regulator of the AGC family, PDK1 was proposed to participate in various growth and developmental processes though phosphorylating distinct kinase substrates (12, 18). For example, PDK1.1 regulates root hair development through phosphorylating OXIDATIVE SIGNAL INDUCIBLE1 (OXI1)/AGC2-1 kinase (19, 20). PINOID (PID), an essential regulator of PIN FORMED (PIN) auxin efflux carriers, was phosphorylated by PDK1 and thus being activated in vitro (21, 22). Recently, characterization of the fully knock-out pdk1.1 pdk1.2 double mutant, uncovers the important role of plant PDK1. Both PDK1.1 and PDK1.2 are expressed in vascular tissues, and show a predominant localization at the basal side of cell plasma membrane (PM) as well as at cytoplasm in root stele. Notably, the pdk1.1 pdk1.2 double mutant has pleotropic defects throughout growth and development, revealing an essential function of PDK1 in divergent life activities (12, 13). Importantly, the basal localization of PDK1 dominants the role of these AGC kinases with the same subcellular distribution, including D6 Protein Kinase (D6PK) / D6 Protein Kinase Likes (D6PKLs) (23) and PROTEIN KINASE ASSOCIATED WITH BRX (PAX) (24), and thus participate in the regulation of polar auxin transport (12, 13, 15).
To further identify regulators involved in the PDK1 pathway, a forward genetic approach was employed. Using an EMS population of Arabidopsis pdk1.1 pdk1.2 double mutant that displays severe growth defects, a suppressor screening was performed. In this study, characterization of the identified mutant, sop21 (suppressor of pdk1.1 pdk1.2), reveals that deficiency of translational mRNA surveillance PELOTA-HBS1 complex rescues the defective phenotype of pdk1.1 pdk1.2. Our studies demonstrate the functionality of a homologous PELOTA-HBS1 complex in higher plants and provide informative clues on the control of mRNA surveillance and thus protein homeostasis.
Results
Deficiency of PEL1 suppresses the defective growth of Arabidopsis pdk1.1 pdk1.2
PDK1 is well known as a master regulator of AGC family in eukaryotic kingdom. Two PDK1 paralogous genes in Arabidopsis thaliana, PDK1.1 (AT5G04510) and PDK1.2 (AT3G10540) (11, 12, 14), exhibit overlapping and widespread expression pattern in various tissues (Supplementary Fig. 1). The pdk1 single loss-of-function mutants, pdk1.1-2 and pdk1.2-4 (hereafter as pdk1.1 and pdk1.2 respectively), displayed no obvious growth phenotype (12), whereas, the double mutant pdk1.1 pdk1.2 exhibits a range of developmental defects (Fig. 1, and Supplementary Fig. 2), including suppressed growth (smaller leaves and shorter siliques), reduced axillary shoots, suppressed primary root elongation and lateral root initiation, particularly significantly decreased fertility, and abnormal floral development (12). This is consistent with the crucial roles of PDK1 in other organisms and confirms the essential role of PDK1 in regulating plant growth and development. Several aspects of those developmental defects can be explained by known AGC kinases, such as D6PK (12), PAX (13), and AGC1.5/7 (13, 25). However, whether there are additional components in the PDK1 pathway, other than AGC kinases, remains unclear.
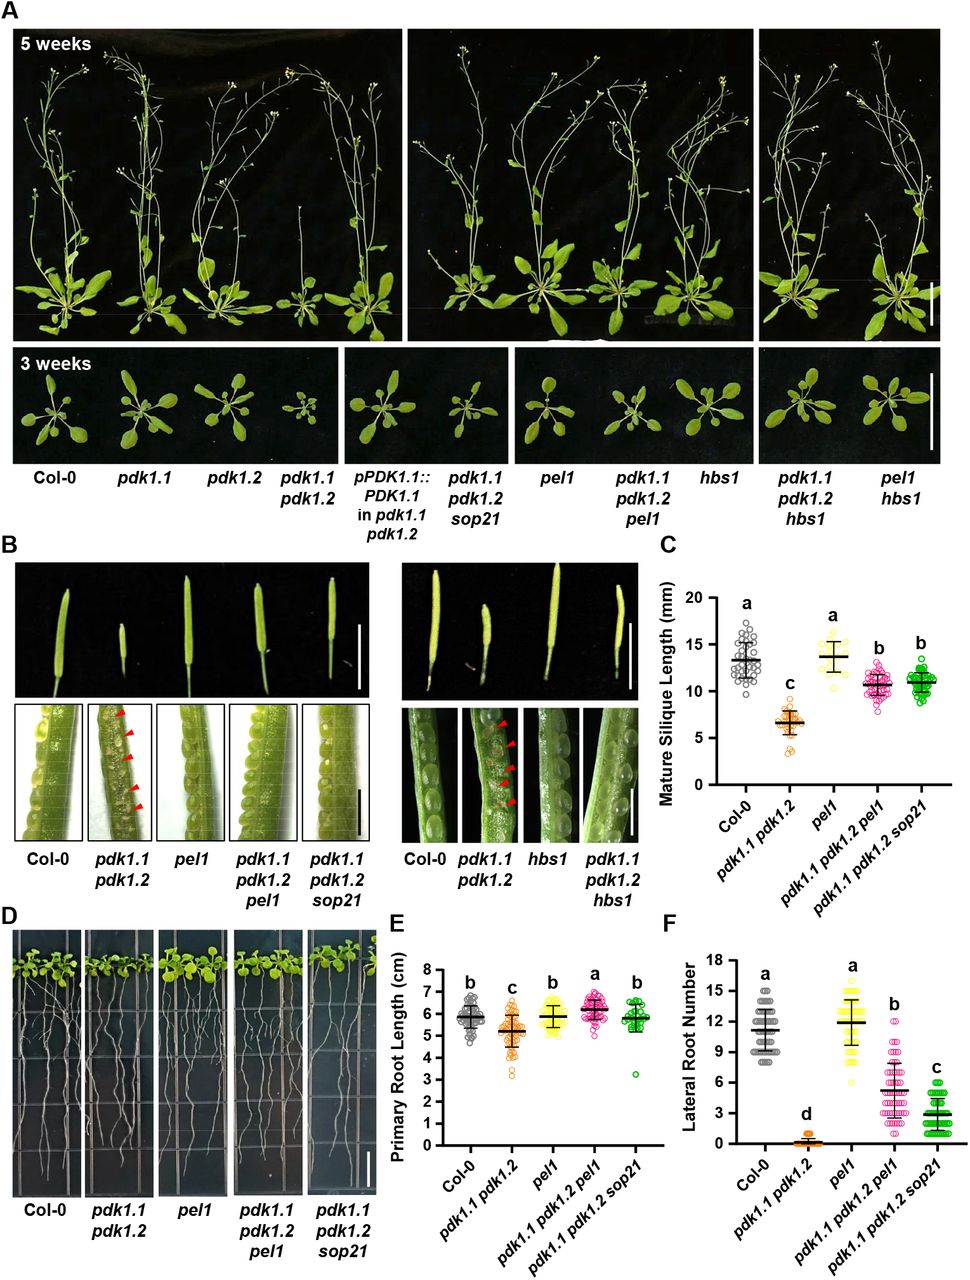
A. The sop21 mutation or loss of function of PEL1 or HBS1 suppresses the growth defect of pdk1.1 pdk1.2, including the reduced growth and delayed bolting. 3- or 5-week-old Col-0, pdk1.1 pdk1.2, pdk1.1 pdk1.2 pel1, pdk1.1 pdk1.2 sop21 (pdk1.1 pdk1.2 pel1W27*), pdk1.1 pdk1.2 hbs1 and various mutant plants are shown. Scale bar, 5 cm. b. Short siliques and low setting rate, Scale bars, 2 cm (upper) or 1 mm (lower), defective/abnormal seeds of pdk1.1 pdk1.2 are highlighted.
B. Quantification of the silique length. n = 37, 36, 17, 54, and 51, respectively. Different letters represent significant difference, P < 0.05, by one-way analysis of variance (ANOVA) with a Tukey multiple comparison test.
C. Defective root elongation and lateral root formation, 2-week-old seedlings, Scale bar, 1 cm). Representative images are shown.
D. Length of primary root and number of emerged lateral roots of 2-week-old seedlings were calculated. Data are presented as means ± SD (n > 30). n = 56, 65, 52, 62, and 30, respectively. Different letters represent significant difference, P < 0.05, by one-way analysis of variance (ANOVA) with a Tukey multiple comparison test.
E. Number of emerged lateral roots of two-week-old seedlings were counted. and statistically analyzed by student’s t-test (**, p < 0.01). Data are presented as means ± SD (n > 30). n = 61, 65, 63, 63, and 52, respectively. Different letters represent significant difference, P < 0.01, by one-way ANOVA with a Tukey multiple comparison test.
To elucidate the underlying mechanism of PDK1 function, a forward genetic screen was performed. Seeds of pdk1.1 pdk1.2 were used to generate a mutant population by Ethyl methanesulfonate (EMS) mutagenesis and suppressors of pdk1.1 pdk1.2 (sop, suppressor of pdk1.1 pdk1.2) were screened based on the rescued growth (26). More than 10 suppressors were obtained from a M2 population of approximately 80,000 plants, and a recessive mutant, sop21, that showed an obviously rescued growth of pdk1.1 pdk1.2 (Fig. 1 and Supplementary Fig. 2), was characterized first. Compared to a significantly suppressed growth of pdk1.1 pdk1.2 adult plants, the rosette size of pdk1.1 pdk1.2 sop21 is comparable to that of wild type (WT, Fig. 1A and Supplementary Fig. 2D). Similar degree of rescue was also observed for the fertility, silique length, inflorescence morphology and floral development (Fig. 1B, C, and Supplementary Fig. 2E, F). Notably, the lateral root numbers was only partially rescued to approximately 50% of WT, though with a complete rescue of primary root growth (Fig. 1D, E, F).
To identify the causative mutation in sop21, 102 progenies (referred as BC1F2) showing rescue phenotypes were selected from a segregating pool of F2 individuals [102 rescued phenotype: 296 pdk1.1 pdk1.2 phenotype, for 1:3 ratio (χ2=0.084, P>0.75; Chi-square test), which indicated a single recessive causal mutation] and used for DNA extraction and subsequent deep sequencing (27). Systemic analysis revealed that sop21 carried a mutation in PEL1 (AT4G27650) (28), which led to an early stop at amino acid residue 27 (tryptophan to terminator, W27*), resulting in the translationally premature termination (Supplementary Fig. 2A). PEL1 gene is widespread expressed (Supplementary Fig. 3) and cross of a null T-DNA insertional allele pel1 (SALK_124403, also named lesion mimic leaf1-1, lml1-1 (29), Supplementary Fig. 2B, C) with pdk1.1 pdk1.2 also suppressed the growth defects of pdk1.1 pdk1.2 at various aspects (Fig. 1), verifying that suppression of pdk1.1 pdk1.2 phenotype in sop21 was a result of PEL1 deficiency. Though pel1 mutant was previously shown to exhibit a delayed growth rate (29), both sop21 and pel1 mutants grew normally in our hands, perhaps due to different growth conditions. In addition, expression of PEL1-FLAG driven by a CaMV35S promoter in sop21 restored the pdk1.1 pdk1.2 phenotype (Supplementary Fig. 4A, B), confirming that PEL1 deficiency suppressed the growth defects of pdk1.1 pdk1.2. Overexpression of PEL1-FLAG driven by CaMV35S in WT background did not exhibit any obvious phenotype (Supplementary Fig. 4C, D).
Next, we constructed 35S::PEL1-GFP and 35S::mCherry-PEL1 transgenic plants to study the subcellular localization of PEL1. Presence of PEL1-GFP and mCherry-PEL1 in cytoplasm and nucleus was observed (Fig. 2A). The subcellular localization of PEL1 is partially overlapping with that of PDK1.1, which also showed residence at cytoplasm, except for its PM localization (Fig. 2A). Further analysis using tobacco leaves revealed that both mCherry-PEL1 (Fig. 2B) and mCherry-PDK1.1 (Fig. 2C) did not distribute equally in cytoplasm, and indeed they exhibited a similar feature that both proteins localized to certain compartments associated with endoplasmic reticulum (ER).
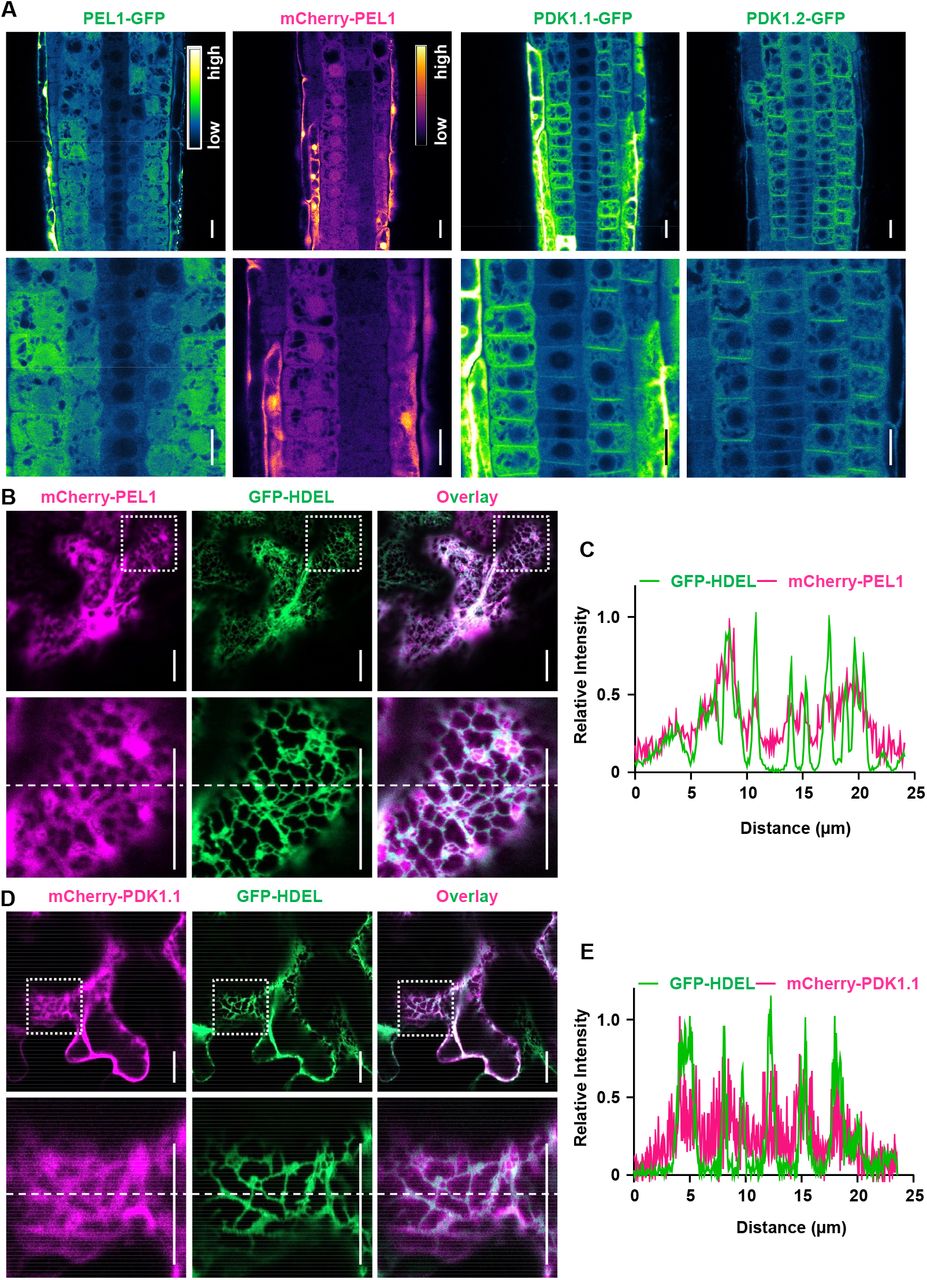
A. Stable transgenic lines revealed that PEL1 localized to the cytoplasm and nucleus, and that PDK1.1-GFP and PDK1.2-GFP resided at PM and cytoplasm. Five-day-old 35S::PEL1-GFP, 35S::mCherry-PEL1, 35S::PDK1.1-GFP and 35S::PDK1.2-GFP seedlings were observed by CLSM. The “Green Fire Blue” LUT was used for GFP, and “mpl-inferno” LUT was used for mCherry, visualizations respectively, based on fluorescence intensity by Fiji. Scale bars, 20 µm.
B-E. Fluorescence observations showed that both PEL1 (b, c) and PDK1.1 (d, e) localized to certain cytoplasm compartments associated with the endoplasmic reticulum (ER). Fusion proteins PEL1-GFP (b, c) and PDK1.1-GFP (d, e) were transiently expressed with ER-specific GFP-HDEL proteins in tobacco leaves. Samples were observed 48 hours after infiltration. Scale bars, 20 μm. Lower panels are enlarged view of the squared region of the upper panels. The position for quantification (right panels) was indicated with dashed lines across the images.
Presence of the mRNA surveillance complex PELOTA-HBS1 in Arabidopsis
Translation of aberrant mRNAs leads to stalling of translational machinery, and arrested ribosomes are specifically recognized by the PELOTA-HBS1 complex to initiate their recycling (1, 2, 30, 31). Mammalian and yeast PELOTA/DOM34 interacts with the HBS1 GTPase, a translation elongation factor EF1A/initiation factor IF2γ family protein, to form a heterodimer and bind to stalled ribosomes, ultimately leading to ribosome rescue. Besides, HBS1 (also called SKI7) is also involved in post-transcriptional gene silencing (28, 32). Homologous analysis in Arabidopsis genome by using yeast and human HBS1 identified two candidate HBS1 homologues, AT5G10630 and AT1G18070 (Table S1. Sequence alignment analysis showed that only AT5G10630 had the conserved HBS1_C domain, indicating that AT5G10630 (designated as AtHBS1, HBS1) is the HBS1 homologue in Arabidopsis (Supplementary Fig. 5). Considering that HBS1 functions in the same pathway as PELOTA(28), which is then chosen for further investigations. Indeed, analysis through yeast two-hybrid (Fig. 3A), bimolecular fluorescence complementation (BiFC, Fig. 3B) and GST pull-down assays (Fig. 3C) revealed the PEL1-HBS1 interactions both in vivo and in vitro, confirming the presence of a homologous PELOTA-HBS1 complex in higher plants. In addition, a recent study characterizing the roles of PELOTA and HBS1 in nonstop mRNA decay (28) further supports the presence of a functional PELOTA-HBS1 complex in Arabidopsis.

A-B. Yeast two-hybrid (A) and bimolecular fluorescence complementation (BiFC, B) analysis reveals the interactions of PEL1 with HBS1. PEL1 and HBS1 was fused to GAL4 DNA-binding domain (BD) or activation domain (AD) respectively. Protein interaction was examined on synthetic dropout (-Leu/-Trp/-His) medium supplemented with 0.5 mg/ml X-α-Gal or synthetic dropout (-Leu/-Trp/-His-Ade) medium. For BiFC analysis, PEL1-nYFP or HBS1-cYFP fusion proteins were transiently expressed in N. benthamiana leaves through infiltration and observed. Scale bars, 50 µm.
C. GST pull-down analysis reveals the interactions of PEL1 with HBS1. GST and GST-HBS1 fusion protein were used as baits, and 6XHis-PEL1 fusion protein was used as prey. Pulled-down fractions were analyzed by Western blot using anti-His and anti-GST antibodies.
Similarly as PEL1 and PDK1s, HBS1 gene was ubiquitously expressed (Supplementary Fig. 6A) and a knock-down mutant of HBS1, hbs1, (Supplementary Fig. 6B-D) also suppressed the pdk1.1 pdk1.2 phenotypes (Fig. 1A, B), indicating that deficiency of the translational mRNA surveillance complex PELOTA-HBS1 led to the suppression of pdk1.1 pdk1.2 phenotypes. These observations suggest that the PELOTA-HBS1 complex might function via a common mechanism.
PELOTA-HBS complex regulates the proper expression of truncated PDK1 transcripts
The pdk1.1-2 and pdk1.2-4 alleles we used contained T-DNA insertions close to their 3’-ends. It has been shown by Xiao and Offringa that such alleles are likely to lead to the production of a functional truncated protein. Therefore, in the same publication this was proposed to explain the lack of strong phenotypes for double mutant combinations pdk1.1-2 pdk1.2-2 and pdk1.1-2 pdk1.2-3 in previous studies (11, 33). It is unlikely that this is the case, as both recent studies by Tan et al. (12) and Xiao and Offringa (13) reported highly similar phenotypes for different allele combinations. Further comparisons confirmed that the pdk1.1 pdk1.2 combination used in this study (pdk1.1-2 pdk1.2-4) as well as double mutants generated with pdk1.1-2 and other pdk1.2 T-DNA alleles recapitulated the phenotype of double mutant combinations with the CRISPR alleles pdk1.1-13 or pdk1.1-14 reported by Tan et al. (12) and Xiao and Offringa (13) (Supplementary Fig. 7A,B). We speculate that previous failures to observe strong growth and development defects in pdk1.1-2 pdk1.2-2 or pdk1.1-2 pdk1.2-3 double mutant lines (11, 33) are most likely due to a failure to achieve true double homozygous plants. Interestingly, we also noted that our pdk1.1 pdk1.2 plants are larger than the other five double mutant combinations, confirming that still a low level of functional PDK1 is produced in these plants.
Interestingly, it was also noted that pdk1.1 pdk1.2 plants are larger than other double mutant combinations, suggesting the remaining function of PDKs. RT-qPCR analysis revealed that there was no detectable expression for both PDK1.1 and PDK1.2 in pdk1.1 pdk1.2 backgrounds, with the primers across T-DNA insertions (Fig. 2D, E), ruling out the possibility of existing full-length PDK1.1 or PDK1.2 transcripts. Nonetheless, increased truncated transcript levels of PDK1.1 and PDK1.2 were detected in pdk1.1 pdk1.2 sop21, pdk1.1 pdk1.2 pel1 or pdk1.1 pdk1.2 hbs1 (to approximately 50% and 90% of Col-0 respectively), compared to that in pdk1.1 pdk1.2 (10% and 25% of Col-0 for PDK1.1 and PDK1.2 respectively), with primers amplifying the fragments before T-DNA insertions (Fig. 2F, G). This was further confirmed by semi-quantitative PCR (Supplementary Fig. 8A). The PELOTA-HBS1 complex is responsible for the release of arrested ribosomes during the translation of aberrant mRNAs, so called “mRNA surveillance” (28). Given that T-DNA insertions at 3’-end might lead to aberrant PDK1.1 and PDK1.2 transcripts fused with certain T-DNA fragments but without a proper stop codon, it is not surprising to detect only 10% and 25% of PDK1.1 and PDK1.2 5’-fragments in pdk1.1 pdk1.2. Consistently, there was an increase of their expression in pdk1.1 pdk1.2 sop21, pdk1.1 pdk1.2 pel1 or pdk1.1 pdk1.2 hbs1 plants. The above observations led us to test whether the increased levels of truncated PDK1.1 or PDK1.2 could explain for the rescue of pdk1.1 pdk1.2.
By transforming a mCherry-fused PDK1.1N (1-480 aa) (12) driven by pPDK1.1 promoter into pdk1.1 pdk1.2, a partial rescue was observed (Fig. 2H). In addition, overexpression of Venus-PDK1.1N or Venus-PDK1.2N driven by a CaMV35S promoter completely rescued the phenotype of pdk1.1 pdk1.2 (Supplementary Fig. 8B). Therefore, we conclude that the pel1 and hbs1 mutations might rescue the phenotype of pdk1.1 pdk1.2 via disrupting the function of PELOTA-HBS1 mRNA surveillance complex and thus upregulating the N-terminal truncated proteins of PDK1.1 and PDK1.2, which preserves a functional kinase activity (13).
PDK1 regulates development and stress responses through coordinating multiple metabolic pathways
The PELOTA-HBS1 complex regulates the mRNA quality control by rescuing stalled ribosomes during protein biosynthesis (28). PDK1 is also an essential regulator of protein translation, via modulating the activity of ribosome RPS6 proteins through S6K AGC kinase (34). We therefore performed a proteomic analysis to study their functions at the whole proteome level. First, being consistent, subcellular localization analysis by transiently expressing YFP- or GFP-fused proteins in Arabidopsis leaf protoplasts and tobacco leaves clearly showed that PDK1, PEL1 and HBS1 proteins located at plasma membrane (PM), cytoplasm and certain ER associated compartments at cytoplasm (Fig. 2B; Supplementary Fig. 9). In addition, PEL1-YFP exhibits nuclear distribution as well, which was undetectable for PDK1s and HBS1 (Fig. 2A; Supplementary Fig. 9A, B). We speculate that these proteins might present differential functions beyond the potential common pathways.
A tandem mass tag (TMT)-based comparative proteomics analysis was then performed using shoots and roots of two-week-old seedlings, and 6995 and 8137 proteins were quantified in shoots and roots respectively. We studied shoots and roots separately, because they might have totally different proteomes. Of the identified proteins, 54 and 49 proteins in shoots or roots respectively (one protein in both shoots and roots, Fig. 5A) were significantly changed in pdk1.1 pdk1.2, while rescued (no significant difference from WT) in pdk1.1 pdk1.2 pel1. These changed proteins were designated as RCE (restored commonly expressed) proteins and were speculated being responsible for the defective growth of pdk1.1 pdk1.2. Most RCE proteins showed increased levels (84 of 102 proteins) in pdk1.1 pdk1.2, suggesting that PDK1 deficiency led to the enhanced recycling of ribosomes and hence the increased abundance of RCE proteins, further confirming that PDK1-mediated regulation of PELOTA-HBS1 complex is crucial to maintain the normal recycling of ribosomes and protein synthesis.

A-B. RT-qPCR analysis with primers across T-DNA insertions revealed that the integrity of PDK1.1 and PDK1.2 full-length CDS was disrupted by the T-DNA insertions in pdk1.1 pdk1.2, pdk1.1 pdk1.2 sop21, pdk1.1 pdk1.2 pel1 and pdk1.1 pdk1.2 hbs1, respectively. ACTIN7 gene was amplified and used as an internal control. Experiments were biologically repeated 3 times and data are presented as means ± SD. n = 3. Different letters represent significant difference, P < 0.05, by one-way ANOVA with a Tukey multiple comparison test.
C-D. RT-qPCR analysis with primers in front of T-DNA insertions revealed that N-terminal fragments of PDK1.1 and PDK1.2 transcripts (PDK1.1N and PDK1.2N) exhibited increased levels in pdk1.1 pdk1.2 sop21, pdk1.1 pdk1.2 pel1 and pdk1.1 pdk1.2 hbs1, respectively, compared to that in pdk1.1 pdk1.2. ACTIN7 gene was used as an internal control. Experiments were biologically repeated 3 times and data are presented as means ± SD. n = 3. Different letters represent significant difference, P < 0.05, by one-way ANOVA with a Tukey multiple comparison test.
E. Native promoter-driven expression of PDK1 N-terminal fragment partially rescued the growth defects of pdk1.1 pdk1.2. A representative photo of 20-day-old Col-0, pdk1.1 pdk1.2, and pPDK1.1::mCherry-PDK1.1N (in pdk1.1 pdk1.2) plants grown in soil are shown. Scale bar, 2 cm.
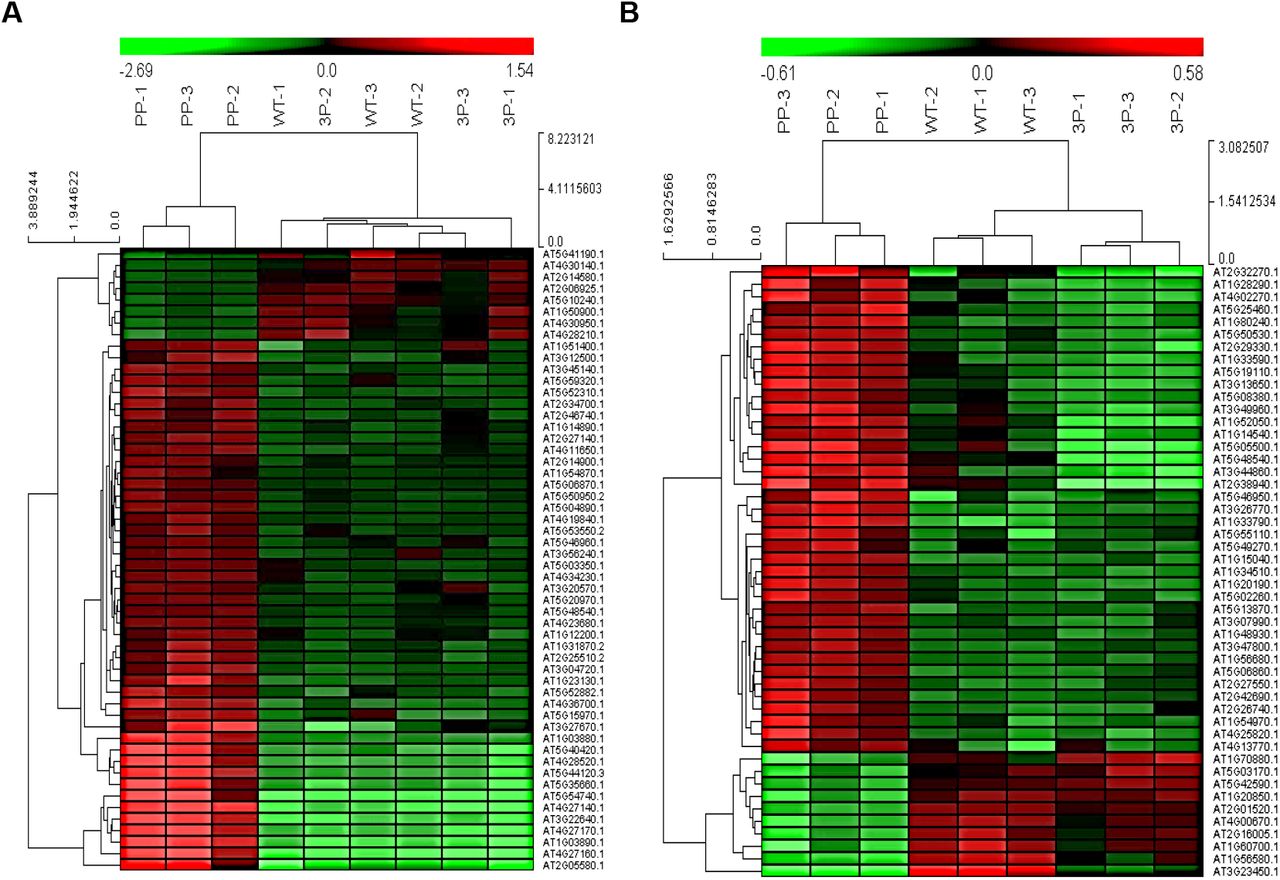
Heat map displayed the abundance of 54 RCEs (restored CE proteins) in shoots (A) and 49 RCEs in roots (B) of wild type Col-0, pdk1.1 pdk1.2 and pdk1.1 pdk1.2 pel1. “PP” refers to pdk1.1 pdk1.2 double mutant and “3P” refers to pdk1.1 pdk1.2 pel1 triple mutant. Three independent samples of WT (WT-1, 2, 3), pdk1.1 pdk1.2 (PP-1, 2, 3) and pdk1.1 pdk1.2 pel1 (3P-1, 2, 3) were collected and analyzed. Heat maps were generated using log2-transformed TMT values. Relative expression of the analyzed proteins was used to perform the hierarchical clustering analysis using Cluster3.0 (http://bonsai.hgc.jp/~mdehoon/software/cluster/software.htm) and Java Treeview software (http://jtreeview.sourceforge.net).
KEGG analysis of RCE proteins revealed the enriched metabolic pathways including lipids, carbohydrates, phenylpropanoid and amino acids, and involvement in multiple developmental processes and environmental adaptation (Table 1), which was consistent with the general growth defects of pdk1.1 pdk1.2. A nitrogen-regulated glutamine amidotransferase GAT 1_2.1 that represses shoot branching (35) increased in pdk1.1 pdk1.2, which is consistent with the solitary stem phenotype of pdk1.1 pdk1.2. Furthermore, increased DUF 642 family proteins DGR1 and DGR2 (36) and several root-hair-related proteins including SRPP (37), PRPL1 (38), GH9C1 (39), DER9 (40) and AGC2-1 (41) (a known PDK1 substrate) may account for the altered root development.
Proteins were functionally categorized by KEGG pathway analysis and previous studies. In, increased; De, decreased.
A large number of pathogen-induced defense-related or systemic acquired resistance (SAR)-related proteins (42-50) accumulated in pdk1.1 pdk1.2 (Table 1). Meanwhile, some abiotic stress-related proteins, especially cold acclimation/responsive proteins (51-54) significantly increased in pdk1.1 pdk1.2 shoots. This is consistent with the previous studies showing that PDK1 positively regulates basal resistance in rice (10) and PDK1 is required for P. indica-induced growth promotion (11), and the rice PELOTA protein is involved in bacterial leaf blight resistance (55).
Notably, the TMT-based comparative proteomics analysis also showed that PEL1 and HBS1 presented unchanged protein abundance in pdk1.1 pdk1.2 (Supplementary Fig. 10A, B). Next, we examined these known PDK1 substrates from the AGC family. Notably, there is an increase of D6PK protein, an essential downstream component of PDK1 (12), in pdk1.1 pdk1.2, but a relatively lower level of D6PK in pdk1.1 pdk1.2 pel1 (Supplementary Fig. 11A). No dramatic changes were found for other detected AGC proteins in the proteomics data (Supplementary Fig. 11A, B). Therefore, it is very unlikely that changes of these AGC substrates might account for the rescue of pdk1.1 pdk1.2 by the pel1 mutation.
Discussion
PDK1 is highly conserved in eukaryotes and is essential for growth and development of various organisms. PDK1 deficiency results in severe growth defects or even lethality, which have impeded the studies on the underlying molecular mechanism, especially in mammals. Taking advantage of plant genetics and by screening for the suppressors that rescue the growth defects of T-DNA insertional pdk1.1 pdk1.2 mutants, we here identify PEL1, which is a component of the PEL1-HBS1 mRNA surveillance complex and is essential for the mRNA quality control during protein translation. The mechanism for the pel1 and hbs1 mutations suppressing the pdk1.1 pdk1.2 phenotype is their inability to degrade the aberrant mRNAs, leading to the production of truncated but functional PDK1 proteins (Fig. 5A, B). Our studies reveal that the PEL1-HBS1 complex coordinates the ribosome rescue and protein biosynthesis (Fig. 6A)

A. The PEL1-HBS1 complex regulates 80S ribosomes through translational surveillance to maintain the normal protein translation and plant growth. In the case of truncated PDK1 transcripts in pdk1.1 pdk1.2, this complex could degrade these mRNAs without stop codon, thus promoting the recycling of stalled 80S ribosomes. A-site, ribosomal site most frequently occupied by aminoacyl-tRNA, which functions as acceptor for growing protein during peptide bond formation; P-site, ribosomal site most frequently occupied by peptidyl-tRNA, the tRNA carrying the chain of growing peptide; E-site, ribosomal site harbouring decylated tRNA on transit out from ribosome.
B. A proposed model showing sop21 mutation rescuing the defects of pdk1.1 pdk1.2: 1) In WT, the PDK1 transcripts have the stop codon, and it can be translated into 100% of PDK1 protein. 2) In the pdk1.1 pdk1.2 T-DNA mutants, aberrant transcripts with fusion to partial T-DNA fragment will be recognized by the PEL1-HBS1 complex and thus get degraded, exhibiting PDK1 loss-of-function mutant defects. 3) The sop21 mutations leads to the inefficient degradation of aberrant transcripts, which produce enough truncated PDK1 protein, maintaining normal growth of pdk1.1 pdk1.2 plants.
PEL1-HBS1 complex plays important roles in the mRNA quality control. Our study is a typical example how this mRNA surveillance system regulates the stability of aberrant transcripts. Intriguingly, loss of function of DOM34 or PELOTA causes mitotic arrest in yeast and Drosophila and the pelota mutant mouse is lethal (57), whereas the Arabidopsis mutants sop21, pel1, and hbs1 are viable, suggesting the different regulatory modes for protein translational regulation. Though the pdk1.1 pdk1.2 double mutant exhibits pleiotropic defects throughout growth and development, the mutant can complete a life cycle (12). It is speculated that the difference might be related to the high postembryonic developmental plasticity in plants compared with animals, owing to the sessile life style during evolution.
Proteomics analysis indicates that the PEL1-HBS1 complex and PDK1 play pivotal roles in modulating the activity of the protein synthesis machinery under normal conditions. Notably, >80% RCE proteins are with increased abundances, and few decreased RCE proteins may due to the indirect/feedback regulation. The changed levels of most RCE proteins in pdk1.1 pdk1.2 is reversed by the pel1 mutation, suggesting a rescue at the whole proteome level. Given the lipid binding property of PDK1 and the localizations of PDK1 at PM, cytoplasm and certain ER-associated compartments, the pathway proposed here might be responsive to lipid dynamics at the membrane. Further characterization of the exact role of lipids in this process will help to elucidate the molecular mechanistic framework underlying the control of cell growth. In animals, PDK1 can phosphorylate one AGC kinase, AKT (aka Protein Kinase B, PKB) and S6K, to regulate protein biosynthesis through modulating 40S ribosomal protein 6S-A (RPS6A) and B (RPS6B), two subunits of ribosomes (8, 34). There are also two S6K homologues in Arabidopsis, previously reported to regulate protein synthesis via RPS6A/B (58). However, whether these two S6Ks are regulated by PDK1 requires further investigation.
pdk1.1 pdk1.2 exhibits pleotropic growth and developmental defects, including significantly reduced fertility, which may be due to the changed levels of embryonic development-related proteins EMB 1923, RESURRECTION1 (RST1) (32, 59–61) and YELLOW STRIPE-LIKE3 (YSL3) (62). Notably, RST1 is a crucial regulator for RNA metabolism and thus the post-transcriptional gene silencing pathway (32, 60). Together with the previous biochemical evidence showing that RST1 forms a complex with HBS1 (SKI7) involved in post-transcriptional gene silencing (32), we speculated that the change of RST1 protein levels might be due to the altered status of HBS1 protein in pdk1.1 pdk1.2. We speculate that the increase level of RST1 might function as a compensation mechanism for the overall accelerated protein synthesis in pdk1.1 pdk1.2. Moreover, RST1 was recently identified as a regulator of the vacuolar protein degradation pathway (61), implying a role of PDK1 in the endomembrane trafficking process. Interestingly, precursors of two major storage proteins, 2S albumin and 12S globulin (63, 64) (Table 1) are significantly accumulated in pdk1.1 pdk1.2 shoots. Likewise, a number of nutrient reserve-related proteins including lipid transfer protein LTP3 (54), lipoxygenase protein LOX2 (65), oleosin OLE2 (66) and seed-specific protein AT2G05580 (67) exhibited the same change in pdk1.1 pdk1.2. Storage proteins are actively synthesised at rough ER as precursor forms and then are transported into protein storage vacuole (PSV) during seed maturation (68). In higher plants, seed storage proteins are deposited in PSVs of dry seeds as a source of nitrogen for growth after seed germination (68, 69). Accumulation of seed storage proteins and nutrient reserve-related proteins in pdk1.1 pdk1.2 shoots may result in the altered vegetative growth. This indicates that PDK1 represses seed storage proteins and nutrient reserve-related proteins in the vegetative tissues or the nitrogen utilization after seed germination.
It is noteworthy that the pdk1.1 pdk1.2 phenotype is not fully rescued by pel1 mutations, or by a truncated PDK1.1N transgene. We speculate that the truncated PDK1 protein only keeps partial functionality. Meanwhile, PDK1 may also regulate specific life activities through phosphorylating distinct substrates, including those well-characterised AGC kinases as well as possible others (12, 18). How these downstream pathways coordinate with each other, special-temporally, needs further investigation.
Materials and Methods
Materials and growth conditions
Arabidopsis thaliana lines used in this study were all in ecotype Columbia (Col-0) background. Seeds of Col-0 and various mutants, transgenic lines were germinated on MS (Murashige and Skoog, Duchefa) medium after two days’ stratification at 4C. Seedlings and plants were grown in a phytotron at 22°C with a 16-h light / 8-h dark photoperiod. Root growth measurements were performed using 14-day-old seedlings grown on MS.
Mutant lines pdk1.1-2 (pdk1.1, SALK_113251C) (12), pdk1.2-4 (pdk1.2, SALK_017433) (12), pel1 (pel1, SALK_124403C), and hbs1 (hbs1, CS857798) were obtained from ABRC (70) (Arabidopsis Biological Resource Centre) and were genotyped by using corresponding LB, RP and LP primers (Supplementary Table 2). pPDK1.1::GUS and pPDK1.2::GUS were reported previously (12). The floral dip method (71) was used for plant transformation.
Reverse transcription-quantitative real-time RT-PCR (RT-qPCR) analysis
Total RNA was extracted from seedlings using TRIzolR reagent (Invitrogen), incubated with DNAase (TAKARA) and reverse transcribed (TAKARA). Transcription of corresponding genes and ACTIN7 was analysed using SYBR Premix Ex Taq (TAKARA) with a BIO-RAD CFX Connect Real-Time System. Relative expression of examined genes was calculated by setting the gene expression level of wild type as “1” and was presented as average ± standard deviation (SD) from three independent biological replicates.
Promoter::β-glucuronidase (GUS) staining for expression pattern analysis
pPDK1.1::GUS and pPDK1.2::GUS transgenic lines were reported previously (12), and pPEL1::GUS and pHBS1::GUS lines were cloned with a modified pCambia1300 binary vector (72) using primers listed in Supplementary Table 2. Stable transgenic lines were stained at 37°C for 1 h, in GUS solution [0.5 mg/mL 5-bromo-4-chloro-3-indolyl-β-d-glucuronic acid (X-Gluc), 0.5 mM potassium ferricyanide (K4[Fe(CN)6]·3H2O), 0.5 mM potassium ferrocyanide (K3[Fe(CN)6]), 0.1% (v/v) Triton X-100, 10 mM ethylenediaminetetraacetic acid (EDTA) and 0.1 M sodium phosphate (NaH2PO4); pH 7.0] (12). Three independent lines were analysed in detail for different tissues and stages, and they all showed similar expression patterns. Samples were imaged by a stereomicroscope (Nikon SMZ1500).
Yeast two-hybrid (Y2H) assay
Y2H assays were performed as reported previously (73). Coding sequences of PEL1, PEL1T43A and PEL1T43E were amplified by PCR with PEL1-F (BamHI)-3 and PEL1-R (BamHI) primers, and were then subcloned into the pGBKT7 vector (Clontech). Coding sequences of HBS1 [using primers HBS1-F (EcoRI) and HBS1-R (BamHI)] and HBS1 [using primers HBS1-2-F (NdeI) and HBS1-2-R (BamHI)] were amplified and subcloned into pGADT7 vectors (Clontech). Bait and prey plasmids were co-transformed into the yeast strain AH109 according to the manufacture’s introduction (Clontech). Transformants were selected on SD (-Leu/-Trp) solid medium. For auxotroph assays, four individual colonies were cultured in liquid SD (-Leu/-Trp) medium overnight, and approximately 10 µL of each sample at different dilutions (as indicated in the figure legends) was dropped on SD (-Leu/-Trp/-His) medium supplemented with 0.5 mg/mL X-α-Gal or on SD (-Leu/-Trp/-His/-Ade) medium, respectively, with 1 mM 3-amino-1,2,4-triazole (3-AT), and grown at 30°C for 3 days. Colonies showing continuous growth with a blue colour represented interactions.
Bimolecular fluorescence complementation (BiFC) assay
For BiFC assay, cDNAs encoding PDK1.1, PDK1.2, PEL1 and HBS1 were cloned into the pENTR plasmid with BP reactions. Afterwards, LR reactions were conducted with the 35S::GW-nYFP and 35S::GW-nYFP destination vectors (74), resulting in 35S::PDK1.1-nYFP, 35S::PDK1.1-cYFP, 35S::PDK1.2-nYFP, 35S::PDK1.2-cYFP, 35S::PEL1-nYFP and 35S::HBS1-cYFP, respectively. Resultant constructs with control blank vectors were co-expressed in N. benthamiana leaves and yellow fluorescence was observed by a Leica SP8 confocal laser scanning microscope, using an argon laser excitation wavelength of 488 nm after infiltration for 48 days.
Subcellular localization and co-localization studies
For subcellular localization studies, cDNAs encoding PDK1.1, PDK1.2, PEL1 and HBS1 were first cloned into the pENTR plasmid with BP reactions. Afterwards, LR reactions were conducted with the pGWB605 destination vector, resulting in pGWB605-35S::PDK1.1-GFP, pGWB605-35S::PDK1.2-GFP, pGWB605-35S::PEL1-GFP and pGWB605-35S::HBS1-GFP, respectively. PDK1.1-GFP, PDK1.2-GFP, PEL1-GFP, HBS1-GFP and ER-mCherry (75) fusion proteins were transiently expressed in N. benthamiana leaves (76). For mCherrry fusion studies, PDK1.1 and PEL1 were cloned into the pB7m24GW2 destination vector. 35S::GFP-HDEL was used for the ER reporter. The infiltrated leaves were harvested 2 days after infiltration and observed using an Olympus confocal microscope (Olympus, FV10i). PDK1.1-YFP, PDK1.2-YFP, PEL1-YFP, and HBS1-YFP were cloned into the pA7 plasmid and transiently expressed in leaf protoplasts of wild type, Arabidopsis seedlings expressing ER-mCherry (75), or PIP2-RFP (77). Transformed protoplasts were harvested 12 hours after transformation and observed using an Olympus confocal microscope (Olympus, FV10i).
For 35S::PDK1.1-GFP, 35S::PDK1.2-GFP and 35S::PEL1-GFP transgenic plants, entry vectors were reacted with pB7FWG2,0 plasmids for GFP fusion expression. Transformation was performed with the floral dip method (71) with the Agrobacteria stain GV3101.
Images were captured with following excitation (Ex) and emission (Em) wavelengths (Ex/Em): GFP 488 nm/501-528 nm; /YFP 490 nm/520-550 nm; mCherry/RFP 543 nm/620-630 nm; DAPI 405 nm/437-476 nm.
Protein extraction and Western blot analysis
To examine the protein levels of FLAG- and GFP-tagged proteins, approximately 100 mg of plant tissues were frozen in liquid nitrogen, ground thoroughly, and homogenized in 100 μL protein extraction buffer [20 mM Tris-HCl, pH 7.5, 150 mM NaCl, 0.5% (v/v) Tween-20, 1 mM EDTA, 1 mM DTT] containing a protease inhibitor cocktail (cOmplete, Roche) and a protein phosphatase inhibitor tablet (PhosSTOP, Roche). After addition of SDS loading buffer, the samples were heated at 65°C for 5 min, resolved by 10% (v/v) SDS-PAGE and transferred to PVDF membranes. FLAG-tagged proteins were detected by a mouse anti-FLAG antibody (M20008, 1:2,000, Abmart). GFP-tagged proteins were detected with a mouse anti-GFP antibody (M20004, 1:2,000, Abmart) or a mouse anti-GFP HRP-conjugated antibody (130-091-833, 1:2,000, MACS Molecular). His-tagged proteins were detected by a mouse anti-His antibody (sc-8036, 1:3000, Santa Cruz Biotechnology). GST-tagged proteins were detected by a mouse anti-GST antibody (sc-138, 1:3000, Santa Cruz Biotechnology). Actin was detected by a mouse anti-actin antibody (M20009, 1:2,000, Abmart). HRP activity was detected by the Supersignal Western Detection Reagents (Thermo Scientific). After incubated with a primary mouse antibody, the PVDF membrane was then incubated with a goat anti-mouse immunoglobulin G AP-conjugated secondary antibody (ab97020, 1:5000, Abcam). AP activity was detected by BCIP/NBT kit (Invitrogen) according to the supplier’s instructions.
Protein expression and in vitro kinase assay
Coding regions of PDK1.1, PEL1 and HBS1 were amplified with corresponding primers, and subcloned into vectors pET28a (Novagen) or pGEX-4T-1 (GE Healthcare) respectively. Proteins were recombinantly expressed in Escherichia coli (strain BL21) by supplementing with 1 mM or 0.2 mM isopropyl-β-D-thiogalactopyranoside (IPTG, induced at either 28°C for 3 h or 16°C for 16 h). Fusion proteins with His tag were purified using Ni-NTA His binding resin (Novagen) and those with GST tag was purified by glutathione sepharose (Novagen).
Kinase activity assay was performed according to previous reports(12, 22, 78) with minor modifications. Assay was initiated by adding 1 µg recombinant His-PDK1.1 in a total volume of 40 µL containing 50 mM Tris-HCl, pH 7.5, 5 mM MgCl2, 2 mM CaCl2, 1 mM DTT (1,4-dithiothreitol), 0.1 mM ATP (Adenosine 5’-triphosphate), 5 μCi [γ-32P]ATP (NEC902A; Perkin-Elmer), and 10 µg of substrate (recombinant His-PEL1, His-PEL1T43A, or GST-HBS1). Reactions were incubated at 30°C for 45 min and terminated by adding 2× SDS loading buffer. After boiling for 5 min, the reaction products were fractionated by SDS-PAGE (sodium dodecyl sulfate-polyacrylamide gel electrophoresis), and the radioactivity was collected by a phosphor screen. After 10 hour, the phosphor screen was imaged by autoradiography (Fujifilm FLA 9000 plus DAGE).
A tandem mass tag (TMT)-based comparative proteomics analysis
A tandem mass tag (TMT)-based comparative proteomics analysis is performed according to Thompson’s research (79). Wild type, pdk1.1 pdk1.2, pdk1.1 pdk1.2 pel1 seedlings grow for 14 days on the 1/2MS dishes. One gram shoots (aerial parts) and 0.6 g roots (underground parts) of three genotypes of seedlings were set as group1 and group2 respectively. Experiments were biological repeated for three times.
Samples were frozen in liquid nitrogen and ground homogeneously. 5 times volume of TCA/acetone (1:9) was added to the powder and mixed by vortexing. The mixture was placed at −20°C for 4 h, and centrifuged at 6, 000 g for 40 min at 4°C. The supernatant was discarded. The pre-cooling acetone was added to wash for three times. The pellet was air dried. 30 times volume of SDT buffer was added to 20-30 mg powder, mixed and boiled for 5 min. The lysate was sonicated and then boiled for 15 min. After centrifuged at 14, 000 g for 40 min, the supernatant was filtered with 0.22 µm filters. The filtrate was quantified with the BCA Protein Assay Kit (Bio-Rad, USA). The sample was stored at −80°C.
20 µg of proteins for each sample were mixed with 5× loading buffer respectively and boiled for 5 min. Proteins were separated with 12.5% SDS-PAGE (constant current 14 mA, 90 min) and bands were visualized by Coomassie Blue R-250 staining.
200 μg of proteins for each sample were incorporated into 30 μl SDT buffer (4% SDS, 100 mM DTT, 150 mM Tris-HCl, pH 8.0). The detergent, DTT and other low-molecular-weight components were removed using UA buffer (8 M Urea, 150 mM Tris-HCl pH 8.0) by repeated ultrafiltration (Microcon units, 10 kDa). Then 100 μl iodoacetamide (100 mM IAA in UA buffer) was added to block reduced cysteine residues and the samples were incubated for 30 min in darkness. The filters were washed with 100 μl UA buffer three times and then 100 μl 100 mM TEAB buffer twice. Finally, the protein suspensions were digested with 4 μg trypsin (Promega) in 40 μl TEAB buffer overnight at 37°C, and the resulting peptides were collected as a filtrate. The peptide content was estimated by UV light spectral density at 280 nm using an extinctions coefficient of 1.1 of 0.1% (w/v) solution that was calculated on the basis of the frequency of tryptophan and tyrosine in vertebrate proteins.
100 μg peptide mixture of each sample was labelled using TMT reagent according to the manufacturer’s instructions (Thermo Fisher Scientific) and analysed on an Orbitrap Fusion Lumos (Thermo Scientific) mass spectrometer coupled with Ultimate 3000 RSLC nano system. 4 μl of each fraction was injected for nano LC-MS/MS analysis. The peptide mixture (1 μg) was loaded onto the Acclaim PepMap 100 analytical column (75 μm × 15 cm, C18, 3 μm, Thermo Scientific) in buffer A (0.1% Formic acid) and separated with a linear gradient of buffer B (80% acetonitrile and 0.1% Formic acid) at a flow rate of 300 nl/min. The electrospray voltage of 2.1 kV versus the inlet of the mass spectrometer was used. Mass spectrometer was operated in the data-dependent mode to switch automatically between MS and MS/MS acquisition with a cycle time of 3 second. Survey full-scan MS spectra (m/z 375-1800) were acquired with a mass resolution of 120K, followed by sequential high energy collisional dissociation (HCD) MS/MS scans with a resolution of 50K. In all cases, one microscan was recorded using dynamic exclusion of 40 seconds. For MS/MS, precursor ions were activated using 38% normalized collision energy.
MS/MS spectra were analysed using ProteinDiscoverer− Software 2.1 against TAIR10_pep_20101214 database and decoy database with following parameters. The highest score for a given peptide mass (best match to that predicted in the database) was used to identify parent proteins. Parameters for protein searching were set as follows: tryptic digestion with at most two missed cleavages, carbamidomethylation of cysteines as fixed modification, and oxidation of methionines and protein N-terminal acetylation as variable modifications. Peptide spectral matches were validated based on q values at a 1% false discovery rate (FDR).
Proteins were considered differentially expressed when they displayed significant changes (more than 1.2-fold and Student’s t test, P value < 0.05).
The FASTA protein sequences of differentially changed proteins were blasted against the online Kyoto Encyclopedia of Genes and Genomes (KEGG) database (http://geneontology.org/) to retrieve their KOs and were subsequently mapped to pathways in KEGG. The corresponding KEGG pathways were extracted.
Quantification and statistics
Lateral root numbers were counted directly. For measurements of silique length, primary root length and leaf area, photos were analysed with the Image J program (https://imagej.nih.gov/ij/download.html). Fluorescence intensity of reporter lines was analysed and quantified by Fiji (https://fiji.sc/) (80). Data visualisation and statistics were performed with GraphPad Prism8. Student’s t-test was used for comparing two data sets, and one-way ANOVA was performed for multiple comparisons.
Author contributions
W. K. performed acquisition of most of the data on sop21 as well as analysis and interpretation of data and drafted the article. S. T. generated and analysed various mutant materials, as well as the generation of pdk1.1 pdk1.2 EMS population and marker lines, suppressor screening and subcellular localization analysis. Q. Z. performed the backcross and the NGS analysis. D.-L. L. performed RT-qPCR and semi-quantitative analysis for pel1 crosses. H.-W. X. is responsible for conception and design. Z.-H. X. and J.F. helped design experiments. W.K., S.T., J.F. and H.-W. X. wrote the manuscript, and all authors revised and approved it.
Conflict of Interests
The authors declare no competing financial interests.
Data and materials availability
All data and materials necessary to evaluate the conclusions in paper or supplementary materials are available.
Supplementary Information
Supplementary Figures. 1 to 11
Supplementary Tables. 1 to 2
Legends of Supplementary figures
Supplementary Fig. 1 Expression profiles of PDK1.1 and PDK1.2.
A. Reverse transcription-quantitative PCR (RT-qPCR) analysis reveals the expression of PDK1.1 and PDK1.2 in various tissues. ACTIN7 gene was amplified and used as an internal control. Experiments were biologically repeated 3 times and data are presented as means ± SD (standard derivation). n = 3. Different letters represent significant difference, P < 0.05, by one-way ANOVA with a Tukey multiple comparison test.
B-M. Promoter-reporter gene (GUS) fusion studies show the expression of PDK1.1 in 7-day-old seedlings (B) including shoot apical meristem (SAM, C), cotyledon (D), primary root tip (E), lateral root (J) and floral tissues (mainly in pollens, L); and similar expression pattern of PDK1.2 (F-I, K, M). Scale bars, 2 mm (B, F), 500 μm (D, H, L, M), 200 μm (C, G, E, I) or 100 μm (J, K). Transgenic lines were confirmed and three independent lines were analyzed. Representative images are shown.
Supplementary Fig. 2 Identification of the pel1 mutant.
A. Schematic representation of PEL1 gene and position of T-DNA insertion. Introns, exons and non-coding regions are indicated by lines, black or blank boxes. Positions of primers are indicated.
B. Identification of homozygous pel1 mutant. Genomic DNAs were used as template for PCR amplification and homozygous lines presents a single amplified fragment when using LBa1/PEL1-RP primers.
C. RT-qPCR analysis confirmed the deficient PEL1 expression in pel1. Total RNA of 7-day-old Col-0 and pel1 seedlings was extracted and used for analysis. ACTIN7 gene was amplified and used as an internal control. Experiments were biologically repeated 3 times and data are presented as means ± SD. n = 3. P value was calculated by an unpaired Student’s t-test.
D. Quantification of the rosette area revealed that pel1 mutations partially rescued the phenotype of pdk1.1 pdk1.2. n = 16, 21, 15, 16, and 12, respectively. Different letters represent significant difference, P < 0.05, by one-way analysis of variance (ANOVA) with a Tukey multiple comparison test.
E-F. A representative photo showed that the pel1 mutations partially rescued the inflorescence phenotype of pdk1.1 pdk1.2. Scale bars, 2 cm.
Supplementary Fig. 3 Expression profiles of PEL1.
A. RT-qPCR analysis revealed the PEL1 expression in various tissues. Actin7 gene was amplified and used as an internal control. Experiments were biologically repeated 3 times and data are presented as means ± SD. n = 3. Different letters represent significant difference, P < 0.05, by one-way ANOVA with a Tukey multiple comparison test.
B-G. Promoter-reporter gene (GUS) fusion studies reveals the PEL1 expression in 7-day-old seedlings (B) including primary roots (C), shoots (D) and lateral roots (E), 21-day-old seedlings (F), and floral organs (G). Transgenic lines were confirmed and three independent lines were analyzed. Scale bars, 2 mm (B), 200 μm (C), 500 μm (D, G), 100 μm (E), or 1 cm (F). Representative images are shown.
Supplementary Fig. 4 Loss of function of PEL1 suppresses the defective growth of pdk1.1 pdk1.2, confirmed by complementation.
A. Western blot analysis confirms the PEL1-FLAG expression in pdk1.1 pdk1.2 sop21 transgenic lines. An anti-FLAG (upper panel) and an anti-Actin (bottom panel) antibody was used respectively.
B. Expression of PEL1 protein in sop21 plants restored the phenotype of pdk1.1 pdk1.2. Five-(top) or three-(bottom) week-old Col-0, pdk1.1 pdk1.2, pdk1.1 pdk1.2 sop21 and 35S::PEL1-FLAG (in pdk1.1 pdk1.2 sop21) plants were observed and shown. Scale bars, 2 cm.
C. Western blot analysis confirmed the PEL1-FLAG protein expression in Col-0 background. An anti-FLAG (upper panel) and an anti-Actin (bottom panel) antibody was used respectively.
D. Overexpression of PEL1 did not show any obvious phenotypes. Five-(top) or three-(bottom) week-old Col-0 and 35S::PEL1-FLAG (in Col-0) plants were observed and representative photos are shown. Scale bars, 2 cm.
Supplementary Fig. 5 Sequence alignment among Arabidopsis thaliana HBS1, Homo sapiens HBS1 and Saccharomyces cerevisiae HBS1. Protein sequences were obtained from NCBI, including AtHBS1 (AED91575.1), HsHBS1 (NP_006611.1) and ScHBS1 (CAA82163.1). Alignment was performed using the DNAMAN Software with default settings. The three orthologues show 38.60% identity. The similarity was shown in different colours: back, 100% identity; grey, ≥75%.
Supplementary Fig. 6 Identification of hbs1 mutants.
A. RT-qPCR analysis reveals the HBS1 expression in various tissues. Actin7 gene was amplified and used as an internal control. Experiments were biologically repeated 3 times and data are presented as means ± SD. n = 3. Different letters represent significant difference, P < 0.05, by one-way ANOVA with a Tukey multiple comparison test.
B. Schematic representation of HBS1 gene and position of T-DNA insertion. Introns, exons and non-coding regions are indicated by lines, black or blank boxes. Positions of primers are indicated.
C. Identification of homozygous hbs1 mutant. Genomic DNA was used as template for PCR amplification and homozygous lines presents a single amplified fragment when using P745/HBS1-LP primers.
D. RT-qPCR analysis confirmed the significantly reduced HBS1 expression in hbs1 mutant. Total RNAs of 7-day-old WT and hbs1 seedlings were extracted and used for analysis. ACTIN7 gene was amplified and used as an internal control. Experiments were biologically repeated 3 times and data are presented as means ± SD. P value was calculated by an unpaired Student’s t-test.
Supplementary Fig. 7 Phenotype of multiple combinations of pdk1.1 pdk1.2 double mutants.
A-B. A schematic picture showing the positions of T-DNA insertions in various alleles of pdk1.1 and pdk1.2. The primers used for genotyping pdk1.1 (pdk1.2-2) and pdk1.2 (pdk1.2-4) and RT-qPCR analysis are also indicated with arrows.
C. A representative photo showing the phenotype of different combinations of pdk1.1 pdk1.2 double mutants. 25 days old. Scale bar, 2 cm.
Supplementary Fig. 8 Increased expression of PDK1 N-terminal fragments rescued the growth defects of pdk1.1 pdk1.2.
A. Semi-quantitative RT-PCR analysis with primers targeting the N-terminal fragments (beforeT-DNA insertions) revealed that N-terminal fragments of PDK1.1 and PDK1.2 transcript (PDK1.1N and PDK1.2N) exhibited increased levels in pdk1.1 pdk1.2 sop21, pdk1.1 pdk1.2 pel1 and pdk1.1 pdk1.2 hbs1, respectively, compared to that in pdk1.1 pdk1.2. ACTIN7 gene was amplified and used as an internal control (bottom).
B. CaMV 35S-driven overexpression of PDK1 N-terminal fragment rescued the growth defects of pdk1.1 pdk1.2. A representative photo of 20-day-old Col-0, pdk1.1 pdk1.2, 35S::Venus-PDK1.1, 35S::Venus-PDK1.2, 35S::Venus-PDK1.1N, 35S::Venus-PDK1.2N, 35S::Venus-PDK1.1C and 35S::Venus-PDK1.2C plants (all in pdk1.1 pdk1.2 background) grown in soil are shown. Scale bar, 2 cm.
Supplementary Fig. 9 Subcellular localization of PDK1.1-YFP, PDK1.2-YFP, PEL1-YFP, and HBS1-YFP.
A-C. Fusion proteins PDK1.1-YFP, PDK1.2-YFP, PEL1-YFP, and HBS1-YFP were transiently expressed in Arabidopsis leaf protoplasts and fluorescence were observed (a). Endoplasmic reticulum-specific ER-mCherry (a), plasma membrane-specific PIP2-RFP (b), and nuclear-specific dye DAPI (c) were used to confirm the location at plasma membrane, endoplasmic reticulum, or nucleus. Scale bars, 10 µm.
D. Western blot revealing the integrity of PDK1.1-GFP protein in 35S::PDK1.1-GFP transgenic plants. Upper panel, anti-GFP antibody; bottom, Ponceau stain.
E. Fluorescence observations show the endoplasmic reticulum localization of PDK1.1, PDK1.2, PEL1 and HBS1. Fusion proteins PDK1.1-GFP, PDK1.2-GFP, PEL1-GFP and HBS1-GFP were transiently expressed with ER-specific ER-mCherry proteins in tobacco leaves. Scale bars, 50 μm.
Supplementary Fig. 10 PDK1 doesn’t affect the amounts of PEL1 and HBS1 proteins. Abundance of PEL1 and HBS1 proteins is not changed in roots of 14-day-old pdk1.1 pdk1.2 seedlings by TMT-based comparative proteomics analysis. “PP” refers to pdk1.1 pdk1.2 double mutant and three independent samples of WT (WT-1, WT-2, WT-3) and pdk1.1 pdk1.2 (PP-1, PP-2, PP-3) were collected and analyzed. Heat maps were generated using log2-transformed TMT values. Relative amount of PEL1 and HBS1 proteins was used to perform the hierarchical clustering analysis using Cluster3.0 (http://bonsai.hgc.jp/~mdehoon/software/cluster/software.htm) and Java Treeview software (http://jtreeview.sourceforge.net). Euclidean distance algorithm for similarity measure and average linkage clustering algorithm (clustering uses the centroids of observations) for clustering were selected when performing hierarchical clustering.
Supplementary Fig. 11 Abundance of AGC protein kinases in pdk1.1 pdk1.2 or pdk1.1 pdk1.2 pel1.
Abundance of the AGC family of proteins detected in shoots (A) or roots (B) of 14-day-old pdk1.1 pdk1.2 and pdk1.1 pdk1.2 pel1 seedlings by TMT-based comparative proteomics analysis. Data are presented as means ± SD. n = 3. Different letters represent significant difference, P < 0.05, by one-way ANOVA with a Tukey multiple comparison test.
Table S1 | Candidate HBS1 proteins in Arabidopsis thaliana by homologous analysis using Saccharomyces cerevisiae HBS1 (ScHBS1) and Homo sapiens HBS1 (HsHBS1L). Top five Arabidopsis homologs of ScHBS1 and HsHBS1L are shown and corresponding properties were obtained through the TAIR website (http://www.arabidopsis.org/).
Table S2 | Primers used in this study. Added restriction enzymes are indicated and underlined.
Acknowledgements
We gratefully acknowledge the Arabidopsis Biological Resource Centre (ABRC) for providing T-DNA insertional mutants, and Prof. Remko Offringa for sharing published seeds. We thank Xixi Zhang for the pDONR-P4P1r-mCherry plasmid, Alexander Johnson and Hana Semeradova for helpful comments. The study was supported by National Science Foundation of China (NSFC, 31721001, to H.-W. X.), “Ten-Thousand Talent Program” (to H.-W. X.) and Collaborative Innovation Center of Crop Stress Biology, Henan Province, and Austrian Science Fund (FWF): I 3630-B25 (to J. F.). S.T. was funded by a European Molecular Biology Organization (EMBO) long-term postdoctoral fellowship (ALTF 723-2015).
References


