

Abstract
The evolutionary process of genetic recombination has the potential to rapidly change the properties of a viral pathogen, and its presence is a crucial factor to consider in the development of treatments and vaccines. It can also significantly affect the results of phylogenetic analyses and the inference of evolutionary rates. The detection of recombination from samples of sequencing data is a very challenging problem, and is further complicated for SARS-CoV-2 by its relatively slow accumulation of genetic diversity. The extent to which recombination is ongoing for SARS-CoV-2 is not yet resolved. To address this, we use a parsimony-based method to reconstruct possible genealogical histories for samples of SARS-CoV-2 sequences, which enables the analysis of recombination events that could have generated the data. We propose a framework for disentangling the effects of recurrent mutation from recombination in the history of a sample, and hence provide a way of estimating the probability that ongoing recombination is present. We apply this to samples of sequencing data collected in England and in South Africa, and find compelling evidence of ongoing recombination.
1. Introduction
Ongoing mutation of the SARS-CoV-2 virus has received significant scientific and media attention since the start of the pandemic. The process of viral recombination has received far less coverage, but has the potential to have a drastic impact on the evolution of virulence, transmissibility, and evasion of host immunity (Simon-Loriere & Holmes, 2011). Recombination occurs when host cells are co-infected with different strains of the same virus, and during replication the genomes are reshuffled and combined before being packaged and released as new offspring virions, now potentially possessing very different pathogenic properties. This makes the presence of recombination a crucial factor to consider when developing vaccines and treatments. While the role of recombination between different coronaviruses in the emergence of SARS-CoV-2 has been widely studied, research has not adequately focused on understanding its potential for ongoing recombination within human hosts (Neches et al., 2020).
The detection of ongoing recombination from a sample of genetic data is, in general, a very challenging problem. Only a fraction of recombination events significantly change the shape of a genealogy, and even then, mutations must occur on the correct branches of the genealogy in order to create patterns that are detectable in the data (Hein et al., 2004, Section 5.11). In evolutionary terms, a relatively short time period has passed since the start of the pandemic, so typical SARS-CoV-2 sequences differ only by a small number of mutations, meaning that recombination events are likely to be undetectable or leave only faint traces. Moreover, the effects of recombination can be indistinguishable from those of recurrent mutation (McVean et al., 2002), where mutations have occurred at the same site multiple times in the history of the sample. Coronaviruses are known to have relatively high recombination rates (Su et al., 2016), suggesting that ongoing intra-host recombination since the start of the pan-demic should be commonplace, but detection efforts are thwarted by the slow accumulation of genetic diversity.
Early evidence of ongoing recombination in SARS-CoV-2 was presented by Yi (2020), who identified the presence of loops in reconstructed phylogenetic networks, which can arise as a consequence of recombination, and Korber et al. (2020), who in April 2020 found possible recombinants among sequences sampled in Belgium. VanInsberghe et al. (2020) created a pipeline for analysing data for possible recombinants, by grouping sequences into clades, identifying a subset of potential recombinants and visually inspecting these sequences; they identified only five possible recombinants out of 47 000 analysed sequences. Varabyou et al. (2020) proposed a scalable method for identifying recombinants, also by classifying sequences into clades and searching for those that appear to carry a mix of mutations characteristic to more than one clade; they identified 225 sequences as possible recombinants, out of 84 000. Both of these methods are sensitive to the classification of sequences into clades, do not allow for the detection of intra-clade recombination, and do not incorporate a framework for quantifying how likely it is that an observed pattern of incompatibilities has arisen through recombination rather than recurrent mutation. The presence of recombination has, on the other hand, been disputed in a number of studies through the analysis of linkage disequilibrium (De Maio et al., 2020; Van Dorp et al., 2020; Nie et al., 2020; Tang et al., 2020; Wang et al., 2020), and in the recent work of Richard et al. (2020) through the analysis of linkage disequilibrium, application of the pairwise homoplasy index test, and analysis of phylogenetic outliers. In general, there is a lack of compelling evidence for widespread recombination in SARS-CoV-2, but given the aforementioned causes for studies to be underpowered, the overall extent and importance of ongoing recombination to SARS-CoV-2 remains not fully resolved.
Phylogenetic analysis of SARS-CoV-2 data largely assumes the absence of recombination. Re-combination can significantly influence the accuracy of phylogenetic inference (Posada & Crandall, 2002), distorting the branch lengths of inferred trees and making mutation rate heterogeneity appear stronger (Schierup & Hein, 2000). Moreover, when analysing data at the level of consensus sequences, the genealogy of a sample corresponds to the transmission network of the disease, with splits in the genealogy representing transmission of the virus between hosts. Models used for constructing genealogies and inferring evolutionary rates for this type of data cannot fully incorporate important realistic factors such as geographical structure, patterns of social mixing, travel restrictions, and other non-pharmaceutical interventions, without making inference intractable. Relying on standard tree-based models can easily lead to biased estimates, with the extent of the error due to model misspecification being very difficult to quantify.
In this article, we use KwARG (Ignatieva et al., 2020), a parsimony-based method for reconstructing possible genealogical histories of a sample of sequences, to detect and examine crossover recombination events in two samples of SARS-CoV-2 sequencing data. This approach provides a concrete way of describing the genealogical relationships between the sampled sequences, sidestepping the challenges presented by discrepancies in clade assignment, avoiding the need to specify a particular model of evolution, and allowing for the explicit identification of possible recombination events in the history of a sample. Our method naturally handles both recombination and recurrent mutation, identifying a range of possible explicit genealogical histories for the dataset with varying proportions of both events types. Rather than using summary statistics calculated from the data, our method utilises all of the information contained in the patterns of incompatibilities observed in a sample, allowing for powerful detection and identification of possible recombinants. Moreover, we provide a nonparametric framework for evaluating the probability of a given number of recurrent mutations, thus quantifying how many recombinations are likely to have occurred in the history of a dataset.
Using publicly available data from GISAID (Elbe & Buckland-Merrett, 2017), we analyse two samples of sequences collected in England and in South Africa in November 2020. Two new variants of the virus have recently been found to be in circulation in these countries, and we specifically include sequences from the new strains in our analysis. In England, the new variant (VUI 202012/01, now labelled as lineage B.1.1.7) emerged in September 2020, with over 1 000 sequences submitted to GISAID in November. The variant belongs to the GISAID clade GR, and carries 14 non-synonymous amino acid mutations and three deletions (Rambaut et al., 2020). We consider a dataset of 80 sequences, half of which belong to the new strain. In South Africa, the new variant (501Y.V2, now labelled as lineage B.1.351) emerged in early August, carrying 9 characteristic non-synonymous mutations (Tegally et al., 2020), with over 300 sequences deposited in GISAID in November. We analyse a sample of 50 sequences, of which 25 belong to the new strain.
We find compelling evidence of recombination in the analysis of both datasets. In the England sample, we identify one sequence that appears to be a recombinant of lineage B.1.1.7 and another lineage in clade GR, and show that other recombination events are very likely to have occurred in the history of the sample. In the South Africa sample, we identify two sequences which are potential recombinants, and again demonstrate that the patterns observed in the data are very unlikely to have arisen through recurrent mutation alone.
2. Materials and Methods
2.1. Data
England
All SARS-CoV-2 (human host) sequences labelled as clade GR, collected in England in November 2020, were downloaded from GISAID, aligned and masked as detailed in SI Appendix, Section S1.1. The sequences were then split into datasets EN (934 sequences labelled as belonging to lineage B.1.1.7) and EO (the other 2 650 sequences), with the subscripts abbreviating ‘new’ and ‘old’, respectively. A sample of 40 sequences from each of EO and EN was then selected at random. The resulting sample comprises 80 sequences with 363 variable sites.
2.2. Data
South Africa
All sequences collected in South Africa in November 2020 were down-loaded from GISAID and processed as described in SI Appendix, Section S1.2. The aligned sequences were split into the datasets SAN (the 177 sequences labelled as belonging to variant 501Y.V2 in GI-SAID) and SAO (the other 101 sequences). A sample of 25 sequences from each of SAO and SAN was then selected. The resulting sample comprises 50 sequences with 229 variable sites.
2.3. Overview of methods
Our method consists of two main steps. Firstly, using KwARG, plausible genealogical histories are reconstructed for each of the two data samples, with varying proportions of posited recombination and recurrent mutations events. Then, using simulation, we approximate the distribution of the number of recurrent mutations that might be observed in a dataset of the same size as each sample. We use this to establish which of the identified genealogical histories is more plausible for the data at hand, and thus whether the presence of recombination events in the history of the given samples is likely.
This can be framed in the language of statistical hypothesis testing. The ‘null hypothesis’ is the absence of recombination. The test statistic T is the number of recurrent mutations in the history of the dataset; the distribution of T is approximated through simulation. The observed value Tobs is the minimal number of recurrent mutations required to explain the dataset in the absence of recombination, as estimated by KwARG. The ‘p-value’ is the probability of observing a number of recurrent mutations equal to or greater than Tobs. Small p-values allow us to reject the null hypothesis, providing evidence that recombination has occurred. The reconstructed genealogies then allow for the detailed examination of possible recombination events in the history of the sampled sequences.
2.4. Reconstruction of genealogies
The first step in our approach is to use a parsimony-based method to reconstruct possible genealogical histories for the given datasets.
2.4.1. Incompatibilities in the data
Suppose that each site of the genome can mutate between exactly two possible states (thus excluding the possibility of triallelic sites, which we have masked from the data). Then the allele at each site can be denoted 0 or 1. If the commonly used infinite sites assumption is applied, at most one mutation can affect each site of the genome. The four gamete test (Hudson & Kaplan, 1985) can then detect the presence of recombination: if all four of the configurations 00, 01, 10, 11 are found in any two columns, then the data could not have been generated through replication and mutation alone, and at least one recombination event must have occurred between the two corresponding sites; the sites are then termed incompatible. If the infinite sites assumption is violated, the four gamete test no longer necessarily indicates the presence of recombination, as the incompatibilities could instead have been generated through recurrent mutation (McVean et al., 2002).
2.4.2. Ancestral recombination graphs (ARGs)
All of the viral particles now in circulation had a common ancestor at the time of emergence of the virus, so sequences sampled at the present time can be united by a network of evolution going back to this shared ancestor through shared predecessors, termed the ancestral recombination graph (ARG) (Griffiths & Marjoram, 1997). As the sample consists of consensus sequences (at the level of one sequence per host), an edge of this network represents a viral lineage, possibly passing through multiple hosts before being sequenced at the present. An example of an ARG topology can be seen in Figure 4. Mutations are represented as points on the edges, labelled by the sites they affect. Considering the graph backwards in time (from the bottom up), the point at which two edges merge represents the time at which some sequences in the data coalesced, or have found a common ancestor. A point at which an edge splits into two corresponds to a recombination — the parts of the genome to the left and to the right of the breakpoint (whose site number is labelled inside the blue recombination node) are inherited from two different parent particles. The network thus fully encodes the evolutionary events in the history of a sample.
2.4.3. Parsimonious reconstruction of histories
A sample of genetic sequences may have many possible histories, with many different corresponding ARGs, varying in the number and location of the recombination and recurrent mutation events they contain. The parsimony approach to reconstructing ARGs given a sample of genetic data focuses on minimising the number of recombination and/or recurrent mutation events. This does not necessarily produce the most biologically plausible histories, but it does provide a lower bound on the number of events that must have occurred in the evolutionary pathway generating the sample. Thus, recombination can be detected in the history of a sample by considering whether the most plausible parsimonious solutions contain at least one recombination node.
Crucially, the parsimony approach does not require the assumption of a particular generative model for the data (such as the coalescent with exponential growth) beyond specifying the types of events that can occur. While this means that mutation and recombination rates cannot be inferred, it allows us to sidestep the need to specify a detailed model of population dynamics, which is particularly challenging for SARS-CoV-2 data. A parsimony-based approach is more appropriate when our focus is on interrogating the hypothesis that recombination is present at all. It also allows for the explicit reconstruction of possible events in the history of a sample, and thus allows us to identify recombinant sequences and uncover patterns consistent with the effects of sequencing errors.
2.4.4. KwARG
KwARG (Ignatieva et al., 2020) is a program implementing a parsimony-based heuristic algorithm for reconstructing plausible ARGs for a given dataset. KwARG outputs solutions corresponding to a list of coalescence, mutation, recurrent mutation, and recombination events that could have generated the input dataset, which can be visualised in the form of an ARG. KwARG identifies ‘recombination only’ solutions (all incompatibilities are resolved through recombination events) and ‘recurrent mutation only’ solutions (all incompatibilities are resolved through additional mutation events), as well as interpolating between these two extremes and outputting solutions with a combi-nation of both event types. KwARG allows for missing data and disregards insertions and deletions (we have deleted insertions from the alignment and treat deletions as missing data). KwARG seeks to minimise the number of posited recombination and recurrent mutation events in each solution, and the proportions of the two event types can be controlled by specifying ‘cost’ parameters, as detailed in SI Appendix, Section S1.3. KwARG distinguishes between recurrent mutations that occur on the internal branches of the ARG from those can be placed on the terminal branches, which affect only one sequence in the input dataset, so can be examined separately for indications that they arose due to errors in the sequencing process.
KwARG was run on both the England and South Africa samples, as detailed in SI Appendix, Section S1.3. An overview of the identified solutions is given in Table 1.
Summary of solutions identified by KwARG for the England and South Africa samples. First column: number of recombinations. Second column: number of recurrent mutations. Third column shows how many of these recurrent mutations can be placed on a terminal branch of the ARG. Fourth column shows the total number of recombination and recurrent mutation events.
2.5. Evaluation of solutions
The next step in our approach is to determine which of the solutions shown in Table 1 is more likely, by calculating the probability of observing the given number of recurrent mutations. To avoid making model-based assumptions on the genealogy of the sample, we use a nonparametric method inspired by the homoplasy test of Maynard Smith & Smith (1998).
The homoplasy test estimates the probability of observing the minimal number of recurrent mutations required to generate the sample in the absence of recombination, i.e. if the shape of the genealogy is constrained to be a tree. If this probability is very small then it provides evidence for the presence of recombination. The method is particularly powerful when the level of divergence between sequences is very low, as is the case with SARS-CoV-2 data, although it appears prone to false positives in the presence of severe mutation rate heterogeneity along the genome (Posada & Crandall, 2001). We calculate an empirical estimate  of mutation density along the genome from SARS-CoV-2 data, which does not suggest the presence of extreme heterogeneity, and then use this estimate to simulate the distribution of the number of recurrent mutations that are observed in a sample.
The i-th entry of the vector  , for i ∈ {1, …, 29 903}, gives an estimated probability that when a mutation occurs, it affects the i-th site of the genome. Details of our method for estimating
  are presented in SI Appendix, Section S1.4. Briefly, this estimate is calculated by examining the locations of sites that have undergone at least one mutation (segregating sites) using GISAID data collected in September-November 2020. If the mutation rate were constant along the genome, we would expect segregating sites to be spread uniformly throughout the genome; uneven clustering of the mutations gives an indication of mutation rate heterogeneity. We use a nonparametric method (wavelet decomposition) to estimate
  from the observed positions of segregating sites. Further, we adjust
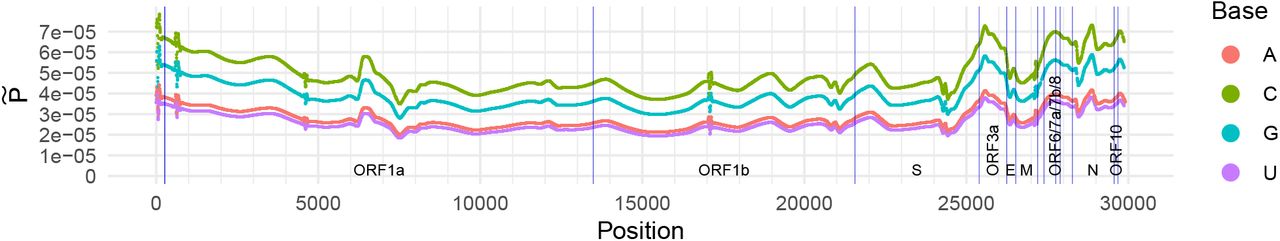
  to account for the fact that for SARS-CoV-2, the mutation rate appears to be dependent on the base type of the nucleotide undergoing mutation (Simmonds, 2020; Koyama et al., 2020). The resulting estimate is shown in Figure 1.

Estimate  of the probability of a mutation falling on each site of the SARS-CoV-2 genome. Blue vertical lines mark endpoints of the labelled ORFs and genes as per Wu et al. (2020).
The estimate of  is then used to approximate the distribution of the number of recurrent mutations observed in a sample, using a simulation approach. We simulate the process of mutations falling along the genome until the simulated number of segregating sites matches that observed in the sample; the vector
  controls where on the genome each mutation falls. The number of recurrent mutations (instances where mutations fall on the same site multiple times) is recorded. This procedure is repeated for 1 000 000 iterations and a histogram of the results is constructed; this is shown in Figure 2.

Simulated distributions of the number of recurrent mutations. Left: for the England sample. Right: for the South Africa sample.
3. Results
3.1. England
The dataset is illustrated in SI Appendix, Figure S2. Table 1 shows that in the absence of recombination, at least Tobs = 15 recurrent mutations are required to explain the incompatibilities observed in the sample. The possible locations of these recurrent mutations are shown in Figure S2 as red crosses (choosing a KwARG solution where all recurrent mutations fall on the terminal branches of the ARG, and hence affect only one sequence each). Using our approximation of the distribution of the number of recurrent mutations T, the probability of observing 15 or more recurrent mutations is p = 2 · 10−6, strongly indicating the presence of recombination. The probability of observing 6 or fewer recurrent mutations is 0.97, implying that with high probability at least 9 recombination events have occurred in the history of the dataset.

Summary of the England dataset. Columns correspond to sequences, labelled at the bottom. Rows correspond to positions along the genome; uninformative sites (with all 0’s or 1’s) and those with singleton mutations (with exactly one 1) are not shown. Light blue: ancestral state, dark blue: mutated state, white: missing data. Red crosses highlight sites of recurrent mutations identified by KwARG. Sites bearing the characteristic mutations of lineage B.1.1.7 (Rambaut et al., 2020) are highlighted in green.
From examining Figure S2, it is striking that six of the identified recurrent mutations can be placed in the same sequence EO40. Examination of the KwARG solutions reveals that four recombinations in this sequence with breakpoints just after positions 28 168, 27 971, 26 304, and 23 062 have the same effect as five of these recurrent mutations. The recurrent mutation at site 5 672 could be replaced by two further recombinations, suggesting that recurrent mutation is a more parsimonious explanation at this position. The sequence EO40 appears to carry some of the mutations carried by sequence EO32, and some of the mutations characteristic of lineage B.1.1.7; this is demonstrated in Figure 3.

Comparison of sequences EO32, EO40 and the characteristic mutations of lineage B.1.1.7. Columns correspond to positions along the genome; uninformative sites (with all 0’s or 1’s) and those with singleton mutations (with exactly one 1) are not shown. Light blue: ancestral state, dark blue: mutated state, white: missing data. Red crosses highlight locations of the recurrent mutations identified by KwARG. Sites bearing the characteristic mutations of lineage B.1.1.7 (Rambaut et al., 2020) are highlighted in green.
The characteristic mutations appear in Sequence EO40 exclusively in ORF1a, the S gene, and ORF8, while all other mutations are either singletons or are shared with O32. This strongly suggests that the sequence is a result of recombination between the new strain and another lineage in clade GR. An ARG constructed using KwARG with 5 recombinations and 9 recurrent mutations is shown in Figure 4, visualised using GraphViz (Ellson et al., 2004), demonstrating a possible string of recombinations forming sequence EO40. The edges carrying the mutations characteristic of lineage B.1.1.7 are highlighted in red.

Example of an ARG for the England dataset (the “E” prefix of each sequence reference number is dropped for ease of viewing). Recombination nodes are shown in blue, labelled with the recombination breakpoint, with the offspring sequence inheriting part of the genome to the left (right) of the breakpoint from the parent labelled “P” (“S”). Recurrent mutations are prefixed with an asterisk. For ease of viewing, some parts of the ARG have been collapsed into nodes labelled “O…” and “N…” (containing sequences from EO and EN, respectively). Edges are labelled by positions of mutations (some mutated sites are not explicitly labelled and are denoted by a dot instead).
The ARG also clearly shows that the sequence EO11 is more closely genealogically related to the sequences from dataset EN than those from EO. Examination of this sequence revealed that it carries all of the characteristic mutations of lineage B.1.1.7, but was labelled in the GISAID database as strain B.1.1.49. All of the other sequences are grouped as expected.
A BLAST (Camacho et al., 2009) search of the November data finds four other sequences identical to EO32, although finds no matches for EO40, so we cannot rule out the possibility of this being a lab-created recombinant due to sample contamination or mis-assembly, rather than arising within-host. Even if sequence EO40 is removed from the sample, at least 9 more recurrent mutations are required to explain the dataset in the absence of recombination. The probability of observing 9 or more recurrent mutations is estimated to be only p = 0.006, which demonstrates that the remaining incompatibilities in the data are extremely unlikely to have arisen due to recurrent mutation alone, strongly suggesting that ongoing recombination is present.
3.2. South Africa
An illustration of the sample is provided in SI Appendix, Figure S3. The sites of 13 recurrent mutations identified by KwARG are highlighted with red crosses (choosing a solution with no recombinations, and where the recurrent mutations fall on the terminal branches of the ARG). The probability of observing Tobs = 13 or more recurrent mutations is p < 1 · 10−6, suggesting the presence of recombination. The probability of observing 3 or fewer recurrent mutations is 0.97, which indicates that with high probability at least 8 recombination events have occurred in the history of the dataset.

Summary of the South Africa dataset. Columns correspond to sequences, labelled at the bottom. Rows correspond to positions along the genome; uninformative sites (with all 0’s or 1’s) and those with singleton mutations (with exactly one 1) are not shown. Light blue: ancestral state, dark blue: mutated state, white: missing data. Red crosses highlight sites of recurrent mutations identified by KwARG. Sites bearing the characteristic (non-synonymous) mutations of lineage B.1.351 (Tegally et al., 2020) are highlighted in orange.
Table 1 shows that three recurrent mutations can remove the necessity of six recombination events, suggesting that recurrent mutation offers a more parsimonious explanation than recombination for the corresponding incompatibilities in the data. Examination of the KwARG solutions shows that these recurrent mutations consistently occur at sites 4 093, 11 230 and 25 273. An ARG with recurrent mutations at these three sites is shown in Figure 5; edges carrying the characteristic mutations of lineage B.1.351 are highlighted in red.

Example of an ARG for the South Africa dataset (the “SA” prefix of each sequence reference number is dropped for ease of viewing). Recombination nodes are shown in blue, labelled with the recombination breakpoint, with the offspring sequence inheriting part of the genome to the left (right) of the breakpoint from the parent labelled “P” (“S”). Recurrent mutations are prefixed with an asterisk. For ease of viewing, some parts of the ARG have been collapsed into nodes labelled “O…” and “N…” (containing sequences from SAO and SAN, respectively). Edges are labelled by positions of mutations (some mutated sites are not explicitly labelled and are denoted by a dot instead).
In Figure S3, the sequences SAO21 and SAO22 carry three and two of the identified 13 recurrent mutations, respectively. Both of these sequences carry some of the mutations characteristic of lineage B.1.351; this is demonstrated in Figure 6, where the two sequences are compared to two other typical sequences from lineage B.1.351. Examination of the KwARG solutions shows that a recombination in Sequence SAO21 just after site 22 812 has the same effect as the recurrent mutations at sites 22 813 and 23 012, and a recombination in Sequence SAO22 just after site 23 011 has the same effect as the recurrent mutations at sites 23 012 and 23 063. This suggests that these two sequences could be the result of recombination between sequences within lineage B.1.351; a possible sequence of recombination events generating these sequences can be seen in Figure 5.

Comparison of sequences SAO21, SAO22 and the characteristic mutations for lineage B.1.351. Columns correspond to positions along the genome; uninformative sites (with all 0’s or 1’s) and those with singleton mutations (with exactly one 1) are not shown. Light blue: ancestral state, dark blue: mutated state, white: missing data. Red crosses highlight sites of recurrent mutations identified by KwARG. Sites bearing the characteristic (non-synonymous) mutations of lineage B.1.351 (Tegally et al., 2020) are highlighted in orange.
A BLAST search did not identify any sequences identical to SAO21 or SAO22 in the full dataset, so we cannot rule out that these are lab-created recombinants or other consequences of errors in the sequencing process. Further, Figure S3 shows that recurrent mutations at site 10 323 appear in two different sequences (SAO9 and SAO12); this site also carries a mutation in all sequences from lineage B.1.351 in the sample. This could imply that the site is highly mutable, or prone to sequencing errors. If the five recurrent mutations found in Sequences SA021 and SAO22 and the two recurrent mutations found at site 10 323 are disregarded, at least 6 more recurrent mutations are still required to explain the remaining incompatibilities observed in the data. The probability of this is estimated to be p = 0.002, which demonstrates that the patterns observed in the data are extremely unlikely to have arisen due to recurrent mutation alone, strongly suggesting the presence of recombination.
4. Discussion
The method presented in this article offers a clear and principled framework for recombination detection, which can be interpreted as a hypothesis testing approach. We emphasise that we make very conservative assumptions throughout, both in processing the data and in estimating the distribution of the number of recurrent mutations. Moreover, the number of recurrent mutations required to explain a given dataset computed by KwARG is (or is close to) a lower bound on the actual number of such events, and is likely to be an underestimate, making the reported p-values larger (more stringent). We use nonparametric techniques at each stage, to avoid making assumptions on the process generating the data, and thus circumvent issues with model misspecification.
Our results clearly indicate the presence of recombination in the history of the analysed SARS-CoV-2 sequencing data. While studies relying on clade assignment and statistics such as linkage disequilibrium have identified that recombination occurs at very low levels (VanInsberghe et al., 2020; Varabyou et al., 2020) or is unlikely to be occurring at all (De Maio et al., 2020; Van Dorp et al., 2020; Nie et al., 2020; Tang et al., 2020; Wang et al., 2020; Richard et al., 2020) even when analysing vast quantities of sequencing data, our powerful method detects multiple recombination events using relatively small samples. Moreover, it allows us to gain clear insights into the evolutionary events that may have generated the given sequences, offering easily interpretable results. In the England dataset, we identify a sequence that could have formed as a result of recombination between the newly emergent lineage B.1.1.7 and other circulating strains, and in the South Africa dataset we find two sequences which appear to be the result of recombination within the strain B.1.351; this suggests the presence of both inter- and intra-clade recombination.
Recombination can occur when the same host is co-infected by two different strains, which has been noted to occur in COVID-19 patients (Samoilov et al., 2020), and could become more likely with the emergence of more transmissible variants. We note that all of the potential mosaic sequences we identified are represented only once in the data. This could be due to a lack of onward transmission, as recombinants are likely to reach a detectable level at a relatively late stage in the infection cycle. It could also indicate that the sequences arose due to either contamination of the sample during processing, or the mis-assembly of two distinct (non-recombinant) strains present in the same sample.
Our findings suggest that care should be taken when performing and interpreting the results of analysis based on the construction of phylogenetic trees for SARS-CoV-2 data. The presence of recombination, as well as other factors complicating the structure of the transmission network of the virus, strongly suggests that standard tree-based models are not appropriate for modelling SARS-CoV-2 genealogies, and inference of evolutionary rates based on such methods may suffer from errors due to model misspecification that are difficult to quantify.
Due to the high level of homogeneity between sequences, the effects of recombination will be either undetectable or indistinguishable from recurrent mutation in the majority of cases. However, as genetic diversity builds up over longer timescales, the effects of recombination may become more pronounced. Particularly in light of the recent emergence of new variants, the rapid evolution of the virus through recombination between strains with different pathogenic properties is a crucial risk factor to consider. This highlights the need for continuous monitoring of the sequenced genomes for new variants, to enable the early detection of novel recombinant genotypes, and for further work on the quantification of recombination rates and identification of recombination hotspots along the genome.
5. Data and code Availability
GISAID data is publicly available from gisaid.org upon free registration. Code used in carrying out the analysis is available at github.com/a-ignatieva/sars-cov-2-recombination.
Supporting Information
S1. Detailed Materials and Methods
S1.1. Data
England
All SARS-CoV-2 (human host) sequences labelled as clade GR, collected in England in November 2020, were downloaded from GISAID. Filtering for sequences labelled as complete (>29 000bp) and excluding any with more than 5% ambiguous nucleotides gave 4 517 sequences in total.
Alignment to the reference sequence collected in Wuhan in December 2019 (Wu et al., 2020) (GI-SAID accession: EPI ISL 402125, GenBank: MN908947.3) was performed using MAFFT v7.475 (Katoh & Standley, 2013), with the options: auto, keeplength, preservecase, addfragments. Exact duplicates of sequences in the dataset were removed, to avoid including identical sequences in the sample. The sequences were then split into datasets EN (934 sequences labelled as belonging to lineage B.1.1.7) and EO (the other 2 650 sequences).
A sample of 40 sequences from each of EO and EN was then selected at random using SeqKit (Shen et al., 2016). The endpoint regions with a large number of missing nucleotides (1–55bp and 29 804–29 903bp) were trimmed. The recommendations of De Maio et al. (2020) were implemented to mask 230 further sites identified as problematic (prone to sequencing errors, known to be excessively homoplasic, or otherwise of questionable quality). Multi-allelic sites were also masked (three were identified, at positions 12 067, 21 724, and 22 992). Of the total 388 masked positions, 10 corresponded to segregating sites in the dataset. The resulting sample comprises 80 sequences with 363 variable sites. The corresponding GISAID accession numbers and collection dates are given in Table S2.
S1.2. Data
South Africa
All sequences collected in South Africa in November 2020 were down-loaded from GISAID, filtering for those labelled as complete (>29 000bp) and excluding any with more than 5% ambiguous nucleotides. Further, 48 sequences flagged as containing long stretches of ambiguous nucleotides were removed, leaving a total of 278 sequences.
Alignment was performed as described in Section S1.1. The aligned sequences were split into the datasets SAN (the 177 sequences labelled as belonging to variant 501Y.V2 in GISAID) and SAO (the other 101 sequences).
A sample of 25 sequences from each of SAO and SAN was then selected at random using SeqKit. The same masking procedure was performed as described in Section S1.1; in addition, sites 22 339–22 523 were masked, as many of the sequences contained a large number of ambiguous nucleotides at these positions. One multi-allelic site (29 742) was identified and also masked. Of the total 561 masked positions, 7 corresponded to segregating sites in the dataset. The resulting sample comprises 50 sequences with 229 variable sites. The corresponding GISAID accession numbers and collection dates are given in Table S3.
S1.3. KwARG
KwARG seeks to minimise the number of posited recombination and recurrent mutation events in each solution, and the proportions of the two event types can be controlled by specifying input ‘cost’ parameters CSE, CRM, CR, and CRR, corresponding to penalties assigned to recurrent mutations on the terminal branches of the ARG, those on internal branches, recombination events, and two consecutive recombination events (which can mimic the effects of gene conversion), respectively. For instance, setting (CSE, CRM, CR, CRR) = (0.5, 0.51, 1.0, 2.0) is likely to produce solutions with more recurrent mutations than recombinations, as the cost of recurrent mutations is lower, favouring placing recurrent mutations on the terminal branches of the ARG where possible. Recurrent mutations on the terminal branches of the ARG affect only one sequence in the input dataset, so can be examined separately for indications that they arose due to errors in the sequencing process.
KwARG implements a method of randomly exploring the space of possible ARGs, so it should be run multiple times for each configuration of input parameters, and the best identified solutions (with the minimal number of posited recombinations and/or recurrent mutations) then selected for analysis. An input parameter T (the ‘annealing temperature’) controls the extent of this random exploration.
S1.3.1. England sample
KwARG was run 500 times for each combination of the following values of the annealing parameter T and event costs (CSE, CRM, CR, CRR):

The reference sequence used for alignment was set as the root. This reference sequence is a genome collected in Wuhan in December 2019 (Wu et al., 2020), giving the most likely rooting based on the available epidemiological evidence; our results do not change significantly if the root is left unspecified. The total 22 000 runs took 6.2 hours to complete (on a 2.7GHz Intel Core i7 processor). Discarding sub-optimal solutions (with a greater than minimal number of recombinations and/or recurrent mutations), 1 787 valid ARGs were constructed.
S1.3.2. South Africa sample
KwARG was run 1 000 times for each combination of the parameters given in (S1), with the reference sequence set as the root. It was identified that in the absence of recombination, at least 17 recurrent mutations are required to explain the incompatibilities in the data. However, further examination of the results revealed that four of the identified recurrent mutations occur at the same site (22 287). As 9 out of the 50 sampled sequences contain missing data at this position, it appears reasonably likely that this site may be prone to errors in the sequencing process. Thus, this site was masked and KwARG was re-run on the resulting dataset. The 44 000 runs took 3.3 hours; discarding sub-optimal solutions, a total of 5 872 valid ARGs were constructed.
S1.4. Evaluation of histories
S1.4.1. Distribution of the number of recurrent mutations
Let M be the length of the genome, and let m be the number of observed variable sites in the sample. We are interested in estimating the distribution of the number of recurrent mutations that have occurred; that is, the excess number of mutation events beyond the minimum m needed to explain the variability in the sample.
Regardless of any modelling assumptions on the evolution of a given sample or the genealogical relationships between the sequences, it is clear that at least m mutation or sequencing error events must have occurred in the history of the sample (a ‘sequencing error’ refers to the variant at a site being incorrectly called during the sequencing process). Suppose that each time such an event occurs (disregarding which particular sequence is affected), a position on the genome is selected at random with replacement, according to a probability vector P of length M. This corresponds to assuming that such events occur independently from each other, (ii) all sequences have the same probabilities P of a mutation or sequencing error event occurring at each particular site, and moreover we assume that (iii) if a site undergoes at least one mutation in the history of the sample, the site is segregating in the data, and (iv) any sequencing errors fall on each site with probability proportional to P.
Assumption (i) appears reasonable for the data at hand, and assumptions (ii) and (iv) will be discussed further below. Assumption (iii) can be violated if a mutation arising on a branch of the genealogy subsequently reverses through recurrent mutation: either on the same branch before it splits, or independently on every child branch subtending the mutation. We note that the probability of such events depends on the distribution of branch lengths in the genealogy; simulations using the standard coalescent model show that the probability of such events is small. Moreover, such events can never create incompatibilities in the data, so we can ignore their possibility for our purposes, as the solutions identified by KwARG will never include such recurrent mutation events.
The number of recurrent mutations in a sample with m variable sites can then be simulated using Algorithm 1. This is a ‘balls-into-bins’ type simulation, in which balls are placed one-by-one into M bins, each time selecting a bin at random with probability proportional to P, until m bins contain at least one ball; the output is the total number of balls thrown minus m. Executing Algorithm 1 multiple times and calculating a histogram of the results gives an approximation to the distribution of the number of recurrent mutations given the number m of observed segregating sites.
S1.4.2. Mutation rate heterogeneity along the genome
Parts of the genome with a relatively higher mutation rate are more likely to undergo recurrent mutation, so it is important to incorporate the effects of mutation rate heterogeneity. We use an empirical estimate of mutation density to approximate the variation in mutation rate along the genome.

Simulating the number of recurrent mutations conditional on observing m variable sites
All 41 376 sequences in GISAID collected around the world between 1 September and 30 November 2020 were downloaded, filtering for sequences labelled as complete (>29 000bp), high coverage, and excluding any with more than 5% ambiguous nucleotides. Alignment was performed as described in Section S1.1. SNP-sites (Page et al., 2016) was used to extract the positions of the 14 263 identified SNPs; a vector  of length 29 903 was then formed, with a 1 entry at position i if there had been at least one mutation at position i of the genome, and 0 otherwise. If the mutation rate is constant along the genome, we would expect the 1’s to be spread uniformly throughout
  ; uneven clustering of the mutations gives an indication of mutation rate heterogeneity.
The mutation density along the genome was then estimated nonparametrically from  by smoothing using wavelet decomposition, as implemented in the R package wavethresh (Nason et al., 2010). This method was chosen as it does not require selecting a particular model, and it captures both fine-scale and broad variation in mutation density, allowing for the calculation of a smoothed estimate of
  incorporating both local and large-scale rate heterogeneity.
Briefly, wavelet decomposition can be used to obtain an estimate of a signal from a set of discrete observations, by analysing variation in the data at increasingly coarser scales (Nason, 2008). Given M = 2n observations of sites, corresponding to the entries of  (padding the vector
  to the nearest power of 2 by reflecting the data at the endpoints), n iterations are performed, and at the i-th iteration coefficients are computed using (non-overlapping) subsets of 2i neighbouring observations, and (2) these coefficients are used to refine a smoothed estimate of the data. The computation of coefficients and the smoothed approximations is governed by the choice of wavelet shape; we use Daubechies’ least-asymmetric wavelets (Daubechies, 1988) with 6 vanishing moments (other choices of wavelet basis produced similar results). Wavelet shrinkage can be used to obtain a smoothed estimate of the observations and remove noise: coefficient selection is performed by only keeping coefficients with values above a certain threshold, and setting the others to zero. There are myriad ways of calculating such a threshold (Nason, 2008); we apply the empirical Bayes method of Johnstone & Silverman (2005b) implemented in the R package EbayesThresh (Johnstone & Silverman, 2005a).

Estimate  of the probability of a mutation falling on each site of the SARS-CoV-2 genome. Blue vertical lines mark endpoints of the labelled ORFs and genes as per Wu et al. (2020).
The resulting smoothed estimate  shown in Figure S1. The smoothing method has clearly identified both localised and long-range variation in mutation density along the genome. In particular, while mutations in ORF1a and ORF1b appear to be reasonably evenly spread, there is more pronounced heterogeneity near the 3’-UTR end of the genome.
To check consistency of the results across months, the datasets for September, October, and November individually were also used to produce smoothed estimates of  . These were found to agree closely to that obtained using the combined dataset, so the latter was used in further analysis.
S1.4.3. Mutation rate heterogeneity due to base type
The above estimate  captures the variation in mutation density along the genome, but assumes that the mutation rate is independent of the base type of the nucleotide undergoing mutation. This does not appear to hold for SARS-CoV-2 (Simmonds, 2020; Koyama et al., 2020). The summary statistics presented in Table S1 show that, for instance, while only 18% of bases in the reference genome are of type C, they comprise 27% of the observed variable sites. The last column of the table shows that using the estimate
  , the total probability of a mutation falling on one of these sites is 18%, a significant underestimate.
Second column: proportion of nucleotides in the reference sequence by base type. Third column: proportion of mutated sites by base type in the reference genome. Last column: total probability of a mutation falling on sites of each base type, as estimated by  .
.
We therefore adjust the probabilities in  to reconcile the estimated and actual proportion of mutations that fall on sites of each base type, with the result shown in Figure 1. We can now return to the consideration of assumption (ii): as the mutation rates depend on the base type, we cannot claim that all sequences have exactly the same probabilities P of mutating at each particular site, as this will depend on the nucleotides carried by the sequence. However, we estimate the effect of this violation to be negligible, given the relatively low overall rate of mutation for SARS-CoV-2.
To make our approximation even more conservative, we increase m by adding back the number of masked segregating sites (as stated in Sections S1.1 and S1.2) plus a further 10%. Finally, we address assumption (iv) by noting that we have masked sites that are excessively prone to sequencing errors in the data, so correspondingly we decrease M by the number of masked sites and delete the corresponding entries from  . It is then reasonable to assume that sequencing errors occurring at the non-masked sites fall at each site with the same probabilities as mutations.
S1.4.4. Simulated distributions
For the England dataset, the 388 sites masked in the data as per Section S1.1 were deleted from  . Using 1 000 000 simulations using Algorithm 1 with M = 29 903 388 = 29 515 and m = (363 + 10) 1.1 = 410, a histogram of the results is shown in the left panel of Figure 2.
For the South Africa dataset, the 562 sites masked in the data were deleted from  . Using 1 000 000 simulations using Algorithm 1 with M = 29 903 562 = 29 341 and m = (228 + 8) 1.1 = 260, a histogram of the results is shown in the right panel of Figure 2.
GISAID accession numbers, collection dates and references of sequences in the England sample.
GISAID accession numbers, collection dates and references of sequences in the South Africa sample.
6. Acknowledgements
We thank the maintainers and contributors of the GISAID database; a full table of acknowledgements for the data used is provided at github.com/a-ignatieva/sars-cov-2-recombination/ blob/main/GISAID_acknowledgements.pdf.
This work was supported by the OxWaSP CDT under the EPSRC and MRC grant EP/L016710/1, and by the Alan Turing Institute under the EPSRC grant EP/N510129/1.
References


