

Abstract
Colorectal cancer (CRC) remains a leading cause of cancer death, and its mortality is associated with metastasis and resistance to chemotherapy. We demonstrate that oxaliplatin-resistant (OxR) CRC cells are sensitized to TRAIL-mediated apoptosis. Oxaliplatin-resistant cells exhibited transcriptional downregulation of caspase-10, but this effect was of little consequence to TRAIL sensitivity following CRISPR-Cas9 depletion of caspase-10. OxR cells were found to have increased expression of DR4, as well as significantly enhanced DR4 palmitoylation and translocation into lipid rafts. Raft perturbation via nystatin and resveratrol significantly altered DR4/raft colocalization and TRAIL sensitivity. Blood samples from metastatic CRC patients were treated with TRAIL liposomes, and a 57% reduction of viable circulating tumor cells (CTCs) was observed. The degree of DR4/lipid raft colocalization in CTCs was found to increase over time in patients receiving chemotherapy treatment. To our knowledge, this is the first study to investigate the role of lipid rafts in primary CTCs.
Significance Oxaliplatin-resistant colorectal cancer cells show increased sensitivity to apoptosis via TRAIL. This study shows that this is due to death receptor 4 localization to lipid rafts.
Introduction
Colorectal cancer (CRC) is the second leading cause of cancer death and is responsible for over 50,000 deaths annually in the United States (1). The probability of being diagnosed with CRC in one’s lifetime is 1 in 24, and there are over 100,000 new cases diagnosed annually in the United States alone. While the 5-year survival rate of localized and regional disease is 90% and 71%, respectively, patients with metastatic disease have just a 14% 5-year survival rate (2). Dissemination to other organs is the cause of high mortality in most cancers, as nearly 90% of all cancer death is attributed to metastasis (3). The most common sites of CRC metastases include the liver, lungs, and peritoneum (peritoneal carcinomatosis). While surgery and radiation remain curative options for patients with localized disease, the standard of care for CRC patients with advanced metastatic disease is commonly combination front line chemotherapy treatment (4). These chemotherapy “cocktails” typically include fluorouracil (5-FU) and leucovorin (LV) in combination, which work together to inhibit DNA and RNA synthesis and modulate tumor growth, extending median survival in patients from 9 months (with palliative care) to over 12 months (5). Oxaliplatin is a chemotherapeutic agent that upon binding to DNA, forms DNA adducts to cause irreversible transcriptional errors, resulting in cellular apoptosis. When oxaliplatin is administered with 5-FU/LV (FOLFOX), the objective response rate is 50% in previously untreated patients, increasing the median overall survival to 18 - 24 months (5,6).
While there have been incremental advances in extending survival using FOLFOX and other oxaliplatin-containing chemotherapeutics, patients who eventually succumb to the disease frequently develop chemoresistant subpopulations of cancer cells via intrinsic or acquired mechanisms (6,7). Mechanisms of oxaliplatin resistance in tumors include alterations in responses to DNA damage, cell death pathways (e.g., apoptosis, necrosis), NF-κB signaling, and cellular transport (7). Despite the robustness of these oxaliplatin-resistant cancer cells, multiple studies suggest that chemoresistant subpopulations may be increasingly susceptible to adjuvant therapies (7–12). Tumor necrosis factor‐related apoptosis‐inducing ligand (TRAIL) is a member of the TNF family of proteins and induces apoptosis in cancer cells via binding to transmembrane death receptors (13). The binding of TRAIL to trimerized death receptor 4 (DR4) and 5 (DR5) initiates an intracellular apoptotic cascade beginning with the recruitment of death domains and formation of the death‐inducing signaling complex (DISC).
Lipid rafts (LRs) are microdomains in the plasma membrane lipid bilayer that are enriched in cholesterol and sphingolipids, with a propensity to assemble specific transmembrane and GPI-anchored proteins (14). Mounting evidence has demonstrated that lipid rafts play major roles in tumor progression, metastasis and cell death (15). Studies have shown that translocation into lipid rafts can augment signaling for a variety of cancer-implicated receptors, including growth factor receptors (IGFR and EGFR) and death receptors (Fas and Death receptors 4/5) (16–19). Translocation of death receptors into rafts enhances apoptotic signaling through the formation of clusters of apoptotic signaling molecule-enriched rafts (CASMER), which act as scaffolds to facilitate trimerization and supramolecular clustering of receptors (18). It has become increasingly evident that higher order oligomerization of death receptors is necessary for effective apoptotic signaling in cancer cells (20).
Studies have shown that combination treatment of chemotherapeutic agents with TRAIL may sensitize cancer cells to TRAIL-mediated apoptosis through a variety of mechanisms, including death receptor upregulation (21–23), suppression of apoptotic inhibitors within the intrinsic pathway (24), and redistribution of death receptors into lipid rafts (25). However, no study has examined whether surviving oxaliplatin-resistant subpopulations of cancer cells have an enhanced sensitivity to TRAIL. In this study, we demonstrate that oxaliplatin-resistant cell lines show enhanced sensitivity to TRAIL-mediated apoptosis through lipid raft translocation of DR4. Moreover, we elucidate mechanisms which drive this sensitization using chemoresistant cell lines and blood samples collected from metastatic cancer patients. The response of oxaliplatin-resistant CRC to TRAIL-based therapeutics may prove critical to establishing promising new adjuvants for patients who have exhausted conventional treatment modalities.
Results
Oxaliplatin-resistant cell lines show enhanced TRAIL sensitivity
Cell viability of four colorectal cancer cell lines after 24 hr treatment with 0.1−1000 ng/ml of TRAIL was measured and compared to the viability of oxaliplatin-resistant (OxR) cell lines (Fig. 1A). Briefly, oxaliplatin-resistant cell lines were previously derived from exposure to increasing concentrations of oxaliplatin until a 10-fold increase in IC50 was achieved. Parental and OxR cells were treated with a range of oxaliplatin concentrations to ensure that chemoresistance was conserved after multiple passages in culture (Supplementary Fig. 1). Interestingly, oxaliplatin-resistant HT29, SW620 and HCT116 cell lines had increased maximum TRAIL sensitization levels compared to their parental counterparts, while SW480 cells showed similar or decreased sensitization levels (Supplementary Fig. 2). IC50 values demonstrate that a chemoresistant phenotype resulted in augmented TRAIL-mediated apoptosis in 2 cell lines (Fig. 1B). Importantly, cells were not treated with any oxaliplatin in quantifying the level of TRAIL sensitization, and oxaliplatin was not supplemented in cell culture media to exclude any possible effects from combination treatment. In SW620 cells, large differences in apoptosis were observed when treated with the highest concentration of TRAIL (1000 ng/ml) (Fig. 1C). Only 33.3% of parental cells were found to be in late-stage apoptosis after 24 hr, compared to 60.6% for OxR cells.

(A) SW620 (B) SW480 (C) HCT116 and (D) HT29 cells were treated with various concentrations of oxaliplatin for 72 hr and cell viability was measured using an MTT assay. IC50 values were calculated using a variable slope four parameter nonlinear regression. Error bars represent SEM (N=2, n=12).

(A) Sensitization of oxaliplatin-resistant SW620, HCT116, HT29 and SW480 cell lines compared to their parental counterparts as a function of TRAIL concentration. (B) Maximum TRAIL sensitization for each cell line between the tested concentrations of 0.1−1000 ng/ml. Error bars represent SEM.

(A) Oxaliplatin-resistant SW620, SW480, HCT116 and HT29 colon cancer cell lines demonstrate similar or enhanced sensitivity to TRAIL compared to their parental counterparts after 24 hr of treatment. N=3 (biological replicates); n=9 (technical replicates). (B) IC50 values were calculated using a variable slope four parameter nonlinear regression. (C) Representative Annexin V/PI flow plots comparing SW620 parental and OxR cell viability after 24 hr of treatment with 1000 ng/ml TRAIL. The four quadrants represent viable cells (bottom left), early apoptosis (bottom right), necrosis (top left) and late apoptosis (top right). (D) Representative flow plots of JC-1 assay after treatment with 1000 ng/ml of TRAIL. Mitochondrial depolarization is evidenced by decreased red fluorescence and increased green fluorescence. (E) Mitochondrial depolarization as a function of TRAIL concentration for SW620 parental and OxR cell lines. N=3 (n=9). **p<0.01 ****p<0.0001. For all graphs, error bars represent SD.
To determine if the observed differences in apoptosis were due to enhanced mitochondrial outer membrane permeability, a JC-1 dye was used. SW620 OxR cells exhibited over a 3-fold increase in the population of JC-1 red (-) cells, indicating increased mitochondrial depolarization (Fig. 1D). Mitochondrial depolarization was significantly enhanced in OxR cells for TRAIL concentrations of 50 ng/ml and higher (Fig. 1E). These results demonstrate that enhanced TRAIL mediated apoptosis is occurring, at least in part, via the intrinsic pathway and mitochondrial disruption.
Oxaliplatin-resistant derivatives have decreased CASP10 that has little consequence on TRAIL sensitization
Given that enhanced TRAIL-mediated apoptosis was found to occur via the mitochondrial pathway, gene expression of apoptotic transcripts was compared between the parental and OxR cells. RT-PCR human apoptosis profiler arrays were used to analyze transcripts within the SW620 and HCT116 cell lines, since these cells showed the highest degree of OxR TRAIL sensitization and exhibit different innate sensitivities to TRAIL (HCT116 cells are TRAIL-sensitive whereas SW620 cells are TRAIL-resistant). Interestingly, upon analyzing the RNA expression of 84 apoptotic transcripts, both cell lines shared similar profiles between parental and OxR derivatives. HCT116 OxR cells showed upregulated pro-apoptotic transcripts cytochrome-c and caspase-4 (Fig. 2A). Cytochrome-c is released from the mitochondria into the cytosol after mitochondrial permeabilization, binding to adaptor molecule apoptosis-protease activating factor 1 (Apaf-1) to form the apoptosome and initiate downstream caspase signaling (26). Caspase-4 is localized to the ER and initiates apoptosis in response to ER stress (27). Interestingly, SW620 OxR cells had upregulated Fas, a cell surface death receptor that acts similarly in apoptotic signaling as DR4/DR5 via binding of Fas ligand (28), and osteoprotegerin, a soluble decoy receptor that sequesters TRAIL and inhibits apoptosis (29) (Fig. 2B). Of note, both HCT116 and SW620 OxR cell lines had downregulated caspase-10. To determine whether this was of consequence to the observed TRAIL sensitization, an SW620 caspase-10 knockout cell line was created using a multi-guide sgRNA CRISPR-Cas9 approach. Knock-out (KO) efficiency was found to be 93% (Fig. 2C). The TRAIL sensitivity of this caspase-10 KO cell line was compared to a control cell line treated with Cas9 only. Caspase-10 KO cells showed only a slight decrease in cell viability after 24 hr of TRAIL treatment (Fig. 2D). The number of late-stage apoptotic cells remained similar between cell lines (Fig. 2E) and the maximum TRAIL sensitization observed was insignificant following caspase-10 KO (Fig. 2F).

(A-B) Volcano plots of RT-PCR Apoptosis Profiler arrays demonstrate downregulation of CASP10 in OxR phenotypes. (C) CRISPR/Cas9 knockout of caspase-10 in SW620 parental cells was confirmed via western blot. sgRNA/Cas9 ribonucleoprotein complexes reduced caspase-10 expression by 93% compared to cells treated with Cas9 alone. (D) CASP10 KO cells demonstrate slight decreases in viability when treated with TRAIL compared to Cas9 control. Error bars represent SD. N=3 (n=9). (E) Representative Annexin V/PI flow plots comparing SW620 parental (Cas9 only) and CASP10 KO cell viability after 24 hr of treatment with 1000 ng/ml TRAIL. (F) Depletion of caspase-10 did not have a significant effect on TRAIL sensitization. Error bars represent SEM. N=3 (n=9).
TRAIL-sensitized OxR cell lines have upregulated DR4
While changes in death receptor expression were insignificant at a transcriptional level, studies have demonstrated that chemoresistance can alter receptor abundance via mechanisms of translational regulation (30,31). Confocal microscopy showed that oxaliplatin-resistant cells have increased DR4 in both HCT116 (Fig 3A) and SW620 (Fig. 3B) cell lines. To quantify receptor expression, total DR4 area per cell was analyzed for at least 70 cells. Analysis showed oxaliplatin-resistant derivative cell lines had significantly increased DR4 area per cell (Fig. 3C). Flow cytometry staining of non-permeabilized cells was used to determine if this death receptor increase was also observed on the cell surface. Both HCT116 and SW620 cells had slight shifts in surface DR4 expression in OxR derivatives (Fig. 3D). Increases in DR4 expression of HCT116 and SW620 OxR derivatives was also confirmed via western blot (Fig. 3E). Total and surface DR4 expression was similar between parental and OxR derivatives in mildly sensitized HT29 cells and unsensitized SW480 cells (Supplementary Fig. 3A-C). Oxaliplatin-resistant HCT116, SW620 and HT29 cells all displayed increases in DR5 area per cell, while SW480 OxR cells had significant decreases in total DR5 expression (Supplementary Fig. 4A-D). However, for all four CRC cell lines, expression of surface DR5, analyzed via flow cytometry, remained relatively unchanged between parental and OxR derivatives (Supplementary Fig. 4E). Decoy receptors are surface receptors that, like death receptors, can bind to exogenous TRAIL. However, decoy receptor 1 (DcR1) and decoy receptor 2 (DcR2) are unable to activate the apoptotic pathway, making these receptors sequestering agents that competitively bind to TRAIL. While some studies have shown that chemotherapy-induced changes in TRAIL sensitivity have been linked to modulation or augmentation of decoy receptors (32), all four cell lines had similar surface DcR1 and DcR2 expression between parental and OxR derivatives (Supplementary Fig. 5).

(A-B) Confocal micrographs and DR4 quantification of SW480 (P N =71, OxR N=68) and HT29 cells (P N =75, OxR N=74), respectively. Red channel is DR4, green is lipid rafts and blue is DAPI (nuclei). Scale=30 μm. (C) Parental and OxR cells exhibit similar surface expression of DR4 in non-permeabilized cells analyzed via flow cytometry. (D) DR4/LR colocalization area per cell for SW480 (P N =71, OxR N=67) and HT29 (P N =72, OxR N=73) was found to be insignificant between parental and OxR phenotypes. Error bars represent SEM.

(A-D) Confocal micrographs and DR5 quantification of HCT116 (P N =73, OxR N=74), SW620 (P N =72, OxR N=71), SW480 (P N =75, OxR N=72) and HT29 cells (P N =73, OxR N=75), respectively. Red channel is death receptor 5, green is lipid rafts and blue is DAPI (nuclei). Scale=30 μm. ** p<0.01 ****p<0.0001. (E) OxR cells only demonstrate increased surface expression of DR5 in non-permeabilized SW620 cells. Error bars represent SEM.


(A-B) Confocal micrographs of HCT116 and SW620 cells, respectively. Red channel represents DR4, green is lipid rafts and blue is DAPI (nuclei). Scale=30 μm. (C) Quantification of DR4 area per cell in HCT116 (Par n=72, OxR n=70) and SW620 cells (Par n=71, OxR n=73) respectively. Error bars represent SEM. ***p<0.001 ****p<0.0001. (D) OxR cells have increased surface expression of DR4 in non-permeabilized cells analyzed via flow cytometry. (E) Western blots for DR4 in whole cell lysates confirm enhanced expression in OxR phenotypes.
TRAIL-sensitized OxR cell lines have enhanced colocalization of DR4 into lipid rafts
Binary projections of colocalization events between DR4 and lipid rafts demonstrate that OxR phenotypes had enhanced DR4 translocation into lipid rafts in HCT116 and SW620 cells (Fig. 4A). Quantification of total area of colocalization events showed that HCT116 OxR and SW620 OxR cells have significantly enhanced DR4 localized into lipid rafts, each with an over four-fold increase (Fig. 4B). The areas of DR4/LR colocalized events per cell were not significantly different in HT29 and SW480 cells (Supplementary Fig. 3D). The fold change in DR4/LR colocalization area between OxR and parental cells exhibited a strong linear correlation (0.93) with TRAIL sensitization (Fig. 4C). Colocalization of lipid rafts with DR5 was significantly enhanced only in HCT116 and HT29 cells, and correlating colocalization increase with TRAIL sensitization resulted in a weaker correlation of 0.39 (Supplementary Fig. 6A-C). To confirm DR4 redistribution into rafts, western blots for DR4 were run on plasma membrane-derived lipid raft fractions, isolated using non-ionic detergent and centrifugation. Isolated lipid raft fractions exhibited increases in DR4 for both HCT116 OxR and SW620 OxR cells. β-actin was used as a loading control to compare relative DR4 expression between parental and OxR cell lines, as it has been used previously to normalize to total protein content from plasma membrane lipid raft fractions (33) (Fig. 4D).

(A) Quantification of DR5/LR colocalization in HCT116 (P N =74, OxR N=74), SW620 (P N =71, OxR N=71), SW480 (P N =74, OxR N=73) and HT29 cells (P N =73, OxR N=75), respectively. *p<0.05 **p<0.01 ****p<0.0001. (B) Correlation of total DR5 area per cell and (C) DR5/LR colocalization with maximum TRAIL sensitization observed in OxR cells. Error bars represent SEM.

(A) Composite images and binary projections of DR4/LR colocalization areas in HCT116 and SW620 cell lines. Lipid raft and DR4 binary images were generated for a specified threshold, then multiplied by one another to generate images with positive pixels in double positive areas. Red is DR4, green is lipid rafts and blue is DAPI. Scale=30 μm. (B) Quantification of DR4 and lipid raft colocalization area per cell in HCT116 (Par n=73, OxR n=70) and SW620 cells (Par n=70, OxR n=72). **p<0.01 ****p<0.0001. (C) Correlation between the fold change in DR4/LR colocalization (OxR phenotype/parental) and maximum TRAIL sensitization observed by the OxR phenotype for each of the four cell lines. (D) Lipid raft fractions were isolated for each cell line and analyzed via western blot to further demonstrate enhanced DR4/LR colocalization in OxR cellular phenotypes. For all graphs, error bars represent SEM.
Altering lipid raft composition affects DR4/LR colocalization and has consequential effects on TRAIL sensitization
To probe the effects of LR modulation on DR4 clustering and TRAIL sensitization, SW620 OxR and HCT 116 OxR cells were treated with 5 μM of nystatin, a cholesterol sequestering agent that inhibits LR formation, in combination with TRAIL for 24 hr (Fig. 5A, G). Nystatin inhibited TRAIL-mediated apoptosis in SW620 OxR cells, significantly decreasing the maximum TRAIL sensitization from 55% to 23%. (Fig. 5B). Nystatin treatment was found to decrease DR4/LR colocalization by over 20-fold (Fig. 5C, M). Similar results were found in HCT116 OxR cells, as nystatin treatment decreased TRAIL sensitization from 62% to 1% (Fig. 5H), and decreased DR4/LR colocalization by over nine-fold (Fig. 5I). To demonstrate that enhancing LR formation would have pro-apoptotic effects, parental cells were treated with 70 μM of resveratrol in combination with TRAIL for 24 hr (Fig. 5D, J). Resveratrol has been shown to stabilize liquid-ordered domains in the plasma membrane and promote cholesterol/sphingolipid enriched lipid rafts (34). Resveratrol significantly sensitized parental SW620 cells to TRAIL irrespective of TRAIL concentration with a maximum TRAIL sensitization of 68% (Fig. 5E). Treatment with resveratrol coincided with significant augmentation of DR4/LR colocalization area, an increase of over six-fold (Fig. 5F, N). Similarly, parental HCT116 cells treated with resveratrol were sensitized 59% (Fig. 5K), corresponding with a nearly seven-fold increase in DR4/LR colocalization area per cell (Fig. 5L).

(A, G) SW620 OxR and HCT116 OxR cells, respectively, treated for 24 hr with a combination of TRAIL and 5 μM nystatin. (B, H) SW620 OxR and HCT116 OxR cells, respectively, showed a significant decrease in TRAIL sensitization when treated in combination with nystatin. N=3 (n=9). (C, I) Treatment with 5 μM nystatin significantly decreased DR4/LR colocalization area in SW620 OxR (n=39) and HCT116 OxR cells (n=39), respectively. (D, J) SW620 Par and HCT116 Par cells, respectively, treated for 24 hr with a combination of TRAIL and 70 μM resveratrol. N=3 (n=9). (E, K) SW620 Par and HCT116 Par cells, respectively, showed a significant increase in TRAIL sensitization when treated in combination with resveratrol. N=3 (n=9). (F, L) Treatment with 70 μM nystatin significantly increased DR4/LR colocalization area in SW620 Par (n=38) and HCT116 Par cells (n=39), respectively. (M) Representative composite images and binary projections of DR4/LR colocalization in SW620 OxR cells before and after nystatin treatment. (N) Representative composite images and binary projections of DR4/LR colocalization in parental SW620 cells before and after resveratrol treatment. Red represents DR4, green is lipid rafts and blue is DAPI. Scale=30 μm. **p<0.01 ****p<0.0001. (A, D, G, J) Error bars represent SD. (B, C, E, F, H, I, K, L) Error bars represent SEM.
S-Palmitoylation of DR4 is enhanced in oxaliplatin resistant cells
Palmitoylation is the reversible, post-translational addition of the saturated fatty acid palmitate to the cystine residue of proteins. Palmitoylation of DR4 has proven to be critical for receptor oligomerization and lipid raft translocation, both obligatory for effective TRAIL-mediated apoptotic signaling (35). S-palmitoylation of DR4 in SW620 parental and OxR cells was analyzed via protein precipitation, free thiol blocking, thioester cleavage of palmitate linkages, and exchange with a mass tag label to quantify the degree of palmitoylated protein. We discovered that DR4 has four distinct palmitoylated sites, the degree of which was enhanced in the oxaliplatin-resistant phenotype (Fig. 6A). Quantifying the percentage of palmitoylated protein in relation to input fraction (IFC) and non-mass tag preserved controls (APC-) validated that oxaliplatin-resistant cells had a significantly higher percentage of DR4 that was palmitoylated (55% compared to 43%) (Fig. 6B). To determine whether enhanced palmitoylation was specific to DR4 and not a ubiquitous characteristic of the OxR phenotype, total cellular protein palmitoylation was measured and analyzed via flow cytometry (Fig. 6C). Fluorescent azide labeling of palmitic acid confirmed that total cellular palmitoylation was unchanged between parental and OxR cells (Fig. 6D). These data suggest a novel mechanism for enhanced lipid raft colocalization in OxR cells via enhanced DR4 palmitoylation (Fig. 6E).

(A) Death receptor palmitoylation was determined by protein precipitation, thioester cleavage, and conjugation of a mass tag to enumerate and quantify the degree of S-palmitoylation between cellular phenotypes. Samples with a mass tag “B” have distinct bands of equivalent increasing mass, with each mass shift indicating a palmitoylated site. Input fraction control (IFC) samples “A” were collected before thioester cleavage, while the acyl preservation negative control (APC) samples were incubated with an acyl-preservation reagent to block free thiols in place of the mass tag reagent. (B) Quantification of the percentage of palmitoylated DR4, calculated by dividing the total palmitoylated mass shift intensity by the average intensity of IFC and APC for each sample. Error bars represent SD (N=3). (C) Parental and OxR cells were labeled with EZClickTM Palmitic Acid/ Fluorescent Azide staining and analyzed via flow cytometry to determine total protein palmitoylation between cell lines. Blue histograms represent parental SW620 cells and red histograms are SW620 OxR cells. Shaded histograms are background controls for each cell line (Palmitic Acid (-)/ Fluorescent Azide (+). (D) Quantification of median fluorescence intensity (MFI) shows no significant change in total palmitoylation between cellular phenotypes. (E) Proposed mechanism of enhanced TRAIL-mediated apoptosis in oxaliplatin-resistant cells.
Metastatic CRC patients show sensitivity to TRAIL liposomes despite chemoresistance
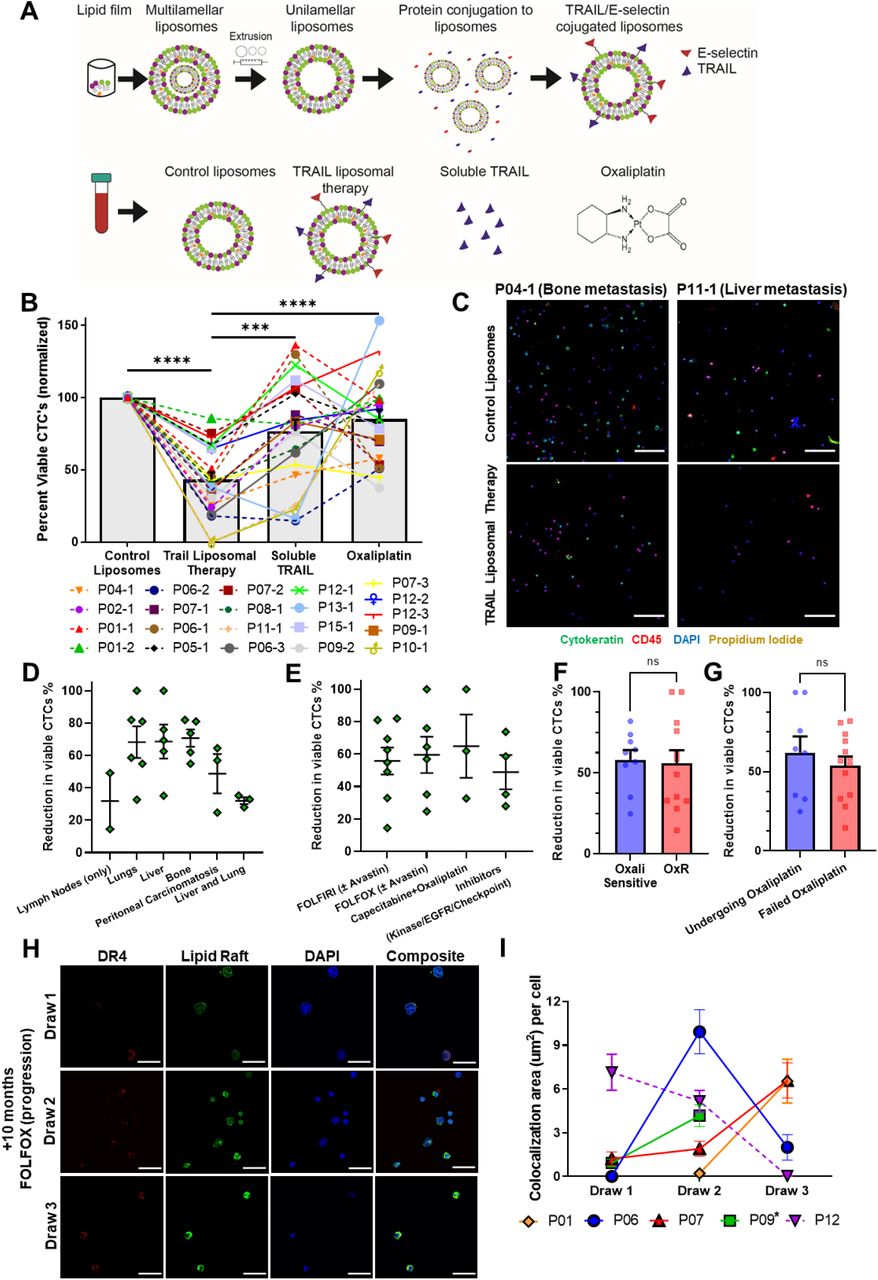
Despite promising specificity for cancer cells and low off-target toxicity, TRAIL’s translational relevance has been confounded by a short half-life and ineffective delivery modalities (36). In recent studies, our lab has demonstrated that TRAIL-coated leukocytes via the administration of liposomal TRAIL can be effective in eradicating circulating tumor cells (CTCs) in metastatic cancer patients (37). Briefly, liposomes were synthesized as previously described using a thin film hydration method, step-wise extrusion to 100 nm in diameter, and decoration with E-selectin and TRAIL via his-tag conjugation (38) (Fig. 7A). Undecorated “control” liposomes, soluble TRAIL (290 ng/ml; at equivalent concentrations as TRAIL liposomes) and oxaliplatin (at peak plasma concentrations of 5 μM) were used as controls. Blood was collected from 13 metastatic CRC patients who had previously undergone or were currently undergoing an oxaliplatin chemotherapy regimen (Table 1). Of these, five patients were analyzed at two to three timepoints over their respective treatment regimens. Blood samples were treated with TRAIL liposomes or controls under hematogenous circulatory shear conditions in a cone-and-plate viscometer. TRAIL liposomes significantly decreased the average percentage of viable CTCs in patient blood to 43%, compared to just 85% when treated with oxaliplatin (Fig. 7B). Viable CTCs were categorized as cells that were cytokeratin(+), DAPI(+), CD45(−) and propidium iodide(−) (Fig. 7C). TRAIL liposomal therapy reduced total viable CTC counts by 58% compared to control liposomes, and over 31% compared to oxaliplatin after just 4 hr in circulation (Supplementary Fig. 7). Of note, in two patients (P10 and P11), there were no detectable viable CTCs in blood samples treated with TRAIL liposomes. When categorizing patients by location of metastasis, patients that presented with metastases in the liver or bone saw a higher reduction in viable CTCs (69% and 71%, respectively) than patients with both lung and liver metastases (32%) (Fig. 7D). Patients had similar CTC reductions regardless of their treatment at the time of blood draw, while those undergoing FOLFOX or capecitabine + oxaliplatin had the highest reduction in CTCs (65% and 60%, respectively) (Fig. 7E). When categorizing patients as either oxaliplatin-sensitive or resistant, based on their response to 5μM oxaliplatin under hematogenous circulatory-shear conditions (threshold 80% CTC viability), there was no significant difference in CTC response to TRAIL liposomes (Fig. 7F). Likewise, grouping patients by those undergoing oxaliplatin chemotherapy and those who had failed oxaliplatin previously, there was no significant difference in reduction of viable CTCs from the administration of liposomal TRAIL (Fig. 7G). This demonstrates the utility of TRAIL liposomes to eradicate CTCs in both oxaliplatin-sensitive and oxaliplatin-resistant patients.

Bars represent mean of all patient samples and error bars represent SEM. Samples 12-1 and 09-2 showed very large CTC concentrations and were plotted using the alternative scale shown on the right. All other samples (and average) were plotted using the scale shown on the left.
(A) Liposomes were synthesized using a thin film hydration method, followed by extrusion and his-tag conjugation of TRAIL and E-selectin protein. Patient blood samples were treated in a cone-and-plate viscometer under hematological shear conditions with either control liposomes, TRAIL liposomes, soluble TRAIL, or oxaliplatin. (B) Effects of TRAIL liposomes and control treatments on the number of viable CTCs, normalized to control liposome treatment. Bars represent the average of all patients and time points. (N=21) **p<0.001 ****p<0.0001 (C) Representative micrographs of 2 patients showing neutralization of CTCs in TRAIL liposomes compared to control liposomes, stained for cytokeratin (green), DAPI (blue), CD45 (red), and propidium iodide (yellow). Scale bar = 100 μm. (D, E) Reduction in viable CTCs categorized by location of metastasis and treatment administered at the time of blood draw, respectively. (F) Patients were categorized as either oxaliplatin-sensitive (viability <80%, N=9) or oxaliplatin resistant (viability >80%, N=12) to compare changes in the reduction of viable CTCs. (G) Patients undergoing oxaliplatin chemotherapy at the time of blood draw (N=8) showed insignificant change in viable CTC reduction compared to patients that have previously failed oxaliplatin (N=13). (H) CTCs of Patient 7, stained for DR4 (red) and lipid rafts (green), demonstrating increased DR4/LR colocalization over the course of 10 months of FOLFOX treatment (with progressive disease despite treatment). Scale Bar = 30 μm. (I) Lipid raft/DR4 analysis of repeat patients, analyzing the changes in DR4 colocalization over the course of therapy. *Patient 9 died after draw 2, precluding further blood collection. For all graphs, error bars represent SEM.
Demographic and clinical information of metastatic CRC patients enrolled in this study.
Metastatic CRC patients have heterogeneous DR4/LR colocalization responses with ongoing chemotherapy treatment
Five patients provided multiple blood samples over the course of their treatment, as shown in Table 1. Of these, P07 was the only patient being treated with oxaliplatin (FOLFOX) over the course of all three blood draws. Patient 7 was undergoing the 1st cycle of FOLFOX at the time of draw one and progressed while on FOLFOX for draws two and three. However, DR4 and lipid raft staining of CTCs revealed increased DR4/LR colocalization despite progression (Fig. 7H). This same trend of enhanced CTC DR4/LR colocalization with treatment was observed in patients undergoing 5FU+Avastin (P01) and FOLFIRI (P09), while P06 (FOLFIRI) exhibited a bimodal response (Fig. 7I). Interestingly, P12 exhibited decreased colocalization in CTCs over the course of treatment. This is hypothesized to be a result of a switch in treatment (FOLFIRI + Avastin to cetuximab + encorafenib) due to progression after draw one.
Discussion
Our lab has demonstrated the utility of TRAIL nanoparticles to treat a variety of cancer types in vitro (38), in vivo (39), and in clinical samples (37). While frontline chemotherapy remains a viable option for patients with metastatic CRC, long term treatment frequently leads to chemoresistance, consequently yielding a more aggressive, robust phenotype that is unresponsive to many systemic treatments (7). Our results demonstrate that OxR colorectal cancer cells are particularly susceptible to TRAIL-mediated apoptosis. Additionally, the ability to eradicate over 57% of oxaliplatin-resistant CTCs in patient blood demonstrates the utility of TRAIL liposomes clinically. Moreover, two patients saw 100% neutralization of all viable CTCs following ex vivo TRAIL liposomal treatment. This demonstrates the natural cancer cell targeting ability and low toxicity of TRAIL-based therapeutics, presenting a promising cancer management strategy for patients who have exhausted traditional treatment modalities. Multiple other studies have demonstrated that platin-based chemotherapeutics, including oxaliplatin, are able to sensitize cancer cells to TRAIL-mediated apoptosis when treated in combination (12,21,22,32). However, no study has investigated the effects of oxaliplatin resistance on TRAIL-mediated apoptosis, and importantly, no study has demonstrated that oxaliplatin-resistant cancers can be exploited with TRAIL therapies.
Elucidating the mechanisms that drive OxR TRAIL sensitization will be key in establishing personalized treatment strategies in patients. Interestingly, genetic analysis of TRAIL-sensitized OXR cells demonstrated that OxR cells consistently exhibited downregulated caspase-10. This may seem counterintuitive; generally, caspase-10 is a caspase-8 analog that initiates the apoptotic pathway after binding to FADD. However, studies have demonstrated the potential anti-apoptotic effects of high caspase-10 expression (40,41). One recent study in particular demonstrated that upon activation with Fas ligand, caspase-10 reduced DISC association and activation of caspase-8, rewiring DISC signaling toward the NF-κB pathway and cell survival (42). However, this non-canonical caspase-10 signaling was found to have an insignificant effect on TRAIL sensitization as evidenced following caspase-10 depletion in parental cells. This establishes that the observed augmentation in TRAIL sensitivity is likely a result of a translational or post-translational effect induced by oxaliplatin resistance, rather than a transcriptional change within the apoptotic pathway.
We have demonstrated that augmentation of death receptors, particularly DR4, post-oxaliplatin resistance is one of the drivers of enhanced sensitization. One study found that cisplatin and 5-FU resistant side populations of colon cancer cells had upregulated DR4, consistent with our results (8). While holistic DR5 was upregulated in TRAIL-sensitized oxaliplatin-resistant cell lines, surface DR5 expression remained relatively unchanged compared to DR4. DR4 and DR5 augmentation appears to be independent from transcriptional upregulation, as there was no significant change in mRNA expression between OxR and parental cell lines. Increasing evidence demonstrates that chemoresistance affects small non-coding microRNA (miRNA) expression, which modulates transcriptional and translational processes (30,31). More specifically, studies have shown that oxaliplatin treatment and subsequent resistance in colorectal cancer cells alter miRNA expression, affecting signaling pathways within p53, epithelial-to-mesenchymal transition, and cell migration (43–45). Moving forward, further studies should examine the role of miRNA attenuation post-oxaliplatin resistance on the expression of death receptors, particularly DR4.
While sufficient DR4 expression is important for sustained apoptotic signaling, DR4 localization and compartmentalization within lipid rafts is unequivocally vital. Lipid rafts enhance the signaling capacity of surface receptors through a multitude of mechanisms (15). For example, LRs promote death receptor trimerization which is needed for signal transduction, act as concentrating platforms for DISC assembly and the recruitment of death domains, and protect DRs from internalization or enzymatic degradation (14). Additionally, juxtaposition of multiple DR trimers forms supramolecular entities, recently termed “CASMER” (18), capable of multivalent TRAIL signaling via extracellular pre-ligand assembly domains (PLADs) (20). Altering raft integrity via cholesterol sequestration using nystatin had profound impacts on reducing TRAIL sensitization within the OxR phenotype. Moreover, raft stabilization with resveratrol was able to enhance TRAIL sensitization within the parental phenotype, mirroring that observed in OxR cells. These changes in sensitivity were confirmed to coincide with enhanced clustering of DR4 within rafts. These results are consistent with other studies which have shown that pharmacological alterations of lipid rafts have profound impacts on Fas and TRAIL toxicity (19,46). Other studies have demonstrated that DR4 localization into lipid rafts is obligatory for TRAIL-induced apoptosis in hematological malignancies and non-small cell lung cancer, whereas DR5 has no dependence on raft translocation (17,20,47,48), consistent with our correlative data. Additionally, one study found that oxaliplatin combination treatment with TRAIL in gastric cancer cells enhances apoptotic signaling through casitas B-lineage lymphoma (CBL) regulation and death receptor redistribution into lipid rafts (25). While it is evident that rafts promote CASMER formation, death receptor oligomerization, and TRAIL-mediated apoptosis, the mechanism linking an oxaliplatin-resistant phenotype and enhanced DR4 localization within rafts has yet to be studied.
We have demonstrated that a mechanism for this phenomenon is via enhanced DR4 palmitoylation. Palmitoylation is the post-translational covalent attachment of a fatty acid tail to cysteine residues in the protein transmembrane domain, influencing protein trafficking and signaling. There is evidence that both Fas receptor and DR4 are palmitoylated, while DR5 is not (35,49). Furthermore, this post-translational modification has proven to be mandatory for DR4 oligomerization, lipid raft localization, and TRAIL-mediated apoptotic signaling (35). Interestingly, in a sensory neuron study in rats, palmitoylation of δ-Catenin in dorsal root ganglion was significantly increased after chronic oxaliplatin treatment (50). This is analogous to our results, as oxaliplatin-resistant colorectal cancer cells that had undergone chronic oxaliplatin treatment exhibited a higher percentage of palmitoylated DR4. This explains, at least in part, the observed increase in DR4/LR colocalization within the oxaliplatin-resistant phenotype. Additionally, the fact that palmitoylation is inherent to DR4 and not DR5 explains why TRAIL sensitization of oxaliplatin-resistant cells strongly correlated with lipid raft translocation of DR4, but not DR5. Further studies probing the differences in palmitoylation between parental and OxR phenotypes are warranted to provide a more detailed understanding of oxaliplatin-induced palmitoylation of specific membrane proteins.
We have also shown that these results translate clinically, as metastatic CRC patients exhibited increased DR4/LR colocalization with ongoing chemotherapy cycles. This was despite metastatic progression and worsening prognosis in some patients. To our knowledge, this is the first study investigating lipid raft/protein interactions in primary CTCs (15). Overall, our results demonstrate a novel mechanism for TRAIL sensitization in chemoresistant colorectal cancer cells via death receptor upregulation and localization within lipid rafts. Leveraging the enhanced signaling of death receptors in lipid rafts through mechanisms of drug delivery and lipid raft antagonization will be instrumental in therapeutic development for chemoresistant cancers.
Methods
Cell Culture
Colorectal cancer cell lines SW620 (ATCC, #CCL-227), SW480 (ATCC, #CCL-228), HCT116 (ATCC, #CCL-247), and HT29 (ATCC, #HTB-38), were purchased from American Type Culture Collection. SW620 and SW480 cells were cultured in Leibovitz’s L-15 cell culture medium (Gibco). HCT116 and HT29 cells were cultured in McCoy’s 5A cell culture medium (Gibco). Media was supplemented with 10% (v/v) fetal bovine serum and 1% (v/v) PenStrep, all purchased from Invitrogen. SW480 OxR, HCT116 OxR and HT29 OxR cells were obtained from MD Anderson Cancer Center Characterized Cell Line Core, supplied and generated by the Dr. Lee Ellis laboratory. SW620 OxR cells were obtained from Dr. Mika Hosokawa at Kobe Pharmaceutical University in Japan. Oxaliplatin-resistant derivative cell lines were cultured in the same medium as their parental counterparts. To prevent phenotypic drift of OxR lines, cells were used within 6 passages from the time they were received. To prevent chemotherapy-induced cytotoxicity in downstream experiments, oxaliplatin was not supplemented in OxR cell culture media. All cell lines were maintained in a humidified incubation chamber at 37°C and 5% CO2.
MTT Assay
SW620, SW620 OxR, HCT116, HCT116 OxR, HT29, HT29 OxR, SW480 and SW480 OxR cell lines were plated into tissue culture 96-well black-walled plates, at a concentration of 3,000 cells/well and incubated overnight at 37°C. A 10mM stock oxaliplatin suspension was created by dissolving oxaliplatin (MedChemExpress) in molecular grade water via sonication and heating. Cell culture media was replaced with oxaliplatin treatments ranging from 0−1000μM and incubated for 72 hr. Following treatments, an MTT assay (Abcam) was carried out according to the manufacturer’s protocol. The plates were then read using a plate reader at 590nm absorbance using gen5 software. Control wells containing the MTT solution without cells were used for background subtraction.
Annexin-V/PI Apoptosis Assay
Parental and OxR cell lines were plated at 100,000 cells/well onto 24-well plates and incubated overnight at 37°C. Wells were treated in triplicate with soluble human TRAIL (PeproTech) at concentrations of 0.1−1000 ng/ml and incubated for 24 hr. All cells were collected by recovering the supernatant and lifting remaining adhered cells using 0.25% Trypsin-EDTA (Gibco). Cells were washed thoroughly with HBSS with calcium and magnesium (Gibco). Cells were incubated for 15 min with FITC-conjugated Annexin-V and propidium iodide (PI) (BD Pharmingen) at room temperature (RT) in the absence of light and immediately analyzed using a Guava easyCyte 12HT benchtop flow cytometer (MilliporeSigma). Viable cells were identified as being negative for both Annexin-V and PI, early apoptotic cells as positive for Annexin-V only, late apoptotic cells were positive for both Annexin-V and PI, and necrotic cells were positive for PI only. Flow cytometry plots were analyzed using FlowJo v10.7.1 software. Control samples included: unstained negative control with no Annexin-V/PI to adjust for background and autofluorescence, and Annexin V only and PI only samples for gating apoptotic and necrotic populations.
The change in cell viability in response to TRAIL treatments between parental and OxR cells for each of the four CRC cell lines was calculated using the following TRAIL Sensitization equation:
 where the percentage of viable cells was normalized to untreated controls for each trial. TRAIL sensitization was calculated for each concentration of TRAIL, where the “Maximum TRAIL Sensitization” was the highest sensitization observed among all concentrations.
JC-1 (Mitochondrial Membrane Potential) Assay
SW620 cells (parental and OxR) were plated at 100,000 cells/well onto 24-well plates and incubated overnight. Cells were treated in triplicate with 50 ng/mL, 100 ng/mL, or 1000 ng/mL of TRAIL for 24 hr. Following treatment, cells were collected, washed thoroughly with HBSS without calcium and magnesium, and incubated for 15 min with JC-1 dye (Invitrogen) in accordance with the manufacturer’s protocol. JC-1 fluorescence was assessed via flow cytometry. Cells with healthy mitochondria were identified as having higher red fluorescence while those with depolarized mitochondria had lower red JC-1 fluorescence.
RT-PCR Profiler Array
2×10⁶ SW620 and HCT116 (parental and OxR) cells were seeded into a 100 mm diameter cell culture dish for 24 hr. Cells were lifted using a cell scraper and washed with HBSS with calcium and magnesium. RNA was isolated using the RNeasy Plus Mini Kit (Qiagen) according to the manufacturer’s protocol. RNA yield following isolation was determined using a UV5Nano spectrophotometer (Mettler Toledo). cDNA synthesis was completed using the RT2 First Strand Kit (Qiagen, 330404) using 0.5μg RNA per sample. RNA expression of 84 apoptotic genes was analyzed using the RT2 Profiler PCR Human Apoptosis Array (Qiagen, PAHS-012Z). Arrays were prepared according to the manufacturer’s protocols applied to the prepared cDNA samples. Profiler array plates were run on a CFX96 Touch Real Time PCR (Bio-Rad) using the following protocol: 1 cycle for 10 min at 95°C, 40 cycles of 95 °C for 15 s followed by 60°C for 60 s at a rate of 1°C/s. Melt curves were generated immediately following the PCR protocol. Cycle threshold (Ct) values were calculated using CFX Maestro Software (Bio-Rad). Data analysis was completed using the GeneGlobe Data Analysis Center (Qiagen). Volcano plots were generated in GraphPad Prism using calculated fold changes in gene expression between OxR and parental cells and their corresponding p-values.
CRISPR-Cas9 Knockout
Knockout of the CASP10 gene in SW620 cells was completed using the Gene Knockout Kit v2 – Human CASP10 kit with Cas9 2NLS Nuclease (Synthego). Ribonucleoprotein (RNP) complexes were made at a 9:1 ratio of sgRNA:Cas9 (90pmol:10pmol) in Gene Pulser® Electroporation Buffer (Bio-Rad, 1652677) and incubated for 10 min at RT. Cas9 control samples consisted of 10 pmol Cas9 with no sgRNA. RNP complexes were added to 200,000 cells in 200μL electroporation buffer (0.2 cm cuvette) and electroporated via the Gene Pulser Xcell™ Electroporation System (Bio-Rad) using exponential decay pulses (145V, 500μF, 1000ohm). Cells were immediately cultured in 12-well plates and allowed to recover for 7 days before measuring knockout efficiency.
Confocal Microscopy and Image Analysis
Parental and OxR cells were seeded onto polystyrene cell culture slides (Thermo Fisher Scientific). Cells were allowed to grow for 48 hr at 37°C. In samples treated with nystatin or resveratrol, cells were plated for 24 hr then treated for 24 hr before staining. Cells were washed and lipid rafts were stained using the Vybrant Alexa Fluor 488 Lipid Raft Labeling Kit (Invitrogen, V34403) according to the manufacturer’s protocol. Briefly, cells were incubated with Alexa488-conjugated cholera toxin subunit B (CT-B) followed by an anti-CT-B antibody to crosslink CT-B labeled rafts. Slides were fixed for 15 min with 4% paraformaldehyde (PFA) (Electron Microscopy Sciences) in PBS (Gibco) and then permeabilized using 1% Triton X-100 (MilliporeSigma) in PBS at RT. Slides were blocked for 2 hr with 5% goat serum (Thermo Fisher Scientific) and 5% bovine serum albumin (BSA; Sigma) in HBSS. Primary staining was done overnight at 4°C with either DR4 monoclonal antibody (Invitrogen, Clone DJR1) or DR5 monoclonal antibody (Invitrogen, Clone DJR2-4) in the blocking serum at a ratio of 1:50. Secondary staining was carried out with Alexa Fluor 555 goat anti-mouse IgG (H+L) (Invitrogen, A28180) for 30 min at RT (1:1000). Slides were stained with DAPI (Invitrogen, D1306) for 30 min at RT in the blocking solution at 1:1000. Washes were done twice between each step for 5 min each using 0.02% Tween20 in PBS. Slides were assembled using 10 μl of Vectrashield antifade mounting media (Vector Laboratories). Confocal imaging was performed using an LSM 880 (Carl Zeiss) with a 63x/1.40 Plan-Apochromat Oil, WD = 0.19 mm objective. At least five images were taken per sample.
Image analysis was performed in FIJI using a macro to automate quantification of raft and DR contents per cell. Briefly, all images were adjusted for background using the same thresholding specifications. The “analyze particles” feature was used to quantify the total area of lipid rafts and DR per outlined cell. Colocalization events were quantified by creating binary masks of DR and lipid raft events. For each gated cell, the lipid raft and DR binary masks were multiplied to create a binary projection of colocalized events. Cells with areas outside of three times the standard deviation from the mean were considered outliers and not included in the analysis.
Flow Cytometry (Surface DR Expression)
Parental and OxR cell lines were cultured to 70% confluency upon collection and split into 250,000 cells per sample. Cells were fixed in 4% PFA in HBSS for 15 min at RT, then blocked in a 100 μL 1% BSA solution for 30 min at 4°C, with 2X HBSS washes between each step. Cells suspensions of 100 μL were incubated for 15 min at RT with 2 μL Human TruStain FcX (Biolegend, 422301) to prevent nonspecific Fc receptor binding. Samples were immediately stained with 5 uL of either PE anti-human CD261 (DR4) (Biolegend, Clone DJR1), PE anti-human CD262 (DR5) (Biolegend, Clone DJR2-4), PE anti-human TRAILR3 (DcR1) (Biolegend, Clone DJR3), PE anti-human TRAILR4 (DcR2) (R&DSystems, Clone 104918) or PE Mouse IgG1 κ Isotype Control (Biolegend, Clone MOPC-21) for 30 min at 4°C. Samples were washed twice with HBSS and analyzed using a Guava easyCyte flow cytometer.
Resveratrol and Nystatin
Parental SW620 and HCT116 cells were plated at 100,000 cells/well onto 24-well plates and incubated overnight at 37°C. Cells were treated with 70μM resveratrol (Sigma) in combination with 0.1−1000 ng/ml of TRAIL for 24 hr. Following treatment, cells were collected for Annexin-V/PI apoptosis assay. TRAIL sensitization was calculated using the following equation:
 where TRAIL + resv treatments were normalized to resveratrol treatment in the absence of TRAIL to account for any resveratrol-associated cytotoxicity.
SW620 OxR and HCT116 OxR cells were plated at 100,000 cells/well onto 24-well plates and incubated overnight at 37°C. Cells were treated with nystatin (Thermo Fisher Scientific) in combination with 0.1−1000 ng/ml of TRAIL. Following treatment, cells were collected for Annexin-V/PI apoptosis assay. TRAIL sensitization was calculated using the following equation:
 where TRAIL + nys treatments were normalized to nystatin treatment in the absence of TRAIL to account for any nystatin associated cytotoxicity.
Western Blot
Lipid rafts were isolated according to manufacturer’s protocol using the Minute™ Plasma Membrane-Derived Lipid Raft Isolation Kit (Invent Biotech, LR-042). Cell lysates and lipid raft protein isolates were prepared by sonication in 4x Laemmli sample buffer (Bio-Rad, 1610747) and then loaded into 10% SDS-polyacrylamide gels for electrophoresis. Protein transfer onto a PVDF membrane was carried out overnight, and then blocked with Intercept (TBS) Blocking Buffer (LICOR, 927-60001) at RT for an hour. Primary antibody incubation occurred overnight at 4°C for DR4 (Cell Signaling Technology, 42533) at 1:500 dilution and caspase-10 (Thermo Fisher Scientific, PA5-29649) at a 1:1000 dilution in LICOR buffer. Cell lysate protein bands were normalized to GAPDH (EMD Millipore, MAB347) at 1:2000 dilution, while lipid raft isolates were normalized to β-actin (Santa Cruz, 47778) at 1:1000 dilution in LICOR blocking buffer. Western blots were quantified using the Licor Odyssey Fc with IRDye 800CW goat anti-rabbit secondary antibody (LICOR, 926-32211) and IRDye 800CW goat anti-mouse secondary antibody (LICOR, 926-32210) at a dilution of 2:15000.
Palmitoylation Assay
Cells were grown to 70% confluency in a 100 mm tissue culture dish. Palmitoylation of DR4 was measured using the SiteCounter™ S-Palmitoylated Protein Kit (Badrilla, K010312) according to the manufacturer’s protocol. Input fraction controls (IFC) were obtained prior to thioester cleavage. Acyl preservation negative controls (APC-) were obtained by using an acyl preserving reagent instead of mass-tag conjugation. Western blots were run for DR4 following the “Western Blot” protocol described above. The percentage of DR4 palmitoylation was calculated by dividing the total intensity of all palmitoylated bands (mass tag) divided by the average intensity of the IFC and APC(-) bands for that sample.
To measure the amount of total palmitoylated protein, cells were cultured in 96-well plates at a concentration of 20,000 cells/well. The EZClick™ Palmitoylated Protein Assay Kit (BioVision, K416-100) was used in accordance with the manufacturer’s protocol. Cells were incubated overnight with either 1x EZClick™ Palmitic Acid label in media or culture media with no label (background control). Cells were recovered and stained using EZClick™ Fluorescent Azide, then analyzed via flow cytometry for shifts in FL2-H intensity. Median fluorescence intensity (MFI) was calculated by subtracting each sample by the background intensity (Palmitic Acid label [−]/ Fluorescent Azide [+]).
Patient blood samples
Peripheral whole blood samples of 10 mL were collected from 13 metastatic CRC patients after informed consent. Patient criteria for this study included the following: presenting with metastatic CRC at the time of blood draw and undergone (or undergoing) oxaliplatin-containing chemotherapy (i.e. FOLFOX). Additionally, 5 patients had samples collected through their respective chemotherapy regimens. De-identified blood samples were transported from the Guthrie Clinic to Vanderbilt University and processed within 24 hr. Blood samples were split for treatment (8 ml) and death receptor/lipid raft staining (1-2 ml).
Ex-vivo treatment of colorectal cancer patient blood samples
For the treated samples, 2 mL of blood were treated with either 40 μL of control liposomes, 40μl TRAIL/E-selectin conjugated liposomes (290 ng/mL of TRAIL), 6 μL (290 ng/mL) of soluble TRAIL or 2 μL (5 μM) of oxaliplatin. Liposomes were synthesized using a thin film hydration method followed by extrusion and his-tag conjugation as previously described (38). The aliquots were incubated for 4 hr in a cone-and-plate viscometer (Brookfield LVDVII) at 60 RPM. Prior to incubation, the cone-and-plate viscometers were blocked using 5% BSA for 30 min. After 4 hr, the blood aliquots were washed from the viscometer’s spindle and cup by using twice the volume of HBSS without calcium and magnesium. Blood aliquots were placed over twice the volume of Ficoll (GE Healthcare) to separate out mononuclear cells within the buffy coat. CTCs were enriched using a negative selection kit with CD45 magnetic beads (Mylteni Biotech, 130-045-801) following the manufacturer’s protocol (37).
The resulting isolated CTCs were placed in cell culture overnight using RPMI media supplemented with 10% FBS. After 1 day in culture, the cells were recovered from the tissue culture plate and stained with 100 μL of propidium iodide for 15 min. Cells were washed, fixed with 4% PFA and cytospun onto microscope slides using a Cytospin 3 (Shandon). Samples were then permeabilized and blocked with 100 μL of 0.25% Triton-X (Sigma) for 15 min and 100 μL of blocking solution (5% BSA and 5% goat serum) for 1 hr, respectively. Cells were stained with anti-CD45 conjugated with biotin (Biolegend, Clone HI30) for 45 min. Finally, cells were stained with 100 μL of 10 μg/mL of streptavidin-conjugated Alexa Fluor 647 (Thermo Fisher Scientific, S21374) and 10 μg/mL of anti-cytokeratin conjugated with FITC (BD Pharmingen, Clone CAM5.2) for 45 min. Cells were washed 3X after each staining incubation using 200 μL of 0.02% Tween20 in PBS. Cells were stained with 10 μL of DAPI mounting media (Vector Laboratories), covered with a coverslip (No. 1.5, VWR), and sealed with nail polish.
Five images per sample were taken at random locations using an LSM 710 (Carl Zeiss) with a 20x/0.8 objective. The cell number in the sample was scaled up by multiplying by the relative area (slide area/frame area). Viable tumor cells were identified using the following criteria: (i) positive for DAPI, (ii) negative for CD45, (iii) positive for cytokeratin and (iv) negative for propidium iodide.
Staining of lipid raft and death receptors in primary CTCs
CTCs from the remainder of the patient blood were isolated and cytospun onto slides as described above. Death receptors and lipid rafts were stained and analyzed as detailed above in “Confocal Microscopy and Image Analysis”. Lipid rafts were stained using the Vybrant Alexa Fluor 555 Lipid Raft Labeling Kit (Invitrogen, V34404) after CTCs were spun onto slides. Secondary staining for DR4 and DR5 was completed using goat anti-mouse Alexa Fluor 647 (Thermo Fisher Scientific, A21235). Cells were also stained with FITC-conjugated cytokeratin, as described above, to positively identify CTCs for analysis.
Statistical analysis
Data sets were plotted and analyzed using GraphPad Prism 9. When comparing two groups, a symmetric unpaired t-test was used with p < 0.05 considered significant. One-way ANOVA with multiple comparisons was used for multiple groups with p < 0.05 considered significant. At least three independent biological replicates were used for each experiment unless otherwise stated.
Acknowledgements
This work was funded by the National Institutes of Health, Grant No. R01CA203991 to M.R.K. We thank all the cancer patients who donated blood samples for this study. We also thank the Oncology Research Coordinator at Guthrie Clinic, Michelle Hunter, for supervising blood sample collection and shipment. Finally, the authors thank to Dr. Mika Hosokawa and Dr. Lee Ellis for providing us with the oxaliplatin-resistant cell lines.
Footnotes
Conflict of Interest: The authors have no conflicts of interest to disclose.
References


