

Abstract
Improved understanding of the genetic architecture of the proteome through studies of larger sample size, ethnic diversity, and advanced methods can facilitate the identification of causal mechanisms for complex traits. We conducted a comprehensive analysis of the common variant cis-regulatory genetic architecture of 4,665 plasma proteins or protein complexes ascertained using an aptamer-based technology from 7,213 European Americans (EA) and 1,871 African Americans (AA) from the Atherosclerosis Risk in Communities (ARIC) cohort study. We identified and fine-mapped 1,992 plasma proteins or protein complexes in EA and 1,605 in AA, with majority overlapping in EA, which had at least one significant single-nucleotide polymorphism (SNP) in cis region. Estimates of cis-heritability (cis-h2) for plasma proteins were similar across the two ethnic groups (median cis-h2 = 0.09 for EA and 0.10 for AA). Elastic-net based models for cis-SNP-based protein prediction produced high accuracy for the EA population (median R2/cis-h2=0.79), and notably for the AA (median R2/cis-h2 = 0.69), despite the much smaller sample size in the latter population. We illustrate the application of these models to conduct proteome-wide association studies (PWAS) for two related complex traits, serum urate and gout, and further conduct conditional analyses to interpret findings in the context of those from transcriptome-wide association studies (TWAS).
Introduction
Genome-wide association studies (GWAS) to date have cumulatively mapped tens of thousands of loci containing common genetic variants associated with complex traits 1, 2. As the majority of the variants are in non-coding regions 3, 4, researchers have focused on understanding the role of gene-expression regulation as a mechanism for complex trait genetic association 5–9. There is known to be substantial overlap between genetic variations regulating gene expression and those influencing complex traits 7–9, but only a small fraction of GWAS heritability of complex traits can be explained by mediating effects through bulk gene-expression 10, 11. While it is likely that future studies with more extensive cell-type specific gene expression measurements will lead to additional insights, comprehensive understanding of causal mechanisms for complex traits will ultimately require the integration of data from various types of genomic and molecular traits 11. Proteins, the ultimate product of the transcripts, are subject to post-translational modifications and processing, and contain additional information that cannot be detected at the level of the transcriptome.
Recently, major opportunities have arisen to substantially increase our understanding of the causal role of proteins in complex traits due to availability of an accurate high throughput technology for measuring proteins in different types of samples 12, 13. The plasma proteome has received particular attention as it can capture a wide variety of proteins that are active in different biological processes, including but not limited to circulation 14. The proteome is often dysregulated by diseases, and it is highly amenable for drug targeting 15, 16. A number of genetic studies have identified protein quantitative trait loci (pQTL), for plasma 15–19 as well as some other tissues 20–22, and noted that pQTLs are enriched for GWAS associations across an array of complex traits 15–21. Studies have used pQTLs as instruments in conducting Mendelian randomization (MR) analysis to identify causative proteins, and hence potential therapeutic targets, across diverse phenotypes 23–25, including COVID-19 related outcomes 18.
In spite of substantial progress, understanding of the genetic architecture of the proteome and its overlap with those of gene expressions and complex traits remains limited. While the sample size for some studies 16–19 of the plasma proteome has involved thousands of individuals, it is likely that identification of pQTLs remains incomplete, both due to a lack of availability of a more comprehensive set of proteins and due to low power for detection of associations with small effect-sizes. Further, existing proteomic studies, like many other genomic and genetic studies, have been mostly restricted to samples of European ancestry, and thus cannot inform potential heterogeneity by ancestry. Additionally, advanced tools for incorporating pQTL information for exploring causal effects of proteins, such as those available for analysis of gene-expression 26, 27, are lacking. A framework is needed for better understanding of the causal underpinning of genetic correlations of a complex trait with proteins measured in a given sample, such as plasma, in the context of their complex relationship with gene-expressions across various tissues.
In this article, we report results from a comprehensive set of analyses of cis-genetic regulation of the plasma proteome in the large European and African American cohorts of the Atherosclerosis Risk in Communities (ARIC) study 28. We carry out a set of association and fine-mapping analyses to identify common (minor allele frequency (MAF) > 1%) cis-pQTLs and compare results across ethnic groups to explore shared and unique genetic architecture. For each ethnic group, we characterize cis-heritability of the proteome due to common variants and build models for genetically predicting levels of plasma proteins. Using these models, we then conduct a proteome-wide association studies (PWAS) of serum urate 29, an important biomarker of purine metabolism with high heritability and large available large GWAS summary statistics, and the complex disease gout, which can result from high urate levels 29. We show how a bivariate PWAS analysis adjusting for genetically imputed gene-expression levels across various tissues can provide additional insight into whether activity of proteins in the plasma has underlying causal effects. We create a searchable database for exploring fine mapping results and deposit requited model coefficients for conducting PWAS based on external GWAS summary-statistics.
Results
Identification of cis-pQTLs Across European and African American Populations
We performed separate cis-pQTL analyses for the African American (AA) and European American (EA) populations in the ARIC study, with total sample sizes of N=1,871 and N=7,213, respectively (see Methods). We performed analyses based on plasma samples collected during the third visit of the cohort 28 (see Supplementary Table 1 for sample characteristics). Relative concentrations of plasma proteins or protein complexes were measured by modified aptamers (‘SOMAmer reagents’, hereafter referred to as SOMAmers) 12, 13.
We defined cis-regions to be +/- 1Mb of the transcription start site (TSS) in the cis-pQTL analysis. After quality control (see Methods), we analyzed 4,665 SOMAmers, which tagged proteins or protein complexes encoded by 4,445 genes, and 203 of them were tagged by more than one SOMAmer. In the cis-regions, we analyzed 10,961,088 common (MAF> 1%) single-nucleotide polymorphisms (SNPs) for AA and 6,181,856 for EA with imputed or genotyped data after quality filtering (see Methods). For identification of pQTLs, we performed regression analyses of protein levels after residualizing by a number of potential confounders, including the, sex, age, 10 genetic principal components (PCs) and the study sites at v3. In addition, similar to eQTL analyses 8, we adjusted for Probabilistic Estimation of Expression Residuals (PEER) factors 30, 31 to account for hidden confounders that may influence clusters of proteins. We observed that the inclusion of PEER factors substantially improved power for pQTL studies due to reduced residual variance (Fig. 1a, Supplementary Table 2). The number of discoveries increased as a function of the number of PEER factors included but reached a plateau after using 120 factors for the EA sample and 70 for the smaller AA sample. In all subsequent analyses, protein levels measured by SOMAmers were residualized with respect to these sets of PEER factors and then normalized by quantile-quantile transformation (see Methods).
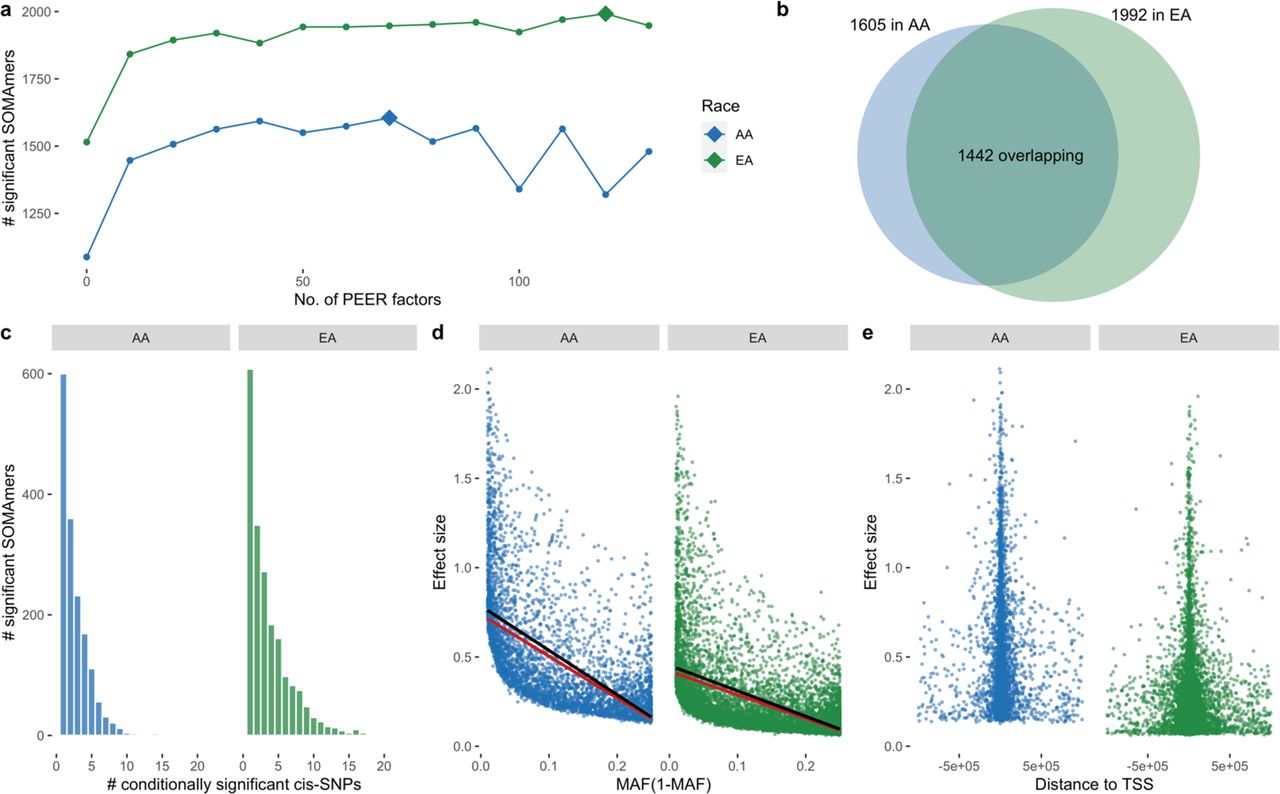
(a) Number of significant SOMAmers identified versus number of PEER factors used in models. Diamonds mark the numbers of PEER factors used in the following analysis which identify maximal number of significant SOMAmers. (b) Venn diagram of significant SOMAmers in EA and AA. (c) Number of conditional independent cis-pQTLs per significant SOMAmer. (d) Effect sizes of conditionally significant cis-pQTLs vs. MAF(1-MAF). Lines are fitted with (red) and without inverse-power weights (black). (e) Effect sizes of conditionally significant cis-pQTLs v.s. distance to TSS.
Significant cis-SNPs were defined by false discovery rate (FDR) < 5%, and significant SOMAmers were defined as having at least one significant cis-SNPs near the putative protein’s gene. We identified 1,992 significant SOMAmers measuring plasma proteins or protein complexes encoded by 1,928 genes in EA (Supplementary Table 3.1) and 1,605 significant SOMAmers measuring plasma proteins or protein complexes encoded by 1,559 genes in AA (Supplementary Table 3.2), and the majority of the discoveries remains significant even with a more stringent FDR < 1% (90% in EA and 87% in AA). There were 1,442 significant SOMAmers (measuring plasma proteins or protein complexes encoded by 1,400 genes) that overlapped across the two ancestry groups (Fig. 1b). Compared to plasma pQTL studies conducted in the past in European ancestry sample16, 17, we tripled the number of cis-pGenes, i.e. genes that with at least one identified cis-pQTL, 17, 18and we successfully replicated over 92% (761/820) of previously identified ones (Supplementary Table 4).
Using stepwise regression 32, 33, we identified multiple independent cis-pQTLs for 1,005 (62.6%) and 1,384 (69.5%) of the significant SOMAmers in AA and EA populations, respectively (Supplementary Tables 5.1 and 5.2). While the majority of significant SOMAmers had only one or two independent pQTLs, a substantial fraction showed a larger number of independent signals (52% for EA and 40% for AA; Fig. 1c). Genotypic effect sizes for independent pQTLs were inversely associated with minor allele frequencies even after accounting for bias due to power for detection 34(Fig. 1d). In a down-sampled analysis of the EA population so that it has the same sample size as that of AA, we found that the pQTLs detected in the AA population tended to replicate at a higher rate in the EA population than vice versa (e.g. 74.1% vs 59.7%, p-value=0.001).
Proteome-wide association analysis of Serum Urate Level and and Gout. Analysis was done based on external summary statistics data from GWAS of serum urate level (N=288,649) and gout(N=754,056) and the imputation models for plasma proteome built from the ARIC study for a total of 1319 plasma proteins with significant cis-heritability. Results are also shown for most significant genes from Transcriptome Wide Association Studies around +/- 500kb region of the TSS of sentinel protein for two specific trait-relevant tissues (whole blood and liver) and across all tissues. Further result from bivariate analysis of genetically imputed level of the plasma protein and that of the expression for most significant gene from the TWAS analysis are reported in terms of conditional p-values. All TWAS analyses were performed based on models available from the GTEX V7 datasets.
The independent pQTLs appeared to be more concentrated near the TSS of corresponding pGenes, i.e. genes with significant cis-pQTLs, in the AA than the EA population, and the genotypic effect sizes for pQTLs decreased with distance from the TSS in both populations (Fig. 1e). Those conditional independent pQTLs, which were identified in both populations (383 SNP-SOMAmer pairs), showed highly-correlated effect sizes (r = 0.79) across the two populations (Supplementary Fig. 1).
Cis-eQTL Overlap and Functional Enrichment
To evaluate the extent to which the pQTL variants were also involved in modulating transcriptional levels, we cross referenced the cis-pQTLs with cis-eQTLs from the Genotype-Tissue Expression project (GTEx V8) 9 across 49 different tissues (See Methods). Since the GTEx cohort is primarily of European ancestry, we restricted the analysis to the cis-pQTLs identified in the EA cohort only. We found that, approximately 65.3% of the cis-pQTLs or their LD-surroragtes (r2 > 0.8), were also significant cis-eQTLs for the same gene in at least one tissue. The highest proportion of overlap was found in tibial nerve (31.1%; N = 619 in GTEx V8) which might be in part driven by the larger sample size for this tissue and hence the higher power for detecting cis-eQTLs (Supplementary Fig. 2, Supplementary Table 6). Among the variants that were both cis-pQTLs in our analysis (or in high LD with a cis-pQTL) and cis-eQTL in at least one tissue in GTEx, we found that 13.9% were cis-eQTLs in only one tissue and, 10.6% were cis-eQTLs in more than 20 different tissues and 0.9% were cis-eQTLs across all 49 tissues (Supplementary Fig. 3). This is in contrast with recent findings from the GTEx consortium data, where a large proportion (approximately 20%) of the cis-eQTLs were found to have effects across all the tissues 35.
Results from the association analysis of molecular phenotypes, like plasma proteins, integrated with the functional and regulatory annotation of the genome offer a powerful way to understand the molecular mechanisms and consequences of genetic regulatory effects. The functional annotations were curated from several sources like variant effect predictor (VEP) 36, Loss-Of-Function Transcript Effect Estimator (LOFTEE) 37 and Ensembl Regulatory Build 38. As expected, we found that the cis-pQTLs have significant enrichments for several genomic regulatory elements in both EA and AA (See Methods, Supplementary Fig. 4, Supplementary Table 7) including promoters, missense variants and stop-gain variants and several others, indicating that the identified pQTLs encompassed a large spectrum of regulatory functions. In general, the enrichment patterns were very similar between two populations. In both, we found that cis-pQTLs were most strongly enriched for presence of stop-gain variation, which leads to the premature shortening of proteins. One notable difference between the two populations is the evidence of strong and statistically enrichment for cis-pQTLs for splice acceptor in the AA, but not in the EA population.
Fine Mapping
To identify the causal variants underlying the significant cis-pQTLs for plasma proteins i.e. SOMAmers, we first conducted population-specific fine-mapping for the 1,442 significant SOMAmers that had at least one cis-pQTL both in EA and AA using SuSiE 39 (Supplementary Table 8). Comparing the 95% credible sets, we found that the average number of variants in the credible sets were significantly smaller in AA compared to that in EA (29.41 in EA vs 10.87 in AA; p-value = 2.23×10-59; Fig. 2a). Additionally, the number of single-effect components extracted by SuSiE, which represent distinct LD-clusters across which underlying causal variants have independent effects, was also found to be significantly lower (p-value = 3.15×10⁻⁹) in AA (Fig. 2d). To demonstrate the added value of including two ethnic populations in identifying possibly shared causal variants, we further conducted a trans-ethnic meta-analysis using MANTRA 40, which accounts for effect heterogeneity among populations and constructed a 95% credible set of shared causal variants by ranking variants according to their Bayes factor (See Methods).
As an example of the fine mapping analysis, we illustrate the fine-mapped cis-region (+/- 1Mb) for the HBZ pGene on chromosome 16p13.3 corresponding to the Hemoglobin subunit zeta protein (HBAZ; Uniprot ID: P02008), which is involved in oxygen transport and metal-binding mechanisms 41, 42 and has been associated with thalassemia 43. Single variant pQTL association results show that there are several significant cis-pQTL associations both in EA and AA populations (Fig. 2b-c). Fine-mapping within the EA individuals identifies a 95% credible set of seven variants (Fig. 2e) while that within the AA individuals identifies a smaller credible set of two variants only (Fig. 2f), owing to the lower average LD in the region within the AA population compared to the EA population. Trans-ethnic meta-analysis using MANTRA further points to a single variant rs2541645 (16:161106 G>T) as the possible shared causal variant between AA and EA. This variant was in fact the most significantly associated cis-pQTL for HBZ pGene in AA but not in EA, and had some evidence of differences in minor allele frequency across the populations (MAF = 0.32 in EA vs 0.18 in AA). This SNP is a strong eQTL for HBZ expression in GTEx V8 whole blood (p-value = 6.7×10-80), and associated with several erythrocyte related outcomes in the UK Biobank including mean corpuscular hemoglobin (p-value=1.1×10⁻¹⁴) and reticulocyte fraction of red cells (p-value=3.2×10⁻⁹) 44, 45. Together, these findings suggest that rs2541645 might be a regulatory variant for HBZ protein levels and possibly warrant further study on downstream phenotypic consequences especially in the context of blood related mechanisms and thalassemia.
Analysis of Cis-Heritability of Proteins and Building Protein Imputation Model
We estimated cis-heritability (cis-h2) of plasma proteins or protein complexes, i.e. the proportion of variance of protein levels that could be explained by all SNPs in cis-regions of their encoded genes, using the GCTA software 46. We found 1,376 and 1,319 SOMAmers to have significant cis-h2 (p-value < 0.01) for the AA and EA populations, respectively, and 1,098 of them overlapped. The majority of those significant cis-heritable SOMAmers also had cis-pQTLs identified in our study (95% for AA and 99% for EA, Supplementary Table 9). The cis-h2 for significant cis-heritable protein SOMAmers (median cis-h2 = 0.10 for AA, and 0.09 for EA; mean cis-h2 = 0.14 for AA, and 0.13 for EA) tended to be substantially smaller than those reported for gene-expression 47 in two related tissues 14, liver (median cis-h2 = 0.31, and mean cis-h2 = 0.34) and whole blood (median cis-h2= 0.17, and mean cis-h2 = 0.22) (Fig. 3a). The pattern is expected given the closer relationship of genetic variation to transcripts than to the encoded proteins, which are subject to additional processing including post-translational modifications.

(a) Distribution of size of credible sets and (b) that of number of independent SuSIE clusters across 1442 proteins that had at least one significant cis-pQTL both in European American and African American populations. The power of fine-mapping using data from two populations is further illustrated using the example of HBZ. Regional Manhattan plots based on single SNP p-value and SuSIE posterior probabilities are shown for EA (Panel c and d) and AA (Panel e and f). The SNP rs2541645 (chr16: 161106; marked in diamond shape throughout) is detected as the shared causal cis-pQTL across the two ancestries by MANTRA. This variant has been used as the LD reference variant throughout.

(a) Estimated cis-h2 for significantly cis-heritable gene expression and plasma protein levels (p-value < 0.01). (b) Prediction R2 standardized by estimated cis-h2 (R2/cis-h2) using prediction models trained by: the most significant cis-SNP; and Elastic Net using all cis-SNPs. (c) Cross-ethnic prediction accuracy by applying prediction models to individuals from their opposite races (d) Cis-regulated genetic correlation between plasma proteins and expression levels for underlying genes across all GTEx V7 tissues.
Next, we built protein imputation models for cis-heritable SOMAmers using an elastic net machine learning method as has been used for modeling gene-expression 26. In this analysis, we used all cis-SNPs located within 500Kb of the putative genes’ TSS and selected tuning parameters through five-fold cross-validation within each population. The median accuracy for the elastic-net models for protein predictions, evaluated as the prediction R2 standardized by cis-heritability (R2/cis-h2), was 0.69 and 0.79 for the AA and EA populations, respectively. Compared with imputation models built only with the top cis-pQTL, the elastic net models gained, on average, 24.8% and 24.7% of accuracy for the AA and EA populations, respectively (Fig. 3b, Supplementary Table 10). In cross-ethnic analysis, we found that models trained in the EA population performed much worse in the AA population than the converse, in spite of a much smaller sample size in AA, again indicating the advantage of the latter population to identify causal pQTLs which are more likely to have robust effects across ethnic groups (Fig. 3c).
Cis-regulated Genetic Correlation between Plasma Proteome and Transcriptome across a variety of tissues
We then explored cis-regulated genetic correlation between plasma proteins and expression levels for the underlying genes across a variety of tissues. We used genotype data for Europeans from the Phase-3 1000 Genome Project (1000G) 48 to evaluate Pearson’s correlation coefficients between genotypically-imputed protein levels, and genotypically-imputed expression levels, with the latter being computed based on models that have been previously built by Gusev et al. 27 based on data from the GTEx (V7) consortium (Supplementary Table 10-11). The analysis was restricted to the European population due to the lack of gene-expression imputation models for AA population. Overall, genetically imputed plasma proteins are only moderately correlated with those for gene expression levels (Fig. 3d, Supplementary Table 12). Consistent with previous studies 49, we find that plasma proteins show strongest genetic correlations with genes expression levels in the liver, the organ responsible for the synthesis of many highly abundant plasma proteins. The lowest genetic correlations were seen for brain-related tissues, which may be due to the blood-brain barrier.
Proteome-wide Association Study (PWAS) of Complex Traits
We illustrate an application of the protein imputation model by conducting proteome-wide association studies for two related complex traits: (1) serum urate, a highly heritable biomarker of health representing the end product of purine metabolism in humans, and (2) gout, a complex disease caused by urate crystal deposition in the setting of elevated urate levels and the resulting inflammatory response. We obtained GWAS summary-statistics data for these traits generated by the CKDGen Consortium 29 involving a total sample size of N=288,649 and N=754,056, respectively. As this GWAS was conducted primarily in EA population, we carried out the PWAS analysis using the model generated for the EA population.
We used a computational pipeline previously developed for conducting TWAS based on GWAS summary-statistics 27, 50 to carry out an analogous PWAS analysis. Simulation studies showed that type 1 error of PWAS analysis based on our protein imputation weights are well controlled (Supplementary Fig. 5). Among a total of 1,319 SOMAmers that showed significant cis-heritability, we identified 8 and 4 distinct loci containing genes for which the encoded proteins or protein complexes were found to be significantly (p-value < 3.8×10⁻⁵) associated with serum urate and gout, respectively (Fig. 4, Supplementary Fig. 6). We further examined whether the PWAS signals could be explained by cis-genetic regulation of the expression of nearby (1Mb region around) genes and vice versa by performing bivariate analysis conditioning on imputed expression values for nearby genes that are found to be significantly associated based on TWAS analysis (based on GTEx V7). For the nearby TWAS analysis, we considered significance of genes based on two trait-relevant tissues available in GTEx V7, namely whole blood and liver, but also explored other tissues more broadly (see Methods, Table 1, Supplementary Table 13).

Miami plot for the PWAS analysis of serum urate level and gout. Each point represents a test of association between the cis-genetic regulated plasma protein level of a gene and the phenotypes (serum urate level in the upper panel, and gout in the lower panel) ordered by the genomic position based on genome build GRCh37 on the x axis and the -log10(p-value) for the association strength on the y axis. The black horizontal dash line is the significance threshold after Bonferroni correction for the total number of plasma protein imputation models (3.8×10⁻⁵). Figure is truncated the y-axis at -log10(p-value) = 30.
The conditional PWAS analysis of serum urate revealed several interesting patterns (Table 1a). First, there were PWAS signals that could be largely explained by nearby TWAS signals for the corresponding transcript (e.g., INHBB in liver, cor(P,T)=0.97; and SNUPN in whole blood, cor(P,T)=0.73). This may be indicative of genetic loci influencing serum urate through altered gene expression and corresponding protein levels. These instances can aid in the identification of the most likely gene in GWAS of complex traits as exemplified by the known association between the INHBB locus and serum urate in GWAS 51, and nominate both molecular mechanisms as well as potentially relevant tissues. Second, there were also PWAS signals that could be largely explained by the TWAS signal of the corresponding transcript in other tissues (e.g. B3GAT3 in brain), but not in whole blood or liver. Such examples support the notion that the evaluation of diverse potential tissues of action may be important to characterize these genetic loci. Third, there were PWAS signals fairly independent from the most significant nearby TWAS signals of other transcripts. An interesting finding in this regard was the locus on chromosome 4q22.1, where PWAS identified SPP1, whereas TWAS in whole blood implicated ABCG2. Experimental studies have clearly established that ABCG2 is a membrane transporter responsible for urate excretion through kidney and gut 52, 53, and a causal missense variant driving the GWAS association signal for serum urate and gout has been identified 52. Since ABCG2 was not among the quantified plasma proteins, as is the case for many other intracellular and membrane proteins that are not actively secreted, no PWAS for ABCG2 was available. The interpretation of loci in which the same gene is not implicated both on the protein and on the transcript level with regards to its association with serum urate can therefore be more complicated. Fourth, for the locus around INHBC, the plasma PWAS signal for INHBC explains the most significant nearby TWAS signal R3HDM2 in Thyroid (conditional p-value of TWAS signal = 1.68×10⁻²) but not vice versa (conditional p-value of PWAS signal = 5.62×10⁻³⁵).
Lastly, the conditional PWAS of gout revealed a finding illustrating the potential to detect therapeutic targets to treat gout: the PWAS yielded a significant association with Interleukin 1 Receptor Antagonist (ILNR1, p-value = 1.58×10⁻⁵), supported also at the level of the transcriptome in skin (Table 1b). ILNR1 is the target of anakinra, an anti-inflammatory drug approved to treat rheumatoid arthritis. A recent randomized, double-blind, placebo-controlled trial of acute gout flares showed anakinra to be non-inferior to usual treatment 54, nominating it as an effective treatment alternative for acute, highly painful gout flares. The fact that the corresponding genetic locus did not show evidence for significant association in GWAS of gout underscores the potential of PWAS, and raises the possibility that additional implicated proteins in our study such as INHBB may represent attractive therapeutic targets to lower serum urate and prevent gout.
Discussion
We present a comprehensive analysis of cis-genetic regulation of the plasma proteome based on a large study of African and European Americans. Availability of a large number of proteins or protein complexes in the SOMAScan platform as well as large sample size that almost tripled the number of cis-pGenes, i.e. genes that with at least one identified cis-pQTL, compared to studies conducted in the past 16, 17, and we successfully replicated over 92% (761/820) of the previously identified cis-pGenes. Further, analysis of data from both European American (EA) and African American (AA) samples allowed us to understand consistent genetic regulation of proteins across ethnic groups and better characterize sets of causal pQTLs through Bi-ethnic fine-mapping analysis. We developed models for plasma protein imputation separately for EA and AA populations and make them publicly available to facilitate future proteome wide association studies. Using large-scale GWAS summary-statistics from two complex traits, we illustrate how PWAS can complement TWAS for the identification of causal genes, protein products, underlying tissues of action and the potential for drug repurposing for complex traits.
Our analysis provides several important insights into the cis-genetic architecture of plasma proteome. We observe that cis-heritability of protein levels tends to be smaller compared to those of gene expression levels in related tissues (Fig. 3a), a pattern consistent with the central dogma of DNA regulating the proteome through the transcriptome and the widespread presence of post-translational modification. Further, while cis-heritability of plasma proteome is fairly comparable across EA and AA populations, the effect-size distribution for the underlying pQTLs have important heterogeneity. In particular, cis-genetic regulation of proteome could be attributed to a number of pQTLs, with larger average effect-sizes, in the AA population compared to their EA counterpart. While such a pattern could arise due to difference in linkage disequilibrium as opposed to heterogeneity in true effect of the causal pQTLs, there are important consequences irrespectively. We observed that in an equal-sample analysis, pQTLs identified in AA population tend to be more replicable in EA population than vice versa. In addition, the predictive performance of protein imputation model for the AA population, in spite of its much smaller sample size, is comparable to that for the EA population (Fig. 3b), and cross-population performance of such model is much better from AA to EA population than the converse (Fig. 3c).
We carry out population-specific and cross-population fine-mapping analysis for the identification of unique and shared causal pQTLs across the two ethnic groups (Fig. 2). Population-specific analysis using SuSiE indicated that both the total size of “credible set” and the number of “independent clusters” of causal pQTL is much smaller in the AA than the EA population. We show that cross-ethnic meta-analysis further can help to pin point causal pQTLs that are shared across populations, resulting in the exemplary identification of a regulatory variant in HBZ locus that affects red blood cell traits in the general population. We have created a searchable database (see resources) for exploring and visualizing all results from these analyses.
We demonstrate applications of protein imputation models for conducting proteome-wide association studies (PWAS) for complex traits. In particular, we consider a framework for interpreting results from PWAS in conjunction with analogous results from TWAS. While pQTLs and eQTLs have substantial overlap, genetic correlation of gene-expression in tissues and protein level in plasma due to cis-genetic regulation is only moderate (Fig. 3d). As a result, it is possible to explore potentially independent causal effects of tissue-level gene-expressions, or proteins when such data are available, and plasma proteins using a bivariate framework. We observe that majority of the significant PWAS loci found for serum urate and gout could be explained by nearby TWAS signals in tissues closely related to the trait (whole blood and liver). In contrast, the PWAS signals in some loci were explained by gene expression in other tissues not closely related to plasma. For these loci, underlying level of proteins or protein complexes in some relevant tissues may be causal, and the plasma level of them may only represent “leakage” from those tissues. We found evidence of one region, namely R3HDM2-INHBC, for both serum urate and gout where plasma PWAS signal clearly explained its nearby strong TWAS signal indicating that the plasma level of underlying protein itself may be causal. However, any kind of causal interpretation of these results are complicated by the fact that most significant genes within a region across PWAS and TWAS analyses were often not identical, and in the future more comprehensive protein measurements across different tissues will be needed to further pinpoint target genes and tissues of actions.
Our study has several limitations. First, while the SOMAscan platform we used included SOMAmers for close to 5000 proteins or protein complexes, it does not provide coverage for the entire plasma proteome. Second, we focused on analysis of common SNPs (MAF >1%) to maintain adequate power of various analyses, but it is likely that significant heritability of plasma proteome could be explained by uncommon and rare variants. Third, we restricted our PWAS analysis for serum urate and gout to only EA population due to lack of sufficiently large underlying GWAS datasets for the AA population and thus could not contrast findings across populations. Fourth, the power of our PWAS analysis conditional on TWAS signals may be affected by small sample size of underlying eQTL datasets for some of the individual tissues. In the future, we plan to update analysis based on TWAS models that are expected to be available from the recently released GTEX V8 datasets, which have considerably increased sample size across many tissues compared to V7. Fifth, we used plasma measurement from a single visit of ARIC participants to perform cross-sectional analysis of proteins. In the future, it will be of interest to identify pQTLs associated with dynamic patterns of protein levels using longitudinal data available from multiple visits of these same participants.
In conclusion, our study provides comprehensive and cross-population insight into cis-genetic architecture of plasma proteome. We generate resources and propose frameworks for utilizing our results for the mapping of causal protein-regulating variants and investigating the causal role of plasma proteins on complex traits. Future studies are merited for more comprehensive coverage of proteome, exploring the role of uncommon and rare variants, and modeling longitudinal variation of the proteome.
Author Contribution
J.Z, J.C. and N.C conceived the project. J.Z. and D.D. carried out all data analyses with supervision from N.C. B.H. developed the PWAS tutorial and fine-mapping exploration website with assistance from J.Z., D.D. and N.C. J.Z., D.D., A.K. and N.C. drafted the manuscript and A.T., P.S., M.G. and B.Y. provided comments. All co-authors reviewed and approved the final version of the manuscript.
URLs
PWAS tutorial and fine-mapping exploration, http://nilanjanchatterjeelab.org/pwas. 1000 Genomes Phase 3, http://www.internationalgenome.org/category/phase-3/; UK Biobank, https://www.ukbiobank.ac.uk/; GTEx: https://gtexportal.org/home/datasets; CKDGen, http://ckdgen.imbi.uni-freiburg.de/; R statistical software, http://www.R-project.org/; PLINK 2.0, https://www.cog-genomics.org/plink/2.0/; GCTA, https://cnsgenomics.com/software/gcta/; QTLtools: https://qtltools.github.io/qtltools/; GWAS Atlas: https://atlas.ctglab.nl/PheWAS; VEP, https://useast.ensembl.org/info/docs/tools/vep/; LOFTEE, https://github.com/konradjk/loftee; SuSIE, https://github.com/stephenslab/susieR; FUSION/TWAS, http://gusevlab.org/projects/fusion/; MANTRA: Available on request from author Dr. Andrew P. Morris.
Methods
Study population
Our study was conducted using individual-level data from the Atherosclerosis Risk in Communities (ARIC) study 28. The ARIC study is an ongoing community-based cohort study of individuals that initially enrolled 15,792 participants 1987 and 1989 from four communities across the US: Washington County, Maryland; suburbs of Minneapolis, Minnesota; Forsyth County, North Carolina; and Jackson, Mississippi. The third visit (v3) occurred in 1993-1995, when blood samples used for the measurement of the proteome were collected. A total of 9,084 participants with cleaned plasma protein data (1,871 African Americans (AA), 7,213 European Americans (EA)) after the exclusions of participants without genotype data (see below) were retained in the current study.
Plasma protein data and genetic data
The relative concentrations of plasma proteins or protein complexes from the blood samples were measured by SomaLogic Inc. (Boulder, Colorado, US) using an aptamer (SOMAmer)-based approach 12, 13. Details for this approach and the SomaLogic normalization pipeline can be found in a technical white paper on the manufacturer’s website, http://somalogic.com/wp-content/uploads/2017/06/SSM-002-Technical-White-Paper_010916_LSM1.pdf, and https://somalogic.com/wp-content/uploads/2017/06/SSM-071-Rev-0-Technical-Note-SOMAscan-Data-Standardization.pdf. Of the 4,877 SOMAmers measuring 4,697 unique proteins or protein complexes, we excluded 43 SOMAmers that mapped to multiple gene targets, and 9 SOMAmers whose target proteins’ encoding genes do not have position record in the biomaRt database 55. By restricting analysis to plasma proteins or protein complexes encoded by autosomal genes, we further excluded 158 genes on the X chromosome, and 2 genes on the Y chromosome. In total, 4,665 SOMAmers measuring 4,491 unique proteins or protein complexes encoded by 4,445 autosomal genes passed quality control, and were retained in the current study.
Genotyping of ARIC samples was performed on the Affymetrix 6.0 DNA microarray and imputed to the TOPMed reference panel (Freeze 5b) 56, 57. The SNPs with imputation quality R2 < 0.8, call rates <90%, Hardy-Weinberg equilibrium p-values < 10-6, or minor allele frequencies <1% were excluded.
Plasma protein data processing
Additional variation in high-throughput gene expression data which is not due to genetic variants has been found to impact the power of eQTL discoveries 8, 9. The fluctuations of internal environment, experimental deviations, and batch effects can all have large influence on high throughput measurements 30. To study whether this type of variance exists in our high-throughput plasma protein data measured by the SOMAmers, we performed analysis of variance (ANOVA) test for non-genetic factors to the first 10 principal components (PCs) of log-transformed relative abundance of SOMAmers. Non-genetic factors include common covariates (age, sex, and study sites at v3), as well as batch effects (plate run date, scanner ID, plate position, and subarray). (Supplementary Table 14).
To account for those non-genetic variances, which may obscure genetic association signals, we used the Probabilistic Estimation of Expression Residuals (PEER) method to estimate a set of latent covariates, and put them linearly in the model 31. The number of PEER factors for each ancestry was selected to maximize the number of significant SOMAmers, i.e. SOMAmers with at least one significant cis-SNPs near the putative protein’s gene.
The log-transformed relative abundance of SOMAmers were adjusted in a linear regression model including PEER factors and the covariates sex, age, study site, and 10 genetic principal components (PCs). The residuals from this linear regression were then rank-inverse normalized to avoid the influence of extreme values, and were used as the corrected-protein quantification in the analysis. By analyzing up to 200 PEER factors in increments of 10, the maximum of number of significant SOMAmers were achieved at 120 and 70 PEER factors for EA and AA respectively (Fig. 1a). Thus, the corrected-protein quantifications adjusted for 120 and 70 PEER factors were used as phenotypes in the analysis of the EA and AA populations, respectively.
Significant SOMAmers discovery
Significant SOMAmers are defined as SOMAmers with at least one significant cis-SNPs near the putative protein’s gene. The mapping window was defined to be 1-Mb upstream and downstream of the target protein-coding genes’ transcription start site (TSS). Gene position of GRCh38 reference genome was obtained from Ensembl BioMart database55. Common linear regression procedures for association tests using the Bonferroni correction to p-values usually proves to be overly stringent and results in many false negatives 33. To overcome this issue, adaptive permutation approach implemented in QTLtools were applied 32. We used one hundred permutations to empirically characterize the null distribution of the strongest signal which is fitted by a Beta distribution. The p-values of association adjusted for the number of variants tested in cis given by the fitted beta distribution were used to calculate gene-level q-values. By controlling the false discovery rate (FDR) threshold ≤ 0.05, significant SOMAmers were identified.
Conditional independent cis-pQTL mapping
It is likely that the significant SOMAmers have multiple proximal cis-SNPs which have independent effects. To identify conditional independent signals for them, we performed conditional independent cis-pQTL mapping using the conditional pass implemented in QTLtools 32.The algorithm first uses permutations to derive a nominal p-value per SOMAmer, then it uses a forward-backward stepwise regression to select the conditional independent signals. In this process, it automatically learns the number of independent signals per SOMAmer, determines the best candidate SNP per signal, and assign all significant hits to the independent signal they relate to. For each candidate signal, its assigned SNPs were then tested in the backward pass, controlling for the rest of candidate signals. If no SNP is significant at the previous nominal p-value threshold, the candidate signal will be dropped; otherwise, the SNP with smallest backward-p-value will be chosen as the lead SNP for this candidate signal. The algorithm may assign the same SNPs to multiple candidate signals, and sometimes a SNP is chosen to be lead SNP for multiple signals. In this case, we only keep the signal with smallest rank.
To account for power for detection in Fig. 1d, we adjusted the SNP effect sizes by assigning a weight of the inverse of statistical power. The statistical power can be derived as following.
The SNP effect is chi-square distributed with one degree of freedom (df). It is a central chi-square distribution under the null, and a non-central chi-square distribution under the alternative hypothesis. The non-centrality parameter (NCP), λ, is  , where N is the number of samples in study, f is the MAF of the SNP, and β is the SNP effect 58, 59. The significance threshold for the test statistic under the central chi-square distribution of df 1 and the SOMAmer’s nominal p-value cut-off, p0, is t0 = F−1(1 − p0, 1), where F(⋅, 1) is the cumulative distribution function (CDF) of a central chi-square distribution of df 1. The statistical power can be computed by pr(T > t0 | Ha) = 1 − G(t0, λ, 1), where T is the test statistics and G(⋅, λ, 1) is the CDF of the non-central chi-square distribution with NCP of λ and df 1. The weight assigned to SNP effect is (1 − G(t0, λ, 1))−1.
Previous discovered cis-pGenes
Cis-pGene is defined as the gene whose encoding protein has at least one significant cis-pQTLs. A list of existing pQTL studies were given by Karsten Suhre (http://www.metabolomix.com/a-table-of-all-published-gwas-with-proteomics/) 24. We focus on two recent pQTL studies with large number of proteins assayed and samples in study. The first was performed in the INTERVAL study with UK blood donors 16. The other was performed in the AGES-RS cohort 17. From their publicly available GWAS results of plasma proteins or protein complexes, we filtered out only cis-associations and thus cis-pGenes. There are 820 unique cis-pGenes identified in either of the two studies (649 and 557 respectively). For these 820 cis-pGenes, we examined whether they were identified in our current study as well (significance level at FDR=0.05 in the entire study).
Cis-eQTL overlap
We cross referenced the identified cis-pQTLs against cis-eQTLs identified in GTEx (V8) across different tissues. For each SOMAmer, we first extracted the independent cis-pQTLs, meaning the variants having conditionally significant association along with all the variants in high LD (r2 > 0.8) with them. Using this list of variants across 1,992 SOMAmers which had at least one cis-pQTL in EA, we calculated the percentage overlap with the set of known cis-eQTLs for the same gene identified in each tissue of GTEx V8 9. Since the GTEx cohort is primarily of European ancestry, we restricted this analysis to EA only.
Function annotations enrichment
We performed an enrichment analysis of the cis-pQTLs for known regulatory elements in the genome to identify the broad functions of the cis-pQTLs. The functional annotations were curated from variant effect predictor (VEP) 36, Loss-Of-Function Transcript Effect Estimator (LOFTEE) 37 and Ensembl Regulatory Build 38 as was reported in the recent GTEx analysis. For each SOMAmer, we used independent cis-pQTLs, meaning the variants having the significant association in a conditional regression for evaluating functional enrichment. For each functional category we calculated a standard enrichment statistic and evaluated its significance through Fisher’s exact test.
Bi-ethnic fine-mapping analysis
To identify the set of possibly causal variants regulating plasma protein levels we performed fine-mapping 60 using the cis-variants for each of the 1,442 SOMAmers that had at least one cis-pQTL in both EA and AA using SuSiE 39. For a given SOMAmer and corresponding variants in the cis-regulatory region, SuSiE outputs a number of single effect components or credible sets that have 95% probability to contain a variant with non-zero causal effect. We set the maximum number of such singlet effect components to be 10, meaning broadly we allow for the possibility that a SOMAmer can be regulated by 10 causal variants at best. Further, SuSiE also outputs the posterior inclusion probability for each variant. This corresponds to the probability of the variant to be included in one of the credible sets.
To perform trans-ethnic meta-analysis, we used MANTRA 40 which is based on a computationally intensive Bayesian partition accounting for the shared similarity in closely related populations assuming the same underlying allelic effect. It models the effect heterogeneity among distant populations by clustering according to the shared ancestry and allelic effects. MANTRA outputs the Bayes factor for association of a variant across ancestries. Using this, we constructed the posterior probability 61 of the kth variant (πk) as:

where δk is the Bayes factor for association of the kth variant obtained using trans-ethnic meta-analysis in MANTRA and the sum in the denominator is across all the variants in the cis-region. We performed MANTRA using the variants common to EA and AA and subsequently calculated the posterior probabilities.
Cis-SNP heritability estimation
Cis-SNP heritability (cis-h2) of SOMAmers were estimated using the REML algorithm implemented in GCTA 46. Genotypes of SNPs in a cis-window around the encoding gene of the corresponding target protein of a SOMAmer were used to estimate genetic relatedness matrix (GRM). Corrected-protein quantifications and the estimated GRM were input to the GCTA to estimate cis-h2 using the REML algorithm (option --reml --reml-no-constrain). A maximum number of 100 iterations was set to determine the convergence of the estimation algorithm. The nonzero cis-heritability was tested using a likelihood-ratio test for the first genetic variance component (option --reml-lrt 1) with significance level of 0.01. Plasma protein SOMAmers with negative estimate cis-h2 estimates were excluded. Cis window size of 1Mb and 2Mb were examined, and there were no significant differences between the heritability estimations (Supplementary Table 15). Therefore, when we trained imputation models, to save computation burden, we used 1Mb window size.
Imputation models trained jointly with cis-SNPs
Using the TWAS / FUSION software 27, we built imputation models for 1,376 (AA) and 1,319 (EA) SOMAmers with significant non-zero cis-h2. Imputation model for a SOMAmer was trained jointly by elastic net using cis-SNPs in 1Mb window around the TSS of the encoding gene of the target protein. The performance of models was evaluated by adjusted prediction accuracy which was defined as the 5-fold cross-validated R2 between predicted and true values standardized by cis-h2. The imputation models built only with the top cis-pQTL was used as a baseline comparison.
Trans-ethnic prediction capacity
To study the trans-ethnic prediction performance, we applied the genetic imputation models to the genotypes of individuals from their opposite races in ARIC. The cross-ethnic prediction performance is evaluated by the R2 between predicted and true values standardized by cis-h2.
Cis-regulated genetic correlation between plasma proteome and transcriptome across a variety of tissues
To study the cis-regulated genetic correlation between plasma protein and expression levels for underlying genes across a variety of tissues, we computed the Pearson’s correlation coefficients between genotypically-imputed plasma proteins and genotypically-imputed gene expressions for the same gene for individuals from Phase-3 1000 Genome Project (1000G) 48 by applying weights of their imputation models to the genotype data. Gene expression imputation models in all GTex V7 tissues were obtained from TWAS / FUSION (http://gusevlab.org/projects/fusion/#reference-functional-data (see Supplementary Table 11 for the full list, Supplementary Table 10 for their prediction accuracies). Here we only studied for genes significant cis-heritable (p-value of cis-h2 from GCTA < 0.01) for both gene expression levels and plasma protein levels (Supplementary Table 12). Since the gene expression imputation models were derived using participants predominantly from European ancestry from GTEx V7, the plasma protein imputation models here were restricted to EA-derived only. If multiple transcripts or SOMAmers were measured for the same gene, the sum of their imputed levels was used to represent “the total level of the gene” in terms of gene expression or plasma protein level.
Proteome-wide association studies (PWAS)
As an analog of TWAS, weights in the imputation models of SOMAmers can be applied to summary level data using the test statistics derived in TWAS / FUSION. The mathematical derivation can be found in the original paper 27. The type 1 error of PWAS is well-controlled in simulation using null phenotypes simulated from UK Biobank using 337,484 unrelated European ancestry individuals 62. Note that the enet model coefficients for 8 proteins in AA and 1 protein in EA were all zero. These proteins were excluded in PWAS analysis, and therefore, 1,371 (AA) and 1,318 (EA) imputation models were available in PWAS. The significance level for PWAS loci identification is adjusted by of the total number of imputation models for significant cis-heritable plasma proteins or protein complexes (p-value < 0.05/1,318=3.8×10-5 in EA which was used in our PWAS of serum urate and gout). As discussed in a recent TWAS paper 47, multiple SOMAmers, whose encoding genes of their target proteins or protein complexes locate closely in a locus, were sometimes identified at the same time. To identify distinct loci, a 1Mb region (+/- 500 Kb of TSS) was defined around each encoding gene of the target protein of significant SOMAmers, and overlapping regions were merged. The sentinel association in each locus was selected to be the top PWAS candidate hit for this region.
Bivariate conditional analysis for PWAS and TWAS
For each significant PWAS loci, we searched all TWAS genes nearby (+/-500Kb around) whose TSS locate within 500Kb of the TSS of its sentinel PWAS gene, and selected the one with the smallest TWAS p-value. The position of genes in TWAS (based on GTEx V7 based on genome build GRCh37) and PWAS (based on genome build GRCh38) were matched using the UCSC genome browser webtool (https://genome.ucsc.edu/cgi-bin/hgLiftOver) 63.
We first performed the nearby TWAS in two trait-relevant tissues, whole blood and liver, for serum urate and gout. Note that kidney is also a trait-relevant tissue, but there is no imputation model trained with GTEx V7 data available on TWAS / FUSION for kidney. The significance of the nearby TWAS hit was determined by significance level after Bonferroni Correction (0.05/∑relevant tissues #transcripts with imputation models).
Using z-scores (Zp for PWAS gene and ZT for TWAS gene) and the cis-regulated genetic correlation (ρ) of each PWAS gene and the most significant TWAS gene nearby, we performed conditional analysis 64 to study the potential underlying mechanism of gene expressions in tissue or proteins in plasma. The cis-regulated genetic correlation was computed from the Pearson’s correlation coefficients between genotypically-imputed plasma proteins and genotypically-imputed gene expressions for individuals from 1000G by applying weights of their imputation models to the genotype data. The least-squares estimate of the PWAS z-score conditional on TWAS z-score is
 and its variance is

So the conditional z-score of the PWAS gene is

Similarly, the conditional z-score of the nearby TWAS gene is

We then performed the same procedure for all nearby TWAS genes in all GTEx V7 tissues. Using Bonferroni Correction for the total number of transcripts with imputation models (0.05/∑all GTex tissues #transcripts with imputation models), we identified the tissues which have at least one significant TWAS gene in the PWAS significant loci. The most significant TWAS gene in this region and its corresponding tissue were recorded, and then used to perform conditional analysis.
Acknowledgements
The Atherosclerosis Risk in Communities study has been funded in whole or in part with Federal funds from the National Heart, Lung, and Blood Institute, National Institutes of Health, Department of Health and Human Services, under Contract nos. (HHSN268201700001I, HHSN268201700002I, HHSN268201700003I, HHSN268201700005I, HHSN268201700004I). The authors thank the staff and participants of the ARIC study for their important contributions. SomaLogic provided assays as an in-kind contribution in a data flex change collaboration agreement. The UK BioBank data was obtained under the UK BioBank resource application 17712. Research of J.Z., D.D. and N.C. was supported R01 grant from the National Human Genome Research Institute [1 R01 HG010480-01]. The work of A.K. was funded by the Deutsche Forschungsgemeinschaft (DFG, German Research Foundation) – Project-ID 431984000 – SFB 1453.
References


