

Abstract
High grade serous ovarian cancer (HGSOC) is the most common and aggressive type of ovarian cancer. Platinum resistance is a common occurrence in HGSOC and a main cause of tumor relapse resulting in high patient mortality rates. Recurrent ovarian cancer is enriched in aldehyde dehydrogenase (ALDH)+ ovarian cancer stem cells (OCSCs), which are resistant to platinum agents. We demonstrated that acute platinum treatment induced a DNA damage-dependent decrease in BRCA1 levels through BRCA1 promoter DNA hypermethylation. In a parallel pathway associated with G2/M arrest, platinum treatment also induced an increase in expression of NAMPT, the rate limiting regulator of NAD+ production from the salvage pathway, and NAD+ levels, the cofactor required for ALDH activity. Both decreased BRCA1 and increased NAD+ levels were required for the platinum-induced enrichment of OCSCs, and inhibition of both DNA methyltransferases (DNMT) and NAMPT synergistically abrogated the platinum-induced increase in OCSCs. We conclude that these two separate pathways lead to platinum-induced OCSC enrichment, providing preclinical evidence that in the neoadjuvant setting, combining DNMT and NAMPT inhibitors with platinum has the potential to reduce OC reoccurrence.
Introduction
Ovarian cancer (OC) is the 5th leading cause of cancer related death among women (1). High grade serous ovarian cancer (HGSOC), the most aggressive type of OC, accounts for 70-80% of all OC cases (1). The majority of OC cases are detected at an advanced stage and survival rate for patients diagnosed with stage IV disease is a dismal 17% (2). The primary therapy for the management of advanced stage OC continues to include a combination of surgery and chemotherapy and while most patients achieve a complete remission, the majority will recur and subsequently develop chemotherapy resistant disease (3).
We and others have shown that a subpopulation of cells called ovarian cancer stem cells (OCSCs) preferentially survive after treatment with platinum-based chemotherapeutic drugs (4), are enriched in recurrent tumors (5) and are at least partially responsible for chemotherapy resistance (6). Several markers have been used to identify OCSCs, including the activity of aldehyde dehydrogenase (ALDH) enzymes. ALDH1 is overexpressed in OCSCs and ALDH1 expression correlates with worse OC survival and platinum resistance (4, 7). ALDH+ cells have tumor initiating capacity, form spheroids in non-adherent conditions, and express stem cell markers (4, 8), all criteria of functional CSCs.
Standard of care platinum-based chemotherapeutic drugs (cisplatin, carboplatin) cause DNA damage in the form of platinum-DNA adducts (9), which activate the DNA damage response (DDR). The DDR can result in DNA repair, cell cycle arrest, and/or apoptosis (10, 11). Altered DDR is thought to contribute to the ability of OCSCs to survive chemotherapy. For example, OCSCs have higher levels of DDR pathway activation through phosphorylation of DDR factors like ataxia telangiectasia mutated (ATM), checkpoint kinase 1 (CHK1) and CHK2 (12). The tumor suppressor breast cancer 1 (BRCA1) plays an important role in regulating the DDR through interaction of its various functional domains with proteins required for cell cycle regulation, tumor suppression, and DNA repair (13–16). About 40% of women with a family history of OC have BRCA1/2 mutation or promoter hypermethylation (2).
Tumors with BRCA1 mutation frequently undergo locus-specific loss of heterozygosity (LOH), resulting in loss of the wildtype copy of BRCA1 and subsequent increased sensitivity to chemotherapy due to defective homologous recombination DNA repair (17). Patients with BRCA1 mutant tumors without locus-specific LOH have significantly lower percentage of survival compared to patients with BRCA1 mutation with locus-specific LOH (17), indicating partial loss of BRCA1 functions as a secondary mode of resistance to chemotherapy. Furthermore, as survival rates of patients with BRCA1 promoter DNA hypermethylation were lower compared to patients with BRCA1 mutation (18), and the fact the vast majority of HGSOC have a wildtype BRCA1 (2), a better understanding of the role of wildtype BRCA1 in response to platinum agents is of critical importance.
The metabolite nicotinamide adenine dinucleotide (NAD+) plays a key role in major metabolic pathways including glycolysis, tricarboxylic acid (TCA) cycle, and oxidative phosphorylation (19). Furthermore, NAD+ is a co-factor for ALDH enzymes and essential for the ALDH− mediated conversion of aldehydes to carboxylic acids (20, 21). Ovarian tumors with reduced expression of BRCA1 through BRCA1 promoter DNA hypermethylation or mutation have increased levels of NAD+ and expression of nicotinamide phosphoribosyltranferase (NAMPT), the rate limiting regulator of NAD+ synthesis from the salvage pathway (22). Furthermore, NAMPT has been shown to promote platinum-induced senescence-associated OCSCs (23). Therefore, studying the role of metabolites in the response to platinum treatment is important to understand how chemoresistance develops.
With OCSCs known involvement in chemoresistance and tumor reoccurrence, we sought to mechanistically study how platinum treatment induces OCSC enrichment and develop strategies to combat this enrichment. We demonstrate that two separate pathways drive platinum-induced OCSC enrichment, one involving epigenetic-mediated silencing of BRCA1 and the other altered energy metabolism. Cisplatin treatment resulted in a DDR-dependent decrease in BRCA1 expression through BRCA1 promoter DNA hypermethylation as well as a G2/M cell cycle arrest-related increase in NAMPT expression and subsequent increase in cellular NAD+ levels. Importantly, combined treatment with a DNA methyltranferase (DNMT) and a NAMPT inhibitor synergistically abrogated the cisplatin-induced OCSC enrichment. Our findings support using a novel epigenetic-metabolic inhibitor combination in the neoadjuvant setting to reduce the platinum-induced enrichment of OCSCs and avert the development of platinum resistance in OC.
Results
Cisplatin treatment enriches for ALDH+ cells
Advanced stage OC patients frequently have residual tumor cells following chemotherapy. To determine whether OCSCs are enriched by platinum chemotherapy, we treated HGSOC cell lines OVCAR5, OVSAHO and OVCAR3 with corresponding IC50 doses of cisplatin (24) and analyzed the percentage of ALDH+ (%ALDH+) cells using the ALDEFLUOR assay (4). To investigate acute effects, we first conducted a time course study in OVCAR5 cells (3 to 16 h). The %ALDH+ cells significantly increased after treatment with cisplatin for 8 h and 16 h (Fig. 1A, Supplementary Fig. S1A). Similarly, cisplatin treatment for 16 h increased the %ALDH+ cells in OVSAHO (5.8% to 10.8%) and OVCAR3 (20% to 28%) cell lines (Fig. 1A). PEO1, a BRCA2 mutant OC cell line (25), had lower initial levels of %ALDH+ cells and a smaller but significant cisplatin-induced increase in %ALDH+ cells at 16 h (Supplementary Fig. S1B). However, in the BRCA1 mutant COV362 (26) cell line, no increase in %ALDH+ cells after acute cisplatin treatment was observed (Supplementary Fig. S1B). To confirm that the increase in %ALDH+ cells was associated with a stemness phenotype, we tested the ability of platinum-treated OVCAR5 and OVSAHO cells to form spheroids in anchorage independent conditions. When cells were plated in stem cell media, cisplatin pretreated cells were more spheroid-like compared to UT (Fig. 1B). Using a cell viability assay based on intracellular esterase activity, there were significantly more viable cells in the spheroids generated from cells pretreated with cisplatin than from UT cells (Fig. 1B).

A) %ALDH+ cells determined using the ALDEFLUOR assay after mock (UT) or cisplatin (IC50 dose) treatment for the indicated time points. N=3. B) Images of spheroids after mock (UT) or cisplatin (3 h, ½ IC50) pretreatment in indicated cell lines. Scale bar = 500 μm. Graph depicts fluorescence intensity (RFU) of CytoCalcein Violet 450 stain. N=4. C) Relative BRCA1 RNA expression in indicated cell lines after mock (UT) or cisplatin treatment (16 h, IC50) for the indicated time points and cell lines. N=3. B) Western blot and relative densitometry of whole cell lysates after mock (UT) or cisplatin (16 h, IC50) treatment for the indicated time points and cell lines. N=3. For all panels, graphs indicate mean +/− SEM, *P<0.05, **P<0.001, ***P<0.0001, ****P<0.00001.
Isotypes of ALDH1 - ALDH1A1, ALDH1A2 and ALDH1A3 are linked to stemness of OC cells (27). Depending on the tumor type and cell line, different isozymes of ALDH1 are overexpressed – ALDH1A3 in OVCAR5 and ALDH1A1 in OVSAHO (Supplementary Fig. S1C). We hypothesized that cisplatin may induce enrichment of ALDH+ cells by altering ALDH expression. However, no change in expression of ALDH1A1/A2/A3 isoforms after treatment with cisplatin was observed in OVCAR5 cells (Supplementary Fig. S1C). In OVSAHO cells, no change in expression of the major ALDH1 isoform in these cells, ALDH1A1, was observed after cisplatin treatment, although ALDH1A2 and ALDH1A3 isoforms significantly decreased and increased, respectively, after cisplatin treatment (Supplementary Fig. S1C). Because ALDH1A1 is expressed approximately 100-fold more than ALDH1A3, ALDH1A1 likely contributes to the majority of ALDH activity in this cell line suggesting the change in ALDH1A3 expression has no detectable effect on ALDH activity. Additionally, even though cisplatin caused the expected increase in the DNA damage marker phosphorylated histone 2AX (γH2AX) over a cisplatin time course, there was no significant change in ALDH1 protein levels in OVCAR5 cells (Supplementary Fig. 1D).
BRCA1 is known to play a role in OC (2) and the DDR (13–16). As BRCA1 levels have been linked to an interstrand crosslink (ICL)-dependent increase in stemness (28), we assayed BRCA1 expression following cisplatin treatment. BRCA1 RNA expression levels in OVCAR5, OVSAHO and BRCA2-mutant PEO1 significantly decreased by 16 h after cisplatin treatment (Fig. 1C). Furthermore, BRCA1 protein levels correspondingly decreased and correlated with increased γH2AX levels in cisplatin treated cells (Fig. 1D). Taken together, these data suggest that acute cisplatin treatment enriched for ALDH+ cells with stemness properties and decreased BRCA1 levels. The minimal change in ALDH1 level after cisplatin treatment further suggested that another mechanism contributes to the cisplatin-induced enrichment of ALDH+ cells.
The cisplatin-induced decrease in BRCA1 levels is associated with BRCA1 promoter DNA hypermethylation
BRCA1 expression is regulated through different mechanisms, including promoter DNA hypermethylation-associated gene silencing (29). Corresponding to the platinum-induced decrease in BRCA1 expression, there was a significant increase in BRCA1 promoter DNA methylation after 3 h, 8 h and 16 h cisplatin treatment as assayed by quantitative methylation-specific PCR (qMSP) in OVCAR5 and OVSAHO cells (Fig. 2A). Bisulfite sequencing of 12 CpG sites within the BRCA1 promoter region confirmed the increase in methylated CpGs after 16 h cisplatin treatment compared to untreated (UT) cells (Fig. 2B). Total methylation percentage calculated using the bisulfite sequencing data further demonstrated an increase in BRCA1 promoter DNA methylation after cisplatin treatment (Fig. 2C).

A) Quantitative MSP for BRCA1 promoter DNA methylation. Graphs depict mean + SEM. N=3. B) The location and methylation status of CpG sites in promoter region of BRCA1 gene. Location of qMSP primers are indicated. The arrow at the transcription start site (TSS) indicates transcription direction. Individual CpG dinucleotides are shown as circles with closed circles: methylation and open circles: unmethylated. Sequencing of ten individual clones for each sample was performed from bisulfite-converted mock (UT) or cisplatin (16H, IC50) treated DNA. C) Percentage of methylated CpGs per clone using data presented in B. Graphs depict mean + SEM. N=10. D) Western blot of OVCAR5 whole cell lysates after mock (UT) or cisplatin (IC50 dose) treatment for the indicated time points. For all panels *P<0.05, **P<0.001, ***P<0.0001.
DNA methylation is catalyzed by DNMTs. DNMT1 is predominantly a maintenance DNA methyltransferase whereas DNMT3B and DNMT3A are predominantly de novo DNMTs (30). Cisplatin treatment increased the levels of DNMT1 and DNMT3B protein (Fig. 2D), corresponding to the timing of the BRCA1 promoter hypermethylation and increase in the DNA damage marker γH2AX (Fig. 2D). Altogether this data demonstrates that the cisplatin-induced decrease in BRCA1 expression is associated with promoter DNA hypermethylation.
The cisplatin-induced decrease in BRCA1 is essential for the associated increase in %ALDH+ cells
To determine if a decrease in BRCA1 expression is sufficient to increase the %ALDH+ cells, we altered BRCA1 levels by using stable shRNA mediated knockdown (KD) in OVCAR5 cells. BRCA1 KD using two different shRNAs reduced BRCA1 expression compared to empty vector (EV) shRNA cells to level similar to EV cells treated with cisplatin (Fig. 3A). Additionally, BRCA1 protein levels decreased after BRCA1 KD compared to EV to a level similar to EV cells treated with cisplatin (Fig. 3B). BRCA1 shRNA1 KD cells had similar baseline %ALDH+ cells compared to EV (Fig. 3C). The slight increase in %ALDH+ cells in BRCA1 shRNA2 KD compared to EV cells was significantly less than the cisplatin-induced increase in EV cells.

A) Relative BRCA1 RNA expression in OVCAR5 cells after stable lentiviral infection with mock (EV) or BRCA1 shRNA1/2 with or without cisplatin treatment (16 h, IC50). Graphs depict mean + SEM. N=3. B) Western blot and relative densitometry of OVCAR5 whole cell lysates after mock (EV) with or without cisplatin treatment (16 h, IC50) or BRCA1 shRNA1/2. N=3. C) Percentage of ALDH+ cells using the ALDEFLUOR assay after stable lentiviral infection with mock (EV) with or without cisplatin treatment (16 h, IC50) or BRCA1 shRNA1/2. N=3. D) Relative BRCA1 RNA expression in indicated cell lines after mock (DMSO), cisplatin treatment (16 h, IC50), ATMi (16 h, 152 μM) or ATMi (16 h, 152 μM) + cisplatin (16 h, IC50). N=3. E) Percentage of ALDH+ cells using the ALDEFLUOR assay in indicated cell lines treated as in D. N=3. F) Relative BRCA1 RNA expression in cells transfected with mock empty vector (EV) or CpGi-null BRCA1 plasmid and treated with or without cisplatin (16 h, IC50) in the indicated cell lines. N=3. G) Western blot and relative densitometry of OVCAR5 whole cell lysates transfected and treated as in F. N=3. H) Percentage of ALDH+ cells using the ALDEFLUOR assay after transfection with mock empty vector (EV) or CpGi-null BRCA1 (BRCA1) plasmid and treatment as in F in indicated cell lines. N=3. For all panels, graphs indicate mean +/− SEM, *P<0.05, **P<0.001, ***P<0.0001.
Because the effect of altering BRCA1 levels on the %ALDH+ cells was limited, we hypothesized that DNA damage caused by cisplatin is important to induce an increase in %ALDH+ cells. ATM, one of the first proteins to be recruited to DNA damage sites (31), is responsible for phosphorylation of downstream targets like H2AX and the activation of downstream DNA repair pathways (32). Inhibiting ATM (ATMi) using KU-55933 (30) reduced cisplatin-induced levels of active, phosphorylated ATM in OVCAR5 and OVSAHO cells (Supplementary Fig. S2A). Consistent with our previous results (Fig. 1C), BRCA1 levels decreased after cisplatin only treatment (Fig. 3D). BRCA1 expression after treatment with ATMi only was similar to DMSO treated in both cell lines (Fig. 3D). ATMi and cisplatin dual treatment prevented the cisplatin-induced decrease in BRCA1 expression, with BRCA1 levels being similar to DMSO treated cells in both cell lines. Consistent with the association between decreased BRCA1 levels and increased %ALDH+ cells, combining ATMi with cisplatin treatment prevented the cisplatin-induced increase in %ALDH+ cells compared to cisplatin treatment only in both cell lines (Fig. 3E). ATMi treatment itself did not alter the %ALDH+ cells in OVCAR5 cells but decreased the %ALDH+ cells compared to DMSO treated cells in OVSAHO cells (Fig. 3E).
Next, we transiently transfected cells with a plasmid that drives expression of BRCA1 using an exogenous promoter lacking the normal BRCA1 regulatory regions, including the promoter CpG island (CpGi-null BRCA1; Supplementary Fig. 2B). Cells transfected with CpGi-null BRCA1 had higher levels of BRCA1 expression when compared to UT EV transfected cells in OVCAR5 and OVSAHO cells (Fig. 3F). Cisplatin treatment decreased BRCA1 expression in CpGi-null BRCA1 transfected OVSAHO cells but not in OVCAR5 cells compared to UT CpGi-null BRCA1 transfected cells but BRCA1 levels remained higher than EV cells treated with or without cisplatin in both cell lines (Fig. 3F). Similarly, BRCA1 protein levels were higher in UT CpGi-null BRCA1 transfected OVCAR5 cells compared to UT EV transfected cells (Fig. 3G). BRCA1 protein levels decreased in cisplatin-treated CpGi-null BRCA1 transfected cells compared to UT CpGi-null BRCA1 and UT EV transfected cells but remained higher than cisplatin treated EV transfected cells (Fig. 3G). As expected, γH2AX levels increased in cells treated with cisplatin with EV or CpGi-null BRCA1 transfection (Fig. 3G).
To determine how maintaining BRCA1 levels effects platinum-induced OCSC enrichment, the ALDFLUOR assay was performed in UT and cisplatin-treated EV and CpGi-null BRCA1 transfected cells. UT CpGi-null BRCA1 transfected cells had similar baseline %ALDH+ cells as UT EV transfected cells in both OVCAR5 and OVSAHO cells (Fig. 3H). Importantly, even though cisplatin increased the %ALDH+ cells in EV cells as expected, there was no increase in %ALDH+ cells after cisplatin treatment in CpGi-null BRCA1 transfected cells in both cell lines. Collectively, these data demonstrate that the effect of altering BRCA1 levels without DNA damage on %ALDH+ cells is limited, maintaining BRCA1 expression prevents the platinum-induced increase in %ALDH+ cells and the cisplatin-induced decrease in BRCA1 levels below the level in EV cells contributes to the cisplatin-induced increase in %ALDH+ cells.
Decitabine treatment abrogates the cisplatin-induced increase in %ALDH+ cells
DNA hypomethylating agents like decitabine (DAC) have been shown to re-sensitize platinum-resistant OC cells to platinum (33). Here, we used low dose DAC to determine the role of DNA methylation in the cisplatin-induced changes observed above. Bisulfite sequencing of 12 CpG sites within the BRCA1 promoter after DAC only and DAC +cisplatin dual treatment confirmed that DAC treatment prevented the BRCA1 promoter DNA hypermethylation caused by cisplatin treatment alone (Supplementary Fig. S3, Fig. 4A). Corresponding to DAC blocking platinum-induced BRCA1 DNA hypermethylation (Fig. 2), dual treatment with DAC and cisplatin resulted in significantly higher BRCA1 expression levels than cisplatin treatment alone in both OVCAR5 and OVSAHO cells, maintaining BRCA1 levels at or above those in UT cells (Fig. 4B). With cisplatin treatment only, BRCA1 protein levels decreased (Fig. 4C; consistent with Fig. 1D). Importantly, BRCA1 protein levels were maintained after dual treatment of DAC and cisplatin to similar levels as UT cells (Fig. 4C). Unexpectedly, DAC treatment alone resulted in increased BRCA1 expression and protein levels when compared to UT (Fig. 4B, C), suggesting that additional CpGs may be methylated at baseline in the BRCA1 promoter than those interrogated or an indirect mechanism of DAC regulation of BRCA1 levels. Consistent with DNMT protein degradation in response to DAC treatment (34), DNMT1 and DNMT3B protein levels decreased in DAC treated cells with or without cisplatin treatment (Fig. 4C) and regardless of DAC treatment, γH2AX levels in cells treated with cisplatin increased as expected (Fig. 4C).
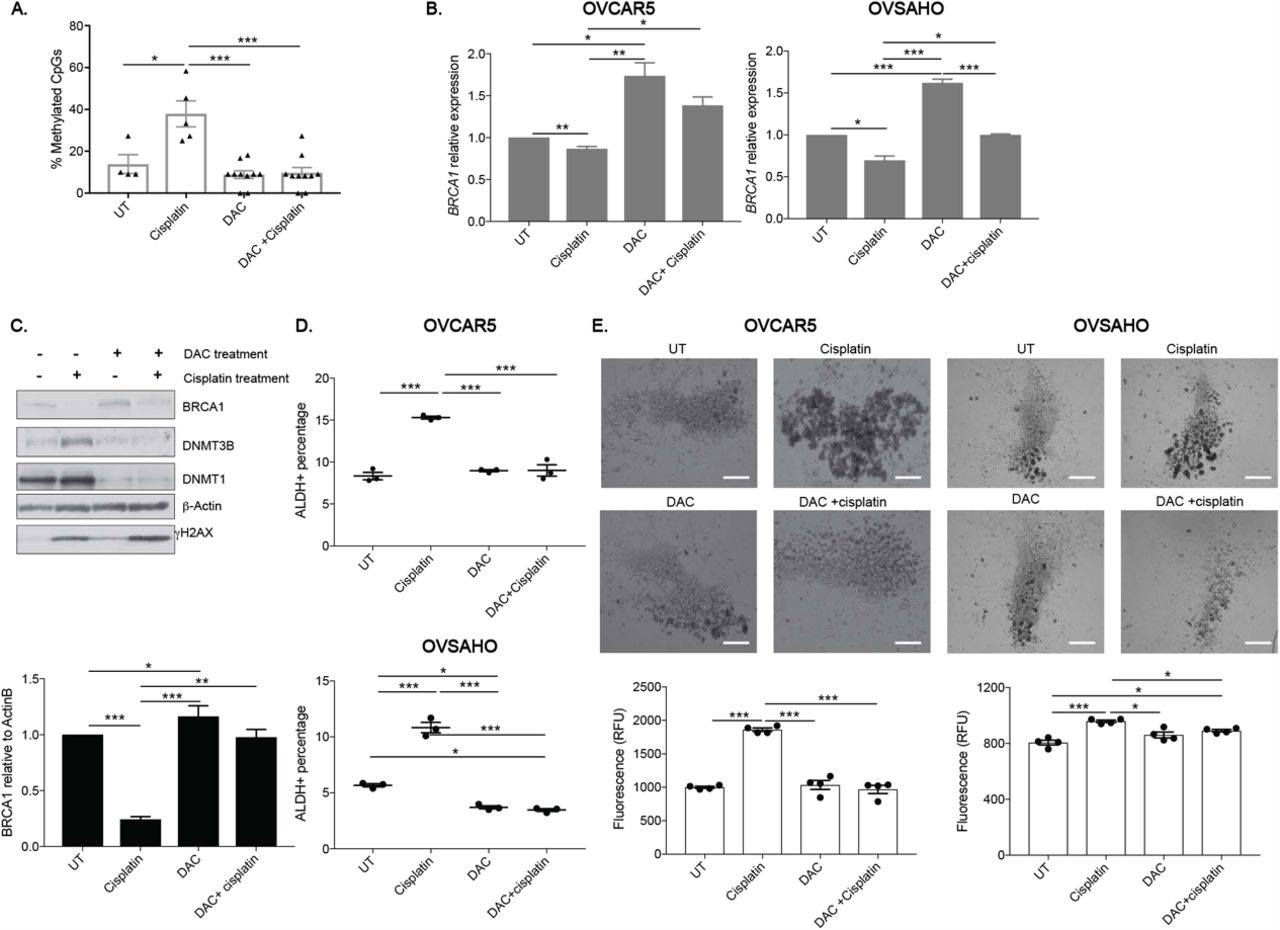
A) The location and methylation status of CpG sites in the BRCA1 promoter from bisulfite-converted mock (UT), cisplatin treatment (16 h, IC50), DAC (48 h, 100 nM) or DAC (48 h, 100 nM) + cisplatin (16 h, IC50) treated DNA. Closed circles: methylation and open circles: unmethylated. Sequencing of ten individual clones for each sample was performed. B) Relative BRCA1 RNA expression after treatment as in A in indicated cell lines. N=3. C) Western blot and relative densitometry of OVCAR5 whole cell lysates after treatment as in A in OVCAR5 cells. N=3. D) Percentage of ALDH+ cells using the ALDEFLUOR assay after treatment as in A in indicated cell lines. N=3. E) Images of spheroids after pretreatment with mock (UT), cisplatin (3 h, ½ IC50), DAC (48 h, 100 nM) or DAC (48 h, 100 nM) + cisplatin (3 h, ½ IC50). Scale bar = 500 μm. Graph depicts relative fluorescence units (RFU) of CytoCalcein Violet 450 stain. N=4. For all panels, graphs indicate mean +/− SEM, *P<0.05, **P<0.001, ***P<0.0001.
Next, the effect of low dose DAC on cisplatin-induced enrichment of OCSCs was determined. OVCAR5 cells treated with DAC had similar baseline %ALDH+ cells as UT while OVSAHO cells had significantly lower %ALDH+ cells than UT (Fig. 4D). As expected, cisplatin treatment increased in %ALDH+ cells in both cell lines and dual treatment with DAC and cisplatin blocked the cisplatin-induced increase in %ALDH+ cells with the %ALDH+ cells after dual treatment being similar to UT and/or DAC only treated cells (Fig. 4D).
To determine the role of low dose DAC and cisplatin dual treatment on OCSC survival, we examined the ability of pretreated cells to grow as spheroids in stem cell media. OVCAR5 and OVSAHO cells pretreated with cisplatin alone generated spheroids with increased viability compared to non-pretreated cells (4E; consistent with Fig. 1B). Spheroids derived from DAC pretreated only cells had similar viability as spheroids generated from non-pretreated cells (Fig. 4E). Dual pretreatment of DAC and cisplatin abrogated the cisplatin-induced spheroid formation and increase in viable cells. Altogether, these data demonstrate that low dose DAC treatment can prevent the platinum-induced enrichment of OCSCs, likely by maintaining BRCA1 expression.
G2/M cell cycle arrest results in an increase %ALDH+ cells
Because platinum induces cell cycle arrest (35), we studied if cell cycle arrest is related to the cisplatin-induced enrichment of OCSCs. In UT OVCAR5 and OVSAHO cells, a higher percentage of ALDH+ cells were in the G2/M phase of the cell cycle than ALDH− cells (OVCAR5: ALDH− = 4.4%, ALDH+ = 15.3%, OVSAHO: ALDH− = 11.6%, ALDH+ = 34%) (Fig. 5A, Supplementary Fig. 4A). This data is consistent with a prior study demonstrating a higher proportion of ALDH+ cells in G2/M than ALDH− cells in other OC cell lines (35). Additionally, after treatment with cisplatin, there was an expected increase in total cells in G2/M for both OVCAR5 ALDH− and ALDH+ cells (Fig. 5B; ALDH+, 25.6% to 30.3%; ALDH−, 10.3% to 27.3%).

A) Percentage of ALDH+ and ALDH− cells in G1, S and G2/M phases of the cell cycle for indicated cell lines. N=3. B) Percentage of ALDH+ and ALDH− cells in G1, S and G2/M phases of the cell cycle after mock (UT) or cisplatin treatment (16 h, IC50) in OVCAR5 cells. C) Percentage of cells in G2/M after mock (UT), DMSO, cisplatin (16 h, IC50) or CDK1 inhibitor (16 h, 9 μM) treatment in indicated cell lines. N=3. D) Total percentage of ALDH+ cells treated as in C in indicated cell lines. N=3. For all panels, graphs indicate mean +/− SEM, *P<0.05, **P<0.001, ***P<0.0001.
To determine if G2/M arrest is important for the cisplatin-induced increase in %ALDH+ cells (Fig. 1A), we induced G2/M arrest independent of platinum treatment through cyclin-dependent kinase 1 inhibition (CDK1i) with the CDK inhibitor RO-3306 (36). CDK1 is a master regulator of the cellular transition from G2 to M phase (37). CDK1i treatment increased the percentage of cells in the G2/M phase of the cell cycle as compared UT and DMSO treatment to a level that was similar to or higher than levels after cisplatin treatment in OVSAHO and OVCAR5 cells, respectively (Fig. 5C). Comparably to cisplatin, CDK1i treatment resulted in a significant increase in %ALDH+ cells compared to UT in both cell lines (Fig. 5D). As a control for CDK1i treatment, we determined total cells positive for phosphorylated Ser10 H3, a marker of active mitosis. Compared to UT cells, there was a decrease in cells positive for phosphorylated Ser10 H3 after cisplatin and CDK1i treatments (UT: 2%, DMSO: 2.3%, cisplatin: 0.3% and CDK1i: 0.1%; Supplementary Fig. S4B); indicating G2/M arrest after cisplatin or CDK1i treatment, as expected. Additionally, unlike cisplatin treatment, CDK1i treatment did not induce DNA damage compared to UT as measured by γH2AX levels in OVCAR5 and OVSAHO cells (Supplementary Fig S4C), further supporting that G2/M arrest contributes to the cisplatin-induced increase in %ALDH+ cells.
NAMPT inhibition abrogates cisplatin-induced enrichment of ALDH+ cells
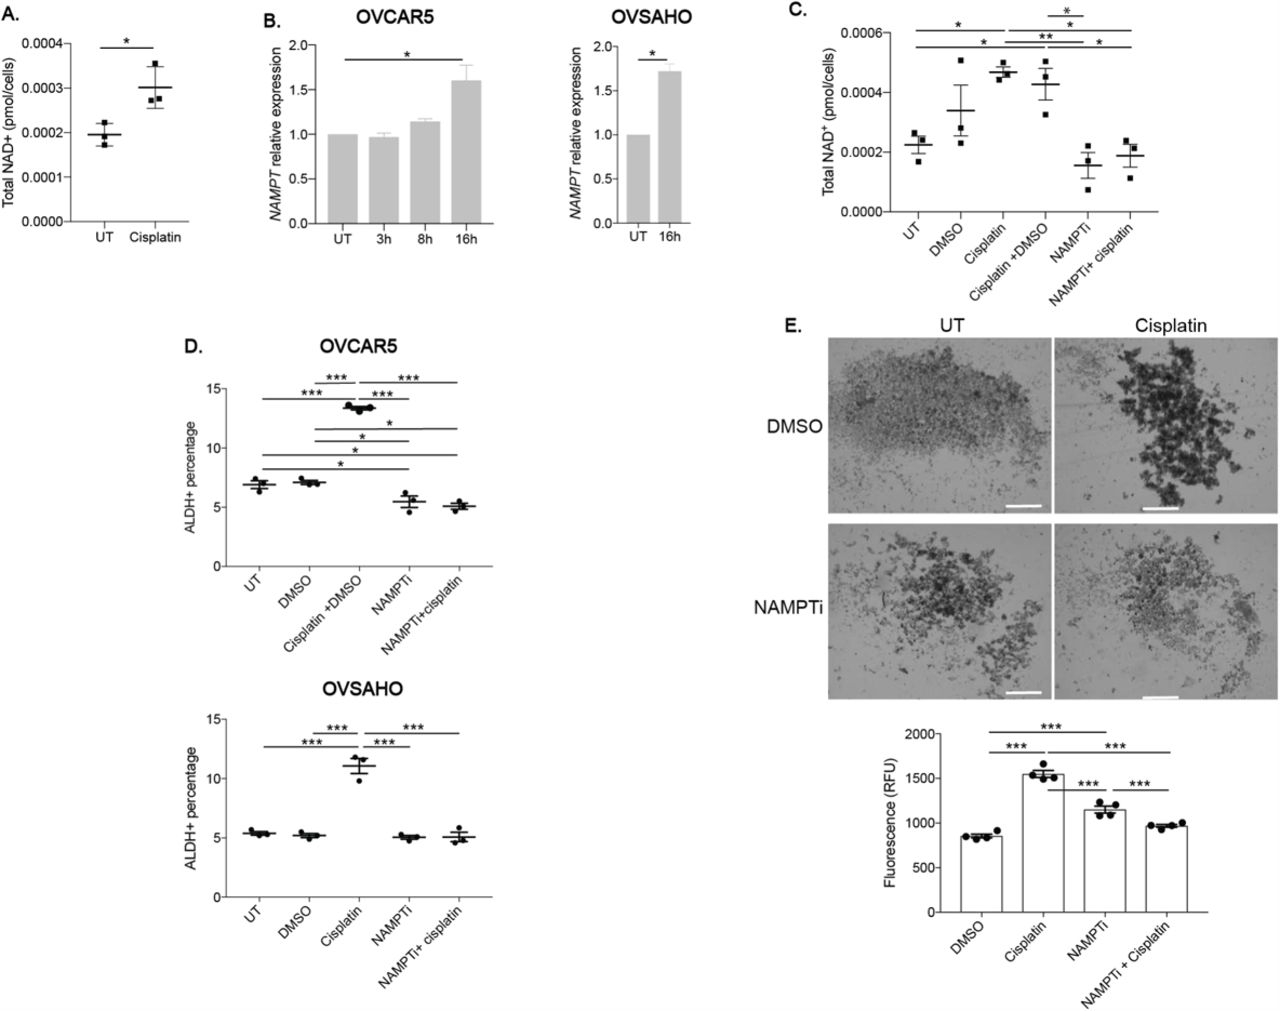
A key co-factor of ALDH activity is NAD+ (38), and increased levels of NAD+ and its rate-limiting regulator, NAMPT, have been shown to promote cancer cell survival and were associated with chemo-resistance and low patient survival (19, 39). Increased NAD+ levels were also reported to drive a platinum-induced increase in senescence-associated OCSCs (23). We observed that NAD+ levels were significantly higher in cells after 16 h of cisplatin treatment than in UT cells (Fig. 6A). In addition, NAMPT expression levels increased after 16 h acute cisplatin treatment suggesting that the cisplatin-induced increase in NAD+ levels was due to a cisplatin-induced increase in NAMPT expression (Fig. 6B). Because the increase in NAMPT expression was highest after 16h cisplatin treatment, we determined NAMPT expression in OVSAHO, PEO1 and COV362 cell lines at this time point and observed similar cisplatin-induced increases in NAMPT expression (Fig. 6B and Supplementary Fig. S5). To determine if blocking the cisplatin-induced increase in NAD+ prevented the increase in %ALDH+ cells, we treated cells with the NAMPT inhibitor-STF-118804 (NAMPTi), which has been shown to reduce cell viability in solid tumors (40). After cisplatin treatment with or without DMSO, NAD+ levels increased compared to UT (Fig. 6C; consistent with Fig. 6A); furthermore, dual treatment with NAMPTi and cisplatin prevented the cisplatin-induced increase in NAD+ levels when compared to cisplatin treatment with or without DMSO and were similar to control levels or NAMPTi only (Fig. 6C).

A) Total NAD+ (pmol/cells) in OVCAR5 cells after mock (UT) or cisplatin (16 h, IC50) treatment. N=3. B) Relative NAMPT RNA expression after mock or cisplatin (IC50 dose) treatment for the indicated time points and cell lines. N=3. C) Total NAD+ (pmol/cells) in OVCAR5 cells after mock (UT), cisplatin (16 h, IC50), NAMPTi (6 h, 50 nM), cisplatin (16 h, IC50) + DMSO or NAMPTi (6 h, 50 nM) + cisplatin (16 h, IC50) treatment. N=3. D) Percentage of ALDH+ cells using the ALDEFLUOR assay after treatment as in C in indicated cell lines. N=3. E) Images of spheroids after pretreatment with mock (DMSO), cisplatin (3 h, ½ IC50), NAMPTi (6 h, 50 nM), or NAMPTi (6 h, 50 nM) + cisplatin treatment (3 h, ½ IC50). Scale bar = 500 μm. Graph depicts relative fluorescence units (RFU) of CytoCalcein Violet 450 stain. N=4. For all panels, graphs indicate mean +/− SEM, *P<0.05, **P<0.001, ***P<0.0001.
Next, we examined the effect of dual treatment with NAMPTi and cisplatin on the cisplatin-induced increase in %ALDH+ cells. OVCAR5 cells treated with NAMPTi had decreased %ALDH+ cells relative to UT and DMSO treated cells, while OVSAHO NAMPTi treated cells had similar %ALDH+ cells as UT and DMSO treated cells (Fig. 6D). As expected, there was a significant increase in %ALDH+ cells after cisplatin treatment when compared to UT or DMSO treated cells in both cell lines. In contrast, dual treatment of NAMPTi and cisplatin prevented the cisplatin-induced increase in %ALDH+ cells, with the %ALDH+ cells in the dual treated samples being decreased or similar to levels in UT and DMSO treated cells in OVCAR5 and OVSAHO cells, respectively. Further, the effect of NAMPT inhibition on cisplatin-induced enrichment of OCSCs was investigated based on the ability of pretreated cells to grow as spheroids in stem cell media. As expected, cisplatin +DMSO pretreated cells were more spheroid like than UT and DMSO pretreated OVCAR5 cells (Fig. 6E, consistent with Fig. 1B). Spheroids viability after NAMPTi pretreatment was higher than DMSO pretreated cells but lower compared to cisplatin pretreated cells, and dual pretreatment with NAMPTi and cisplatin abrogated the cisplatin-induced spheroid formation and increase in viable cells (Fig. 6E). Additionally, dual pretreated cells had similar or lower viability as spheroids generated from DMSO or NAMPTi pretreated cells, respectively. These data demonstrate that cisplatin induced an increase in NAD+ levels through increased expression of the rate-limiting enzyme, NAMPT, and NAMPT inhibition abrogated the cisplatin-induced enrichment of ALDH+ cells.
Cisplatin treatment induces two separate pathways to increase %ALDH+ cells
To further explore how decreased BRCA1 expression, increased NAD+ levels and G2/M arrest are interconnected during cisplatin-induced OCSC enrichment, we assayed BRCA1 and NAMPT expression after CDK1 inhibition, BRCA1 overexpression and DAC treatment. In contrast to the cisplatin-induced decrease in BRCA1 expression (Fig. 1C), BRCA1 expression levels increased after CDK1i treatment in OVCAR5 and OVSAHO cells relative to UT and/or DMSO treated cells (Fig. 7A). However, consistent with the cisplatin treatment data, NAMPT RNA expression levels increased after CDK1i treatment in both cell lines compared to UT and/or DMSO treated cells (Fig. 7B). The level of NAMPT expression was higher in CDK1i compared to cisplatin treated OVSAHO cells (Fig. 7B).

A) Relative BRCA1 RNA expression after treatment with mock (UT), DMSO, cisplatin (16 h, IC50) or CDK1 inhibitor (16 h, 9 μM) treatment in indicated cell lines. N=3. B) Relative NAMPT RNA expression after treatment as in A in indicated cell lines. N=3. C) Relative NAMPT RNA expression in untransfected (UT) or transfected with mock empty vector (EV) or CpGi-null BRCA1 plasmid and treated with or without cisplatin (16 h, IC50) in the indicated cell lines. For OVCAR5, * indicates comparison between the indicated sample type and untransfected control with no treatment. N=3. D) Total NAD+ (pmol/cells) in untransfected (UT) or transfected with mock empty vector (EV) or CpGi-null BRCA1 (BRCA1) plasmid and treated with or without cisplatin (16 h, IC50) in OVCAR5 cells. N=3. E) Relative NAMPT RNA expression after mock (UT), cisplatin treatment (16 h, IC50), DAC (48 h, 100 nM) or DAC (48 h, 100 nM) + cisplatin (16 h, IC50) treatment in indicated cell lines. N=3. For all panels, graphs indicate mean +/− SEM, *P<0.05, **P<0.001, ***P<0.0001, ****P<0.00001.
These data suggest that G2/M cell cycle arrest and NAMPT expression but not BRCA1 expression are connected, and to further confirm this relationship, we assayed NAMPT expression and NAD+ levels in CpGi-null BRCA1 transfected cells, which we had previously demonstrated did not undergo cisplatin-induced enrichment of OCSC due to sustained BRCA1 expression (Fig. 3H). In EV and CpGi-null BRCA1 transfected OVCAR5 cells, NAMPT expression was elevated to a similar level relative to non-transfected UT cells and no further increase in NAMPT expression in transfected cells was observed after cisplatin treatment (Fig. 7C) even though, consistent with our previous results (Fig. 5B), cisplatin treatment increased NAMPT expression in non-transfected OVCAR5 cells. However, in OVSAHO cells, cisplatin treatment increased NAMPT expression in both EV and CpGi-null BRCA1 transfected cells compared to the UT transfected controls (Fig. 7C). In the absence of cisplatin treatment, NAMPT expression was similar in EV or CpGi-null BRCA1 transfected OVSAHO cells. Furthermore, CpGi-null BRCA1 transfected cells had similar baseline NAD+ levels as EV and non-transfected OVCAR5 cells (Fig. 7D) and NAD+ levels increased after cisplatin treatment in non-transfected cells (Fig. 7D), as expected. Cisplatin treatment still increased NAD+ levels in EV and CpGi-null BRCA1 transfected cells compared to UT controls although to a lesser extent than in non-transfected cells (Fig. 7D). This data suggests that even though maintaining BRCA1 expression blocks the cisplatin-induced increase in %ALDH+ cells, cisplatin treatment still increases NAD+ levels.
BRCA1 overexpression has been previously connected to an increase of cells in the G2/M phase of the cell cycle (41). So, it was of interest to determine if changes in the cell cycle were driving the effect on platinum-induced OCSC enrichment when BRCA1 expression was maintained by either CpGi-null transfection or DAC treatment. UT CpGi-null BRCA1 transfected cells had a higher percentage of cells in G2/M phase of the cell cycle when compared to UT non-transfected or EV transfected OVCAR5 cells (Supplementary Fig. 6). Cisplatin treatment of CpGi-null BRCA1 transfected cells increased total cells in G2/M phase of the cell cycle compared to cisplatin treated non-transfected cells and EV transfected cells as well as all types of UT cells. EV transfected cells treated with or without cisplatin had higher percentage of cells in G2/M phase of the cell cycle compared to UT non-transfected cells controls, which may explain the elevated NAMPT expression in these cells (Fig. 7C). Even though DAC treatment blocked the platinum-induced decrease in BRCA1 expression (Fig. 4A) and increase in %ALDH+ cells (Fig. 4C), DAC treatment alone or in combination with cisplatin still elevated NAMPT expression compared to UT, and the level was similar to (or higher) than cells treated with cisplatin (Fig. 7E). Altogether, these data indicate that G2/M cell cycle arrest and the associated change in NAMPT expression were required for platinum-induced OCSC enrichment independently of decreased BRCA1 expression. Furthermore, our previous ATMi data indicated that DNA damage and/or the DDR were required for the platinum-induced decrease in BRCA1 expression and are separate from cell cycle related changes in NAMPT expression.
Dual DNMTi and NAMPTi treatment abrogate the cisplatin-induced increase in %ALDH+ cells
The above observations indicated that both the cisplatin-induced decrease in BRCA1 levels and increase in NAMPT expression and NAD+ levels were required for the platinum-induced increase in %ALDH+ cells. Thus, two pathways contributed to the cisplatin-induced enrichment of OCSCs, namely the DDR-linked decrease in BRCA1 expression and the cell cycle-linked increase in NAMPT expression and NAD+ levels. Although inhibiting either pathway alone with low concentrations of DAC (Fig. 4) or NAMPTi (Fig. 6) abrogated the cisplatin-induced enrichment of OCSC, we hypothesized that combining very low dose treatment of the two inhibitors would impact both pathways and further abrogate the cisplatin-induced increase in %ALDH+ cells.
First, several concentrations of DAC and NAMPTi were used alone to determine doses of each that had minimal to no effect on the cisplatin-induced increase in %ALDH+ cells (NAMPTi - 12.5 nM; DAC - 10 nM and 20 nM; Supplementary Fig. S7A, B). Then, we sought to determine if combining selected lower doses of each drug would prevent the cisplatin-induced increase in %ADLH+ cells. As expected, cells treated with individual very low dose DAC and low dose NAMPTi in combination with cisplatin had similar increases in %ALDH+ cells as cells treated with cisplatin alone in OVCAR5 and OVSAHO cells (Fig. 8A). Importantly, combination treatment of very low dose DAC with low dose NAMPTi and cisplatin prevented the cisplatin-induced increase in %ALDH+ cells and resulted in similar %ALDH+ cells as DMSO treated cells in both cell lines. Furthermore, using Compusyn software (42) that uses combination index theorem, treatment of very low dose DAC (10 nM and 20 nM) with low dose NAMPTi and cisplatin synergistically inhibited (CI< 1) the cisplatin-induced increase in %ALDH+ cells in OVCAR5 cells (Fig. 8B). Whereas, in OVSAHO cells, very low dose DAC (10 nM) with low dose NAMPTi and cisplatin synergistically inhibited (CI < 1) the cisplatin-induced increase in %ALDH+ cells.

A) Percentage of ALDH+ cells using the ALDEFLUOR assay after treatment with mock (DMSO), cisplatin (16 h, IC50), DAC (48 h, 10 nM or 20 nM) + cisplatin, NAMPTi (6 h, 12.5 nM) + cisplatin treatment or NAMPTi +DAC + cisplatin treated in indicated cell lines. N=3. B) Combination index plot for cells treated as described in A; x-axis represents fraction affected (Fa) and y-axis represents combination index. Combinates beneath the dashed line are synergistic. C) Images of spheroids after mock (DMSO), cisplatin (3 h, ½ IC50), DAC (48 h, 10 nM or 20 nM) + cisplatin, NAMPTi (6 h, 12.5 nM) + cisplatin treatment or NAMPTi +DAC + cisplatin treated in indicated cell lines. Scale bar = 500 μm. Graph depicts fluorescence intensity (RFU) of CytoCalcein Violet 450 stain. N=4. For all panels, Graphs depict mean +/− SEM. a indicates comparison between the indicated sample type and DMSO treated sample. b indicates comparison between the indicated sample type and cisplatin treated sample. c indicates comparison between the indicated sample type and NAMPTi+ cisplatin treated sample. d indicates comparison between the indicated sample type and DAC (10 nM) + cisplatin treated sample. e indicates comparison between the indicated sample type and DAC (20 nM) + cisplatin treated sample. f indicates comparison between the indicated sample type and NAMPTi + DAC (10 nM) + cisplatin treated sample.
To confirm the effect of very low dose DAC and low dose NAMPT inhibition on cisplatin-induced enrichment of OCSCs, the ability of pretreated cells to grow as spheroids in stem cell media was examined. As expected, cisplatin pretreated cells were more spheroid-like compared to UT in both cell lines (Fig. 8C). Furthermore, cells pretreated with individual very low doses of DAC or low dose NAMPTi in combination with cisplatin pretreatment were similar to cisplatin pretreated cells (Fig. 8C; more spheroid-like and increased viability than UT). Importantly, combination pretreatment of very low dose DAC, low dose NAMPTi and cisplatin prevented cisplatin-induced spheroid formation and increase in viability. These data support the hypothesis that both pathways contribute to the cisplatin-induced enrichment of OCSCs.
Discussion
While HGSOC is initially highly responsive to chemotherapy, recurrence is common, and the majority of recurrent OC is chemotherapy resistant and fatal. OCSCs have increased resistance to chemotherapy and are enriched in OC relapses suggesting that OCSCs contribute to disease recurrence and resistance (4). Here we demonstrate that acute platinum treatment enriches the OCSC population, consistent with previous findings showing similar enrichment after longer exposures to platinum (23, 43, 44). We identify two distinct pathways that drive chemotherapy-induced OCSC enrichment, one marked by reduced wildtype BRCA1 expression and the other by increased NAD+ levels. Blocking either pathway alone or inhibiting both pathways together by combining very low doses of specific inhibitors prevents acute platinum-induced OCSC enrichment in wildtype BRCA1, platinum-sensitive HGSOC. Our findings support using the novel combination treatment scheme as a neoadjuvant treatment to reduce the platinum-induced enrichment of ALDH+ OCSCs and to avert the development of platinum resistance.
BRCA1 is an OC susceptibility gene and BRCA1 mutation increases the risk of developing OC (1). BRCA1 plays a role in ICL repair as well as other parts of the DDR (16). Additionally, ICL accumulation following BRCA1 depletion results in dedifferentiation of mammary epithelial cells to a more primitive, mesenchymal state (28). HGSOC accounts for approximately 70% of all EOC and the vast majority of patients diagnosed with HGSOC will have wildtype BRCA1. We demonstrate that platinum-induced a decrease in wildtype BRCA1 expression that contributes to the observed enrichment of ALDH+ cells and concurrent increase in the CSC phenotype. Inhibiting ATM in combination with platinum blocked the platinum-induced decrease in BRCA1 expression and OCSC enrichment demonstrating that the DDR after platinum treatment is important for the proposed mechanism. Consistent with the requirement for the DDR, stable BRCA1 knockdown without platinum treatment was not sufficient to increase the %ALDH+ cells. We speculate that the platinum-induced decrease in BRCA1 levels lead to persistent ICLs or alternative DNA repair pathway activation, which is required for but not sufficient for ALDH+ OCSC cell enrichment. Reduced BRCA1 levels may also contribute to senescence that occurs at later time-points post-platinum, based on prior work demonstrating that alterations in BRCA1 after oncogene expression precede and contribute to oncogene-induced senescence (45).
BRCA1 expression can be regulated by many mechanisms, including promoter DNA hypermethylation. Here we show that the cisplatin-induced decrease in BRCA1 levels correlated with an increase in BRCA1 promoter DNA hypermethylation. Uniquely, we demonstrated that combining treatment with the DNMT inhibitor DAC with cisplatin blocks the cisplatin-induced increase in %ALDH+ cells and spheroid formation. Both DAC treatment and expression of CpGi-null BRCA1, which also blocked the platinum-induced OCSC enrichment, maintained BRCA1 expression levels at or above the levels of untreated cells even after cisplatin treatment. These findings lead us to suggest that there is a “threshold effect” for BRCA1 levels: BRCA1 levels at or above baseline prevent enrichment of ALDH+ cells, and OCSC enrichment occurs when BRCA1 levels fall below baseline in the presence of an activated DDR.
In addition to the DDR-dependent changes in BRCA1 expression, we have reported that a parallel pathway exists where platinum induces an increase in NAD+ levels, and altering this metabolic pathway is also required for platinum-induced OCSC enrichment. Metabolic pathways have been shown to contribute to platinum resistance (44). NAD+ is a cofactor of ALDH enzymes that catalyze the oxidation of aldehydes (21) and are overexpressed in OCSCs. We demonstrated that elevated levels of NAD+ correspond to the timing of ALDH+ cell enrichment. Because NAD+ is a cofactor for ALDH, the platinum-induced increase in cellular NAD+ levels likely drives the increased ALDH activity of OCSCs. Furthermore, inhibition of NAMPT, the rate limiting enzyme for NAD+ synthesis from the salvage pathway, blocked the cisplatin-induced enrichment of ALDH+ cells. These findings are consistent with a recent study linking platinum exposure to increased NAMPT expression and NAD+ levels that are required for platinum-induced senescence-associated enrichment of OCSCs (23). However, we report that these changes occur a very early point post platinum (16 h versus 4 days) and at 16 h we do not observe indicators of senescence such as changes in HMGA1 expression (data not shown), suggesting that our observed increases in NAMPT expression, NAD+ levels and OCSC enrichment occur before and perhaps contribute to platinum-induced senescent phenotypes. Our studies combined with Nacarelli et al. support further preclinical and clinical studies aimed at investigating NAMPT inhibition as a potential therapeutic strategy to prevent the development of platinum resistant OC.
Loss of BRCA1 induces metabolic reprogramming through the Nicotinamide N-methyltransferase (NNMT) pathway in OC cells (46). We show that the platinum-induced decrease in BRCA1 levels occurs concomitantly with increased NAD+ levels. NNMT is also involved in NAD+ synthesis. NNMT transfers methyl group from S-adenosyl methionine (SAM) to nicotinamide (NAM) resulting in 1-methylnicotinamide (MNA) during the conversion of SAM to S-adenosyl-L-homocysteine (SAH). In the NAD+ salvage pathway, NAMPT uses NAM as a substrate, ultimately resulting in the production of NAD+ (19). Therefore, we hypothesized that the decrease in BRCA1 expression and increase in NAD+ levels may be mechanistically connected. However, even though expression of BRCA1 in cells transfected with CpGi-null BRCA1 blocks the platinum-induced increase in %ALDH+ cells, NAD+ levels still increase in these cells (Fig. 7D). Importantly, in BRCA1 mutant HGSOC COV362 cells, cisplatin-induced an increase in NAMPT expression but no enrichment of ALDH+ cells. However, as mentioned, inhibition of NAMPT was sufficient to block the platinum-induced increase in %ALDH+ cells. We suggest that the platinum-induced decrease in BRCA1 and increase in NAMPT and NAD+ levels occur as part of distinct parallel pathways which independently contribute to platinum-induced OCSC enrichment. Future studies will further investigate how these platinum-induced DDR and metabolic alterations result in OCSC enrichment.
Cellular NAD+ is produced primarily in G1 and G2 cell cycle phases (47) and CDK1 inhibition has been shown to promote the nuclear localization of NAMPT to replenish decreased NAD+ levels after CDK1 inhibitor treatment (48). We show that inhibiting CDK1 induces OCSC enrichment that is associated with an increase in NAMPT expression (Fig. 7B) but not a decrease in BRCA1 expression (Fig. 7A), providing support for the hypothesis that the platinum-induced increase in NAMPT expression and NAD+ levels are driven by cell cycle changes independent of changes in BRCA1 expression. In response to DNA damage, BRCA1 is a part of a complex that initiates G2/M arrest to allow time for DNA damage repair (49). Consistent with this role, CpGi-null BRCA1 transfection increases the percentage of cells in the G2/M phase of cell cycle both with and without cisplatin treatment (Supplementary Fig. 6A). Interestingly, further connecting G2/M and NAD+ levels, platinum-treated, CpGi-null BRCA1 transfected cells have elevated NAD+ levels but are not enriched for OCSCs (Fig. 7D, (41)). Together these findings suggest that G2/M arrest leads to increased NAMPT expression and NAD+ levels that contribute to OCSC enrichment; however, after platinum treatment, these changes must occur in conjunction with decreased levels of BRCA1, otherwise OCSC enrichment will be blocked. These data also demonstrate that the effect of BRCA1 overexpression on platinum-induced OCSC enrichment is independent of its effect on cell cycle.
Clinically, DNMT inhibitors have been used to re-sensitize chemoresistant OC cells to chemotherapy (33, 50–53). Our study extends these findings by demonstrating that DNMT inhibitors may also be beneficial when used in combination with neoadjuvant/adjuvant chemotherapy in OC patients where they have the potential to block platinum-induced OCSC enrichment and establishment of platinum resistance. NAMPT inhibitors like FK866 and GMX1778 have been shown to have preclinical antitumor efficacy in vivo by suppressing chemoresistant senescence-associated enrichment of OCSCs (23). NAMPT inhibitors have also been clinically tested in advanced hematological and solid malignancies (54, 55). However, dose limiting toxicities were a significant problem and objective tumor remission was not observed. Even the currently used “low doses” of DNMT inhibitors still result in dose-limiting toxicities and adverse advents (52, 53). Importantly, we demonstrate that the combination of very low dose DNMT inhibitors with low dose metabolic inhibitors provides an effective treatment scheme to prevent onset of platinum resistance in OC. Using lower concentrations of these inhibitors may reduce off-target cytotoxic effects and make the treatment more tolerable to patients.
Methods and Materials
Cell lines, culture conditions, and reagents
Epithelial OC cell lines OVCAR5, OVCAR3, COV362, OVSAHO and PEO1 were maintained at 37°C and 5% CO2 humidified atmosphere using standard conditions (24, 25, 56). All cell lines were tested for mycoplasma in 2017 (ATCC, 30-1012K). For all treatments, 1 million cells were plated in a 100 mm2 dish and treated the next day for the specified number of hours. Cisplatin (EMD Millipore, 232120) was dissolved in 154 mM NaCl at 1.67 nM, filter sterilized and stored at 4 °C. Cells were treated with cell line specific IC50 dose of cisplatin (OVCAR5: 12.00 μM, OVSAHO: 4.00 μM, OVCAR3, 15.00 μM, PEO1: 12.84 μM, COV362: 13.57 μM) (24). CDK1 inhibitor (Sigma-Aldrich, SML0569) was dissolved in DMSO and stored (−20 °C, 10 mM stock solution). Decitabine (Sigma, A3656) was solubilized in dH2O and stored (−80 °C, 2 μg/μL stock solution). Cells were treated with CDK1i (9 μM for 16 h) or DAC (100 nM for 48 h). Media containing fresh DAC was changed every 24 h. Cisplatin was added during the last 16 h of DAC treatment. NAMPT inhibitor (Sigma-Aldrich, SML1348) was dissolved in DMSO and stored (4 °C, 10 mM stock solution). Cells were treated with NAMPTi (50 nM for 6h). For cisplatin and NAMPTi dual treatment, cells were treated with cisplatin as mentioned above, then NAMPTi was added 10 h later. For low dose NAMPTi and DAC combination treatment with cisplatin, cells were treated with DAC (10 nM or 20 nM for 48 h), cisplatin was added in the last 16 h and NAMPTi (12.5 nM) was added during the last 6 h of the DAC treatment. ATM inhibitor KU-55933 (Sigma, MO #SML1109) was dissolved in DMSO and stored (−20 °C, 10 mM stock solution). Cells were treated with 15 μM ATMi for 16 h in combination with cisplatin.
ALDEFLUOR assay and flow cytometry
ALDH activity was measured through ALDEFLUOR assay (Stem Cell technologies, 01700). Cultured cells were trypsinized, washed with 1X PBS and 1 million cells were resuspended in 1 mL ALDEFLUOR assay buffer containing substrate, bodipyaminoacetaldehyde (BAAA). Next, 0.5 mL of resuspended mixture was moved to another tube containing ALDH inhibitor, 5 μL 1.5 mM diethylamino benzaldehyde (DEAB). These solutions were incubated for 30-40 min at 37 °C in the dark. After incubation, cells were centrifuged and resuspended in fresh ALDEFLUOR assay buffer and filtered through a 30 μm filter (Sysmex).
Flow cytometry analysis was performed on a LSRII flow cytometer (BD Biosciences) at IU Flow Cytometry Core Facility. ALDH activity was measured using 488 nm excitation and the signal was detected using the 530/30 filter and analyzed at least three times in independent experiments. For each experiment, 10,000 events were analyzed. ALDH+ percentage gate was determined by sample specific negative control (DEAB) ALDH+ gate. Further data analysis was done in FlowJo software (Becton, Dickinson & Company).
Cell cycle analysis
Nuclear-ID red DNA stain (Enzo Life Sciences, ENZ-52406) was used to analyze cell cycle to allow for combination with the ALDFLUOR assay, which requires live cells. After treatment with cisplatin, cells were trypsinized and resuspended in 1X PBS. Then, 1:250 dilution of Nuclear-ID red DNA stain was added to the total volume and solution was incubated for 30 min at 37 °C in the dark. To determine cell cycle profile for ALDH+ population, cells were first suspended with ALDEFLUOR reagent and incubated for 30 min at 37 °C, followed by Nuclear-ID stain as above and then, analyzed by flow cytometry using the LSRII. Nuclear ID was excited at 561 nm and detected using the 670/30 filter and analyzed at least three times in independent experiments. For each experiment, 10,000 events were analyzed. FlowJo software was used for data analysis.
Quantitative RT-PCR (qRT-PCR)
Total RNA was isolated from cell pellets using RNeasy Mini Kit (Qiagen, 74104) and cDNA was generated using Maxima First Strand cDNA Synthesis Kit for RT-qPCR (Thermo Fisher Scientific, K1642). qPCR was done on a LightCycler 96 using TaqMan MasterMix (Thermo Fisher, 04535286001) or FastStart Essential DNA Green Master (Roche, 06402712001). Cq values for genes of interest were normalized to housekeeping genes (PPIA, β-Actin or RhoA) using the deltaCq method. Detailed information for primers can be found in Supplementary Table S1.
DNA extraction, bisulfite conversion, qMSP and bisulfite sequencing
DNA was extracted from cell pellets using the DNeasy Blood and Tissue Kit (Qiagen, 69504) and bisulfite treated using the EZ DNA Methylation-Gold kit (Zymo Research, D5006). For qMSP, methods were followed as described in a previous publication (57). qMSP primers used are listed in supplementary methods table S1. For bisulfite sequencing, bisulfite converted DNA was amplified using AmpliTaq Gold 360 Mastermix (ThermoFisher Scientific, 4398881) using primers listed in the supplementary methods table S1. Then, the amplified product was run on an agarose gel, the correct band was excised from the gel, and DNA was purified using the QIAquick Gel Extraction kit (Qiagen, 28704). The DNA was then cloned into One Shot™ TOP10 Chemically Competent E. coli using the TOPO™ TA Cloning™ Kit for Sequencing (ThermoFisher Scientific, 451641). The next day, white colonies were inoculated in LB+ carbenicillin media overnight and plasmid was extracted using Zyppy Plasmid Miniprep Kit (Zymo research, D4020) and sequenced by Sanger sequencing. Sequence peaks were analyzed for good quality in 4peaks software and DNA methylation maps were generated through BioAnalyzer (Max-Planck-Institute for Informatics and Saarland University, Saarbrücken, Germany) (58).
Western blot analysis
Cell pellets were lysed in 4% SDS buffer using a QIAshredder (Qiagen, 79654). After protein was extracted, western blotting was performed. Antibodies used are listed in supplementary methods. Band density was measured by ImageJ software (NIH) and normalized to laminB, β-actin or vimentin.
Spheroid formation assay
1.5 × 10⁴ cells pre-treated with cisplatin (6 μM for 3 h), NAMPTi (50 nM for 6 h), and/or DAC (100 nM for 48 h) were plated in a 24-well low attachment plate (Corning, 3473) containing stem cell media (43) for 14 days. Media was added every 3 days to each well. On day 14, images were taken using an EVOS FL Auto microscope (Life Technologies). Then, cell viability reagent (Abcam, ab176748), which measures cell viability be intracellular esterase activity, was added directly to each spheroid well at a volume equal to the volume of media in the well. After 1 h incubation, the reagent+ media solution was distributed in an opaque 96-well plate. Viability (Ex/Em: 405/460 nm) was measured using a SynergyH1 plate reader (BioTek). The experiment was done in 4 technical replicates for each condition.
NAD+/NADH ratio
NAD+/NADH ratio was calculated using NAD+/NADH quantification colorimetric kit (BioVision, K337-100) according to the manufacturer’s instructions.
Transfection
1 million cultured cells were transfected with plasmid using Turbofect (ThermoFisher Scientific, R0532) 48 h before treatment and then cells were collected. pBABEpuro HA-BRCA1 was a gift from Stephen Elledge (Addgene plasmid # 14999; http://n2t.net/addgene:14999; RRID:Addgene_14999) (59). pBABE-puro was a gift from Hartmut Land, Jay Morgenstern and Bob Weinberg (Addgene plasmid # 1764; http://n2t.net/addgene:1764; RRID:Addgene_1764) (60).
Viral shRNA knockdown preparation and stable cell line knockdown generation
For BRCA1 knockdown, shRNA1 (Sigma, TRCN0000244986) and shRNA2 (Sigma, TRCN0000244984) and empty vector (EV) TRC2 (Sigma, SHC201) were used and lentiviral shRNA was created following the protocol as previously described (56). For cell line infection, 2 × 10⁵ cells/mL were plated and after 24 h, virus was added in media with polybrene. Puromycin was added 24 h post-viral infection and cells were plated for downstream experiments once confluent.
Statistical methods
All experiments were performed in at least three biological replicates. When two groups were compared, statistical comparison was performed by Student’s t-test. One-way ANOVA followed by Tukey post hoc test was used to compare multiple groups using Graphpad Prism.
Conflict of Interest Statement
The authors declare no competing interests.
Author Contribution Statement
R.S., K.P.N. and H.O.H performed study concept and design; R.S. and H.O.H. performed development of methodology and writing; R.S, C.H., K.P.N., H.O.H., S.S. performed review and revision of paper; R.S., S.K. and S.S. provided acquisition, analysis and interpretation of data and statistical analysis; C.H. provided technical and material support
Ethics statement
Study did not require ethical approval
Funding statement
This research was funded by Ovarian Cancer Research Alliance grant number 458788 to HMOH and KPN and in part through the IU Simon Cancer Center P30 Support Grant (P30CA082709). SS was supported by the Doane and Eunice Dahl Wright Fellowship generously provided by Ms. Imogen Dahl.
Acknowledgments
We thank the Indiana University Flow Cytometry Core Facility for their assistance.
Footnotes
Conflict of interest: The authors declare no conflict of interest.
References:


