

SUMMARY
Inhibitors of poly(ADP-ribose) (PAR) polymerase (PARPi) have entered the clinic for the treatment of homologous recombination (HR)-deficient cancers. Despite the success of this approach, preclinical and clinical research with PARPi has revealed multiple resistance mechanisms, highlighting the need for identification of novel functional biomarkers and combination treatment strategies. Functional genetic screens performed in cells and organoids that acquired resistance to PARPi by loss of 53BP1, identified loss of LIG3 as an enhancer of PARPi toxicity in BRCA1-deficient cells. Enhancement of PARPi toxicity by LIG3 depletion is dependent on BRCA1 deficiency but independent of the loss of 53BP1 pathway. Mechanistically, we show that LIG3 is required for PARPi-induced fork acceleration in BRCA1-deficient cells and that LIG3 loss increases fork asymmetry. Furthermore, LIG3 depletion in BRCA1-deficient cells results in an increase in ssDNA gaps behind the replication forks, resulting in accumulation of chromosomal abnormalities. We also report that high expression of LIG3 in patients with invasive breast cancer correlates in with poorer overall survival, rendering LIG3 as a potential therapeutic target for enhancing PARPi sensitivity.
INTRODUCTION
Defects in DNA repair result in genome instability and thereby contribute to the development and progression of cancer. Alterations in high-fidelity DNA repair genes lead to a greater reliance on compensatory error-prone repair pathways for cellular survival. This does not only result in the accumulation of tumor-promoting mutations, but also provides cancer-specific vulnerabilities that can be exploited for targeted cancer therapy. The first example of such targeted approach was the use of poly(ADP-ribose) polymerase (PARP) inhibitors (PARPi) in the treatment of BRCA1 or BRCA2 deficient tumors defective in the error-free repair of DNA double-strand breaks (DSBs) through homologous recombination (HR) (Bryant et al., 2005; Farmer et al., 2005).
PARP1, which is the main target for PARPi is involved in various cellular processes, including the sensing of DNA single-strand breaks (SSBs), repair of DNA DSBs, stabilization of replication forks (RFs), chromatin remodeling (reviewed by Ray Chaudhuri and Nussenzweig 2017) and the sensing of unligated Okazaki fragments during DNA replication (Hanzlikova et al., 2018). Upon DNA damage, PARP1 is rapidly recruited to sites of DNA damage where it post-translationally modifies substrate proteins by synthesizing poly(ADP-ribose) (PAR) chains in a process known as poly(ADP-ribosyl)ation (PARylation). During this process, PARP1 itself is a target of PARylation and the resulting PAR chains serve as a platform for the recruitment of downstream repair factors. AutoPARylation of PARP1 also enhances its release from DNA, which is essential for various DNA repair processes (Pascal and Ellenberger, 2015).
Initially, it was proposed that PARPi act through catalytic inhibition of PARP1, which prevents efficient repair of SSBs resulting in RF collapse and subsequent generation of DSBs during DNA replication (Lupo and Trusolino, 2014). However, later studies have demonstrated that several PARPi also trap PARP1 onto chromatin, resulting in the collapse of RFs that hit trapped PARP1 (Helleday, 2011; Murai et al., 2012, 2014). PARPi-treated BRCA1/2-defective cells can only employ error-prone repair to resolve the DSBs caused by RF collapse, resulting in accumulation of chromosomal aberrations and cell death by mitotic catastrophe (Lupo and Trusolino, 2014). Successful clinical trials have resulted in the recent approval of different PARPi for treatment of patients with BRCA1/2-mutant ovarian and breast cancers (Pilié et al., 2019). Moreover, antitumor activity of PARPi has been observed across multiple other cancer types, such as prostate and gastrointestinal cancers (Pilié et al., 2019).
Despite the success of this approach, multiple mechanisms of resistance to PARPi have been identified. Preclinical studies have shown that PARPi resistance can be induced by upregulation of the P-glycoprotein drug efflux transporter (Evers et al., 2008; Rottenberg et al., 2008), PARP1 downregulation/inactivation (Murai et al., 2012; Pettitt et al., 2013), mutations that abolish PARP1 trapping (Pettitt et al., 2018), and loss of the PAR glycohydrolase (PARG) responsible for PAR degradation (Gogola et al., 2018; Pascal and Ellenberger, 2015). Sensitivity to PARPi resistance may also be reduced by mechanisms that restore RF protection in the absence of BRCA1/2 (Lee et al., 2018; Ray Chaudhuri et al., 2016; Rondinelli et al., 2017).
The best-studied mechanisms of PARPi resistance in BRCA1/2-deficient cells involve restoration of HR activity via re-activation of BRCA1/2 function or via loss of factors that govern DSB end-protection in BRCA1-deficient cells. HR restoration due to re-established BRCA1/2 function has been observed in patients with PARPi-resistant breast cancer (Afghahi et al., 2017; Barber et al., 2013) and ovarian cancer (Barber et al., 2013; Edwards et al., 2008; Kondrashova et al., 2017). Restoration of HR via loss of DSB end-protection in BRCA1-associated tumors may be achieved by loss of 53BP1, RIF1, REV7, or components of the shieldin complex and the CST complex (Boersma et al., 2015; Bouwman et al., 2010; Bunting et al., 2010; Chapman et al., 2013; Dev et al., 2018; Escribano-Díaz et al., 2013; Feng et al., 2013; Ghezraoui et al., 2018; Gupta et al., 2018; Jaspers et al., 2013; Noordermeer et al., 2018; Xu et al., 2015; Zimmermann et al., 2013). Altogether, these studies underscore the high selective pressure for PARPi-treated tumors to restore HR for survival.
Drug resistance often comes at a fitness cost due to collateral vulnerabilities which can be exploited to improve therapy response. PARG inactivation causes PARPi resistance but results in increased sensitivity to ionizing radiation (IR) and temozolomide (Amé et al., 2009; Gogola et al., 2018). BRCA1-deficient tumors that acquired resistance to PARPi due to loss of the 53BP1 pathway have also been shown to become more radiosensitive (Barazas et al., 2019). In a similar fashion, loss of the NHEJ factors LIG4 or XRCC4 results in resistance to the DNA-damaging agent topotecan in ATM-deficient cells at the cost of increased radiosensitivity (Balmus et al., 2019). However, not much is known about the vulnerabilities that can be exploited to re-sensitize BRCA1- deficient PARPi resistant tumors to PARPi treatments again. In this study, we identified DNA ligase III (LIG3), a known SSBs and DSBs repair factor (Caldecott et al., 1996; Cappelli et al., 1997; Simsek et al., 2011; Wang et al., 2005), as a collateral vulnerability of BRCA1-deficient cells with acquired PARPi resistance due to loss of DSB end-protection. We show that loss of LIG3 enhances the toxicity of PARPi in these cells, rendering LIG3 as a potential therapeutic target to overcome PARPi resistance.
RESULTS
Functional Genetic Dropout Screens Identify LIG3 as a Modulator of PARPi-resistance in Brca1−/−;Trp53bp1−/− cells
To identify acquired vulnerabilities in BRCA1-deficient cells which developed PARPi resistance via BRCA1-independent restoration of HR, we carried out functional genetic dropout screens in two types of cellular models deficient for BRCA1, p53 and 53BP1. The first screen was performed in two-dimensional (2D) Brca1−/−;Trp53−/−;Trp53bp1−/− mouse embryonic stem cells (mESCs). The second screen was performed in the three-dimensional (3D) BRCA1-deficient organoid line ORG-KB1P4.R1, derived from a K14cre;Brca1F/F;Trp53F/F (KB1P) mouse mammary tumor that acquired resistance to PARPi in vivo due to loss of 53BP1 function (Duarte et al., 2018). Both cellular models were transduced with a lentiviral library of 1,976 short hairpin RNA (shRNA) constructs targeting 391 DNA damage response (DDR) related genes (Gogola et al., 2018; Xu et al., 2015). Cells were either mock treated or selected for 3 weeks in the presence of the PARPi olaparib (Figure 1A). Olaparib selection was carried out at a concentration which did not affect the viability of resistant cells, but lethal to the corresponding PARPi-sensitive cells. Sequencing of the shRNAs in the surviving cells revealed a specific and reproducible dropout of hairpins targeting Lig3 in the olaparib-treated cell population (Figure1B and S1A, Table S1). Furthermore, Lig3 was observed to be the only common significant dropout gene identified across both screens (Figure 1C). We therefore decided to investigate further whether LIG3 would constitute a useful target for the reversion of PARPi resistance.

(A) Outline of the functional shRNA-based dropout screens. The screens were carried out at an olaparib concentration of 25nM and 50nM for Brca1−/−, Trp53−/−; Trp53bp1−/− mES cells (mESCs) and KB1P4.R1 organoids, respectively. (B) Log ratio (fold change) versus abundance (mean of norm counts) plot representing the screening outcome in mouse embryonic stem cells (mESCs) treated with olaparib and analyzed by MAGeCK. (C) Comparison of the screening outcome between indicated cell lines, p-value by MAGeCK. (D) Quantification of long-term clonogenic assay with ORG-KB1P4.R1, (E) ORG-KB1P4.N1, and (F) ORG-KPM.1 organoids treated with olaparib or untreated. (G) Schematic representation of Brca1 selectable conditional allele. In addition to a Brca1Δ5-13 null allele, these cells contain a Brca1 Selectable Conditional knockout allele, Brca1SCo, in which exons 5 and 6 are flanked by loxP recombination sites. Incubation of these cells with 4-hydroxytamoxifen (4OHT) induces a CreERT2 recombinase fusion protein, resulting in nearly complete switching of the Brca1SCo allele and consequent loss of BRCA1 protein expression (H) Quantification of long-term clonogenic assay with R26creERT2;Brca1SCo/–;Trp53−/−;Trp53bp1−/− mESCs treated with olaparib, with and without treatment with 4OHT. See also Figure S2. (I) Quantification of long-term clonogenic assay in RPE1-hTERT TP53−/− (SKO), RPE1-hTERT TP53−/−;BRCA1−/− (DKO) and RPE1-hTERT TP53−/−;BRCA1−/−;TP53BP1−/− (TKO) ; treated with olaparib. See also figure S2. Data are represented as mean ± SD. **p<0.01, ***p<0.001, ****p<0.0001, n.s., not significant; two-tailed t test.
Depletion of LIG3 Increases the Sensitivity to PARPi, Independently of 53BP1 Loss
To validate the findings of our shRNA screens, we carried out viability assays using shRNA-mediated depletion of LIG3 in ORG-KB1P4.R1 organoids. LIG3 depletion significantly increased the sensitivity to olaparib, when compared to the parental cells (Figure 1D and S1B). Increased sensitivity to olaparib was also observed upon depletion of LIG3 in PARPi-resistant KB1P-177a5 cells, derived from an independent PARPi-resistant KB1P tumor with 53BP1 loss (Jaspers et al. 2013) (Figure S1C,D). These results confirm that loss of LIG3 results in re-sensitization of BRCA1 and 53BP1 co-deficient cells to PARPi. Furthermore, depletion of LIG3 also reverted the reduced sensitivity to olaparib in KB1P mammary tumor cells depleted of REV7, a downstream partner of 53BP1 (Boersma et al., 2015; Xu et al., 2015) (Figure S1E,F), indicating that LIG3-mediated resistance is not exclusive for 53BP1-deficient cells.
We next asked whether LIG3 depletion would also increase the PARPi sensitivity of treatment-naïve BRCA1-defcient tumor cells with functional 53BP1. To test this, we used ORG-KB1P4.N1 organoids and KB1P-G3 cells derived from PARPi-naïve KB1P tumors (Duarte et al., 2018; Jaspers et al., 2013). In both cellular models, shRNA-mediated depletion of LIG3 resulted in increased sensitivity to olaparib (Figure 1E and S1B,G,H). Depletion of LIG3 also resulted in increased sensitivity to olaparib in the human BRCA1-mutant breast cancer cell line SUM149PT (Figure S1I,J). Importantly, our results were not restricted to olaparib, as LIG3 depletion also increased the sensitivity of KB1P cells to the PARPi talazoparib and veliparib (Figure S1K).
PARPi Sensitization of Cells by LIG3 Depletion is Dependent on BRCA1 Status
Next, we sought to investigate whether the increased PARPi sensitivity of LIG3-depleted cells is BRCA1-dependent. shRNA-mediated depletion of LIG3 in BRCA-proficient ORG-KPM.1 organoids, derived from K14cre;Trp53F/F (KP) mouse mammary tumors (Duarte et al., 2018), slightly increased the sensitivity to PARPi, but only at a high concentration of 10μM (Figure 1F and S2A). To corroborate these data, we validated the effect of LIG3 depletion in R26creERT2;Brca1SCo/–;Trp53-–/–;Trp53bp1-–/– mESCs, in which addition of 4-hydroxytamoxifen (4OHT) induces BRCA1 inactivation via Cre-mediated deletion of the remaining Brca1 allele (Figure 1G) (Bouwman et al. 2010). Since these mESCs are deficient for p53 and 53BP1, no difference in olaparib sensitivity was observed between the BRCA1-proficient (-4OHT) and BRCA1-deficient (+4OHT) cells (Figure 1H). Also shRNA-mediated depletion of LIG3 did not affect cell proliferation in untreated BRCA1-proficient and BRCA1-deficient mESCs. However, LIG3 depletion did result in increased olaparib sensitivity in BRCA1-deficient cells, compared to unmodified cells (Figure1H and S2B,C,D).To investigate whether the effect was independent of the loss of 53BP1, we repeated this experiment in R26creERT2;Brca1SCo/–;Trp53-–/– mESCs. Also, in these 53BP1-proficient mESCs, depletion of LIG3 increased the sensitivity to PARPi in BRCA1-deficient cells but not BRCA1-proficient cells (Figure S2B,E-G).
Additionally, we tested depletion of LIG3 in three isogenic human TERT-immortalized retinal pigment epithelial (RPE1) cell lines with engineered loss of TP53 (RPE1-SKO), TP53+BRCA1 (RPE1-DKO), or TP53+BRCA1+TP53BP1 (RPE1-TKO). In line with the data observed in mouse cells, shRNA-mediated depletion of LIG3 did not increase sensitivity to olaparib in RPE1-SKO cells, but rendered RPE1-TKO cells as sensitive to olaparib as the RPE1-DKO cells (Figure1I and S2H). In addition, depletion of LIG3 further increased sensitivity of RPE1-DKO cells to olaparib. Taken together, our data show that LIG3 depletion enhances the toxicity of PARPi in BRCA1-deficient cells which acquired resistance due to loss of DSB end-protection, indicating that LIG3 is an important modulator of the PARPi response specifically in BRCA1-deficient cells.
Resistance to PARPi in 53BP1-deficient KB1P cells is Mediated by Nuclear LIG3
The LIG3 gene encodes both mitochondrial and nuclear proteins (Lakshmipathy and Campbell, 1999). Importantly, mitochondrial LIG3 is essential for cellular viability as it ensures mtDNA integrity (Puebla-Osorio et al., 2006). Consequently, complete deletion of Lig3 results in cellular death and early embryonic lethality in mice, whereas nuclear LIG3 has been shown to be dispensable for cell viability (Simsek et al., 2011). We therefore asked whether the increased PARPi sensitivity of LIG3-depleted BRCA1-deficient cells resulted from loss of LIG3 activity in the nucleus or in the mitochondria. To test this, we generated nuclear Lig3 knockout cells which only express the mitochondrial form of LIG3. To this end, we used 53BP1-deficient KB1P-177a5 mouse tumor cells in which we introduced an ATG>CTC mutation in the internal translation initiation site that is required for expression of the nuclear LIG3 isoform but does not affect expression of mitochondrial LIG3 (Figure 2A) (Lakshmipathy and Campbell, 1999). Next, we analyzed LIG3 protein expression in different single cell clones with heterozygous or homozygous ATG>CTC mutations in Lig3 (Figure 2B). Immunofluorescence analysis of LIG3 in two homozygous clones (A3 and F5) and one heterozygous clone (B1) revealed that parental KB1P-177a5 cells and the heterozygous clone displayed LIG3 staining in both nucleus and mitochondria, whereas the homozygous clones exhibited loss of nuclear LIG3 expression (Figure 2C). Finally, we investigated whether the nuclear mutants of LIG3 displayed increased sensitivity to PARPi. Long-term clonogenic assays revealed that the nuclear LIG3-deficient KB1P-177a5 clones A3 and F5 showed similar sensitivity to olaparib as PARPi-sensitive KB1P-G3 cells, whereas the PARPi-resistant parental KB1P-177a5 cells and the heterozygous B1 clone displayed comparable resistance to olaparib (Figure 2D). Taken together, our data show that nuclear LIG3 mediates PARPi resistance in 53BP1-deficient KB1P cells.

(A) Schematic representation of the generation of nuclear mutants. LIG3 gene contains two translation initiation ATG sites. The sequence flanked by both ATG sites functions as a mitochondrial targeting sequence. If translation is initiated at the upstream ATG site, a mitochondrial protein is produced, whereas translation initiated at the downstream ATG site produces the nuclear form. Ablation of the nuclear ATG allows cells to retain mitochondrial LIG3 function, but not nuclear function. CRISPR/Cas9 system was used to introduce in-frame ATG>CTC mutation in the nuclear ATG through the delivery of an homology repair template. (B) Immunoblot of LIG3 in whole cell lysates of KB1P-177a5, parental, heterozygous and homozygous mutants. (C) Immunostaining of LIG3 together with MitoTracker staining to examine the subcellular localization of LIG3 in mutant cells. (D) Quantification and (E) representative images of long-term clonogenic assay with KB1P-G3, KB1P-177a5, parental and mutant cells, treated with olaparib or untreated. Data are represented as mean ± SD. ***p<0.001, ****p<0.0001; two-tailed t test
PARP1 Trapping Contributes to PARPi Toxicity in LIG3-Depleted cells
Most PARPi, in addition to blocking the catalytic activity of PARP1, also induce toxic PARP1-DNA complexes as result of their trapping capacity (Murai et al., 2012, 2014). We therefore decided to test if enhanced PARPi sensitivity induced by LIG3 depletion is mediated by PARP1 trapping or by loss of PARP1 catalytic activity, which can be mimicked by genetic deletion of Parp1. We therefore generated Parp1 knockout clones in R26creERT2;Brca1SCo/–;Trp53−/−;Trp53bp1−/− mESCs using two different sgRNAs and selected two clones for further experiments (Figure S2I). Immunoblot analysis showed that both Parp1 knockout clones displayed decreased levels of PAR, confirming functional loss of PARP1 (Figure S2J). siRNA-mediated depletion of LIG3 did not affect the viability of either BRCA1-proficient (-4OHT) or BRCA1-deficient (+4OHT) Parp1 knockout clones (Figure 3A), indicating that the sensitization to PARPi observed upon LIG3 depletion relies on PARPi-mediated PARP1 trapping rather than catalytic inactivation. It is important to note that PARP1 accounts for more than 80% of PAR synthesis, while PARP2, another member of the ADP-ribosyltransferase family, accounts for the remainder (Amé et al., 1999). In addition, PARP2 has been reported to sufficient for the recruitment of downstream factors (Hanzlikova et al., 2017). Although our results could be explained by a compensatory mechanism mediated by PARP2, PARP1 knockout clones did show a significant decrease in PARylation levels (Figure S2J) and no increased expression of PARP2 (Figure S2K).
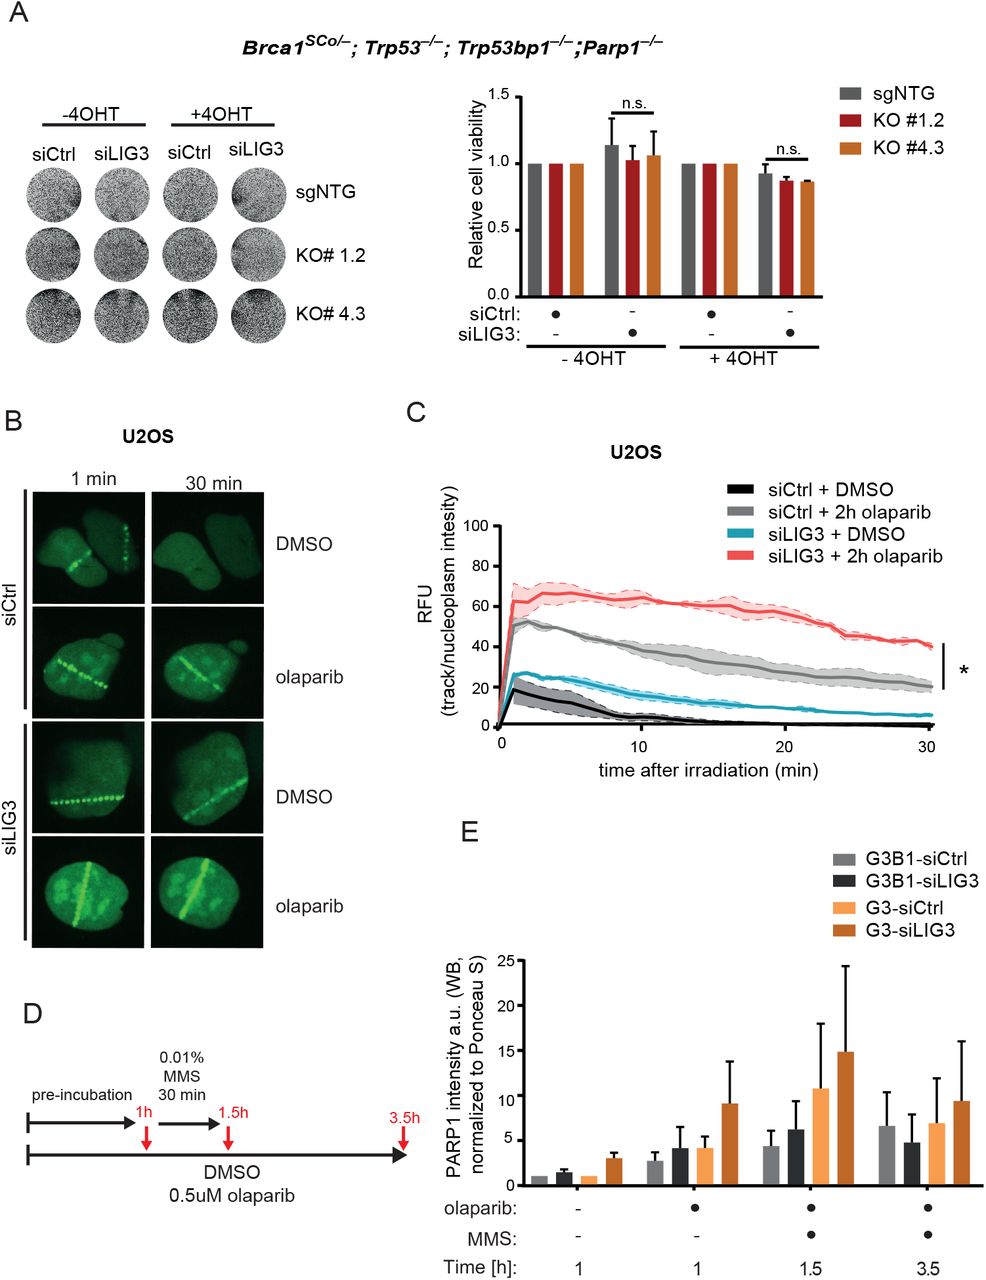
(A) Representative images (left panel) and quantification (right panel) of viability assay after siRNA-mediated depletion of LIG3 in R26creERT2;Brca1SCo/–;Trp53−/−;Trp53bp1−/−;Parp1−/− mESCs clones, with and without treatment with 4OHT. (B) Representative images and (C) quantification of analysis of PARP1 recruitment kinetics to micro-irradited tracks in U2OS PARP1-GFP cells, following the indicated treatments. (D) Experimental outline and (E) quantification of immunoblot analysis of PARP1 in chromatin-bound fractions, upon LIG3 depletion, in KB1P-G3B1 and KB1P-G3 cells. Cells were pre-incubated with 0.5µM olaparib for 1 hr; and then exposed to the same treatment but in the presence of 0.01% MMS for 30 min; following incubation with MMS cells were further incubated with olaparib for 2 hr. Data are represented as mean ± SD. *p<0.05, ***p<0.001, ****p<0.0001; n.s., not significant; two-tailed t test.
Next, we tested whether depletion of LIG3 influences the levels of PARP1 trapping on chromatin. To this end, we measured PARP1 association kinetics by quantification of GFP-PARP1 levels at UV laser-induced DNA damage sites in U2OS cells. The intensities of laser tracks in cells expressing GFP-PARP1 were quantified every 1 min for 30 min post irradiation. As expected, olaparib treatment resulted in an increase in chromatin associated PARP1 after 30 min, when compared to untreated cells (Figure 3B, C). siRNA-mediated depletion of LIG3 alone resulted in a slight increase in chromatin-associated PARP1 in untreated U2OS cells, and in a more profound increase in PARP1 accumulation in olaparib-treated cells (Figure 3B, C and S2L). We further verified these findings by quantifying the levels of chromatin-bound PARP1 in BRCA1-deficient KB1P-G3 cells and isogenic KB1P-G3B1 cells reconstituted with human BRCA1 (Barazas et al., 2019), using a previously described trapping assay (Figure 3D) (Gogola et al., 2018; Murai et al., 2012). Immunoblot analysis showed an olaparib-dependent accumulation of PARP1 in chromatin fractions, which further increased upon treatment with the alkylating agent methyl methanesulfonate (MMS) (Figure 3E and S2M). Although we didn’t reach statistical significancy, we observed a consistent tendency for increased PARP1 trapping upon siRNA-mediated depletion of LIG3 in all treatment conditions, which seemed to be most prominent in BRCA1-deficient KB1P-G3 cells than BRCA1-proficient KB1P-G3B1 cells (Figure 3E and S2M). Together, these results suggest that the increased PARPi sensitivity observed upon LIG3 depletion in BRCA1 deficient cells is mediated by enhanced PARPi-driven PARP1 trapping.
LIG3 is Required for PARPi-induced Increase in Fork Speed in BRCA1-Deficient Cells
Our data indicates that the increase in sensitivity to PARPi arising from LIG3 depletion is independent of the loss of DSB end-protection, and therefore independent of HR status. Hence, we hypothesized that depletion of LIG3 would not affect HR levels in cells which have restored this pathway due to loss of 53BP1. To test this hypothesis, we carried out RAD51 ionizing radiation-induced foci (RAD51 IRIF) in our mouse tumor-derived cell lines as a read-out of functional HR status (Xu et al., 2015). As expected, BRCA1-deficient KB1P-G3 cells had significantly less IRIF per cell than the BRCA1-proficient KP-3.33 cells, while the BRCA1- and 53BP1-deficent KB1P-177a5 cells displayed increased numbers of IRIF compared with KB1P-G3 (Figure S3A). Moreover, neither shRNA-mediated depletion of LIG3 nor deletion of LIG3 nuclear isoform led to a significant reduction of RAD51 IRIF (Figure S3A), corroborating our hypothesis that the sensitivity observed in LIG3-depleted cells is not a result of decreased HR in these cells.
Data from recent studies indicates that LIG3 could be involved in ligation of okazaki fragments, as part of PARP1 and XRCC1-dependent “backup” pathway (Arakawa and Iliakis, 2015; Hanzlikova et al., 2018). Therefore, we next investigated whether LIG3 localizes to sites of DNA replication marked by 5-ethynyl-2’-deoxyuridine (EdU) incorporation, in the absence of DNA damage induction. To test this, we performed proximity ligation-based assays (PLA) to detect LIG3 binding to replicated DNA (Mukherjee et al., 2019; Taglialatela et al., 2017), in BRCA1-proficient KP-3.33, BRCA1-reconstituted KB1P-G3B1 cells, and in BRCA1-deficient KB1P-G3 cells. Interestingly, untreated KB1P-G3 cells showed significantly higher levels of LIG3-EdU PLA foci than KP-3.33 or KB1P-G3B1cells (Figure 4A, B and S3B, and C). We next tested if LIG3 localization at replication sites is affected by PARPi treatments which would trap PARP1 at replication forks. Therefore, we carried out LIG3-EdU PLA after incubating cells with olaparib for 2hr. Quantification of LIG3-EdU PLA foci revealed that PARPi treatment did not induce any increase in the number of foci in KB1P-G3B1 cells. In contrast, BRCA1-deficient KB1P-G3 cells displayed a striking increase in the number of PLA foci after olaparib treatment (Figure 4A and S3B).

(A) Outline of experimental set up, representative images and quantification of PLA between LIG3 and EdU, in in KB1P-G3B1 and KB1P-G3 cells incubated for 10 min with 20μM EdU, in the absence or presence of 0.5μM olaparib. (B) Outline of experimental set up, representative images and quantification of Proximity Ligation assay (PLA) between LIG3 and EdU, in KP-3.33 and KB1P-G3 cells incubated for 10 min with 20μM EdU, in the absence or presence of PARG. (C) Outline of DNA fiber assay experimental set up and representative images of DNA replication forks. Cells were pre-incubated with 0.5μM olaparib for 80 min, followed by sequential labelling with CldU (red) and IdU (green) in the presence of olaparib for 40min. Progression was measured by tract lengths of CldU and IdU in micrometers (μM) (D) Quantification of fork speed in CldU tracks, following the indicated treatments, in KB1P-G3B1 and KB1P-G3 cells. See also figure S3. (E) Quantification of fork symmetry following the indicated treatments, in KB1P-G3 and KB1P-G3B1 cells. (F) Quantification of fork speed in CldU tracks, following the indicated treatments, in KB1P-G3 and KB1P-177a5 cells. See also figure S3. (G) Quantification of fork symmetry following the indicated treatments, in KB1P-G3 and KB1P-177a5 cells. Data are represented as mean ± SD,***p<0.001 ****p<0.0001; n.s., not significant; Mann–Whitney U test.
We next investigated whether LIG3 localization at replication sites is affected by the PARG inhibitor (PARGi) PDDX-001, which is known to increase PAR levels and also result in the trapping of PARP1 on chromatin (Gogola et al., 2018; Hanzlikova et al., 2018; James et al., 2016). We therefore carried out LIG3-EdU PLA after incubating cells with PARGi for 30 min. Similar to olaparib-treated cells, PARGi-treated BRCA1-deficient cells showed a strong increase in the number of LIG3-EdU PLA foci, while no significant changes were observed in KP-3.33 cells (Figure 4B and S3C). Co-localization of LIG3 at EdU-marked replication sites after PARGi treatment was also verified qualitatively by LIG3 immunostaining in KP-3.33, KB1P-G3 cells and KB1P-177a5 cells (Figure S3D). Taken together, our data strongly suggest that LIG3 localization at replication sites is enhanced in BRCA1-deficient cells, which is further increased by PARP1 trapping, rather than changes in PARylation levels.
Since LIG3 seems to play a role at replication sites in BRCA1-deficient conditions, we asked whether depletion of LIG3 would affect RF progression in untreated and PARPi-treated BRCA1-deficient cells. To test this, we performed DNA fiber assay in BRCA1-deficient KB1P-G3 and BRCA1-reconstituted KB1P-G3B1 cells. Cells were pre-incubated with low concentrations of (0.5μM) olaparib for 80 min, followed by sequential labelling with CldU (red) and IdU (green) for 20 mins each in the presence of olaparib (Figure 4C). Progression was measured by tract lengths of CldU and IdU. Analysis of RF speeds revealed no significant increase in BRCA1-proficient KB1P-G3B1 cells after olaparib treatment (Figure 4D, S3E and F). In contrast, BRCA1-deficient KB1P-G3 cells exhibited an increase in RF speed upon olaparib treatment, in line with previous work (Maya-Mendoza et al., 2018). Surprisingly, while depletion of LIG3 did not affect RF speed in untreated cells, it significantly suppressed the PARPi-induced increase in fork speed in KB1P-G3 cells (Figure 4D, S3E and F). We hypothesized that this might be due to an increase in RF stress rather than a return to normal fork progression. Therefore, we next analyzed RF symmetry in BRCA1-proficient and-deficient cells by measuring sister fork-ratio (Figure 4C and E). While BRCA1-proficient KB1P-G3B1 cells did not show any significant differences in fork symmetry across conditions, depletion of LIG3 induced a significant increase in sister fork asymmetry in BRCA1-deficient KB1P-G3 cells exposed to olaparib (Figure 4E). These data corroborate our hypothesis that the lack of PARPi-induced fork acceleration observed in LIG3-depleted BRCA1-deficient cells is a result of persistent RF stalling upon loss of LIG3 rather than a rescue of fork speed. Furthermore, as observed in KB1P-G3 cells, olaparib treatments in BRCA1- and 53BP1-deficent KB1P-177a5 cells increased fork speed, which was rescued by depletion of LIG3 (Figure 4F, S3F and G). Interestingly, depletion of LIG3 alone in KB1P-177a5 cells resulted in fork asymmetry, which was further enhanced by olaparib treatment (Figure 4G). To confirm our results, we also performed DNA fiber assays in BRCA1- and 53BP1-depleted hTERT-RPE1 TKO cells and measured fork speed (Figure S3H, I and J). As observed in KB1P-177a5 cells, treatment with olaparib resulted in an increase in fork speed, which was reversed by depletion of LIG3 (Figure S3J), corroborating the previous findings (Figure 4F and S3G). Overall, our results support the notion that the PARPi-induced increase in RF progression in BRCA1-deficient cells is mediated by LIG3. Depletion of LIG3 in BRCA1-deficient cells exposed to PARPi leads to slower and asymmetric forks, which could result in increased genomic instability.
LIG3 Depletion Reverts PARPi Resistance by increasing ssDNA Gaps but not DSBs
PARPi sensitivity in BRCA-deficient cells could result from an accumulation of replication-associated single-stranded DNA (ssDNA) gaps (Cong et al., 2019). Since LIG3 could be involved in ligation of okazaki fragments, we asked whether LIG3 depletion would result in an increase of replication associated ssDNA gaps. To test this, we cultured KB1P-G3B1, KB1P-G3 and KB1P-177a5 mouse tumor cells in medium supplemented with BrdU for 48hr, followed by a 2hr-treatment with olaparib, and quantification of native BrdU intensity by quantitative image-based cytometry (QIBC) (Toledo et al., 2013) (Figure 5A). No changes in ssDNA levels were observed in BRCA1-proficient KB1P-G3B1 cells, independently of olaparib treatment or LIG3 depletion (Figure 5B and S4A). However, treatments with olaparib resulted in a significant increase in ssDNA levels in the S-phase cells of BRCA1-deficient KB1P-G3 cells but not in the BRCA1- and 53BP1-deficent KB1P-177a5 cells (Figure 5B, C, S4A and B). Interestingly, LIG3-depletion alone resulted in an increase in ssDNA levels in both KB1P-G3 and KB1P-177-a5 cells, independently of olaparib treatment (Figure 5B, C, S4A and B). To confirm our results, we have also carried out DNA fiber assay in hTERT-RPE1 TKO cells and measured RF track length in presence of olaparib, followed by incubation with the S1 nuclease, which digests ssDNA (Quinet et al., 2016, 2017) (Figure S3H, I and K). If nascent PARPi-induced ssDNA regions are within the labeled replication tracts, shorter visible CldU/IdU tracks will be observed (Cong et al., 2019). Incubation with S1 nuclease in untreated cells did not substantially decrease the size of the tracks of LIG3-depleted cells (Figure S3K). On the contrary, S1 nuclease treatment in olaparib-treated cells resulted in shorter tracks in LIG3-depleted cells in comparison with unmodified cells (Figure S3K). These results suggest that the ssDNA gaps formed upon depletion of LIG3 are in the vicinity of RF.

(A) Outline of experimental set up to analyze ssDNA gaps by immunofluorescence assay. Cell were incubated with BrdU for 48 hr followed by 2 hr treatment with 0.5μM olaparib or left untreated. (B) High-content microscopy of ssDNA in KB1P-G3B1, KB1P-G3 and (C) KB1P-177a5 mouse tumor cells. (D) Representative electron micrographs and (E) quantification of internal ssDNA gaps behind replication fork observed upon treatment with 0.5μM olaparib for 2hr in KB1P-G3 cells, depleted or not of LIG3. Left panel represents a normal fork. Right panel represents a fork with internal ssDNA gaps. Big scale bar: 250nm (250nm = 1214bp); small scale bar: 50nm (50nm = 242bp). P; parental. D; daughter. (F) Quantification of chromosomal aberrations following 2 hr treatment with 0.5μM olaparib and recovery for 6 hr, in KB1P-G3B1, KB1P-G3 and KB1P-177a5 mouse tumor cells. Data are represented as mean ± SD, *p<0.01, ***p<0.001, ****p<0.0001; n.s., not significant; two-tailed unpaired t-test.
Next, to test if the increase of ssDNA observed was indeed in the vicinity of replication forks, we used electron microscopy (EM) to visualize the fine architecture of replication intermediates in KB1P-G3 cells after 2hr-treatement with olaparib. In untreated conditions, a minority of the DNA molecules displayed 1-2 ssDNA gaps behind the fork, whereas olaparib treatment enhanced the percentage of molecules displaying 1-2 ssDNA gaps as well as resulted in molecules displaying 3 and more ssDNA gaps. Depletion of LIG3 alone resulted in similar numbers of internal ssDNA gaps as those of unmodified cells treated with olaparib, while olaparib treatment of LIG3-depleted cells resulted in a further increase specifically in molecules with more than 3 gaps (Figure 5D, E). Together, these results suggest that LIG3 is required for suppression of ssDNA gaps in BRCA1-deficient cells.
Next, we tested whether increased ssDNA gaps behind the forks upon LIG3-depletion resulted in increased genomic instability in KB1P-G3B1, KB1P-G3 and KB1P-177a5 mouse tumor cells. We analyzed chromosomal aberrations in metaphase spreads after treatment with olaparib for 2hr followed by a 6hr recovery. As expected, chromosome aberrations were unaltered in KB1P-G3B1 cells, independently of LIG3 depletion or olaparib treatment (Figure 5F and S4C). In contrast, olaparib treatment resulted in increased numbers of chromosomal aberrations in unmodified KB1P-G3 cells, which was further enhanced by LIG3 depletion and olaparib treatment (Figure 5F and S4C). KB1P-177a5 cells did not show an increase in chromosomal aberrations upon olaparib treatment, as anticipated. However, depletion of LIG3 resulted in a surge in chromosome aberrations comparable to olaparib-treated KB1P-G3 cells, independently of olaparib treatment (Figure 5F and S4C). Altogether, our results indicate that LIG3 depletion results in an increase in chromosomal aberrations in BRCA1-deficient cells, suggesting that LIG3 is responsible for maintaining genomic stability in Brca1−/− and Brca1−/−;Trp53bp1−/− cells.
Next, we questioned if the increase in ssDNA gaps can ultimately result in an increase in DSBs, which then would result in the observed increase in genomic instability. To this, end we performed pulsed-field gel electrophoresis (PFGE) in KB1P-G3B1, KB1P-G3 and KB1P-177a5 mouse tumor cells treated with 0.5μM olaparib for 2 hr and released for 4 or 14 hr. While KB1P-G3B1 cells only showed an increase in DSBs after 14hr release, KB1P-G3 cells already displayed higher levels of DSBs after 4h release, which was maintained until 14hr post release (Figure S4D). We did not observe any changes in DSB levels in the resistant KB1P-177a5 cells at any of the tested time-points (Figure S4D). Depletion of LIG3 did not increase the levels of DSBs in any of the tested cell lines or conditions (Figure S4D), indicating that the increase in genomic instability is not a result from DSBs generation.
LIG3 Depletion Increases Efficacy of Olaparib Against BRCA1-deficient Mammary Tumors in Mice
Our previous results established that LIG3 is a modulator of PARPi-response in vitro. To test whether our results could be recapitulated in vivo, we performed shRNA-mediated depletion of LIG3 in PARPi-naïve KB1P4.N1 organoids (BRCA1-deficient) and PARPi-resistant KB1P4.R1 organoids (BRCA1- and 53BP1- deficient) (Figure 6A). The modified organoid lines were transplanted into the mammary fat pad of syngeneic wild-type mice. Upon tumor outgrowth, mice were treated with olaparib or vehicle for 28 consecutive days, and mice were sacrificed when tumors progressed to a volume of ≥1500 mm3. LIG3 depletion did not affect tumor growth and all cohorts of vehicle-treated mice showed comparable survival (Figure 6B, C). In contrast, LIG3 depletion significantly enhanced the anticancer efficacy of olaparib, resulting in increased survival of olaparib-treated mice bearing KB1P4.N1+shLIG3 tumors, compared to olaparib-treated mice with KB1P4.N1+shscr tumors (Figure 6B). Importantly, LIG3 depletion also resensitized the PARPi-resistant KB1P4.R1 tumors to olaparib. Whereas olaparib-treated and vehicle-treated mice with KB1P4.R1 tumors showed comparable survival, olaparib treatment significantly prolonged the survival of mice bearing KB1P4.R1+shLIG3 tumors (Figure 6C). Together, these data show that LIG3 also modulates PARPi response in vivo.
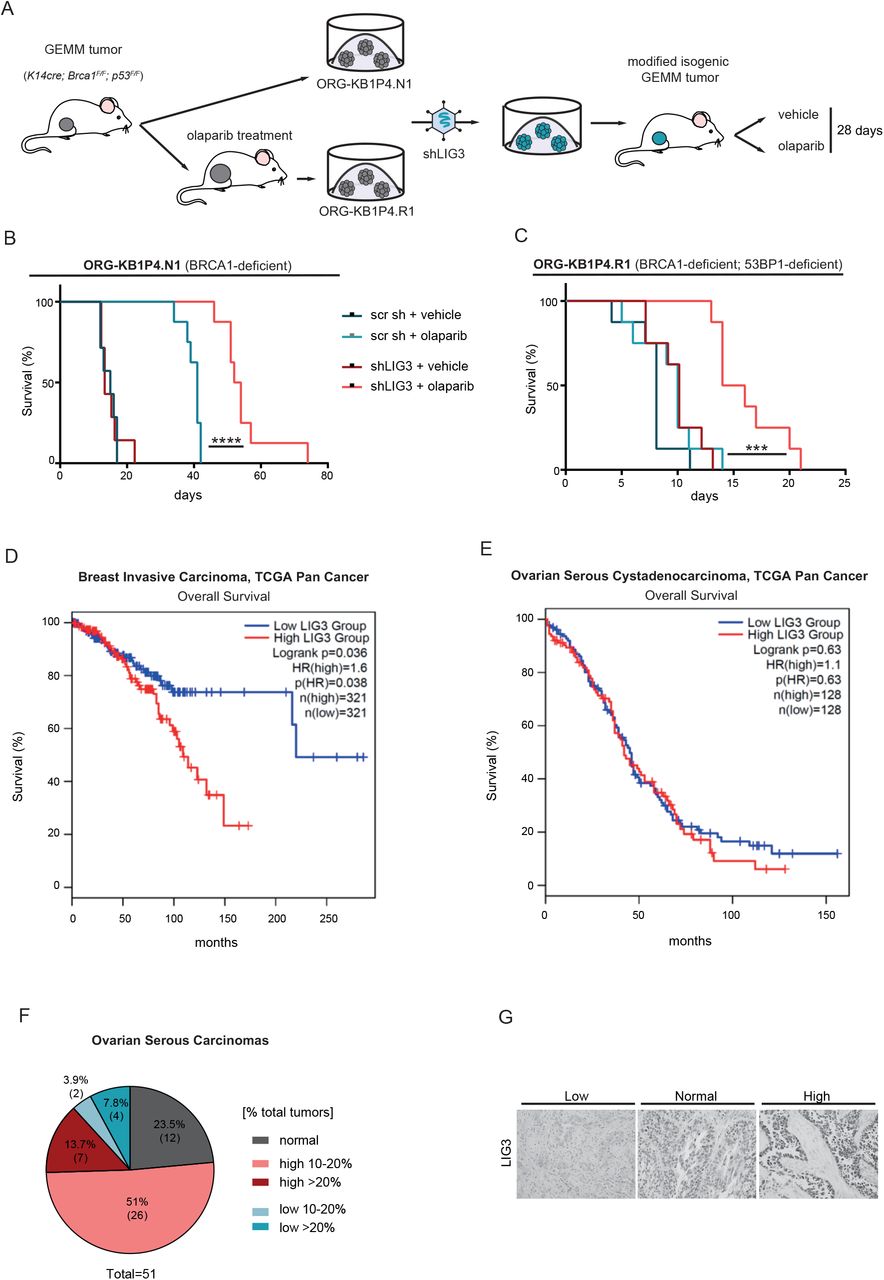
(A) Schematic outline of in vivo experimental set up. Organoids were modified in vitro and transplanted into the mammary fat pad of of syngeneic, wild-type FVB/N mice. Upon tumor outgrowth, mice were treated with olaparib or vehicle for 28 consecutive days. (B) Kaplan–Meier survival curves of mice transplanted with KB1P4.N1 or (C) KB1P4. R1 (right) organoid lines, after in vitro shRNA-mediated depletion of LIG3. ***p<0.001, ****p<0.0001; Log-Rank (Mantel Cox). (D) Association between LIG3 expression with overall survival of TCGA breast invasive carcinoma and (E) ovarian serous cystadenocarcinoma cohorts. The two TCGA cohorts were splitted into two groups: upper 70% and lower 30% quartile expression (high vs. low expression). Statistical significance was determined using Log-Rank (Mantel Cox). (F) Summary of IHC analysis of LIG3 expression in ovarian serous carcinomas and (G) representative images of LIG3 IHC of ovarian serous carcinomas biopsies.
LIG3 Expression Correlates with Overall Survival in Human Breast Cancer Patients
To assess the clinical relevance of LIG3, we turned to The Cancer Genome Atlas (TCGA) (https://tcga-data.nci.nih.gov). Analysis of LIG3 expression in the TCGA invasive breast cancer patient cohort revealed that low expression of LIG3 is associated with increased overall survival (Figure 6D, E). Importantly, the correlation of LIG3 with survival rates was not associated with breast cancer subtype, as separation between triple-negative and luminal breast cancer cohorts still resulted in association of high LIG3 expression with poorer overall survival (Figure S5). In contrast, analysis of the TCGA serous ovarian cancer patient cohort, did not show a significant association of LIG3 expression with overal survival. However, immunohistochemical analysis of LIG3 expression in sections of treatment-naïve tumors from a cohort of 51 women with high-grade serous ovarian carcinoma (Moudry et al., 2016) revealed that, although LIG3 protein was expressed at normal levels in a majority of tumor cells in the biopsies, a substantial proportion of samples contained areas displaying aberrant expression of LIG3. Interestingly, 26 (51%) and 7 (13.7%) of the 51 cases showed LIG3 overexpression in areas corresponding to >10% and >20% of the tumor, respectively (Figure 6F, G). Conversely, LIG3-negative areas were observed in small proportion of biopsies, with 2 (3.9%) and 4 (7.8%) of the 51 ovarian cancers displaying loss of LIG3 in areas corresponding to >10% and >20% of the tumor, respectively (Figure 6F, G). These observations reveal that LIG3 expression is heterogeneous within and across serous ovarian cancers, which might result in selective expansion of LIG3 overexpressing clones during PARPi treatment and thereby contribute to intratumoral and inter-patient differences in response to PARPi therapy.
DISCUSSION
Molecular alterations that render cells resistant to targeted therapies may also cause synthetic dependencies, which can be exploited to design rational combination therapies. In this study, we used shRNA screens to identify synthetic dependencies of BRCA1-deficient cells which acquired resistance to PARPi treatment by restoration of HR due to loss 53BP1. We identified LIG3 as a critical suppressor of PARPi toxicity in BRCA1-deficient cells with restoration of HR due to loss 53BP1. Loss of LIG3 also enhances PARPi sensitivity of HR-deficient BRCA1-deficient cells with intact 53BP1, indicating that the role of LIG3 in BRCA1-deficient cells is independent of their 53BP1 status.
Nuclear LIG3 is involved in XRCC1-mediated repair of SSBs by BER (Caldecott et al., 1996; Cappelli et al., 1997). Prior studies have reported that loss of XRCC1 renders cells sensitive to PARPi independently of BRCA status (Horton et al., 2014; Lord et al., 2008; Murai et al., 2012). In contrast, our data show that LIG3 loss only enhances PARPi sensitivity in BRCA1-deficient cells, indicating that this effect of LIG3 depletion is independent of its role in BER.
PARPi treatment not only inhibits PARP1 activity, but also results in trapping of PARP1 protein on DNA (Murai et al., 2012). The presence of these PARP1-DNA complexes could pose a blockage for travelling replication machinery and result in cytotoxicity specifically in HR-deficient cells (Noordermeer and van Attikum, 2019). Our data show that PARPi-mediated trapping of PARP1 is indeed critical for the enhancement of PARPi sensitivity by LIG3 loss in BRCA1-deficient tumor cells, as genetic inactivation of PARP1 did not affect cell viability upon LIG3 depletion. Loss of LIG3 in cells also resulted in retention of PARP1 on damaged chromatin, which was enhanced upon PARPi treatment, more specifically in BRCA1-deficient cells. This suggests that LIG3 could be important for the rapid turnover of PARP1 from damaged chromatin. In the absence of LIG3, high levels of chromatin-trapped PARP1 in BRCA1-deficient tumor cells could cause replication blockage and thereby promote PARPi toxicity in these cells. In support of this notion, our data show that LIG3 is recruited to sites of DNA replication in BRCA1-deficient cells under conditions where PARP1 is trapped on the DNA.
PARP1 has recently been implicated in restraining replication fork (RF) speed in cells (Maya-Mendoza et al., 2018). PARPi-induced increase in fork speed and ensuing ssDNA exposure has also been proposed to underlie the toxic effects of these inhibitors in BRCA1-deficient cells (Cong et al., 2019; Maya-Mendoza et al., 2018). We indeed observed an increase of fork speed and ssDNA in BRCA1-deficient cells treated with low doses of PARPi. However, PARPi-resistant BRCA1/53BP1 double-mutant cells still displayed increased fork speeds but no marked ssDNA exposure upon treatment with low-dose PARPi. These data suggest that, in contrast to the perceived idea, increase of fork speed and ssDNA exposure can be uncoupled and the former is not causally related to PARPi sensitivity of BRCA1-deficient cells.
PARP1 has also been identified as a sensor for unligated okazaki fragments during unperturbed DNA replication (Hanzlikova et al., 2018). Loss of LIG1, which is the main DNA ligase responsible for okazaki fragment ligation, results in increased fork speed without activating the DNA damage response (DDR) (Maya-Mendoza et al., 2018). This is suggestive of a backup pathway that governs RF integrity in the absence of LIG1. In line with this, LIG3 has been suggested to be involved in LIG1-independent ligation of okazaki fragments during DNA replication (Arakawa and Iliakis, 2015). Consistent with this hypothesis, our study shows that loss of LIG3 rescues the increased fork progression rates observed in PARPi-treated BRCA1-deficient cells. Additionally, exposure of LIG3-depleted BRCA1-deficient cells to PARPi induces a strong increase in sister fork asymmetry, which could be due to increased fork stalling caused by PARPi-mediated PARP1 trapping. Together, our data suggest that the PARPi-induced increase in fork speed observed in BRCA1-deficient cells might be driven by a LIG3-dependent mechanism for bypass of chromatin-trapped PARP1 lesions by the replisome (Figure 7). Impairment of this bypass mechanism by LIG3 loss could enhance PARPi-induced fork stalling, resulting in increased genome instability and PARPi sensitivity (Figure 7). Interestingly, we also observe significantly enhanced ssDNA exposure and ssDNA gaps in replicated DNA upon loss of LIG3 in untreated BRCA1 deficient cells, which also correlates with increased genome instability in these cells. Addition of PARPi results in a further increase in ssDNA exposure, ssDNA gaps and genome instability. In aggregate, our findings are most compatible with a model in which loss of a LIG3-dependent lesion bypass mechanism, in BRCA1-deficient cells, causes frequent replication fork stalling followed by defective bypass of trapped PARP1 lesions on parental DNA. This in turn could result in genomic instability and hypersensitization to PARPi treatment (Figure 7).

Left panel: Upon treatment with PARPi, BRCA1-deficient cells, which have loss HR activity, display a LIG3-dependent increase in fork speed. BRCA1-deficient cells display an increase in ssDNA gaps due to repriming across trapped PARP1, high levels of genomic instability compounded by HR-deficiency and ultimately, sensitivity to PARPi. Middle panel: Upon treatment with PARPi, BRCA1- and 53BP1-deficient cells, which have restored functional HR, display a LIG3-dependent increase in fork speed. These cells do not have increased numbers of ssDNA gaps, genomic instability is rescued, and are resistant to PARPi. Right panel: Upon treatment with PARPi, increased trapping of PARP1 and loss of a LIG3-dependent lesion bypass mechanism in BRCA1-deficient and BRCA1- and 53BP1-deficient cells causes frequent replication fork stalling, and results in asymmetry and increased ssDNA gaps. This in turn results in genomic instability and hypersensitization to PARPi treatment.
Our findings may have therapeutic implications, as LIG3 depletion also increases the efficacy of PARPi in vivo, resulting in prolonged survival of mice bearing PARPi-sensitive BRCA1-deficient or PARPi-resistant BRCA1/53BP1 double-deficient mammary tumors. Furthermore, high expression of LIG3 in invasive breast cancer patients correlates in with poor overall survival, suggesting that LIG3 could possibly be targeted in these cancers. Pharmacological inhibition of LIG3 might therefore be a potential strategy to combat resistance to PARPi. Taken together, our findings establish loss of LIG3 as a potent enhancer of PARPi synthetic lethality in BRCA1-deficient cells, irrespective of their HR status, and provide mechanistic insights into the role of LIG3 in restraining replication stress and genome instability induced by BRCA1 loss.
AUTHOR CONTRIBUTIONS
Conceptualization, M.P.D. and J.J.; Methodology, M.P.D., I.v.d.H. and A.R.C.; Investigation, M.P.D., I.v.d.H., V.T, E.M, K.C, P.G., S.A., J.Bartkova and M.A.S.; Supervision of in vivo experiments, M.v.d.V; Data analysis, C.L. and R.B.; Bioinformatic analysis, J.Bh. and S.Ch. Writing of original draft, review & editing – M.P.D., A.R.C. and J.J.; Supervision, E.G., S.R., S.C., J. Bartek, A.R.C and J.J..
DECLARATION OF INTERESTS
The authors declare no potential conflicts of interest.
KEY RESOURCES TABLE
EXPERIMENTAL MODEL AND SUBJECT DETAILS
Cell Lines
KP3.33 (Evers et al., 2008), KB1P-G3, KB1P-177a5 (Jaspers et al., 2013) and KB1P-G3B1 (Barazas et al., 2019) have been previously described. LIG3 nuclear mutants, KB1P-177a5-B1, KB1P-177a5-A3 and KB1P-177a5-F5, have been generated in this study. All these cell lines were cultured in in DMEM/F12+GlutaMAX (Gibco) containing 5μg/ml Insulin (Sigma, #I0516), 5 ng/ml cholera toxin (Sigma, #C8052), 5 ng/ml murine epidermal growth-factor (EGF, Sigma, #E4127), 10% FBS and 50 units/ml penicillin-streptomycin (Gibco) and were cultured under low oxygen conditions (3% O2, 5% CO2 at 37°C). Mouse ES cells with a selectable conditional Brca1 deletion (R26CreERT2/wt;Brca1SCo/–) have been previously described (Bouwman et al. 2010). Additional knockout of Trp53, Trp53bp1 and Parp1 has been generated in this study. These cells were cultured on gelatin-coated plates in 60% buffalo red liver (BRL) cell conditioned medium, 0.1 mM β-mercaptoethanol (Merck) and 103 U/ml ESGRO LIF (Millipore) and 50 units/ml penicillin-streptomycin (Gibco) under normal oxygen conditions (21% O2, 5% CO2, 37°C). SUM149PT (RRID:CVCL_3422) cells were grown in RPMI1640 (Gibco) medium supplied with 10% fetal calf serum and 50 units/ml penicillin-streptomycin (Gibco). RPE1-hTERT and U2OS (RRID:CVCL_0042) cell lines were grown in DMEM+GlutaMAX (Gibco) supplemented with 10% FBS and 50 units/ml penicillin-streptomycin (Gibco). hTERT;Cas9;TP53−/−, hTERT;Cas9;TP53−/−;BRCA1−/− and hTERT;Cas9;TP53−/−;BRCA1−/−;TP53BP1−/− RPE1 cells were generated by Noordermeer et al. 2018. HEK293FT (RRID:CVCL_6911) cells were cultured in IMDM+GlutaMAX-I (Gibco) supplemented with 10% FBS and 50 units/ml penicillin-streptomycin (Gibco). SUM149PT and U2OS cell lines were cultured under normal oxygen conditions (21% O2, 5% CO2, 37°C). RPE1 cell lines were cultured under low oxygen conditions (3% O2, 5% CO2 at 37°C).
Tumor-Derived Organoids
All lines have been described before (Duarte et al., 2018). ORG-KB1P4N.1 and ORG-KB1P4R.1 tumor organoids were derived from a PARPi-naïve and PARPi-resistant K14cre;Brca1F/F/;Trp53F/F (KB1P) mouse mammary tumor, respectively. The ORG-KPM.1 tumor organoid line was derived from a K14cre;Trp53F/F;Abcb1a−/−;Abcb1b−/− (KPM) mouse mammary tumor. Cultures were embedded in Culturex Reduced Growth Factor Basement Membrane Extract Type 2 (BME, Trevigen; 40 ml BME:growth media 1:1 drop in a single well of 24-well plate) and grown in Advanced DMEM/F12 (Gibco) supplemented with 1M HEPES (Gibco), GlutaMAX (Gibco), 50 units/ml penicillin-streptomycin (Gibco), B27 (Gibco), 125 mM N-acetyl-L-cysteine (Sigma) and 50 ng/ml murine epidermal growth factor (Sigma). Organoids were cultured under standard conditions (37°C, 5% CO2) and regularly tested for mycoplasma contamination.
Mice
All animal experiments were approved by the Animal Ethics Committee of The Netherlands Cancer Institute (Amsterdam, the Netherlands) and performed in accordance with the Dutch Act on Animal Experimentation (November 2014). Organoid transplantation experiments were performed in syngeneic, wild-type F1 FVB (FVB/NRj) females, at the age of 6 weeks. Parental FVB animals were purchased from Janvier Labs. Animals were assigned randomly to the treatment groups and the treatments were supported by animal technicians who were blinded regarding the hypothesis of the treatment outcome.
Human Samples of Serous Ovarian Cancer
Paraffin-embedded material from the cohort of ovarian tumors was collected at the Department of Pathology, University Hospital, Las Palmas, Gran Canaria, Spain, from surgical operations performed in the period 1995-2005. For the purpose of the present study, only samples from serous ovarian carcinoma (the type approved for treatment by PARP inhibitors) were used from a larger cohort that was reported previously (Moudry et al., 2016), and included also other histological types of ovarian tumors. The use of long-term stored tissue samples in this study was in accordance with the Spanish codes of conduct (Ley de Investigación Biomédica) and was approved by the review board of the participating institution. Patients were informed that samples may be used for research purposes under the premise of anonymity.
METHOD DETAILS
Functional Genetic Screens
The DDR shRNA library was stably introduced into Brca1−/−;Trp53−/−;Trp53bp1−/− mESCs and in KB1P4.R1 by lentiviral transduction using a multiplicity of transduction (MOI) of 1, in order to ensure that each cell only gets incorporated with one only sgRNA. mES cells and organoids were selected with puromycin, 3 μg/ml, for 3 days and then seeded in the presence of PARPi (IC50<30, mES cells, 25nM olaparib; organoids, 50nM), left untreated or pelleted for the genomic DNA isolation (T0). The total number of cells used in a single screen was calculated as following: library complexity x coverage (5000x in mESc, 1000x in organoids). Cells were kept in culture for 3 weeks and passaged every 5 days (and seeded in single cells) while keeping the coverage at every passage. mES cells were seeded at a density of 2,500 cells per 15 cm dish and organoids at a density of 50,000 cells/well, 24-well format. Screens were done in triplicate for each condition. In the end of the screen, cells were pooled and genomic DNA was extracted (QIAmp DNA Mini Kit, Qiagen). shRNA sequences were retrieved by a two-step PCR amplification, as described before (Xu et al., 2015). To maintain screening coverage, the amount of genomic DNA used as an input for the first PCR reaction was taken into account (6 μg of genomic DNA per 106 genomes, 1 μg/PCR reaction). Resulting PCR products were purified using MiniElute PCR Purification Kit (Qiagen) and submitted for Illumina sequencing. Sequence alignment and dropout analysis was carried out using the algorithms MaGECK (Li et al., 2014) (FDR <= 0.1) and DESeq2 (Love et al., 2014) (FDR <= 0.05, log2Fc <=-2, baseMean >= 100, at least 3 hit shRNA in the depletion direction and none in the opposite direction). In order to reduce the noise level, we filtered out sgRNAs with low counts in the T0 sample: mESc, sum of the three T0 samples >= 10, organoids, mean over the three T0 samples >= 50. Gene ranking is generated automatically with MaGECK algorithm. To generate gene ranking based on DESeq2 algorithm, we calculated per gene the number of hit shRNAs and the mean of the log2FoldChange over those shRNAs. We then ranked the genes based on these two metrics.
Constructs
A collection of 1,976 lentiviral hairpins targeting 391 DDR-related mouse genes (pLKO.1; DDR library) was derived from the Sigma Mission library (TRCMm1.0) as described before (Xu et al., 2015). Individual hairpin constructs used in the validation studies were selected from the TRC library: mouse LIG3 shRNA #1: TRCN0000070978, mouse LIG3 shRNA #2: TRCN0000070982, mouse REV7 shRNA: TRCN0000006570, human LIG3 shRNA #1: TRCN0000048498, human LIG3 shRNA #2: TRCN0000300259. For CRISPR/Cas9-mediated genome editing of Parp1, two individual sgRNAs were cloned into plentiGuide-Puro (lentiviral) as described previously (Sanjana et al., 2014). For laser micro-irradiation experiments we used pEGFP-c3-PARP1 (gift from Valerie Schreiber). All constructs were verified by Sanger sequencing.
Lentiviral Transductions
Lentiviral stocks, pseudotyped with the VSV-G envelope, were generated by transient transfection of HEK293FT cells, as described before (Follenzi et al., 2000). Production of integration-deficient lentivirus (IDLV) stocks was carried out in a similar fashion, with the exception that the packaging plasmid contains a point mutation in the integrase gene (psPAX2, gift from Bastian Evers). Lentiviral titers were determined using the qPCR Lentivirus Titration Kit (Applied Biological Materials), following the manufacturer’s instructions. For all experiments the amount of lentiviral supernatant used was calculated to achieve an MOI of 50, except for the transduction of the lentiviral library for which a MOI of 1 was used, as described above. 2D cells were incubated with lentiviral supernatants overnight in the presence of polybrene (8 μg/ml). 3D Tumor-derived organoids were transduced according to a previously established protocol (Duarte et al., 2018). Antibiotic selection was initiated right after transduction for 2D cells, 24h after transduction in organoids, and was carried out for 3 consecutive days.
Genome Editing
For CRISPR/Cas9-mediated genome editing of Trp53 in mESCs, R26CreERT2/wt;Brca1SCo/– cells (Bouwman et al., 2010) were transiently transfected with a modified a pX330-U6-Chimeric-BB-CBh-hSpCas9 plasmid containing a puromycin resistance marker (Cong et al., 2013; Drost et al., 2016) in which a sgRNA targeting Trp53 was cloned. Knockout clones were selected under puromycin for 3 days and tested by TIDE and western blot.
For CRISPR/Cas9-mediated genome editing of Trp53bp1 in mESCs, Cas9-expressing R26CreERT2/Cas9;Brca1SCo/–;Trp53−/− cells (Barazas et al., 2018) were incubated with lentiviral supernatants of pLentiGuide-Puro cloned with a sgRNA targeting Trp53bp1. After selection with puromycin for 3 days, surviving cells were subcloned and tested by TIDE and western blot.
For CRISPR/Cas9-mediated genome editing of Parp1, the Cas9-expressing R26CreERT2/Cas9; Brca1−/−;Trp53−/−;Trp53bp1−/− mESCs were incubated with lentiviral supernatants of pLentiGuide-Puro cloned with two different sgRNAs targeting Parp1 (sgRNA1, sgRNA 4). After selection with puromycin for 3 days, surviving cells were subcloned and tested by TIDE and western blot.
For the disruption of the starting codon encoding for nuclear LIG3, the desired mutation (ATG>CTC) was introduced in KB1P-177a5 mouse tumor cells according to the Alt-R CRISPR-Cas9 System of IDT (Yoshimi et al., 2016). Briefly, the crRNA targeting sequence and the homology template, a 120bp ssODN, were designed using CRISPR design tools of Benchling. While the sgRNA was designed to target the nuclear ATG, the homology template contains an ATG>CTC mutation, encoding a leucine instead of the original methionine. 10 µl tracrRNA (100 µM) and 10 µl crRNA (100 µM) were annealed in 80 μl nuclease free duplex buffer (IDT#11-05-01-03) to form a 10µM gRNA solution. The ssODN template was also annealed to form a 10µM solution. 6 μl of 10 µM sgRNA, 6 µl of 10 µM Cas9 protein, and 6 µl of 10 µM ssODN (Ultramer IDT) were mixed in optiMEM (Gibco), to final volume of 125 µl and incubated for 5 min at RT (Mix 1). Then, 3µl of Lipofectamine RNAiMAX (Invitrogen) were mixed with 122 µl with optiMEM (Mix 2). Mix 1 and mix 2 were mixed together and incubated at RT for 20 min. During these 20 min, 150.000 cells were trypsinized and collected in 750 µl of medium. The 250 µl Mix was then added to the cells in a 12-well for reverse transfection. Next day cells were expanded and 3 days after transfection the cells were harvested for analysis of the genomic DNA.
To assess modification rate, genomic DNA was extracted (Puregene Core Kit A, Qiagen) and 100 ng was used as an input for the PCR amplification of the targeted sequence. PCR reaction was performed with Thermo Scientific Phusion High-Fidelity PCR Master Mix (Thermo Scientific), according to manufacturer’s instructions (3-step protocol: annealing - 60C for 5 s, extension time 30 s) and using primers listed in Table S2. Resulting PCR products served as a template for the BigDye Terminator v3.1 reaction (Thermo Fisher). BigDye PCR reactions were performed with the same forward primers as in the preceding PCR reactions (no reverse primer used) and according to the BigDye manufacturer’s protocol. For knockout, allele composition was determined with the TIDE analysis (Brinkman et al., 2014) by comparing sequences from modified and parental (transduced with non-targeting sgRNAs) cells. For knock-in, allele composition was determined with the TIDER analysis (Brinkman et al., 2018) by comparing sequences from modified and parental cells (transduced with non-targeting sgRNAs), and reference template. The later was generated with a simple two-step PCR protocol, with two complementary primers designed to carry the designed mutations as present in the donor template (Brinkman et al. 2018).
siRNA and Transfections
Non-targeting siRNA and siRNA against mouse and human LIG3 were transfected into the cells using Lipofectamine RNAiMAX (Invitrogen) according to the manufacturer’s instructions. All experiments were carried out between 48 and 72hr post-transfection.
Long-Term Clonogenic Assays
Long-term clonogenic assays were always performed in 6-well plates, with exception of organoids which were cultured in 24-well plated as described before. Cells were seeded at low density to avoid contact inhibition between the clones (KB1P1-G3: 5,000 cells/well; KB1P-177a5: 2,500 cells/well; ORG-KB1P4.S1 and ORG-KB1P4.R1: 50.000 cells/well; Brca1−/−;Trp53−/−;Trp53bp1−/− mESCs: 3,000 cells/well; Brca1−/−;Trp53−/− mESCs: 5,000 cells/well; SUM149PT: 5,000 cells/well; RPE1-SKO: 3,000 cells/well, RPE1-DKO and RPE1-TKO: 5,000 cells/well) and cultured for 10-15 days. Media was refreshed once a week. For the quantification, cells were incubated with Cell-Titer Blue (Promega) reagent and later fixed with 4% formaldehyde and stained with 0.1% crystal violet. Drug treatments: cells were grown in the continuous presence of PARPi (olaparib, talazoparib or veliparib) at the indicated concentrations. mESCs with a selectable conditional Brca1 deletion were treated with 0.5µM 4OHT for 3 days right before the start of the clonogenic assay, when indicated. PARPi were reconstituted in DMSO (10 mM) and 4OHT in EtOH (2.5 mM).
RT-qPCR
In order to determine gene expression levels, RNA was extracted from cultured cells using ISOLATE II RNA Mini Kit (Bioline) and used as a template to generate cDNA with Tetro cDNA Synthesis Kit (Bioline). Quantitative RT-PCR was performed using SensiMix SYBR Low-ROX Kit (Bioline; annealing temperature – 60°C) in a Lightcycler 480 384-well plate (Roche), and analyzed using Lightcycler 480 Software v1.5 (Roche). Mouse Rps20 and human HPRT were used as house-keeping genes. The primer sequences used in this study are listed in Table S2.
Western Blot
Cells were trypsinized and then lysed in lysis buffer (20 mM Tris pH 8.0, 300 mM NaCl, 2% NP40, 20% glycerol, 10 mM EDTA, protease inhibitors (cOmplete Mini EDTA-free, Roche, 100x stock)), for 20 min. For PAR detection in PARP1 knockout mES cells, 10µM PARGi was added to the lysis buffer, when indicated. For P53 detection, cells were irradiated at 15 x 100 μJ/cm2. The protein concentration was determined using Pierce BCA Protein Assay Kit (Thermo Scientific). SDS-Page was carried out with the Invitrogen NuPAGE SDS-PAGE Gel System (Thermo Fisher; for LIG3: 2-8% Tris-acetate gels were used, buffer Tris-Acetate; for all other proteins: 4–12% Bis-Tris gels were used, buffer: MOPS; input: 40µg protein), according to the manufacturer’s protocol. Next, proteins were electrophoretically transferred to a nitrocellulose membrane (Biorad). Before blocking, membranes were stained with Ponceau S, followed by blocking in 5% (w/v) milk in TBS-T for 1hr at RT. Membranes were incubated with primary antibody 4hrs at RT in 1% (w/v) milk in TBS-T (rabbit anti-PARP1, 1:1000; rabbit anti-H3, 1:5000; mouse anti-lig3, 1:500; rabbit anti-tubulin, 1:1000; anti-PAR, 1:1000; anti-PARP2, 1:2000; mouse anti-P53, 1:1000). Horseradish peroxidase (HRP)-con-jugated secondary antibody incubation was performed for 1 hr at RT (anti-mouse or anti-rabbit HRP 1:2000) in 1% (w/v) milk in TBS-T. Signals were visualized by ECL (Pierce ECL Western Blotting Substrate, Thermo Scientific).
Viability Assay in PARP1 Knockout Cells
Brca1−/−;Trp53−/−;Trp53bp1−/−;Parp1−/− mESCs cells were treated with 0.5µM 4OHT for 3 days right before the start of the assay or left untreated. Cells were then seeded in 12-well plates (150.000 cell/well) and, 24 hr after seeding, transfected with non-targeting siRNA or siRNA against mouse LIG3 as described above. Medium was refreshed 24 hr after transfections and assay was stopped after 4 days. Transfections were carried out in duplicate; one well was stained and quantified and another well was collected and expanded for western blot analysis. Quantification was carried out by determining the absorbance of crystal violet at 590 nm after extraction with 10% acetic acid.
PARP1 Trapping Assay
PARP1 trapping assay was adapted from previously described protocols (Gogola et al., 2018; Murai et al., 2012). 24 hr prior to the experiment, transfected cells were seeded in 10cm dishes at 70-90% confluency. The day of the experiment, cells were pre-incubated with 0.5µM olaparib for 1 hr; and then exposed to the same treatments but in a presence of 0.01% MMS for 30 min; following incubation with MMS cells were further incubated with olaparib for 2hr. Following the indicated treatments, cells were collected and subsequently lysed to isolate chromatin-bound fractions. Fractionation was performed with Subcellular Protein Fractionation Kit from Thermo Scientific (#78840, Rockford, IL, USA), following the manufacturer’s instructions. Immunoblotting was carried out as described in previous section (Western Blot). Quantification of signal was performed by Fusion FX by Vilber and normalized to loading control.
Laser Micro-Irradiation Assays
U2OS cells were transiently transfected (using Lipofectamine 2000, Invitrogen; according to the manufacturer’s protocol) with EGFP-c3-PARP1 (kind gift from Valerie Schreiber) vector. Cells were seeded on Lab-Tek chambered coverglasses (catalog no: 155380) and pre-sensitized with 10μΜ BrdU, 24 hr before micro-irradiation. After the indicated treatments, cellular nuclei were irradiated with 355nm UV ablation laser at 0.15 power setting, repetition rate 200Hz, pulse energy >60μJ, pulse length< 4ns (Rapp OptoElectronic). Live cell imaging was performed in 37°C and 5% CO2 chamber, on average 6 cells were imaged per condition, per replicate. During live cell imaging, cells were incubated in anti-bleaching live cell visualization medium DMEMgfp-2. Cellular response to DSB formation was monitored with x63 objective using Nicon confocal microscope equipped with a Perkin Elmer spinning disk. Images were acquired every minute for a period of 30 minutes. Volocity software was used to control the hardware and recruitment kinetics of GFP-PARP1 were analyzed by Image J software.
Proximity ligation-based assay (PLA)
Protocol was carried out as mentioned previously (Mukherjee et al., 2019). On coverslips, cells were grown to a confluence of 60-70%. On the day of the experiment, cells were incubated with PARGi (10µM) for a total of 30 minutes or 0.5μM olaparib for 2hr and the final 10 minutes cells were incubated with EdU (20μM) during PARGi incubation to visualize S-phase cells. After EdU labeling cells were gently washed two times with PBS and fixed with 4% paraformaldehyde for 15 min at RT. PFA was discarded after fixation and slides were washed with cold PBS for 8 minutes each three times. Cells were next permeabilized by incubating the coverslips in PBS containing 0.5% Triton-X for 15 min at RT and subsequently washed in PBS twice for 5 min each. Freshly prepared click reaction mix (2mM of copper sulfate, 10 μM of biotin-azide and 100 mM of sodium ascorbate were added to PBS in that order and mixed well) was applied to the slides (30 μl/slide) in a humid chamber and incubated for 1 hr at RT. Slides were washed with PBS for 5 min after the click reaction and placed back in the humid chamber and blocked at room temperature for 1 hr with a blocking buffer (10% goat serum and 0.1%Triton X-100 in PBS). In combination with anti-biotin (1:1000), rabbit anti-LIG3 (1:150, Sigma-Aldrich, #HPA006723) primary antibody was diluted in a blocking solution, dispensed to slides (30 μl/slide) and incubated in a humid chamber at 4°C overnight. Slides were washed with wash buffer A (0.01 M Tris-HCl, 0.15 M NaCl, and 0.05 % Tween-20, pH 7.4) for 5 min each after overnight incubation. Duolink In Situ PLA probes, the anti-mouse plus and anti-rabbit minus were diluted 1:5 in the blocking solution (10% goat serum and 0.1% Triton X-100 in PBS), dispensed to slides (30 μl/well) and incubated at 37°C for 1 hr. Slides were washed three times with buffer-A, 5 min each. The ligation mix was prepared by diluting Duolink ligation stock (1:5) and ligase (1:40) in high purity water and was applied to slides (30 μl/well) and incubated at 37°C for 30 min. Slides were washed with buffer-A twice for 2 min each. Amplification mix was prepared by diluting Duolink amplification stock (1:5) and rolling circle polymerase (1:80) in high-purity water and applied to slides (30μl /well) and incubated for 100 min at 37°C in a humid chamber. Slides were washed with wash buffer-B solution (0.2 M Tris and 0.1 M NaCl) three times for 10 min each and one time in 0.01X diluted wash buffer-B solution for 1 min. Coverslips were incubated with DAPI for 5 min and mounted with ProLong Gold antifade reagent (Invitrogen) and imaged using confocal and analyzed using ImageJ software 64.
Immunofluorescence
RAD51 IRIF
Cells were seeded on Millicell EZ slides (#PEZGS0816, Millipore) 24 hr prior the assay to achieve ∼90% confluency. Cells were then irradiated using the Gammacell 40 Extractor (Best Theratronics Ltd.) at the dose of 10 Gy and allowed to recover for 3 hr. Cells washed with PBS++ (PBS solution containing 1 mM CaCl2 and 0.5 mM MgCl2) and pre-extracted with 0.5% (v/v) Triton X-100 in PBS++ for 5 min. Next, cells were washed with PBS++ and fixed with 2% (v/v) paraformaldehyde solution in PBS for 20 min. Next, cells were permeabilized with ice-cold methanol/acetone solution (1:1) for 15 min. To minimize the background, cells were further incubated for 20 min in staining buffer (1% (w/v) BSA, 1% (v/v) FBS, 0.15% (w/v) glycine and 0.1% (v/v) Triton X-100 in PBS). Staining buffer was also used as a solvent for antibodies – primary antibody anti-RAD51, 1:1500, #ab133534, abcam; secondary antibody Alexa Fluor® 658-conjugated, 1:1000, A11011, Invitrogen. Incubation with primary and secondary antibodies was done for 2 hr and 1 hr, respectively. All incubations were performed at room temperature. Samples were mounted with VECTASHIELD Hard Set Mounting Media with DAPI (#H-1500; Vector Laboratories). Images were captured with Leica SP5 (Leica Microsystems) confocal system and analyzed using an in-house developed macro to automatically and objectively evaluate the DNA damage-induced foci (Xu et al., 2015). As a positive and negative control for RAD51 staining, BRCA-proficient KP-3.33 and BRCA1-deficient KB1P-G3 cells were used.
LIG3-EdU co-localization assay
Cells were incubated with 20 µM EdU for 1hr to visualize cells in S-phase. In the last 20 min, 10µM PARGi was added to the medium. Cells washed with PBS and pre-extracted with CSK50 buffer for 7 min (10µM PARGi was added to pre-extraction buffer). Cells were washed with PBS and fixed with 4% formaldehyde, followed by three washes with PBS and permeabilization with ice-cold methanol/acetone solution (1:1). EdUClick-iT reaction mix was added to each well and incubated at RT for 30 min. Fixed cells were washed three times with staining buffer (5% (v/v) FBS, 5% (w/v) BSA, and 0.05% (v/v) Tween-20 in PBS) and incubated with primary antibody anti-LIG3 (1:150, Sigma-Aldrich, #HPA006723) in staining buffer for 2hr at RT. After three washes in staining buffer, cells were incubated with secondary antibody anti–rabbit Alexa Fluor 488 (1:500, A27034, Invitrogen) in staining buffer, followed by three last washes in staining buffer and one wash in PBS. Samples were mounted with VECTASHIELD Hard Set Mounting Media with DAPI (#H-1500; Vector Laboratories). Images were captured with Leica SP5 (Leica Microsystems) confocal system and analyzed with ImageJ software.
DNA Fiber assay in tumor cells
DNA fiber analysis was conducted in accordance with the previously described protocol (Ray Chaudhuri et al., 2012). Briefly, cells were transfected for 48 hours followed by treatment with olaparib (0.5µM), or left untreated, for the final two hours. Cells were sequentially pulse-labelled with nucleotide analogues, 30µM CldU (c6891, Sigma-Aldrich) and 250µM IdU (I0050000, European Pharmacopoeia) for 20 min during the incubation of olaparib. After double labelling, cells were washed with PBS, harvested and resuspended in ice cold PBS to the final concentration 2.5 × 10⁵ cells per ml. Labelled cells were mixed with unlabeled cells at 1:1 (v/v), and 2.5 µl of cell suspension was spotted at the end of the microscope slide. 8 µl of lysis buffer (200mM Tris-HCl, pH 7.5, 50mM EDTA, and 0.5% (w/v) SDS) was applied on the top of the cell suspension, then mixed by gently stirring with the pipette tip and incubated for 8 min. Following cell lysis, slides were tilted to 15–45° to allow the DNA fibers spreading along the slide, air dried, fixed in 3:1 methanol/acetic acid overnight at 4 °C. Subsequently, fibers were denatured with 2.5 M HCl for 1 hr. After denaturation, slides were washed with PBS and blocked in blocking solution (0.2% Tween 20 in 1% BSA/PBS) for 40 min. After blocking, primary antibody solutions are applied, anti-BrdU antibody recognizing CldU (1:500, ab6326; Abcam) and IdU (1:100, B44, 347580; BD) for 2 hours in the dark at RT followed by 1h incubation with secondary antibodies: anti–mouse Alexa Fluor 488 (1:300, A11001, Invitrogen) and anti–rat Cy3 (1:150, 712-166-153, Jackson Immuno-Research Laboratories, Inc.). Finally, slides are washed with PBS and subsequently mounting medium is spotted and coverslips are applied by gently pressing down. Slides were sealed with nail polish and air dried. Fibers were visualized and imaged by Carl Zeiis Axio Imager D2 microscope using 63X Plan Apo1.4 NA oil immersion objective. Data analysis was carried out with ImageJ software64.
DNA fiber assay and S1 nuclease analysis in RPE1-hTERT cells
These assays were performed as previously described (Cong et al., 2019; Peng et al., 2018). Briefly, cells were treated for 2 hr with 0.5µM olaparib or left untreated. During the last 40 min, cells were labeled by sequential incorporation of IdU and CldU into nascent DNA strand. Cells were then collected, washed, spotted, and lysed on positively charged microscope slides by 7.5 mL spreading buffer for 8 min at RT. For experiments with the ssDNA-specific endonuclease S1, cells were treated with CSK100 buffer for 10 min at RT, after the CldU pulse, and then incubated with S1 nuclease buffer with or without 20 U/mL S1 nuclease for 30 min at 37°C. The cells were then scraped in PBS + 0.1% BSA and centrifuged at 7,000 rpm for 5 min at 4°C. Cell pellets were resuspended at 1,500 cells/mL and lysed on slides as described above. Individual DNA fibers were released and spread by tilting the slides at 45°C. After air-drying, fibers were fixed by 3:1 methanol/acetic acid at RT for 3 min. Fibers were then rehydrated in PBS, denatured with 2.5 M HCl for 30 min, washed with PBS, and blocked with blocking buffer for 1 hr. Next, slides were incubated for 2.5 hr with primary antibodies diluted in blocking buffer (IdU, B44, 347580; BD; CldU, ab6326, Abcam), washed several times in PBS, and then incubated with secondary antibodies in blocking buffer for 1 hr (IdU, goat anti-mouse, Alexa 488; CldU, goat anti-rat, Alexa Fluor 594). After washing and air-drying, slides were mounted with Prolong (Invitrogen, P36930). Finally, fibers were visualized and imaged with Axioplan 2 imaging, Zeiss.
Immunofluorescence for ssDNA
Cells were transfected with either siCtrl or siLIG3 using the standard RNAiMAX transfection protocol. Post-transfection cells were labeled with 10μM BrdU for 48hr. Upon treatment with the final 2hr PARPi inhibitor (0.5μM), the cells were washed with PBS and pre-extracted by CSK-buffer (PIPES 10mM, NaCl 100mM, Sucrose 300mM, EGTA 250mM, MgCl2 1mM, DTT 1mM and protease inhibitors cocktail) on ice for 5 minutes. Cells were then fixed using 4% formaldehyde (FA) for 15 min at RT, and then permeabilized by 0.5% Triton X-100 in CSK-buffer. Permeabilized cells were then incubated with primary antibody against anti-BrdU antibody (Abcam 6326) at 37°C for 1 hr. Cells were washed and incubated with secondary antibodies (Alexa Fluor 594) for 1h at room temp. After the wash cells were incubated with DAPI (0.1μg/ml) for 5 minutes. Finally, 200 ul of PBS was added prior to high content imaging. For high content imaging of DAPI and ssDNA signal, Z-stack of 6 stacks (1mm/stack) covering at least 75 fields were imaged. Results were analyzed using DAPI channel and filtered with roundness and size of the nucleus. The quantification of pixel intensities (mean, median and sum) for each nucleus was calculated in the DAPI and 594 nm channels. The quantified values obtained were exported to Tibco spotfire software (TIBCO Spotfire ®) for the generation of scatter plots.
Metaphase spreads and telomere FISH
Metaphase spreads were carried out according to the standard protocol described previously (Mukherjee et al., 2019). Briefly, exponentially growing cells (50–80 % confluence) were treated with 0.5µM olaparib for 2hr or left untreated, and recovered for 6 hr. Post treatment, drug treated medium was washed out and cells were allowed to grow in complete growth medium and exposed with colcemid for 8 h. Metaphase spreads were prepared by conventional methods and check under the microscope before telomere labelling. Metaphase slides in coplin jar containing 2X SSC buffer (Sigma-S6639) were equilibrated at room temperature for 10 minutes. Proteins were digested by incubation of the slides in pre-warmed 0.01M HCl containing pepsin for 1.5 min at 37°C. Slides were washed twice with PBS 5 min each and then one time with 1 M MgCl2 in 1X PBS for 5 min. After washing slides were placed in coplin jar containing 1% formaldehyde and fixed for 10 mins at RT without shaking. Slides were washed with PBS and dehydrated in the ethanol series: 70%, 90% and 100% for 3 minutes each and air dried. Next, slides were denatured in 70% deionized formamide at 80°C for 1 min 15 sec and immediately placed in chilled ethanol series 70%, 90% and 100% for 3 minutes each and allowed slides for air dry. Pre-annealed telomere probes were added to the denatured slides and allowed for hybridization at 37°C in hybridization chamber for 40 minutes. After hybridization slides were washed sequentially 3 times each with 50% formamide in 2X SSC (preheated to 45°C), 0.1X SSC (preheated to 60°C), 4X SSC (0.1% Tween-20), and 2X SSC respectively. Slides were allowed to air dry and mounted using DAPI anti-fade. A minimum 60 metaphase images were captured using Carl Zeiss Axio Imager D2 microscope using 63x Plan Apo 1.4 NA oil immersion objective and analyzed with ImageJ software64 for chromosomal aberrations.
Electron microscope analysis
EM analysis was performed according to the standard protocol (Zellweger et al., 2015). For DNA extraction, cells were lysed in lysis buffer and digested at 50 °C in the presence of Proteinase-K for 2hr. The DNA was purified using chloroform/isoamyl alcohol and precipitated in isopropanol and given 70% ethanol wash and resuspended in elution buffer (TE). Isolated genomic DNA was digested with PvuII HF restriction enzyme for 4 to 5 hr. Replication intermediates were enriched by using QIAGEN G-100 columns (as manufacture’s protocol) and concentrated by an Amicon size-exclusion column. The benzyldimethylalkylammonium chloride (BAC) method was used to spread the DNA on the water surface and then loaded on carbon-coated nickel grids and finally DNA was coated with platinum using high-vacuum evaporator MED 010 (Bal Tec). Microscopy was performed with a transmission electron microscope FEI Talos, with 4 K by 4 K cmos camera. For each experimental condition, at least 72 RF intermediates were analyzed per experiment and ImageJ software64 was used to process analyze the images.
DSB detection by PFGE
DSB detection by PFGE was done as reported previously (Cornacchia et al., 2012). Cells were casted into 0.8% agarose plugs (2.5 x 10⁵ cells/plug), digested in lysis buffer (100 mM EDTA, 1% sodium lauryl sarcosine, 0.2% sodium deoxycholate, 1 mg/ml proteinase-K) at 37 °C for 36–40 h, and washed in 10 mM Tris-HCl (pH 8.0)–100 mM EDTA. Electrophoresis was performed at 14 °C in 0.9% pulse field-certified agarose (Bio-Rad) using Tris-borate-EDTA buffer in a Bio-Rad Chef DR III apparatus (9 h, 120°, 5.5 V/cm, and 30- to 18-s switch time; 6 h, 117°, 4.5 V/cm, and 18- to 9-s switch time; and 6 h, 112°, 4 V/cm, and 9- to 5-s switch time). The gel was stained with ethidium bromide and imaged on Uvidoc-HD2 Imager. Quantification of DSB was carried out using ImageJ software64. Relative DSB levels were calculated by comparing the results in the treatment conditions to that of the DSB level observed in untreated controls.
In vivo studies
Tumor organoids were collected, incubated with TripLE at 37°C for 10 min, dissociated into single cells, resuspended in tumor organoid medium, filtered with 70µm nilon filters (Corning) and mixed in a in complete mouse media/BME mixture (1:1). KB1P4.N1 and KB1P4.R1 organoid suspensions contained a total of 20.000 and 10.000 cells, respectively, per 40 µl of media/BME mixture, and were injected in the fourth right mammary fat pad of wild-type FVB/N mice. Mammary tumor size was determined by caliper measurements (length and width in millimeters), and tumor volume (in mm3) was calculated by using the following formula: 0.5 × length × width2. Upon tumor outgrowth to approximately 75 mm3, in mice injected with N1 organoids, and 40 mm3, in mice injected with R1 organoids, mice were treated with vehicle, or olaparib (50 mg/kg, mice injected with N1 organoids; 100 mg/kg, mice injected with R1 organoids) intraperitoneally for 28 consecutive days. Animals were sacrificed with CO2 when the tumor volume reached 1,500 mm3.
Bioinformatic Analysis
Kaplan–Meier overall survival curves were plotted using Gene Expression Profiling Interactive Analysis 2.0 (GEPIA2) (GEPIA2; http://gepia2.cancer-pku.cn/#index) (Tang et al., 2017). The TCGA breast invasive carcinoma, triple-negative breast cancer, luminal breast cancer and ovarian serous cystadenocarcinoma cohorts were splitted into two groups: upper 70% and lower 30% quartile expression (high vs. low expression).
Immunohistochemistry Analysis
Five-µm tissue sections were cut from formalin-fixed, paraffin-embedded tissue blocks from a cohort of 51 human serous ovarian carcinomas (Moudry et al. 2016) and mounted on Super Frost Plus slides (Menzel-Glaser, Braunschweig, Germany), baked at 60°C for 60 min, deparaffinized, and rehydrated through graded alcohol rinses. Heat induced antigen retrieval was performed by immersing the slides in citrate pH 6.0 buffer and heating them in a 750 W microwave oven for 15 min. The sections were then stained with primary antibody anti-LIG3 (1: 250, Sigma-Aldrich, #HPA006723) overnight in a cold-room, followed by subsequent processing by the indirect streptavidin-biotin-peroxidase method using the Vectastain Elite kit (Vector Laboratories, Burlingame, CA, USA) and nickel-sulphate-based chromogen enhancement detection as previously described (Bartkova et al., 2005), without nuclear counterstaining. For negative controls, sections were incubated with non-immune sera. The results were evaluated by two experienced researchers, including a senior oncopathologist, and the data expressed as percentage of positive tumor cells within each lesion, while recording frequencies of cases with LIG3 overabundant (LIG3-high) or lost (LIG3-low) staining in 10-20% and in excess of 20% of the tumor cells (see Figure 6G for examples of staining patterns). Cases with over 90% of cancer cells showing a staining intensity comparable with surrounding stromal cells on the same section (internal control) were regarded as displaying a normal pattern of LIG 3 expression.
QUANTIFICATION AND STATISTICAL ANALYSIS
Statistical parameters including sample size, precision measures and statistical significance are reported in the figures, corresponding figure legends and Method Details sections.
Genetic Screens
Genetic screens were performed in triplicate and statistical analysis was carried out using the MAGeCK and DESeq2 software.
qRT-PCR Analysis
Gene expression measurements were performed in triplicate, normalized to expression of house-keeping genes, and presented as mean ± SD of replicates. Statistical significance was estimated with the two-tailed unpaired t-test.
Long-Term Clonogenic Assays
All experiments were repeated three times, unless otherwise stated, and data are presented as mean ± SD of replicates. For statistical analysis the two-tailed unpaired t-test test was used.
Immunoblotting
Immunoblotting experiments were repeated at least two times. Representative images are shown and quantification was carried out when indicated.
Micro-Irradiation Assay
In each experiment on average 6 cells were micro-irradiated and analyzed per condition, per replicate. Experiments were repeated two times and data are presented as mean ± SD. Statistical analysis was performed using two-tailed unpaired t-test.
DNA Fiber Assays and S1 nuclease
For DNA fiber assay at least 200 fibers were measured per condition and group comparison was performed with Mann–Whitney U test. Experiments were repeated twice.
Immunofluorescence for RAD51 IRIF and ssDNA
Group comparison was performed with the two-tailed unpaired t-test. Experiments were repeated twice.
Metaphase spreads and telomere FISH
A minimum 60 metaphase images were captured per replicate. Experiments were repeated at least 3 times. two-tailed unpaired t-test was used.
Survival Analysis
Data are presented as Kaplan-Meier curves and the p value between scr sh and shLIG3 in olaparib-treated conditions were computed using Log-Rank (Mantel Cox) statistics.
Survival Analysis
Data are presented as Kaplan-Meier curves and the p value is computed using Log-Rank (Mantel Cox) test.
ACKNOWLEDGMENTS
We would like to thank Peter Bouwman and for kindly sharing the Brca1SCo/–;Trp53−/− mouse embryonic stem cells, Hanneke van der Gulden for technical assistance, and Sylvie Noordermeer and Dan Durocher for kindly sharing the RPE1-TERT cells lines. We are also grateful to Giorgos Pappas (DCRC) for his contribution to the micro-irradiation experiments. We thank the members of the Preclinical Intervention Unit of the Mouse Clinic for Cancer and Ageing (MCCA) at the NKI for their technical support with the animal studies, and we thank the NKI core facilities: Digital Microscopy facility, Genomics Core facility and Animal facility for their excellent service. This work was supported by grants from the European Union’s Horizon 2020 research and innovation program under the Marie Skłodowska-Curie grant agreement No. 722729; the Dutch Research Council (NWO, VICI 91814643); the Danish Cancer Society (R204-A12617-B153); the Danish Council for Independent Research (DFF-7016-00313); the Novo Nordisk Foundation (synergy grant no. 16854); the Swedish Research Council (VR-MH 2014-46602-117891-30); the Swedish Cancer Foundation (170176); the Danish National Research Foundation (project CARD, DNRF 125); the Dutch Cancer Society (KWF grant 11008 to ARC); and the Oncode Institute, which is partly financed by the KWF.
REFERENCES


