

Abstract
Cell migration is fundamental for the immune response, development, and morphogenesis. For navigation through complex and ever-changing environments, migrating cells require a balance between a stable leading-edge, which is necessary for directional migration, and some unstable features to enable the required dynamic behaviors. The leading edge is often composed of actin-driven protrusions including lamellipodia and ruffles with continuously changing membrane curvature. Whether their membrane topography affects the cell’s leading edge and motion persistence in complex environments remains unknown. To study this, we combined a theoretical analysis with machine learning-based segmentation for time-resolved TIRF microscopy, membrane topography analysis from electron microscopy images and microfluidics. We discovered that cell motion persistence and directionality, in both freely moving and environmentally-constrained cells, strongly depend on the curvature-sensing protein Snx33. Specifically, Snx33 promotes leading edge instabilities by locally inhibiting WAVE2-driven actin polymerization in a curvature-dependent manner. Snx33 knockout cells migrate faster and are more persistent during unobstructed migration, but fail when a change in direction is required. Thus, Snx33 is key for steering cell motility in complex environments by facilitating contact inhibition of locomotion and promoting efficient turning. These results identify cell surface topography as an organizing principle at the cell periphery that directs cell migration.
Main text
Cell migration drives many developmental, physiological, and pathological processes. While the mechanisms underlying propulsion are largely known, it remains unclear how cells steer their movement to navigate complex and dynamic environments1 and circumnavigate obstacles within inhomogeneous tissues2–3. These adaptive behaviors are particularly important for cell types that require fast and dynamic responses, such as immune cells and disseminating tumor cells. Switching between actin-driven protrusions and blebbing has been shown to aid cell steering in development4, but cells often only display actin-rich cell protrusions such as lamellipodia and ruffles. These need to be long-lived enough for cells to sense and navigate their surroundings, while ‘unstable’ enough to allow them to adapt when confronted with an obstacle5,6. The dynamic nature of these protrusions leads to dramatic changes in plasma membrane curvature, especially at the leading edge5. However, it remains unclear whether membrane topography is just a consequence of coordinated forces at the cell surface, or if it actively encodes information for regulating leading-edge stability and motion persistence7,8.
Given the dynamic patterns of actin and curvature in the lamellipodia of migrating cells9 (Fig. 1a, b), we hypothesized a function for membrane curvature dynamics during migration. To guide our strategy to investigate this hypothesis, we first sought to identify the key parameters controlling leading edge stability and curvature patterning. We performed a general theoretical analysis to map out how membrane shape and actin organization would be affected by a direct interaction between actindependent force generation and membrane curvature. We found that a spontaneous pattern emerges when there is a particular coupling between curvature and actin activity (Supplementary Note): specifically, a negative coupling between curvature and actin activity, such that actin polymerization is suppressed in regions of inward (positive) plasma membrane curvature (Fig. 1c). These theoretical results indicate that the coordinate action of sensing positive membrane curvature and locally downregulating actin polymerization may lead to an instability in the lamellipodium that is then able to generate complex patterns at the leading edge of migrating cells, as seen in neutrophils.

a) The leading edge of migrating cells is characterized by intricate curvature patterns. Arrow indicates the direction of cell movement. b) Scanning electron microscopy (SEM) of dHL-60 cell with zoom-in at the leading-edge. c) Coupling between membrane curvature and actin activity leads to pattern formation for negative coupling between actin activity and membrane curvature. Such mechanochemical instabilities are a hallmark of active surfaces31–35. Here, the instability is governed by the curvature coupling coefficient kC relative to the actin self-activation constant kA. Patterning furthermore depends on the mechanical properties of the plasma membrane, characterized by the membrane persistence length λ = (κ/γ)1/2, in which κ is the bending rigidity and γ is the surface tension of the plasma membrane, and the diffusion length λA = (D/kA)1/2 in which D is the diffusion coefficient of actin activators. See Supplementary Note for details on the calculation. d) Time-lapse bright-field imaging of dHL-60 cells. e) Time-lapse p-polarization of p-TIRFM imaging of dHL-60 cell with zoom-in at the leading-edge. f) Under-expressed (blue) and over-expressed (orange) BAR domain genes between undifferentiated (non-migratory, curvature-poor) and differentiated (migratory, curvature-rich) HL-60 cells. g) Fluorescently-tagged Snx33 and CAAX (membrane marker) in upper and lower z-planes in dHL-60 cell. h) Pearson correlation coefficient of fluorescently-tagged Snx33 and CAAX in relative position z/h acquired by confocal microscopy with schematic illustrating experimental setup. n=10. Grey regions denote standard error of the mean. Scale bars = 10 μm.
To investigate this hypothesis, we made use of immune-like cells (HL-60 cells), which polarize and continuously rearrange their membrane curvature independently of cell adhesion, thus allowing us to test the role of intrinsic changes in plasma membrane curvature for cell motility6,10. When induced to differentiate, these cells undergo substantial remodeling of their proteome and initiate rapid migration, resembling what occurs in the bone marrow in vivo11. We terminally differentiated HL-60 cells in vitro to generate motile neutrophil-like cells from stationary round blasts (Fig. 1d, Supplementary Fig. 1a). These terminally differentiated, motile cells (dHL-60 cells) display both actin-rich lamellipodia and membrane ruffles at the leading edge. To analyze membrane topography in more detail, we used scanning electron microscopy (SEM), for ultrastructural detail of fixed cell membranes, and polarized total internal reflection fluorescence microscopy (p-TIRFM), which enables membrane visualization of live cells. We observed highly curved membrane structures, as observed by SEM in the upper plasma membrane (Fig. 1b), that are very dynamic, as visualized by p-TIRFM in the basal plasma membrane (Fig. 1e, Supplementary Fig. 1b-d).

a) Schematic illustrating changes in HL-60 cells during its differentiation. b) Schematic illustrating the principles of pTIRFM imaging using carbocyanine dyes (DiI). Time lapse pTIRFM imaging of a dHL-60 cell using c) s-polarization and d) p-polarization. Scale bars = 10 μm.
One protein family that could facilitate membrane curvature sensing and thereby pattern formation are BAR domain-containing proteins. These proteins form crescent-shaped membranebinding dimers that can sense and generate curvature12–14. Notably, their key roles in membrane remodeling and organelle trafficking are facilitated by modulation of the actin cytoskeleton through several auxiliary domains (e.g. SH3, RhoGAP, RhoGEF, PX, PH) that regulate nucleation promoting factors of the Arp2/3 complex and formins, or Rho GTPases14,15. To identify potential candidates from this large protein family, we first assessed the expression profile of its members before and after HL-60 differentiation, i.e., in a curvature-poor versus a curvature-rich state. We identified the BAR domain protein Snx33 as one of the most differentially expressed family members, with 16-fold over-expression in the curvature-rich state (Fig. 1f). We further evaluated its subcellular localization by confocal microscopy using fluorescent tags and found that Snx33 is enriched at membrane ruffles (Fig. 1g, h). Finally, we analyzed its dimeric structure by PyMOL, and identified a significantly positively charged patch, which strongly suggests an inward (positive) curvature-dependent binding (Supplementary Fig. 2a-d). Consistent with this, Snx33 is predicted to bind shallow curvatures in comparison to many other BAR domain proteins14.

a) Structure of PX-BAR domains of Snx33 (4AKV) together with electrostatic surface representation (side view). Dotted line indicates the potential membrane-binding surfaces, while solid line shows overall dimensions of the dimer. b-d) Electrostatic surface representation of 4AKV side view (b), top view (c) and bottom view (d). Visualizations were created in PyMOL (The PyMOL Molecular Graphics System, Version 2.4.2 Schrödinger, LLC).
On the basis of our theoretical model as well as Snx33 expression, localization, and structural characteristics, we speculated that Snx33 may sense membrane curvature to regulate leading edge stability and potentially also cellular navigation. To test this directly, we generated a Snx33 knockout cell line (Snx33 -/-) using CRISPR/Cas9 technology (Supplementary Fig. 3a, b). Given that cell shape reflects changes in motion-driving actin-rich protrusions16, we performed a quantitative and unbiased comparison of selected cell morphometric parameters, i.e., cell spreading, cell elongation and leadingedge characteristics. As immune cells radically change their morphology in short periods of time, we performed our analysis over time, with the aim of capturing these dynamics. To this end, we trained and used machine learning-based algorithms in ilastik to analyze movies of cells imaged by total internal reflection fluorescence microscopy (TIRFM) (see Methods for details). On 2D substrates, Snx33 -/- cells spread to a larger extent and showed a more elongated morphology (Fig. 2a-d, Supplementary Fig. 4a, b). To determine whether this phenotype was the result of a change in leading-edge characteristics, we again used ilastik to segment the leading-edge from time-lapse TIRFM images of migrating cells (Fig. 2e), and a custom Fiji-based method to segment the area with membrane ruffles in fixed cells observed by bright-field imaging (Supplementary Fig. 4a; see Methods for details). Both measurements revealed that Snx33 -/- cells have bigger and longer leading edges (Fig. 2f, g, Supplementary Fig. 4c). Moreover, we verified that the observed phenotype was not dependent on cell adhesion to the substrate by plating cells in low adhesion environments (Supplementary Fig. 4d-g). Altogether, these results suggest that Snx33 -/- cells have a more persistent front in an adhesionindependent manner.

a) Snx33 clone sequencing confirming a frameshift mutation. b) Snx33 and GAPDH Western blots of wt cells and Snx33 -/- clone. c) Representative histograms of CD11b intensity of wild-type, Snx33 -/- and CRISPR/Cas9 control of HL-60 cells before and after 5 days of differentiation.

a) Example images of bright-field of wild type, Snx33 -/- and Snx33 -/- with eGFP-tagged Snx33 cells. Quantification of b) cell and c) leading edge area. d) Example bright-field images of wt dHL-60 cells on control (fibronectin only) and lower adhesion substrate (fibronectin with 5% molar BSA). e) Adhesion-dependent cell number quantification. Data from two independent experiments. Quantification of f) cell and g) leading edge area. Controls: n = 82 (wt), n = 102 (Snx33 -/-); Lower adhesion: n = 53 (wt), n = 72 (Snx33 -/-). h) Quantification of area with membrane ruffles in wt and Snx33 -/-dHL60 cells. n=175 (wt), n=170 (Snx33 -/-). Statistics: t-test and Mann-Whitney-U- Test. Scale bars = 10 μm.

a) Exemplary wt and Snx33 -/- dHL-60 cells imaged using TIRFM. b) Spread area, c) elongation and d) eccentricity based on time lapse analysis of dHL-60 cells using TIRFM. e) Exemplary leading-edge segmentation and leading-edge evolution of wt and Snx33 -/- dHL-60 cells. Time frames (5 s) is color-coded. f) Leading-edge length and g) area. n=82 (wt), n=78 (Snx33 -/-). Statistics: t-test or non-parametric Mann-Whitney-U-test. Scale bars = 10 μm.
Plasma membrane tension increases as a result of leading-edge growth and cell spreading17,18. To determine whether the increase in front persistence that we observed also affects the mechanical properties of the plasma membrane, we measured apparent membrane tension in wild-type and Snx33 -/- cells by static tether pulling via single-cell atomic force spectroscopy, where a plasma membrane tether is held by an atomic force microscopy cantilever with a constant length until it breaks (Supplementary Fig. 5a). We found that the static tether force was significantly increased in Snx33 -/- dHL-60 cells (from 61.58 to 75.25 pN; Supplementary Fig. 5b). Such an increase in static tether force corresponds to an almost 50% increase in apparent membrane tension (from 177.87 to 265.62 μN/m; see Methods for details). These results further confirm that Snx33 -/- cells have a very persistent leadingedge capable of increasing membrane tension. Notably, all these phenotypes were not a consequence of defective differentiation, as the neutrophil differentiation marker CD11b was unperturbed in Snx33 -/- cells (Supplementary Fig. 3c). Moreover, the increases in spread area, leading-edge area and membrane tension could be rescued by stably expressing fluorescently-tagged Snx33, excluding Snx33-independent functions as the origin of these phenotypes (Supplementary Fig. 4b, c, Supplementary Fig. 5b, c).

a) Schematic of static tether pulling experiments. b) Mean static tether force of wt (n = 24), Snx33 -/- (n = 26) and Snx33 -/- with overexpressed eGFP-Snx33 (n = 25) from 3 independent experiments. c) Mean static tether force of wt (n = 27) and CRISPR control (n = 28) dHL-60 cells from 4 independent experiments. Statistics: t-test and Mann-Whitney-U-test.
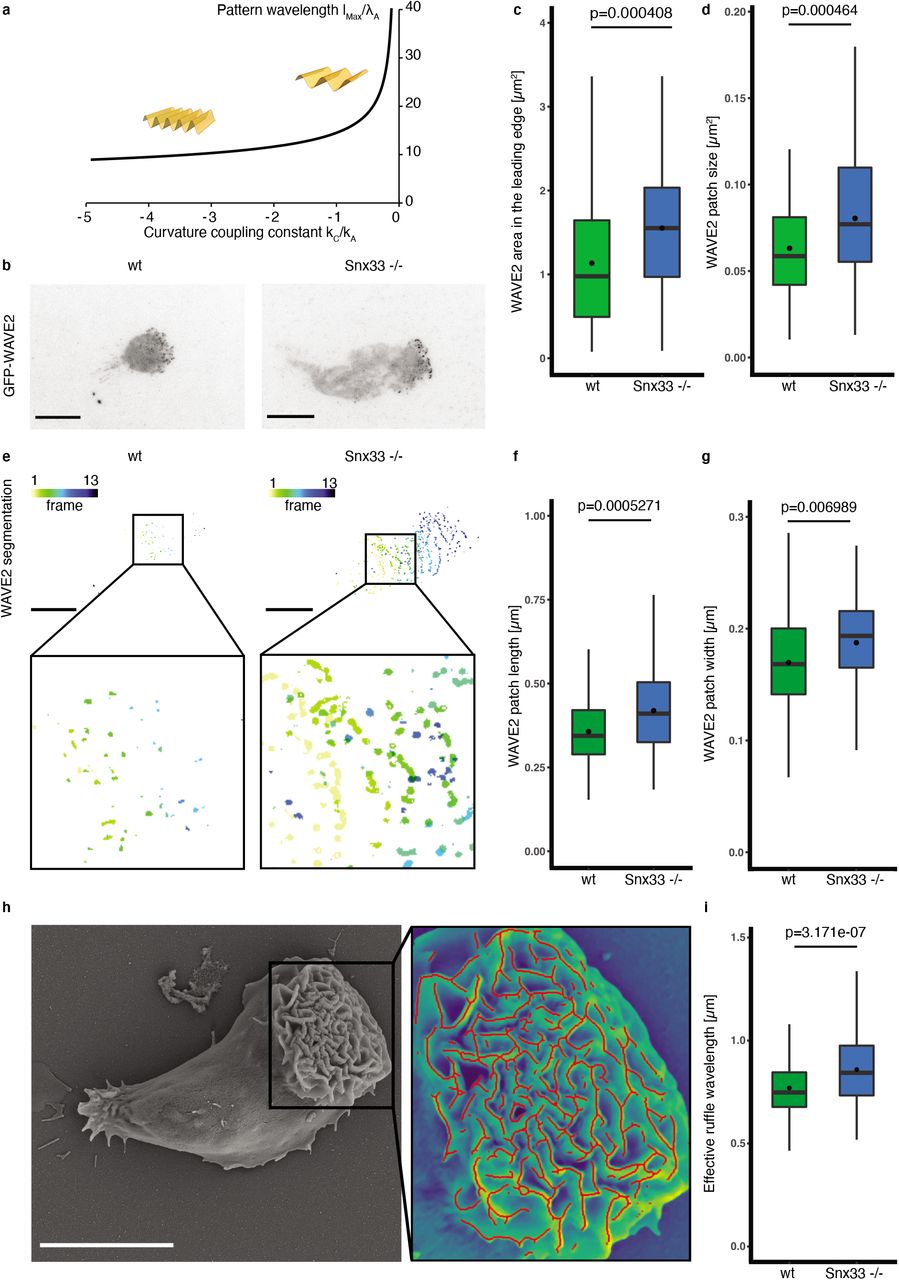
These data are compatible with the hypothesis that Snx33 negatively regulates actin polymerization and thereby leading-edge size. Several BAR domain proteins, including Snx33, directly bind and regulate the activity of actin nucleator promoting factors (NPF) from the WASP family14,19. Therefore, Snx33 could limit leading-edge size by negatively regulating actin polymerization by WAVE2, the main NPF in neutrophils. The WAVE2 complex earned its name because it displays a very stereotypical wave pattern on the basal membrane during cell migration20. However, what regulates WAVE2 binding to the membrane and determines its characteristic pattern remains poorly understood9. In our theoretical analysis, the pattern of membrane curvature and actin activator (WAVE2) emerge together as a consequence of their mechanochemical feedback (Fig. 1c). In our equations, the dominant patterning wavelength increases as the magnitude of the curvature coupling constant is reduced, predicting that the WAVE2 patch width should increase with reduced curvature regulation (Fig. 3a). To test this prediction, we imaged WAVE2 wave patterns in Snx33 -/- and wild-type cells during unconfined migration by TIRFM (Fig. 3b-e). Strikingly, Snx33 -/- cells showed an increase in both the length and the width of WAVE2 patches (Fig. 3f-g). This is particularly interesting as, to date, the modulation of WAVE2 patch morphology has not been observed. Only a change in the number of patches (total abrogation or increase) have been shown, both of which strongly affected cell migration21,22. We next tested the functional relevance of the change in WAVE2 patch morphology for leading-edge shape. To that end, we quantified the effective ruffle wavelength from SEM images and observed a significant increase for Snx33 -/- cells when compared with their wild-type counterparts (Fig. 3h, i, Supplementary Fig. 4h). These findings identify Snx33 as a key component in the feedback between membrane shape and the actin polymerization that modulates it. They also provide a molecular player to the prediction from our theoretical model, namely that sensing positive membrane curvature and locally downregulating actin polymerization is sufficient to generate complex patterns at the leading edge of migrating cells.

a) Our theoretical calculation predicts that the dominant wavelength lMax of the mechanochemical pattern in the lamellipodium should increase as the magnitude of the curvature coupling kC decreases. b) Exemplary images of Hem1-eGFP (component of the WAVE2 complex) in wt and Snx33 -/- dHL-60 cells using TIRFM. c) Quantification of WAVE2 area in the leading edge and d) WAVE2 patch size. e) Exemplary WAVE2 segmentation with zoom-in. Time frames (5 s) are color-coded. f) Quantification of WAVE2 patch length and g) width in wt and Snx33 -/- dHL-60 cells. n=82 (wt), n=78 (Snx33 -/-). h) SEM image of dHL-60 cell with zoom-in of the overlay of the leading-edge and ruffle segmentation (red). i) Quantification of effective ruffle wavelength in wt and Snx33 -/- dHL-60 cells. n=175 (wt), n=170 (Snx33 -/-). Statistics: t-test or nonparametric Mann-Whitney-U-test. Scale bars = 10 μm.
Our data thus far reveal an unexpected role for the membrane curvature sensor, Snx33 in regulating actin polymerization and leading-edge morphology. This suggests that it may also play a role in coordinating cell migration23,24. We first tested unconfined migration on 2D substrates with a homogeneous chemoattractant, promoting cell motility without requiring the cell to adapt to any obstacle. We measured speed and turning angles of dHL60 cells and observed that Snx33 -/- cells migrated faster and in a more persistent manner in an unrestricted 2D environment, while wild-type cells were more prone to turn (Fig. 4a-c). This is consistent with the increase in leading-edge size we observed in Snx33 -/- cells (Fig. 2e-g).

a) Evolution of cell body displacement over time in wt and Snx33 -/- dHL-60 cells. Time frames (5 s) are color-coded. b) Cell speed in wt and Snx33 -/- dHL-60 cells and c) distribution of angles at which dHL-60 cells turn during migration. n=82 (wt), n=78 (Snx33 -/-). Schematic of migration assay using microfluidic devices and quantification of d) migration speed in straight channels (n=235 for wt, n=169 for Snx33 -/-), e) constriction passage time (n=234 for wt, n=158 for Snx33 -/-) and f) decision channel passage time (n=159 for wt, n=91 for Snx33 -/-) in dHL-60 cells. g) Segmentation of a contact event between two wt (upper panel) or Snx33 -/- (lower panel) dHL-60 cells. Arrows are pointing towards contact interfaces. h) Percentage of cell circumference in contact with another cell in wt (n=18) and Snx33 -/- (n=20) dHL-60 cells. i) Bright-field and TIRFM imaging of cell-cell contact in wt dHL-60 cells with fluorescently-tagged Snx33 and Hem1. Arrow is pointing towards cell-cell contact. j) WAVE2 fold change after cellcell contact in wt (n=9) and Snx33 -/- (n=10) dHL-60 cells. Statistics: t-test or non-parametric Mann-Whitney-U-test. Scale bars = 10 μm.
Migration through diverse body tissues requires cells to adapt their behavior to different physical environments and the presence of obstacles. Indeed, protrusion dynamics increase during directional changes in 3D environments5. Our data thus far suggested that Snx33 promotes leading edge instabilities, which could facilitate object avoidance by efficient turning. To test if lamellipodia dynamics are controlled by membrane curvature and Snx33, we assessed the locomotion process in more complex environments. For this we used microfluidic devices to mimic a more natural in vivo environment for neutrophils while retaining a high reproducibility and control over the experimental conditions25,26. First, we mimicked 1D chemokine-driven migration by placing the cells into linear microfluidic channels with a geometry that confined the cells. Here, Snx33 -/- dHL60 cells migrated more efficiently than their wild-type counterparts (Fig. 4d), in agreement with our observations of a more stable leading-edge in unconfined 2D conditions (Fig. 2g). We then introduced constrictions in the channels, which allow nuclear passage. Under these conditions, passage times were decreased in Snx33 -/- cells (Fig. 4e), highlighting again their improved migratory capacity in decision-free environments. Next, we tested their ability to navigate a path with an obstacle25. For this, we employed microfluidic devices that guide the cells towards a decision point, at which they encounter four differently sized pores of between 2 and 5 μm in width. Neutrophils display a strong pore-size preference, migrating predominantly through larger pores and ignoring smaller ones25. We found that Snx33 -/- cells were still able to choose the path of least resistance (Supplementary Fig. 6a, b), but the decision time was significantly increased when compared with their wild-type counterparts. This suggests that, when confronted with a barrier, their reduced protrusion dynamics gives Snx33 -/- dHL-60 cells a competitive disadvantage over wild-type cells in efficiently negotiating an obstruction.

a) Overlay of bright- field, nuclei and cell body images of dHL-60 cells migrating in PDMS-based devices with a decision point. b) Frequency of wt and Snx33 -/- dHL-60 cells choosing a channel of a certain size (n = 159 for wt, n = 91 for Snx33 -/-). Data from 3 independent biological replicates. Scale bar = 10 μm.
To gain further insights into the object-avoidance response of Snx33-deficient cells, we devised a reductionistic assay to test contact inhibition of locomotion (CIL), a common phenomenon to many cell types, including dHL-60s, where cells stop moving in a particular direction when they come into contact with another cell or an object20,27. We seeded a high density of dHL-60 cells to promote cell-cell interactions and imaged their unconstrained 2D migration while performing TIRFM. Snx33 -/- cells collided more often and formed larger cell-cell contacts compared to wild-type dHL60 cells (Fig. 4g, h), in agreement with their increased decision time when faced with an obstacle (Fig. 4f). This suggests that Snx33 is necessary for steering cell movement. Finally, to gain molecular insight into the role of Snx33 in CIL, we simultaneously imaged the neutrophil WAVE2 complex component Hem1 tagged with GFP, and Snx33 tagged with mCherry using confocal and TIRFM. First, quantitative analyses of single cells revealed that the fluorescent signal of both proteins largely overlapped in all cell locations except for the highly negatively (outwards) curved leading-edge (Supplementary Fig. 7a, b). There, the plasma membrane-bound WAVE2 accumulation coincided with a decrease in the Snx33 signal (Supplementary Fig. 7c, d). Next, we imaged Snx33-GFP in colliding wild-type cells and found that it localizes to the cell contact area where WAVE2 disappears and relocates to a contact free zone, which then becomes the leading-edge, resulting in cell repolarization (Fig. 4i). To assess whether the dysfunctional CIL response in Snx33 -/- cells is indeed due to impaired WAVE2 inhibition at the contact area, we quantified the WAVE2 component Hem1-GFP before and after collision. While wild-type cells displayed a clear reduction in WAVE2 after the contact event, necessary for cell repolarization, Snx33 -/- cells failed to inhibit WAVE2 (Fig. 4j). To date, little is known about the molecular machinery orchestrating CIL, and in particular, no curvature sensing has yet been shown to regulate it. These observations support a key role for membrane topography and the curvature sensing protein Snx33 in regulating actin polymerization during CIL, a process not only key for immune cell migration in complex environments, but also fundamental during embryogenesis and collective migration in vivo28.

a) Bright-field and confocal images of dHL-60 cell, eGFP-Snx33 and mCherry-Hem1 (component of WAVE2 complex) in the bottom and upper z-planes. Arrows indicate the most protruding edge at the cell bottom. b) Pearson correlation of eGFP-Snx33 and mCherry- Hem1 in normalized z-planes in the leading edge. n=10. Purple regions denote standard error of the mean. c) Exemplary images of fluorescently-tagged Snx33 and Hem1 and line scans through the leading edge in dHL-60 cells using TIRFM. d) Snx33 and Hem1 normalized intensity at the protrusion edge. Scale bar= 10 μm.
Several studies have attempted to decipher the reasons behind the diversity of curvaturesensing proteins29, highlighting their role in membrane reorganization downstream of extracellular mechanical stimulation30. Here, by using leukocytes, which polarize and generate a leading-edge in an adhesion-independent manner, we take a cell centric approach to demonstrate a new role for membrane topography in de-stabilizing lamellipodia for efficient navigation. To that end, we developed a reductionistic theoretical model that relates curvature regulation in the leading edge with membrane mechanics and actin polymerization. In accordance with our model predictions we identify a curvature sensing protein, Snx33, that senses inward (positive) curvature and inhibits actin polymerization by negatively regulating WAVE2, the main NPF in neutrophils. Thus, Snx33 de-stabilizes lamellipodia making the leading edge more dynamic, which we show is key for adapting to an ever-changing environment. In summary, this work identifies the sensing of cell-intrinsic membrane topography as a novel mechanism that enables dynamic adaptation necessary for steering cell migration and CIL, a process not only key for immune cell migration, but also fundamental during embryogenesis and collective migration in vivo.
The fact that a curvature sensing protein can tune leading-edge dynamics substantiates the notion that cells use and regulate their membrane topography to encode information. In fact, not only ruffles but a lot of organelles have stereotypical membrane topography. This, combined with the diversity of BAR domain proteins present in cells, opens the door to a new level of regulatory possibilities.
Author Contributions
A.D.M., E.S conceived the project and designed the experiments. E.S., M.B. and J.S., performed the experiments with EM advice from Y.S and microfluidic support from M.S.. E.S. and S.D.A. analyzed the data with support from A.E. and A.K.. A.E. performed the theoretical analysis. A.D.M. and E.S and A.E wrote the manuscript. All authors contributed to the interpretation of the data, read and approved the final manuscript.
Methods
Cell culture
HL-60 cells were grown in RPMI 1640 media with 10% heat-inactivated FBS (#10500-064, Gibco) and 1% Penicillin-Streptomycin (#15140-122, Gibco) in a humidified incubator at 37°C with 5% CO2. Cells were differentiated by adding 1.5% DMSO (#D2438, Sigma Aldrich) and used after 5 days. Each independently-differentiated batch was treated as a biological replicate. For starvation, cells were kept for 1 hour in FBS-free RPMI 1640 media with 0.3% fatty acid free BSA (#A7030-10G, Sigma Aldrich). For imaging or fixation, dHL-60 cells were plated on fibronectin-coated (0.01mg/ml, #356008, Corning) glass-bottom dishes (#627860, Greiner bio-one) and allowed to adhere for 10 minutes in growth media. Next, cells were washed and stimulated with 10 nM fMLP (#F3506-5MG, Sigma Aldrich). For lowering adhesion, the coating was supplemented with 5% molar BSA (#A7030-10G, Sigma Aldrich). To generate stable cell lines with fluorescently tagged Snx33, Hem1 and CAAX lentiviral transduction was used as described previously21. Cells were sorted on a BD FACS Aria™ at EMBL Flow Cytometry Core Facility.
Generation of knockout cell line by CRISPR/Cas9
CRISPR/Cas9 generation in HL-60 cells was performed as described previously22. Cloning of the target guide sequence to target Snx33 was performed as previously described36,37 (Forward: CACCGctgggacgacGGATGCACAG; Reverse: aaacCTGTGCATCCgtcgtcccagC). Cells expressing BFP-tagged Cas9 were single-cell sorted in 96-well plate on BD FACS Aria™ Fusion at EMBL Flow Cytometry Core Facility. Single-cell clones were verified by genomic DNA amplification by Touchdown PCR38 and sequencing, followed by Western blot of selected clonal lines.
Western blot
For immunodetection of Snx33 and GAPDH, 6×10⁶-1.2×10⁷ HL-60 cells were lysed in RIPA Lysis and Extraction buffer (#89900, Thermo ScientificTM) according to manufacturer’s instruction with supplementation of the protease inhibitors (#4693159001, Roche). Samples were denatured with 4xLaemmli buffer (#161-0747, BioRad) containing 10% β-mercaptoethanol (#m6250, Sigma Aldrich) at 95° for 5 min. After SDS-PAGE and transfer, PVDF membrane with transferred proteins was blocked in 5% BSA in TBST and incubated over-night with 1:1000 dilution of anti-Snx33 (#orb331346, Biorbyt) or 1:80 000 dilution of anti-GAPDH (#NB300-221, Novus Biologicals). The blot was developed with secondary antibodies at 1:10 000 dilution of Donkey-Anti-Rabbit-HRP (711-035-152, Jackson Immuno Research) or Goat-Anti-Mouse-HRP (115-035-062, Jackson ImmunoResearch).
CD11b staining of HL-60 cells
After starvation, 1×10⁵ of undifferentiated and differentiated HL-60 cells were stained with Anti-Hu CD11b Alexa Fluor® 488 antibody solution (#A4-681-T100, Exbio). Fluorescence was measured on a Cytek® Aurora (Cytek) at the EMBL Flow Cytometry Core Facility and further analyzed and plotted using FlowJo.
RNA sequencing
Total RNA samples obtained from 3 biological replicates were purified using RNeasy Mini Kit (#74104, Qiagen) according the manufacturer instructions with a DNase digestion step (#79254, Qiagen). To ensure high quality, samples were analyzed on an Agilent 2100 Bioanalyzer (Agilent Technologies). RNA sequencing was performed on an Illumina NextSeq 500 platform as NextSeqHigh-75 SE at the EMBL genomics core facility. For sequence alignment the hg19 reference genome was used. Differential expression analysis was performed with a custom-made Galaxy pipeline using a DESeq2 package.
Imaging
TIRFM images of live cells were acquired on a Nikon Ti Eclipse inverted microscope with a TIRF objective CFI Plan Apo Lambda 100x Oil (#MRD01905, Nikon) and sCMOS camera controlled by NIS-Elements (Nikon). Sample drift was reduced using an autofocus system (Perfect Focus, Nikon) for time lapse imaging.
Confocal images of fixed cells were obtained with a silicone objective UPLSAPO 60X S (NA 1.3; WD 0.3 mm) on an Olympus FV3000 inverted microscope at EMBL advanced light microscopy facility.
Epifluorescent and bright-field imaging of fixed cells was performed using a 40x objective (#MRD00405, Nikon), the SOLA SE II and 100W halogen lamps (Nikon) using appropriate filter sets.
Polarized TIRFM (pTIRFM) modality was implemented based on previous work39–44. For imaging, dHL-60 cells were stained before plating with carbocyanine dye DiI (#D3911, ThermoFisher Scientific).
Fixation and F-actin staining
Migrating dHL-60 cells were fixed by adding fixation buffer (2x) to growth media (1:1 v/v) and incubated at 4°C for 1 hour. Fixation buffer (1x) contains 3.7% paraformaldehyde (#28908, Thermo Scientific), 1x intracellular buffer (140 mM KCL, 1 mM MgCl2, 2 mM EGTA, 20 mM HEPES, pH 7.5), 320 mM sucrose (#S0389-500G, Sigma Aldrich) and 0.2% BSA (#A7030-10G, Sigma Aldrich). Cells were washed and stored in dPBS. For permeabilization and staining, cells were re-suspended in intracellular buffer (1x) containing 0.2% of Triton X-100 (#T8787, Sigma Aldrich). If applicable, phalloidin coupled with TRITC (#P1951, Sigma Aldrich) was added at this step. After washing with dPBS, cells were stored at 4°C in the dark or used immediately for imaging.
Theoretical calculations
Calculations for Fig. 1c and Fig. 3a were performed in Wolfram Mathematica v12.1.1.0. For the details of the derivations please see the Supplementary Note.
Cell migration assays in PDMS-based devices
PDMS-based microfluidic devices were prepared as previously described25,45,46. The devices used for migration of dHL-60 cells had heights of 2.8 μm and 3.13 μm for channels with decision point and channels with constriction, respectively. The decision channels had constrictions of 2, 3, 4 and 5 μm in two arrangements. The channels with single constrictions were 2 μm. To visualize nuclei and cell body, Hoechst 33342 (#62249, Thermo Fisher Scientific) and TAMRA (Invitrogen) were added before the introduction of cells into the PDMS device. Cell migration towards chemoattractant (fMLP) was imaged on an inverted wide-field Nikon Eclipse microscope using 20x/0.5 PH1 air objective, equipped with a Lumencor light source (390 nm, 475 nm, 542/575 nm), an incubation chamber and the heated stage with CO2. The acquired data were analyzed using ImageJ software and manually curated. Only single cells that moved through the entire channel were considered for analysis. All the parameters were quantified based on the nuclei signal.
Tether extrusion using atomic force spectroscopy
Apparent membrane tension was measured by extruding plasma membrane tethers. For measurements, Olympus BioLevers (k = 60 pN/nm) from Bruker were mounted on a CellHesion 200 AFM (Bruker), which is integrated into an Eclipse Ti inverted light microscope (Nikon). Cantilevers were calibrated using the thermal noise method and coated with 2.5 mg/ml Concanavalin A (#C5275, Sigma Aldrich). Prior to the measurements, cantilevers were rinsed in dPBS. For tether measurement, the cantilever was position over the cell, preferably over the leading edge. Measurements parameters for static tether pulling experiments were as followed: approach velocity was set to 1 μm/s, contact force to 100–300 pN, contact time to 5–10 s, and retraction speed to 10 μm/s. After a 10 μm tether was pulled, the cantilever position was held constant until it broke, but no longer than 30 s. In every experimental repetition the conditions’ order was randomized. For every cell at least 3 different tether measurements were taken.
The data analysis was performed using the JPK Data Processing Software. For assessing the magnitude of membrane tension based on tether force measurements, the following formula was used21:
 where F0 is the tether force measured by the AFM and B is the bending rigidity of the plasma membrane, which we assume to be invariable between different experimental conditions (2.7×10⁻¹⁹ Nm based on previous measurements47,48).
Image analysis
For confocal images, only the z-planes that contained the top 80% intensity of mCherry-CAAX were considered based on line scans covering the entire resliced maximum intensity z projection. A channel of interest (ChoF1) was used for mask generation based on automatic Otsu segmentation. A custom-made ImageJ script allowed to calculate the Pearson correlation coefficient (PCC) for every z-plane of ChoF1 with ChoF2 based on the mask of ChoF1 using the in-built Coloc2 ImageJ plugin. Z-slices were assigned to 10 bins and the mean with standard error of the mean for every bin was calculated.
For epifluorescence images, single cells were manually selected using the ImageJ software. To segment the cell body, the contrast of bright-field images was enhanced using the equalize histogram function followed by a canny edge detection, a semi-manual closing of the obtained edges and filling the holes. To segment the leading edge, a similar strategy was used with semi-manual selection of the region with the enriched edges after the canny edge detection with higher values step. Based on the segmentation, a custom Python script was used for measurements.
For analysis of migrating cells imaged by TIRFM, a segmentation of the cell mask (based on mCherry-CAAX signal) and of the WAVE2 mask (based on eGFP-Hem1 signal) were acquired using the machine learning-based ilastik software49. Further image analysis was achieved using an in-house built program implemented in Python. The angle at which cells are moving was calculated based on the center of mass for 3 consecutive frames. The leading edge was defined as the difference between two consecutive frames where at least one pixel of WAVE2 mask is present per cluster. Leading edge length was defined as a number of pixels in the outside perimeter of the leading edge. For the analysis of cellcell contacts the same segmentation strategy was used to segment individual cells. Cell-cell contact was defined as the perimeters’ intersection of both cells.
For membrane topography analysis of SEM data, the leading edge area with ruffles was manually segmented on median filtered images. Next, ridges were detected within the segmented regions using the Meijering filter50. Ridges were later segmented using automatic Otsu thresholding and skeletonized using a custom Python script. Inversion of the number of pixels within the skeletonization per leading edge area corresponds to the effective the ruffle wavelength.
For analysis of signal enrichment at the cell edge based on TIRFM images, data on fluorescent intensity along the line of equal width and length were extracted from both channels of interest (eGFP-Snx33, mCherry-Hem1) using ImageJ. Data were aligned according to the highest fluorescence intensity of mCherry-Hem1 and normalized. Normalized mean intensity was calculated in both channels of interest for every point along the line scan and plotted using R.
Scanning electron microscopy
After 30 min of 10 nM fMLP stimulation, cells were fixed in 2,5% GA (#16220, EMS) in 0,1M PHEM buffer by adding double strength fixative (5% GA in 0,1M PHEM) directly 1:1 to the cell medium. After 10 minutes incubation, the fixative was replaced by fresh single strength fixative and fixed at room temperature for 1h. After fixation, cells were washed 2 times in 0,1M PHEM and 2 times in 0,1M cacodylate buffer. Next, they were postfixed for 2h on ice in freshly prepared and filtered 1% OsO4 (#19190, EMS) and 0,8% potassium ferrocyanide (K4[Fe(CN)6]*3H2O, #4984, Merck) in 0,1M cacodylate buffer. After postfixation, the cells were washed 4 times in H2O, and left at 4°C until further processing.
Next, cells were treated with freshly prepared and filtered 1% tannic acid (TA, CAS#1401-55-4, EMS) in water using a Pelco BioWave microwave for seven 1-minute cycles alternating between 150 W and 0 W power. Steady temperature was set to 23°C and vacuum to on for all steps. After TA treatment, cells were washed 2x in H2O on the bench and 2x in H2O in the microwave for 40 s per step at 250 W power. Cells were then treated with 1% UA in H2O using the same microwave program as for TA. After washing once in H2O and twice in 25% EtOH, cells were dehydrated in a graded series of ethanol (25 - 50 - 75 - 90 - 100 - 100) using a microwave program with step length of 40 s and 250 W power, with a steady temperature at 4°C and without vacuum. Finally, the cells were infiltrated with a graded series of Hexamethyldisilizane (HMDS, CAS# 999-97-3, Sigma Aldrich) in ethanol (25 - 50 - 75 - 100 - 100) using a microwave program with 6 steps of 1 minute each, with a power of 150 W for step 1, 3, 4 and 6, and 0 W for steps 2 and 5. After the final 100% HMDS infiltration, all HMDS was removed, and coverslips were left to dry overnight. Silica gel with moisture indicator (Merck) was added in 4 empty wells (corners) in the 24-well plate to remove excess humidity.
After drying, coverslips were mounted in aluminum stubs (Agar Scientific G301F) using carbon tape, and sputter coated with a layer of gold for 180 s at 30 mA current using a Quorum sputter coater model Q150RS.
Statistical analysis
Statistical analyses were performed using R, while data visualization by both R and Adobe Illustrator®. Normality of data distribution was tested by Shapiro-Wilk test. Two-tailed t-test was used for normal distribution. Otherwise, a non-parametric Mann-Whitney-U-test was used, if not indicated differently. In all box-plots, the lower and upper hinges correspond to the first and third quartiles (the 25th and 75th percentiles). The upper whisker extends from the hinge to the largest value, but no further than 1.5*IQR (distance between the first and third quartiles). The lower whisker extends from the hinge to the smallest value, but no lower than 1.5*IQR of the hinge. Data beyond the end of the whiskers are plotted as black dots. Black line and dot correspond to the median and mean, respectively.
Supplementary Note: Curvature-dependent mechanochemical patterning in the lamellipodium
The lamellipodia of many migrating cells exhibit characteristic patterns of actin activity and membrane curvature. These have been studied in the past predominantly by considering the complex interplay of various actin-regulatory molecules. Here we investigate the coupling between actin activity and the mechanics of the plasma membrane as an additional regulatory mechanism of the observed patterning, consistent with experimental results that show a role for curvature sensing BAR proteins in the lamellipodia of migrating cells.
1 Main equations
1.1 Activator equation
In this section, we derive the main equations of the system. We consider the concentration field A of a generic activator of actin such as WAVE2. Because lamellipodia are thin structures with a dense actin meshwork and an average filament orientation towards the leading edge [5], we neglect variations of A across the thickness of the lamellipodium and assume that diffusive transport of actin regulatory molecules occurs predominantly in the direction of average filament alignment x. We consider self-activation of A with a rate constant kA and introduce the curvature-dependent regulatory term rC(C). From the continuity equation for the surface concentration of activator molecules, we then obtain the following partial differential equation
 in which D denotes the diffusion coefficient along the cell migration axis x.
1.2 Curvature equation
The curvature C depends on the mechanical properties of the plasma membrane. We consider a Helfrich membrane with a bending rigidity κ and surface tension γ [1, 3]. In the weak bending approximation and with periodic boundary conditions, the conservation of momentum leads to the following equation for the curvature profile along x [2, 4]
 in which P = Pext – Pint denotes the pressure difference between the outside and the inside of the cell. We assume that actin polymerization generates an active pressure field which acts on the membrane from within the cell, and that depends on A(x, t). With this term and introducing the membrane persistence length
  Eq. 2 reads
 in which we denote with fA the force per activator molecule. We have furthermore assumed that the pressure in the absence of activator molecules is balanced across the membrane.
2 Regulation in the limit of small curvatures
Generally, the shape of the regulatory function rC(C) is unknown and depends on the properties of the curvature-sensing proteins involved. The shape of the dominant BAR protein in our experimental system suggests that curvature sensing is relevant in the regime of small curvatures C(x, t) = δC(x, t) (Supplementary Fig. 2). Assuming differentiability of rC with respect to C, we may write a general expansion of the form

Here, the magnitude of the linear coefficient depends on the activity of curvature regulatory proteins. To characterize the curvature-dependent feedback on A to linear order, it is useful to define the following rate constant

In the following, we assume that no curvature regulation takes place for a completely flat membrane sheet, i.e. rC(0) = 0.
3 Patterning regime
We now explore the consequences of curvature-regulatory coupling between membrane shape and actin activity by analyzing the stability of the steady state C = 0 and A = 0, in which the membrane is flat and no actin activity is present. A small perturbation away from this state can be written as
 in which k is the perturbation wavenumber and ω the corresponding growth rate. Substituting Eq. 6 into Eqs. 1 and 3 and keeping terms to linear order in the perturbation, we obtain the following dimensionless dispersion relation
 in which we have introduced the diffusion length
  . Figure 1c shows the stability diagram as a function of the normalized persistence length λ/λA and the curvature coupling constant kC/kA. For positive coupling, the zeroth mode k0 = 0 is growing over time, describing a uniformly advancing flat sheet in the linearized system. For kC < 0, there is a region in which spontaneous patterning occurs, i.e. where ω(kmax) > 0 with kmax > 0. The critical line of the instability is given by

The pattern wavelength at the maximum is given by

Thus, curvature feedback can lead to the spontaneous formation of patterns. The wavelength of the fastest-growing mode increases when the magnitude of the curvature coupling constant kC decreases (Fig. 3a).
Acknowledgements
We thank Jan Ellenberg for critical discussions and the Life Science Editors for editing assistance. The plasmid with hSnx33 was a kind gift from Duanqing Pei. We thank Brian Graziano for providing protocols, reagents and key advice to generate CRISPR knockout HL60 cells. We thank Jakub Czuchnowski for advice on image analysis. We thank the EMBL flow cytometry core facility, the EMBL advanced light microscopy facility and the EMBL genomics core facility for support and advice. We thank the EMBL genome biology computational support (and specially Charles Girardot and Jelle Scholtalbers) for critical assistance during RNAseq analysis. We acknowledge the financial support of the European Molecular Biology Laboratory (EMBL) to A.D-M., Y.S. and A.E., the EMBL Interdisciplinary Postdocs (EIPOD) fellowship under Marie Sklodowska-Curie Actions COFUND to M.B., the BEST program funding by FCT (SFRH/BEST/150300/2019) to S.D.A. and the Joachim Herz Stiftung Add-on Fellowship for Interdisciplinary Science to E.S.
Footnotes
↵§ Collaboration for joint PhD degree between EMBL and Heidelberg University, Faculty of Biosciences


