

Abstract
Nuclear processes depend heavily on the organization of chromatin, whose subunits are cylinder-shaped complexes called nucleosomes. A subset of mammalian nucleosomes in situ resemble the canonical structure determined in vitro 24 years ago. The structure of nucleosomes in situ is otherwise poorly understood. Here we use cryo-ET and 3-D classification analysis to study the structure of yeast nucleosomes both in vitro and in situ. We show that the class averages of GFP-tagged yeast nucleosomes in vitro resemble canonical nucleosomes, with additional GFP densities. In contrast, none of the class averages of nucleosome-like particles in situ (inside cells) resemble canonical nucleosomes. The heterogeneous nature of the in situ class averages suggests that the intranuclear environment favors multiple conformations. Using the structural observations here and the results of previous genomics and biochemical studies, we propose a model in which the average yeast nucleosome’s DNA is partially detached in situ.
Introduction
Eukaryotic chromosomes are polymers of DNA-protein complexes called nucleosomes. An octamer of proteins, consisting of a heterotetramer of histones H3 and H4 and two heterodimers of histones H2A and H2B, resides at the nucleosome’s center [1]. Canonical nucleosomes resemble 10 nm wide, 6 nm thick cylinders and have approximately 147 base pairs of DNA bent in 1.65 left-handed superhelical gyres around the histone octamer [2, 3]. In contrast, non-canonical nucleosomes have either partially detached DNA, partially detached histones, fewer than 8 histones, right-handed DNA gyres, or a combination of these features [2]. Both X-ray crystallography and single-particle cryo-EM have shown that reconstituted nucleosomes, either alone or within a complex, are largely canonical in vitro [3]. Nucleosome structures in situ inside cells remain mysterious.
Molecular-resolution (2 – 4 nm) studies of unique objects like cells may be obtained by cryo-electron tomography (cryo-ET), a form of cryo-electron microscopy (cryo-EM) that generates 3-D reconstructions, called cryotomograms. These studies reveal life-like snapshots of macromolecular complexes because the samples are prepared and then imaged in an unfixed, unstained, frozen-hydrated state. Most eukaryotic cells are too thick for cryo-ET, so thinner frozen-hydrated samples are made by cutting by cryomicrotomy or thinning by cryo-FIB milling [4]. Subvolumes called subtomograms contain independent copies of the cells’ macromolecular complexes. These subtomograms can be further analyzed at higher resolution using single-particle techniques such as classification and averaging. Large macromolecular complexes such as ribosomes and proteasomes can be unambiguously identified by 3-D classification and compared to class averages of known structures in an approach called purification in silico [5].
Using the purification in silico approach, we previously showed that canonical nucleosomes exist in cryotomograms of yeast cell lysates and in a HeLa cell lamella [6-8]. However, our 3-D structural analysis did not generate canonical nucleosome structures from cryosectioned fission yeast cells [6]. The discrepancy between nucleosome class averages in vitro and in situ could have either technical or biological origins. As a biological explanation for the absence of canonical nucleosome class averages in situ, we hypothesized that yeast nucleosomes are either conformationally or constitutionally heterogeneous.
In this work, we test this heterogenous-nucleosome hypothesis by using cryo-ET to image strains that have nucleosomes bearing GFP as a density tag. We use the budding yeast S. cerevisiae, herein called yeast, because it has only two copies of each histone gene and because it is more amenable to gene editing. To obtain images of intracellular nucleosomes with sufficient contrast, we make thinner cellular cryo-EM samples using both cryomicrotomy and cryo-FIB milling. We create one strain in which H2A-GFP is the sole source of H2A, meaning that the nucleosomes are expected to project one or two extra densities from their surfaces. While the nucleosomes of nuclear lysates from this strain are canonical and have extra densities consistent with GFP, the nucleosome-like particles in situ did not have these densities. Furthermore, none of the class averages of in situ nucleosome-like particles resemble the canonical nucleosome, suggesting that the yeast intracellular environment disfavors the canonical nucleosome conformation.
Results
Histone GFP-tagging strategy
Our previous cryo-ET analysis of nucleosomes in a HeLa cell revealed that subtomogram 3-D classification is sensitive to features much smaller than the nucleosome core particle, as evidenced by the separation of canonical-nucleosome class averages that differ by ∼ 10 bp of linker DNA near the dyad [8]. Furthermore, studies of flagella [9] and pilus machines [10] showed that subtomogram averages of complexes in situ can reveal either the presence or absence of small protein densities. These observations led us to use the GFP tag to facilitate nucleosome identification in situ. Our strategy is to compare subtomogram averages of nucleosome-like particles in strains that express only wild-type histones versus those that express only GFP-tagged histones.
Histones can accept a genetically encoded GFP tag at either the N-or C-terminus. An N-terminal GFP tag is not expected to be visible in any subtomogram averages because it would be separated from the histone’s globular domain by the long, flexible N-terminal “tail”. Therefore, we chose to tag the histone C-terminus, which does not have a flexible tail (Figure 1, A and B). To further confine the tag, we eliminated the peptide linker, which is included in popular GFP-tagging modules (Figure 1C). S. cerevisiae contains two copies of each histone (Figure 1D), which are arranged as gene pairs. To maximize our chances of detecting nucleosome class averages that have an extra density, we sought to create strains in which a histone-GFP fusion is the sole source of one class of histones (Figure 1, E and F).

(A) Crystal structure of the yeast nucleosome, PDB 1ID3 [25], in the disc view (left) and side view (right). DNA, dark purple; histone octamer, light gray. One set of histone C-termini are labeled and rendered as space-filling models. Two key points of reference, dyad and opposite dyad, are indicated by the arrowhead and arrowtail, respectively. The other set of C-termini are related by a 180° rotation around the dyad axis. (B) Two views of the GFP crystal structure, PDB 1GFL [72], rendered at the same scale as panel A. The N-terminus is rendered as a black space-filling model. (C) Details of the sequence at the H2A-GFP fusion, with (7aa) and without (0aa) the 7 amino-acid linker. The H2A C-terminal sequence is shaded yellow, GFP N-terminal sequence is shaded green, and the flexible linker is shaded gray. LGY0016 has a 0aa linker. (D) Histone genotype of the parent strain BY4741. (E) Homologous recombination strategy to C-terminally tag the sole copy of the H2A gene with GFP. Upper – replacement of the HTA2-HTB2 locus with KanR. Lower – Tagging of HTA1 with GFP. The junction between the HTA1 (H2A) and GFP is boxed. (F) Histone genotype of LGY0016.
In budding yeast, the H2A and H2B genes are arranged as gene pairs HTA1-HTB1 and HTA2-HTB2 [11]. We first deleted the entire HTA2-HTB2 gene pair to generate LGY0012. This deletion prevents HTA2-HTB2 from being amplified [12]. We then inserted the GFP gene at the 3’ end of HTA1, without a linker, to generate LGY0016, making H2A-GFP the sole source of H2A. We confirmed LGY0016’s genotype by PCR analysis (Figure S1A, B) and Sanger sequencing. Immunoblots using anti-H2A or anti-GFP antibodies detected a single ∼ 40 kDa band, which is the expected size of the H2A-GFP fusion protein (Figure S1C). Accordingly, the LGY0016 nuclei showed bright fluorescence (Figure S1D). We also constructed a strain, LGY0015, that expresses an H2B-GFP fusion without a linker peptide (Figure S1, E – H). We were unable to create strains that have either H2B-GFP, H3-GFP, or H4-GFP as the sole H2B, H3, and H4 sources, respectively. Consistent with this low tolerance for GFP tagged histone as the sole source of a histone type, the LGY0016 doubling time is ∼ 50% longer than for wild-type BY4741 (130 minutes versus 85 minutes) in rich media.
Cryo-ET reveals GFP tags on nucleosomes in vitro
To determine if GFP tags are detectable on the nucleosomes’ surface, we isolated and then lysed nuclei (nuclear lysates) of LGY0016 and LGY0015 cells and then imaged them by cryo-ET (Figure 2A, S3A). Next, we template matched for nucleosome-like particles using a nucleosome-sized featureless cylinder as a reference. Guided by the original RELION subtomogram-analysis workflow [13], we classified the nucleosome-like particles in 2-D, and then in 3-D (Figure S2A). Both LGY0015 and LGY0016 lysates contained 2-D class averages resembling those seen in single-particle cryo-EM studies of reconstituted nucleosomes [14], though with lower-resolution features (Figure 2B, S3B). To increase the number of detected nucleosomes, we also used an alternative workflow that skips 2-D classification (Figure S2B). We obtained nucleosome 3-D class averages this way in the lysates of both strains (Figure S4A, S5A; Movie S1, S2). These class averages have the unmistakable structural motifs of canonical nucleosomes, such as a 10-nm diameter, 6-nm thick cylindrical shape, and the left-handed path of the DNA densities. There is more DNA than expected of 1.65 gyres because the nucleosomes of nuclear lysates have linker DNA, which is not part of the 147 bp nucleosome-core DNA. All these properties are consistent with our previous subtomogram analysis of wild-type yeast nuclear lysates [7].

(A) Cryotomographic slice (12 nm) of lysates from isolated LGY0016 cell nuclei. One nucleosome-like particle (n) is indicated. (B) 2-D class averages of nucleosome-like particles that were template-matched with a featureless cylinder reference. Scale bar, 10 nm. (C) 3-D class averages of nucleosomes from nuclear lysates. Solid arrowheads indicate the extra, GFP densities. Open arrowheads indicate the positions that lack this density. (D) The approximate positions of the H2A C-termini are rendered in yellow and indicated by arrows in the crystal structure of the yeast nucleosome [25]. To facilitate comparison, this structure is oriented like the class averages in panel C. The nucleosome densities in panel C are longer along the dyad axis (horizontal) because they have linker DNA, which is absent in the nucleosome crystal structure.
Subsequent classification rounds revealed nucleosome class averages that had an extra density projecting from one or both faces (Figure S3B, S5B). One example of each class (zero, one, or two extra densities) was refined to ∼ 25 Å resolution (Figure 2C, S3C). The position of the extra density is consistent with the location of the H2A C-terminus being closer to the dyad (Figure S3D) and the H2B C-terminus being opposite the dyad (Figure S3D). While the class that has two extra densities can only be explained by nucleosomes that have two copies of H2A-GFP, the classes that have a single extra density could arise from more diverse nucleosome species. For example, if a GFP was incompletely folded, the nucleosome that it’s associated with would lack the extra density. LGY0016 nucleosomes that substitute one H2A protein with the H2A.Z variant would have at most one extra density. These possibilities are indistinguishable at the resolution of these averages. In principle, LGY0015 cells can assemble nucleosomes that have two copies of H2B-GFP. The absence of LGY0015 nucleosome classes with two densities suggest that they are either unstable or too rare to detect by 3-D classification. We focused our in situ cryo-ET analysis on LGY0016 cells because the GFP tags are easier to recognize on nucleosomes from nuclear lysates of this strain.
Canonical nucleosome classes are not detected in cryosectioned cells
To identify and then determine the structure of yeast nucleosomes in situ, we generated cryosections of LGY0016 cells. Cryotomographic slices revealed that the nuclei were densely crowded with macromolecular complexes (Figure 3A), as seen in our previous cryo-ET studies of budding yeasts [15, 16]. Template matching followed by 2-D classification revealed that some classes have the size and shape expected of canonical nucleosomes (Figure 3B); these classes were saved for 3-D analysis. The 3-D class averages were ambiguous because none of the classes resembled the canonical nucleosome (Figure 3C). Some class averages have two linear motifs (Figure 3C, starred classes) that resemble the double DNA gyres opposite the dyad, but these DNA-like densities do not go 1.65 times around the center of mass as expected of canonical nucleosomes [1]. Small variations in the classification parameters such as mask size, class number, and inclusion or exclusion of an ambiguous 2-D class did not reveal any canonical nucleosome classes. We conclude that canonical nucleosomes are not detectable by purification in silico in cryosectioned LGY0016 cells.

(A) Cryotomographic slice (10 nm) of the nucleus inside a LGY0016 cell. Major cytological features are indicated: (n) a nucleosome-like particle; (NE) nuclear envelope; (R) ribosome. (B) 2-D class averages of nucleosome-like particles. Examples of nucleosome-like particles are indicated with a green triangle in the lower-right corner of each box. Ambiguous classes like the one in the lower right did not lead to the appearance of canonical nucleosomes in the 3-D class averages, whether they were included or not. Scale bar, 10 nm. (C) 3-D class averages of nucleosome-like particles.
Cryo-FIB milled yeast also lack canonical nucleosome classes
The absence of canonical nucleosome class averages could have either a technical or a biological cause. Because complexes within cryosections are affected by compression forces [4, 17, 18], it is possible that canonical nucleosomes were distorted in these samples. While GFP does not perturb nucleosome structure in vitro, we cannot dismiss the possibility that it perturbs nucleosome in situ. Cryo-FIB milling is a compression-free method to thin frozen-hydrated cells [19-24]. This technique uses a beam of gallium ions to thin a cell under cryogenic conditions, producing a frozen-hydrated plank-like cellular sample called a cryolamella. Canonical nucleosomes are detectable in a HeLa cell cryolamella [8], meaning that cryo-FIB milling does not grossly perturb canonical nucleosomes in situ.
To control for cryosectioning forces and the effects of the GFP tag, we prepared cryolamellae of both LGY0016 and wild-type BY4741 cells. Cryotomograms of yeast cryolamellae showed that nuclei were packed with nucleosome-like particles (Figure 4A, C; Movie S3), like what we saw in cryosections. Two-dimensional class averages of template-matched nucleosome-like particles resembled those seen in lysates (Figure S7). However, none of the 3-D class averages resemble canonical nucleosomes (Figure 4B, D; Movie S4). While many of the LGY0016 and BY4741 nucleosome-like class averages have dimensions similar to the canonical nucleosome, none of them have densities that resemble the distinctive 1.65 left-handed gyres of DNA. Therefore, the absence of canonical nucleosome class averages in yeast is neither a sample-preparation nor a GFP-tagging artifact.
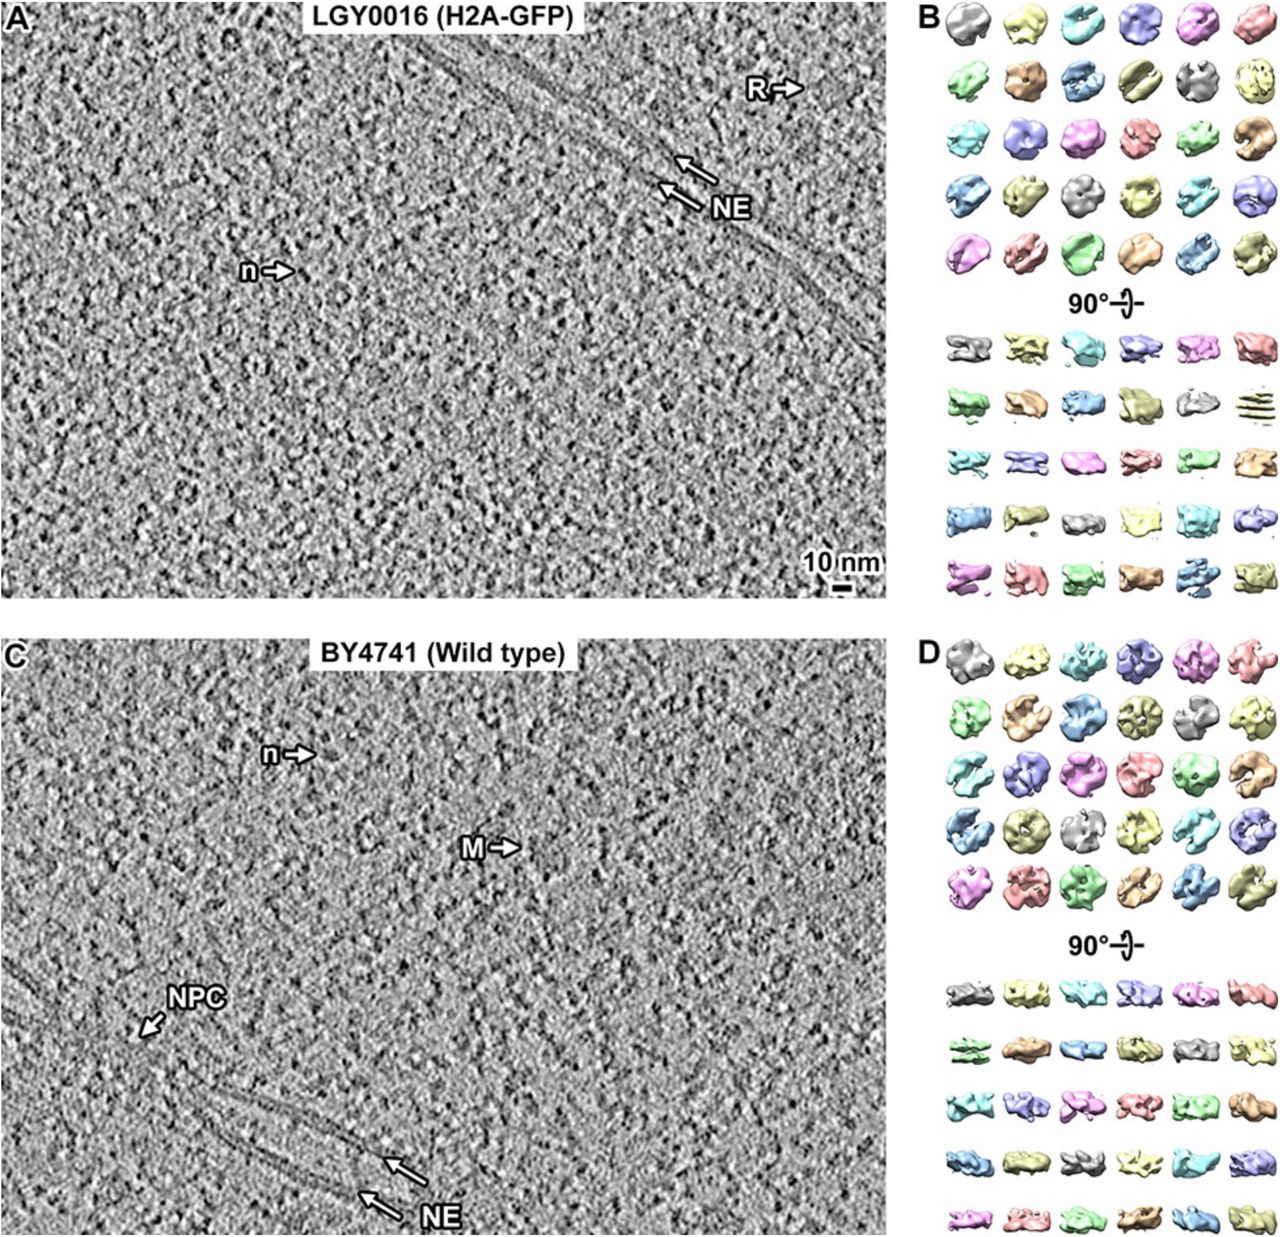
Tomographic slices (12 nm) of cryolamellae of (A) an LGY0016 cell and (C) a BY4741 cell. Cytological example features are indicated: (n) a nucleosome-like particle, (NE) nuclear envelope, (R) ribosome, (M) nuclear megacomplex, and (NPC) nuclear pore complex. (B, D) 3-D class averages of nucleosome-like particles in LGY0016 and BY4741 cells, respectively. See Movie S3 and Movie S4 for more details of LGY0016 and BY4741 in situ class-average convergence, respectively.
To determine if our template-matching and classification workflow missed the canonical nucleosomes, we re-did both template matching and 3-D classification of BY4741 wild-type yeast lamellae with intentionally biased references. Instead of a featureless cylinder, we used the yeast nucleosome crystal structure [25] as the reference (Figure S8A). If canonical nucleosomes are abundant in yeast, they should be detected as a class average that resembles a low-resolution nucleosome crystal structure. No canonical nucleosome class averages were seen in this control experiment (Figure S8B, C; Movie S5). We therefore conclude that canonical nucleosomes are rare inside budding yeast nuclei and that non-canonical nucleosomes are the vast majority.
Unlike the nucleosomes class averages in lysates (Figures S4A and S5A) and HeLa cell cryolamellae [8], the in situ yeast nucleosome class averages do not have any densities that correspond to linker DNA or detached core DNA (Figure 4, B and 4D). Naked DNA densities are present only if the individual nucleosomes in the class average have similar DNA conformations. Therefore, yeast nucleosomes in situ have highly variable linker DNA conformations, meaning that the non-canonical nucleosomes are also heterogeneous.
Discussion
Cryo-EM of cells has made feasible the structural analysis of chromatin organization in situ. The earliest in situ studies were done with projection cryo-EM images and 2-D Fourier analysis of cryosectioned cells, which revealed that long-range order is absent in chromatin in situ [26, 27]. Cryo-ET studies later showed that long-range order is present in isolated chicken erythrocyte nuclei [28], but absent in picoplankton and budding yeast [15, 29]. These early cryo-ET studies revealed little about nucleosome structure in situ because, as Eltsov et al observed, the nucleosomes in those samples appeared like smooth ellipsoids [30]. Recent cryo-ET studies using state-of-the-art electron-counting cameras and energy filters have revealed that in cryotomographic slices of cells, there are nuclear densities that resemble nucleosome side views in which gyre-like densities are resolved [6, 8, 30]. This better data made it possible to use 3-D classification to detect canonical nucleosomes in nuclear envelope-associated chromatin in a HeLa cell [8].
We combined protein-tagging and subtomogram-averaging [9, 10] with 3-D classification to identify canonical nucleosomes, both tagged and untagged with GFP, in nuclear lysates. In contrast, none of the 3-D class averages from cryosectioned or cryo-FIB-milled cells resembled the canonical nucleosome, namely a cylindrical body with 1.65 DNA gyre densities. Canonical nucleosome class averages were absent even when we intentionally model-biased the template matching and 3-D classification analyses with the nucleosome crystal structure as the reference. Altogether, our experiments show that in budding yeast, canonical nucleosomes are present in vitro but extremely rare in situ. These contrasting results are consistent with the idea that the nucleosome ‘ground state’ – as would be found in a lysate – has a canonical conformation, and that the intracellular environment is not conducive to this ground state.
The absence of a canonical nucleosome-like class average that has an extra density bump in the LGY0016 strain suggests that the H2A-H2B heterodimer is mobile in situ. H2A-H2B mobility was hinted at by the observation from X-ray crystallography that yeast nucleosomes lack the hydrogen bonds that stabilize the two H2A-H2B heterodimers in metazoan nucleosomes [25]. The mobility of histone H2A-H2B dimer would cause a large stretch of the DNA to be absent in class averages. Our data is consistent with a model in which yeast nucleosomes adopt multiple non-canonical conformations in situ (Figure 5A, B). The H2A/H2B dimers are probably attached to the H3/H4 heterotetramer because crosslinking and single-particle fluorescence imaging experiments showed that approximately 80% of H2B – and presumably H2A to which it stably dimerizes – is bound to chromatin in situ [31, 32] and because interfaces between H2A-H2B and H3 are moderately exposed to small-molecule probes [33]. In addition to H2A-H2B dimers and DNA adopting multiple conformations, nucleosome-associated proteins that bind to multiple positions (Figure 5C) would further increase the heterogeneity. A high abundance of non-canonical nucleosomes means that more of the genome would be accessible, consistent with yeast having high levels of transcription. Nucleosome heterogeneity is also consistent with the absence of chromatin long-range order in situ because crystalline oligonucleosome arrays can only form if sequential nucleosomes adopt nearly identical conformations [34-36]. Further investigation is needed to identify the biochemical or biophysical factors responsible for the presence of non-canonical nucleosomes in yeast and to determine their diverse structures [2].

Schematics of DNA (light-blue) and histones (shaded pie slices) in the nucleosome disc view. (A) Canonical nucleosome, in which all the histones and 147 bp of DNA are part of an ordered complex. (B) Nucleosome with alternative histone H2A-H2B (yellow, red) conformations and partially dissociated DNA. (C) Nucleosome bound to non-histone proteins (gray). The blurred gray box represents different proteins that can bind, thereby contributing to constitutional heterogeneity. The blurred appearance represents a large range of positions and orientations that protein and DNA components adopt inside cells, which would result in the absence of a class average resembling a canonical nucleosome or having naked DNA densities.
Our in situ cryo-ET-based model adds to the body of work on non-canonical nucleosomes. ChIP-seq analysis has detected sub-nucleosome particles in situ, though the abundance was unknown [37]. A recent Hi-C variant “Hi-CO” presented evidence that < 147 bp of yeast nucleosomal DNA is protected from MNase attack [38], which is consistent with the partial detachment of core DNA. Nucleosomes that have non-canonical nucleosome properties, such as lower stability or exposure of internal surfaces, have been reported in fission yeast [39, 40], which may explain why we did not observe canonical nucleosomes in cryosections in those cells either [6]. Some nucleosomes in human and fly cell cryosections appear “gaping”, i.e., with the inter-DNA-gyre distance slightly larger than ∼ 2.7 nm [30]. Partial DNA detachment has been seen in complexes between nucleosomes and remodelers and transcription factors [41-46], methyltransferases [47, 48], or transcription-related complexes [49, 50]. Larger amounts (up to ∼ 25 bp) of DNA detachment has been seen very rarely in cryo-EM structures [51, 52]. The prevalence and functional consequences of non-canonical nucleosomes remain to be studied in other organisms.
Materials and Methods
Cell culture and strain construction
The strain details are shown in Table S1. Primers were ordered from IDT (Integrated DNA Technologies, Inc., Singapore) and listed in Table S2. BY4741 [53] served as the wild-type strain. Deletion and tagging cassettes were amplified from plasmids pFA6a plasmids [54, 55]. pFA6a-GFP(S65T)-His3MX6 was a gift from John Pringle (Addgene 41598; Addgene, Watertown, MA) and pFA6a-link-yoTagRFP-T-Kan was a gift from Wendell Lim & Kurt Thorn (Addgene 44906). Cells were transformed using the lithium acetate / PEG4000 method reported in [56]. Transformants were validated by PCR and Sanger sequencing (Bio Basic Asia Pacific Pte Ltd, Singapore).
DNA gels and immunoblots
PCR products were electrophoresed in 2% agarose in Tris-acetate-EDTA and visualized with FloroSafe DNA Stain (Axil Scientific Pte Ltd, Singapore). The electrophoresis was performed at 100 V for 80 minutes before visualization with a G:Box (Syngene).
To generate protein samples for immunoblot analysis, ∼ 20 OD600 units of yeast cells were pelleted and stored at −80°C for at least 1 hour. Cells were then resuspended in 200 µL of ice-cold 20% trichloroacetic acid (TCA) and vortexed with glass beads at 4°C for 1 minute 4 times. For each sample, 500 µL of ice-cold 5% TCA was added, mixed with the pellet, then transferred to a new 1.5 mL collection tube. Another 500 µL of ice-cold 5% TCA was mixed with each pellet and transferred to the same 1.5 mL collection tube as before, so that each collection tube had 1 mL total volume. The tubes were then left on ice for 10 minutes and centrifuged at 15,000 × g at 4°C for 20 minutes. The TCA was aspirated from the tube, then the pellet was resuspended in 212 µL of Laemmli sample buffer with 2-mercaptoethanol added (Bio-Rad, Hercules, CA). To neutralize the residual TCA, 26 µL of 1 M Tris, pH 8 was added. This mixture was heated at 95°C for 5 minutes, centrifuged at 25°C at 15,000 × g for 10 minutes, then 5 µL of the supernatant was subjected to SDS-PAGE.
The primary and secondary antibodies used for immunoblots are shown in Table S3. 10% Mini-PROTEAN® TGX(tm) Precast Protein Gels (Bio-Rad) were used, with Precision Plus Protein(tm) WesternC(tm) Standards (Bio-Rad) used as the ladder. The proteins were electrophoresed at 100 V for 1 hour at 25°C. The gels were transferred onto Immun-Blot® PVDF Membranes (Bio-Rad) at 4°C in transfer buffer (3.02 g/L tris, 14.4 g/L glycine, 20% methanol). The transfer was performed at 100 V for 30 minutes. The membranes were then blocked with 2% BSA in 1× Tris-Buffered Saline, 0.1% Tween® 20 Detergent (TBST) for 1 hour, followed by 50 µg/mL avidin in TBST for 30 minutes. All antibody dilution factors are reported in Table S3. The membranes were washed with TBST for 20 minutes and then were probed with primary antibodies at the stated dilutions in 2% BSA in TBST for 1 hour at 25°C. Membranes were washed with TBST for 20 minutes twice at 25°C, then overnight at 25°C. The membranes were then probed with secondary antibodies plus Precision Protein(tm) StrepTactin-HRP Conjugate (Bio-Rad) at 1:10,000 dilution in 2% BSA in TBST for 1 hour. Finally, the membranes were washed with TBST for 10 minutes 3 times, then treated with a 50:50 mixture of Clarity Western Peroxide Reagent and Clarity Western Luminol/Enhancer Reagent (Bio-Rad) for 5 minutes before visualization by chemiluminescence on an ImageQuant LAS 4000 (Cytiva, Marlborough, MA).
Fluorescence microscopy
Cells were grown to log phase (OD600 = 0.1 – 1.0), of which 2 OD600 units of cells were collected, pelleted at 5,000 × g for 1 min, then resuspended in 1 mL of YES. 4 µL of cell culture was then applied to a glass slide and pressed against a coverslip. The cells were imaged live at 23°C with an Olympus FV3000 Confocal Laser Scanning Microscope (Olympus, Tokyo, Japan) equipped with a 1.35 NA 60× oil-immersion objective lens. GFP fluorescence was acquired using the 488 nm laser-line, with a DIC image recorded in parallel with the fluorescence image. Images were captured as Z-stacks thick enough to sample the GFP signals through all the nuclei in each stage position. Additional details regarding data collection are shown in Table S4.
Preparation of nuclear lysates
Yeast nuclei were prepared with reagents from the Yeast nuclei isolation kit (Abcam 206997, Cambridge, United Kingdom), unless noted otherwise. Yeast cells (30 mL, OD600 ∼ 1) were pelleted at 3,000 × g for 5 minutes at 25°C. The pellet was washed twice with 1 mL water (3,000 × g, 1 minute). The pellet was then resuspended in 1 mL Buffer A (pre-warmed to 30°C) containing 10 mM dithiothreitol. The suspension was incubated in a 30°C water bath for 10 minutes. Cells were then pelleted at 1,500 × g for 5 minutes and then resuspended in 1 mL Buffer B (prewarmed to 30°C) containing lysis enzyme cocktail (1:1,000 dilution). The suspension was incubated in a 30°C shaker for 15 minutes for cell-wall digestion and then pelleted at 1,500 × g for 5 minutes at 4°C. The pellet was resuspended in 1 mL pre-chilled Buffer C with protease inhibitor cocktail (1:1,000 dilution). The cells were lysed by 15 up-and-down strokes with a pre-chilled glass Dounce homogenizer on ice. The lysate was incubated with shaking for 30 minutes at 25°C. The cell debris was pelleted at 500 × g for 5 minutes at 4°C. The supernatant was then transferred to a new tube. The nuclei were pelleted at 20,000 × g for 10 minutes at 4°C. The nuclear pellet was resuspended in 10 – 20 µL pre-chilled lysis buffer (50 mM EDTA and 1:1,000 protease inhibitor cocktail dilution) and incubated for 15 minutes on ice.
Nuclei lysates (3 µL) were added to a glow-discharged CF-4/2-2C-T grid (Protochips, Morrisville, NC). The grid was plunge-frozen using a Vitrobot Mark IV (blot time: 1 second, blot force: 1, humidity: 100%, temperature: 4°C).
Preparation of cryosections
Self-pressurized freezing was done based on a modified version of a published protocol [57]. Yeast cells (30 mL, OD600 = 0.2 – 0.6) were pelleted and resuspended in a dextran stock (40 kDa, 60% w/v, in YPD) to a final concentration of 30%. Cells were then loaded into a copper tube (0.45 / 0.3 mm outer / inner diameters). Both ends of the tube were sealed with flat-jaw pliers. The tube was held horizontally and dropped into the liquid-ethane cryogen. The tube’s ends were removed under liquid nitrogen with a tube-cut tool (Engineering Office M. Wohlwend, Sennwald, Switzerland).
Gold colloid solution (10-nm diameter, 5 µL at 5.7 x10¹² particles/mL in 0.1 mg/mL BSA) was applied to a continuous-carbon grid and then air-dried overnight. Cryosections were controlled by a custom joystick-based micromanipulator (MN-151S, Narishige Co., Ltd., Tokyo, Japan) [15, 58]. 70 nm-thick frozen-hydrated sections were cut at −150°C in a Leica UC7/ FC7 cryo-ultramicrotome (Leica Microsystems, Vienna, Austria). The EM grid was positioned underneath the r ibbon using a Leica micromanipulator [59]. The cryosection ribbon (∼ 3 mm long) was then attached to the grid by operating the Crion (Leica Microsystems) in “charge” mode for ∼ 30 seconds [60].
Preparation of cryolamellae
Cells were plunge-frozen and then cryo-FIB milled following the method of Medeiros and Bock [24] as follows. Immediately before plunge-freezing, mid-log phase (OD600 ∼ 0.6) yeast cells were pelleted at 4,000 × g for 5 minutes. They were then resuspended in YPD media containing 3% (v/v) DMSO as cryo-protectant to a final OD600 of approximately 2.5. 4 µL of the cells were subsequently deposited onto Quantifoil R2/4 200 mesh copper grids (Quantifoil Micro Tools GmbH, Jena, Germany), which were then manually blotted from the back with Whatman® Grade 1 filter paper for approximately 3–5 seconds. The grids were then plunged into a 63/37 propane/ethane mixture [61] using a Vitrobot Mark IV (humidity: 100%, temperature: 22°C). Cryo-FIB milling was performed on a Helios NanoLab 600 DualBeam (Thermo Fisher Scientific, TFS, Waltham, MA) equipped with a Quorum PolarPrep 2000 transfer system (Quorum Technologies, Laughton, United Kingdom). Plunge-frozen yeast samples were coated with a layer of organometallic platinum using the in-chamber gas injection system using the cold-deposition method [20]. Cryolamellae were then generated as follows: bulk material was first removed using the FIB at 30 kV 2.8 nA, followed by successive thinning of the lamellae at lower currents of 0.28 nA and 48 pA.
Cryo-ET data collection and reconstruction
All cryo-ET data were collected on Titan Krioses (TFS). Tilt series were collected with either TFS Tomo4, Leginon [62], or SerialEM [63]. Images were recorded either on a Falcon II (TFS) in integration mode or as movie frames on a K2 or K3 summit camera (Gatan, Pleasanton, CA) in super-resolution mode. Movies were aligned with either MotionCor2 [64] or IMOD alignframes [65]. Prior to starting data collection of cryolamellae, the stage was pre-tilted to either −10° or −15° to account for the milling angle. Additional data-collection details are shown in Table S5.
Cryotomograms were reconstructed using IMOD’s eTomo workflow [65]. Tilt series of lysates and cryosections were aligned using the gold beads as fiducials while those of cryolamellae were aligned with patches as fiducials. For cryolamella patch tracking, tilt series were binned to a pixel size of 6.8 Å, the “Break contours into pieces w/ overlap” was set to 10, and the low-frequency rolloff sigma and cutoff radius were set to 0.03 and 0.1 pixel−1, respectively. CTF estimation and phase flipping were done on the defocus phase contrast datasets using IMOD’s ctfplotter and ctfphaseflip programs. Prior to reconstruction, the cryosection and cryolamellae tilt series were binned to a final pixel size of 6.8 Å using the antialiasing option. For visualization purposes, the tilt series were low-pass filtered to attenuate spatial frequencies beyond 25 Å to 30 Å resolution, prior to tomogram reconstruction. For classification analysis, the tilt series were low-pass filtered with a Gaussian rolloff starting at 15 Å resolution for lysates and 20 Å for cryosections and cryolamellae. More details of the datasets analyzed in this paper are shown in Table S6.
Nucleosome template matching and subtomogram averaging
A featureless round-edged 10 nm-diameter, 6 nm-thick cylindrical template was created using the Bsoft program beditimg [66]. A cubic search grid with a 12-nm spacing was created with the PEET program gridInit [67]. Template matching was done using PEET [67, 68], with a duplicate-removal cutoff distance of 6 nm. To accelerate the runs, no orientation search was done around the cylindrical axis and the resolution was attenuated starting at 70 Å on account of the smooth appearance of the template. Candidate hit lists of different cross-correlation cutoffs were generated using the PEET program createAlignedModel, then visualized together with the tomograms in 3dmod.
Classification and subtomogram analysis were done with RELION [69, 70], following the schemes in Figure S2. In the published workflow [13], each subtomogram is first averaged by projecting the entire volume (16 nm along the Z axis), which introduces contributions from particles above and below the nucleosome. To minimize the influence of other particles, pseudo-projections were created by averaging ∼ 12 nm along the Z axis, using the ot_relion_project.py script. 2-D classification using mask diameters ranging from 120 Å to 140 Å produced clear nucleosome-like classes, though the smaller masks included fewer adjacent particle densities. Particles that belonged to the most nucleosome-like classes were exported for 3-D classification, split into 10 - 20 classes using data to 20 Å resolution. To eliminate the influence of adjacent particles, a smooth cylindrical mask with a cosine-shaped edge was applied. The mask was created using beditimg and relion_mask_create. Because the GFP densities protrude from the nucleosome surface, we used a 9 nm-tall cylindrical mask.
As observed in our previous study [8], many nucleosomes were lost in the 2-D classification process. We therefore used the alternative workflow in which the template matching hits were directly classified in 3-D. To accommodate the increased diversity of particles (some of which would have been removed had 2-D classification been done), we used 30 - 50 classes instead of the usual 10 - 20. The direct 3-D classification runs crashed frequently, probably because the RELION memory usage scales up with the number of classes [70]. We were able to eliminate the crash problem by using higher-memory GPUs or by decreasing the number of translational search steps from 5 to 3 or 4. The canonical nucleosome classes from the lysates (with and without the GFP density) were subjected to “Gold-standard” 3-D refinement. No map sharpening was applied. Subtomogram class-average volumes were visualized with UCSF Chimera [71].
Biased-reference classification control
A 14 Å-resolution density map was simulated from the yeast nucleosome crystal structure PDB 1ID3 [25] using the Bsoft program bgex. To account for the artifacts associated with defocus phase contrast and CTF correction, a 6 µm underfocus was applied and then “corrected” for using the Bsoft program bctf. The map was also subjected to the 20 Å-resolution low-pass filter that was used on the tilt series using the IMOD program mtffilter. Template matching was done using this map, but using data to higher resolution (28 Å) than that for the less-biased search above and including a search around all Euler angles. The hits were subjected to 2-D classification to remove obvious non-nucleosomal particles. Next, the hits were 3-D classified using the simulated map as an initial alignment reference. To maximize the model bias, the template was only low-pass filtered to 20 Å-resolution instead of the recommended 60 Å [13].
Data sharing
A subtomogram average of a double-GFP tagged LGY0016 nucleosome from Figure 2C has been deposited at EMDB as entry EMD-31086. The raw cryo-ET data, reconstructed tomograms presented in Table S6, and the class averages from Figures 2 – 4, S4B, and S5B have been deposited in EMPIAR under entry EMPIAR-10678.
Author Contributions and Notes
SC, ZYT, AJN, JKC, LG - project design, experiments, writing; JS, LG - training. The authors declare no conflict of interest. This article contains supplemental information online.

(A) Maps of the two H2A-H2B loci in the background (wild-type) strain BY4741 and the H2A-GFP strain LGY0016. Primers used for PCR verification are indicated with the half arrow symbols. (B) Agarose gel of PCR amplicons expected (or not) from LGY0016 genomic DNA, in which the HTB2-HTA2 locus is deleted and the HTA1 locus is tagged with GFP. (C) Immunoblot analysis of strains LGY0016 (expresses H2A-GFP only) and LGY0012 (expresses H2A only, control). The α-GFP antibody correctly detected the large H2A-GFP fusion protein in LGY0016 (lane 4) but not in LGY0012 (lane 3, negative control). The α-H2A antibody detected H2A-GFP in LGY0016 and H2A in LGY0012. (D) DIC and GFP fluorescence confocal microscopy for LGY0016 cells. GFP signals are rendered with inverted contrast. (E) Map of the HTA1-HTB1 locus before (upper) and after (lower) the GFP insertion, with validation primers indicated. The color scheme is the same as in panel A. Note that LGY0015 still has the HTA2-HTB2 gene pair and therefore expresses untagged H2B. (F) Validation PCR for LG0015. (G) Validation immunoblots for strains BY4741 (wild type) and LGY0015 (expresses H2B and H2B-GFP). The α-GFP detected a ∼ 40 kDa protein (H2B-GFP) in LGY0015 but not BY4741. The α-H2B antibody detects the 40 kDa (H2B-GFP) in LGY0015 but not BY4741. Note that the α-H2B antibody has poorer specificity and does not generate a strong signal for the untagged H2B. (H) DIC and GFP fluorescence micrographs of LGY0015 cells. The GFP signals are rendered in inverted contrast.
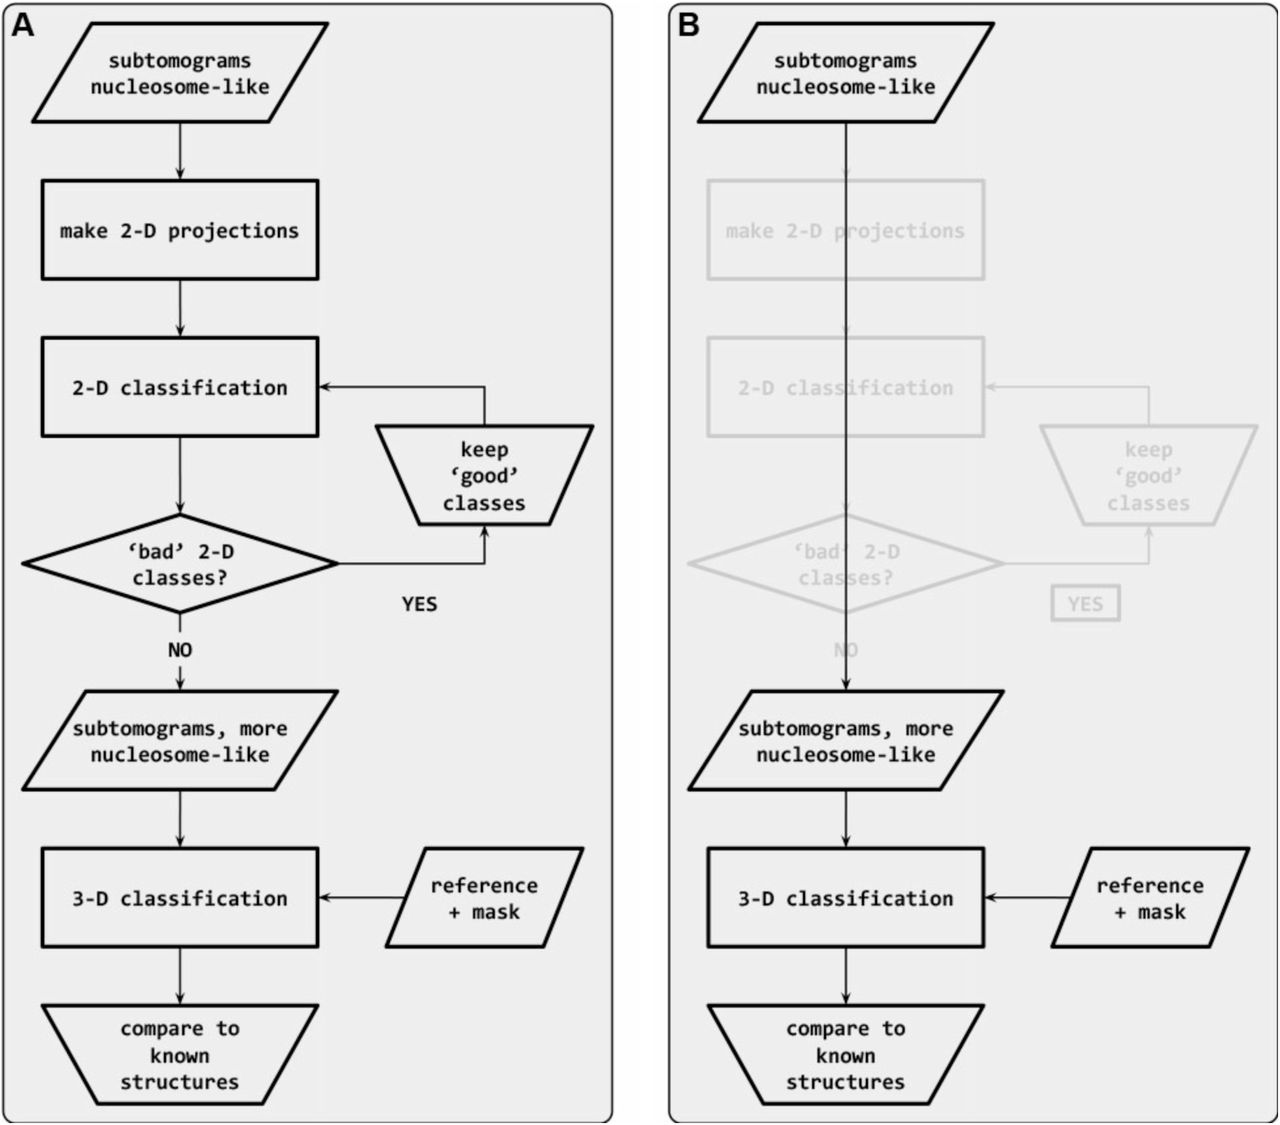
Classification starts with subtomograms that contain nucleosome-like particles, template matched in PEET [7]. (A) In the workflow recommended by Bharat [73], the subtomograms are first subjected to sequential rounds of 2-D classification to remove particles that belong to ‘bad’ classes. Once the bad classes are removed, the remaining set is subjected to 3-D classification. (B) In an alternative workflow, the subtomograms are subjected directly to 3-D classification. The 2-D classification steps (greyed out) are bypassed.

(A) Cryotomographic slice (12 nm) of lysed LGY0015 nuclei. (B) 2-D class averages of nucleosome-like particles. Scale bar, 10 nm. (C) 3-D class averages of two types of LGY0015 nucleosomes. The solid arrowhead indicates the position of the GFP tag whereas the open arrowheads indicate the positions that lack this density. (D) Two views of the nucleosome crystal structure, indicating the location of the H2B C-terminus (salmon).

(A) Class averages of nucleosome-like particles from nuclear lysates of LGY0016 cells. The canonical nucleosome-like class averages are shaded blue while the non-canonical nucleosome averages are shaded gray. Movie S1 shows the convergence of the classification and shows more views of these class averages. (B) The second round of 3-D classification, using the canonical-nucleosomes from panel A. See Movie S2 for more details of this classification run.

(A) Class averages of nucleosome-like particles from nuclear lysates of LGY0015 cells. The canonical nucleosome class averages are shaded blue while the non-canonical nucleosome averages are shaded gray. (C) The second round of 3-D classification, using the canonical nucleosomes from panel A. Note that some class averages, such as the gray one, have a density that is not connected to the nucleosome. This density is from a nearby particle that protruded into the mask.
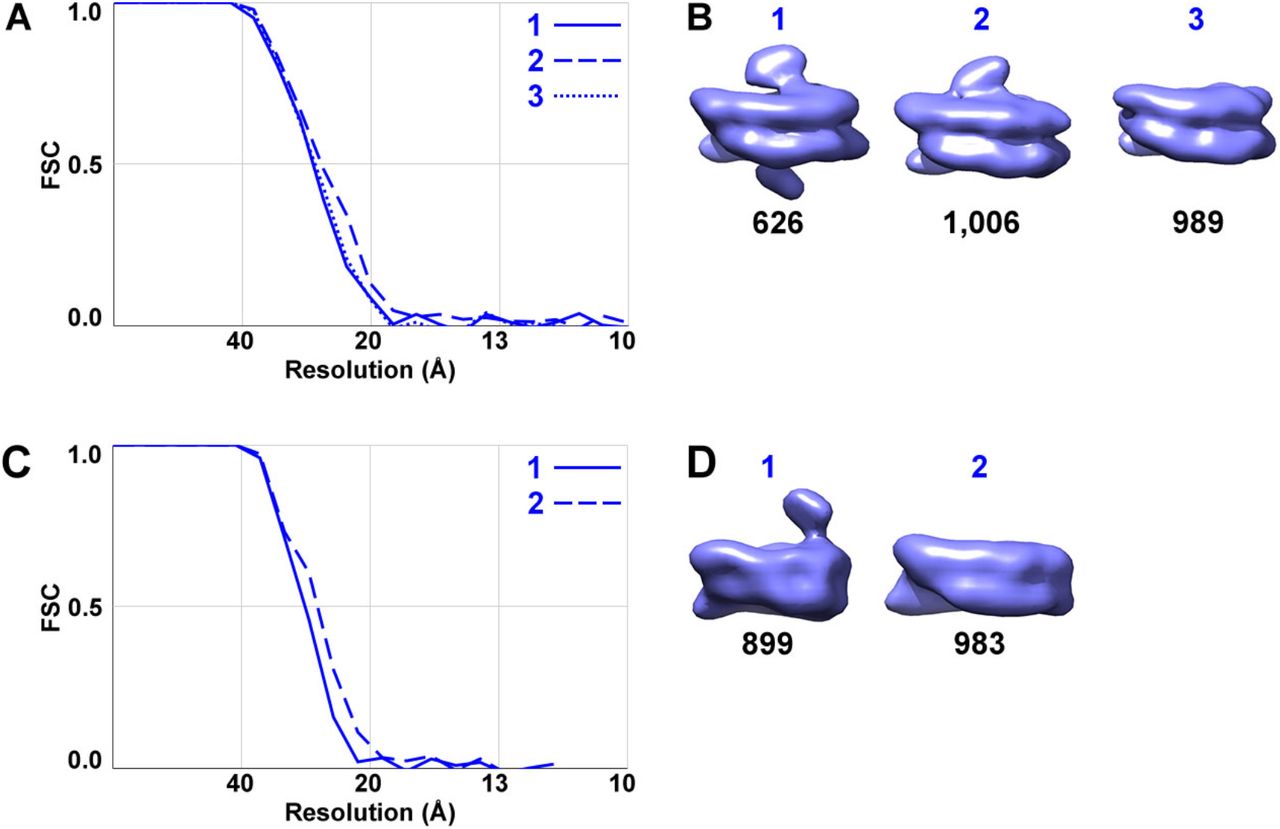
(A) Fourier shell correlation (FSC) plot of the LGY0016 nuclear-lysate nucleosome class averages in panel B, labeled with the same numbering scheme. The resolution is ∼ 26 Å by the FSC = 0.5 criterion. (B) Three types of LGY0016 nucleosomes isolated from nuclear lysates; reproduced from Fig. 2C. The class number is labeled in blue, corresponding to the curves in panel A while the number of particles per class are labeled in black. (C) FSC plot of the LGY0015 nuclear lysates nucleosome class averages in panel D, using the same numbering scheme. The resolution is ∼ 26 Å by the FSC = 0.5 criterion. (D) Two types of LGY0015 nucleosomes isolated from nuclear lysates; reproduced from Fig. S4B. The labels are in the same style as in panel B.
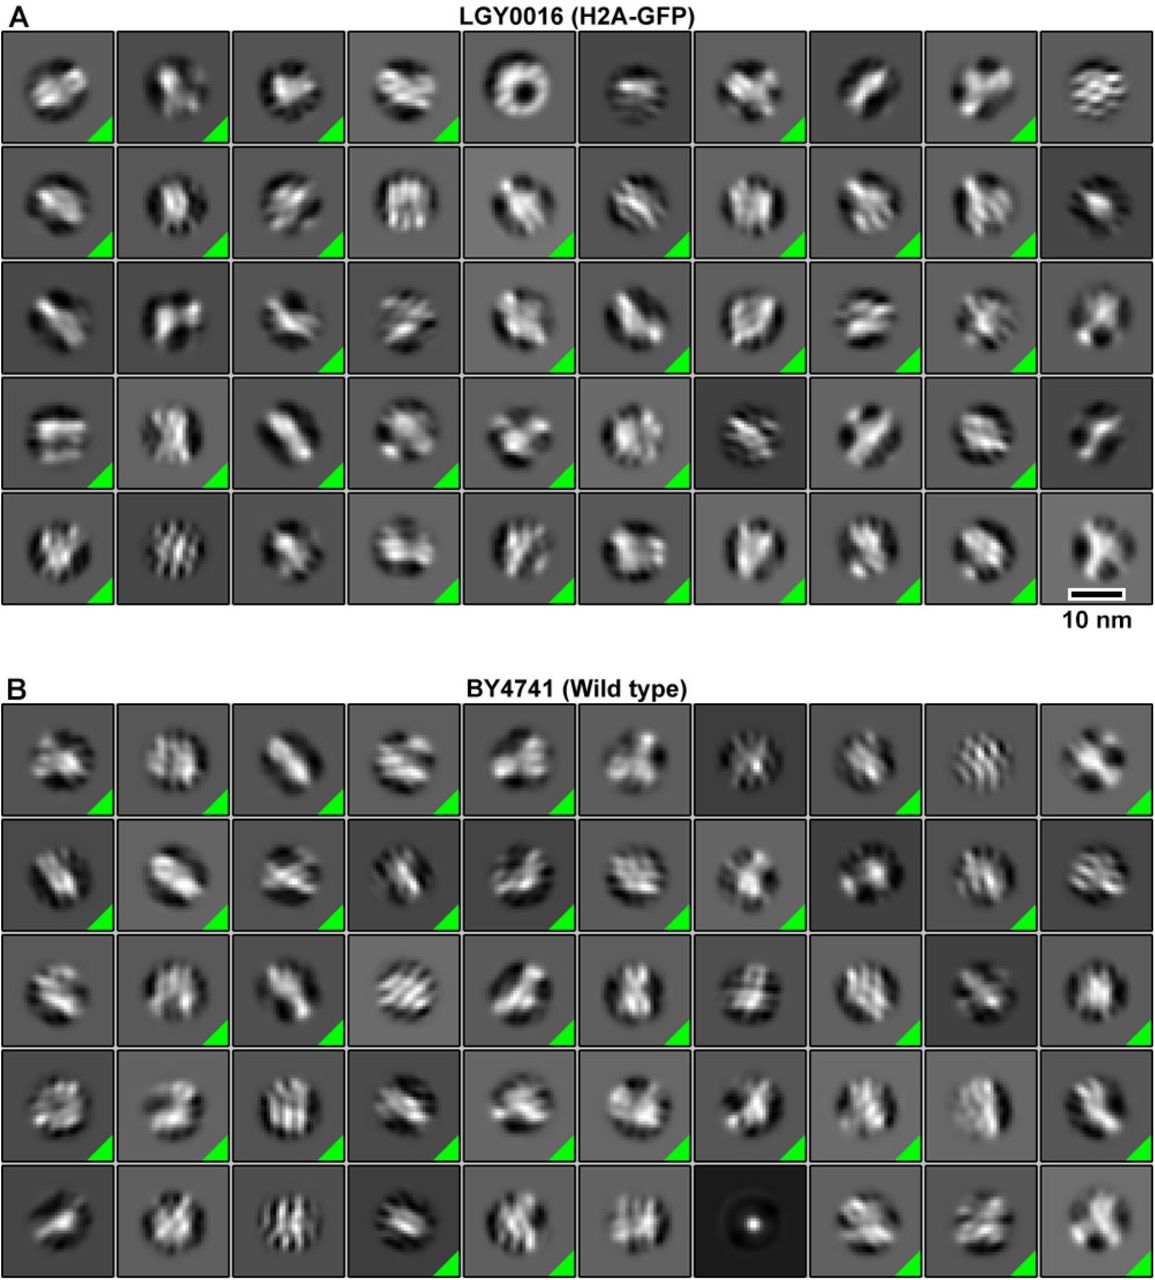
Class averages of template-matched nucleosome-like particles in (A) LGY0016 and (B) BY4741 cells. The class averages whose member particles were selected for additional rounds of classification are indicated by a green triangle in the box’s lower right corner.

(A) A featureless cylinder (left) and a simulated EM map from a crystal structure of the nucleosome (right). (B) Class averages (2-D) of BY4741 (wild type) nucleosome-like particles that were template matched using the nucleosome crystal structure. Classes that were pooled for 3-D classification are indicated by a green triangle in the lower right corner of its box. Scale bar, 10 nm. (C) Class averages (3-D) of the most nucleosome-like particles selected by 2-D classification. The classification was performed using the same dataset as for Figure 4D. Movie S5 shows the progress of this classification, like in the other movies.
Movie S1. 3-D classification of LGY0016 lysate nucleosomes, round 1. The progress of 30 rounds of 3-D classification is shown. There are 40 classes, initialized with a smooth nucleosome-sized cylindrical reference. The final iteration (30) is also shown in Figure. S4, with only the most nucleosome-like classes shaded.
Movie S2. 3-D classification of LGY0016 lysate nucleosomes, round 2. The most nucleosome-like classes from round 1 were selected and subjected to a second round of classification, with 10 classes, again initialized with a smooth nucleosome-sized cylindrical reference. Two “junk” classes were removed.
Movie S3. 3-D classification of LGY0016 nucleosome-like particles inside cells. 3-D classification analysis of LGY0016 (H2A-GFP) nucleosome-like particles from cryolamellae. The initial reference is a featureless cylinder.
Movie S4. 3-D classification of BY4741 nucleosome-like particles inside cells. 3-D classification analysis of BY4741 (Wild-type H2A) nucleosome-like particles from cryolamellae. The initial reference is a featureless cylinder.
Movie S5. 3-D classification of BY4741 nucleosome-like particles inside cells, biased by the canonical nucleosome crystal structure reference. 3-D classification analysis of BY4741 (Wild-type H2A) nucleosome-like particles from cryolamellae. The initial reference is a density map simulated from the nucleosome crystal structure.
Acknowledgments
We thank Kerry Bloom, Vu Nguyen, and Carl Wu for advice on fluorescent-protein tagging of histones; Bill Rice and Ed Eng for help with cryo-EM data collection; John Heumann for discussions about PEET and for implementing a parallelized duplicate-removal routine. The Quadro P6000 used in this work was kindly donated by the NVIDIA Corporation. ZYT, SC, JKC, and LG were supported by a Singapore Ministry of Education Tier 1 grant R-154-000-A49-114 and Tier 2 grant MOE2019-T2-1-140. AJN was supported by a grant from the NIH National Institute of General Medical Sciences (NIGMS) (F32GM128303). Some of this work was performed at the Simons Electron Microscopy Center and National Resource for Automated Molecular Microscopy located at the New York Structural Biology Center, supported by grants from the Simons Foundation (SF349247), NYSTAR, and the NIH National Institute of General Medical Sciences (GM103310) with additional support from NIH S10 RR029300.


