

Abstract
Phagosome maturation, in which ingested pathogens are degraded through a complex sequence of biochemical changes, is an essential process in infection control and tissue homeostasis. The maturation of phagosomes requires their intracellular transport. However, mechanisms underlying this dynamical-biochemical interdependence is poorly understood due to the lack of methods to independently manipulate either process. Here we present a study to magnetically manipulate the transport of single phagosomes and simultaneously measure their maturation and degradative functions. We reveal that the transport velocity of phagosomes acts as a maturation clock to regulate the timing of biochemical signaling activities in phagosomes. We show that velocity of phagosomes on microtubules determines their rate of fusion with lysosomes and consequently the rate of lumen acidification, following a linear relationship. Meanwhile, the timing of phagosome transport from actin cortex to microtubules controls the kinetics of early phagosome assembly and rate of transition to late phagosomes.
Introduction
Phagocytes of the innate immune system engulf and degrade pathogens through a sequence of dynamic biochemical events in phagocytosis. After recognizing ligands on the pathogen, immune cells internalize pathogens into vacuoles called phagosomes and transport them along actin filaments and microtubules from the periphery of the cell to the perinuclear region (Al-Haddad et al., 2001; Araki, 2006; Gibbs, Kitamoto, & Williams, 2003; Granger, McNee, Allan, & Woodman, 2014; Harrison & Grinstein, 2002; Hewage & Altman, 2018; M. Jiang et al., 2015; Kapitein et al., 2013; Kelleher & Titus, 1998; Oberhofer et al., 2020; Schroeder, Mitchell, Shuman, Holzbaur, & Goldman, 2010). In the course of this intracellular transport, phagosomes degrade the pathogens trapped in their lumens through a cascade of biochemical transformations, including the acidification of the lumen (Steinberg, Huynh, & Grinstein, 2007), the activation of hydrolytic enzymes for pathogen digestion (Lennon-Duménil et al., 2002), and the generation of reactive oxygen species (ROS) (Rybicka, Balce, Chaudhuri, Allan, & Yates, 2012). This process is known as phagosome maturation. Many pathogens, such as the bacterium Legionella pneumophila, specifically hijack the intracellular trafficking process to alter the degradative function of phagosomes and thus evade immune clearance (Cossart & Helenius, 2014; Kagan & Roy, 2002; Smith & May, 2013). These examples provide evidence that the effective degradation of pathogens relies on the orchestration of the dynamics and biochemical signaling of phagosomes during maturation. However, mechanisms underlying this dynamical-biochemical interdependence are poorly understood.
So far, studies have been mostly limited to establishing the notion that the actin- and microtubule-based transport of phagosomes is required for their fusion with endolysosomes, a key step in maturation. As with endosomes, nascent phagosomes, once formed at the cell periphery, first encounter the actin cortex (Al-Haddad et al., 2001; Araki, 2006; Gibbs et al., 2004; Gibbs et al., 2003; Granger et al., 2014; Harrison & Grinstein, 2002; Hewage & Altman, 2018; M. Jiang et al., 2015; Kapitein et al., 2013; Kelleher & Titus, 1998). During phagosomal biogenesis, nascent phagosomes continuously fuse with endosomes. This fusion is facilitated by proteins including small GTPase Rab5 and phosphatidylinositol 3-monophosphate (PI3P) (Chua & Deretic, 2004; Duclos et al., 2000; Feliciano, Yoshida, Straight, & Swanson, 2011; Jeschke & Haas, 2018; Kitano, Nakaya, Nakamura, Nagata, & Matsuda, 2008). Phagosome-endosome fusion was found to be attenuated by the disruption of actin or the inhibition of myosin (Arora, Manolson, Downey, Sodek, & McCulloch, 2000; Gibbs et al., 2003; Guerin & de Chastellier, 2000). While this indicates that actin-based transport is involved in phagosome-endosome fusion, the exact roles of actin in phagosome maturation are largely unknown. After passing through the actin cortex near the cell periphery, phagosomes are then transported in a bi-directional motion along microtubules (Blocker et al., 1997). During this microtubule-based transport process, phagosomes fuse with lysosomes to acquire copies of the vacuolar ATPase (V-ATPase), which drives the acidification of phagosomal lumen (Sun-Wada, Tabata, Kawamura, Aoyama, & Wada, 2009). As early phagosome markers dissociate from the membrane, phagosomes also acquire Rab7, lysosome-associated membrane glycoproteins (LAMPs) and proteolytic enzymes, to transition into late phagosomes and then phagolysosomes for degradation of luminal contents (Kinchen & Ravichandran, 2008). It is believed that microtubule-based transport of phagosomes is required for this process, because microtubule depolymerization leads to a significant decrease in phagosome-lysosome fusion (Funato, Beron, Yang, Mukhopadhyay, & Stahl, 1997), content delivery from late endosomes to phagosomes (Blocker et al., 1996), and acquisition of lysosome markers (Desjardins, Huber, Parton, & Griffiths, 1994). These conclusions, which were mostly drawn from cytoskeletal disruption experiments, established the important view that the intracellular transport of phagosomes is an integral part of their maturation process. However, findings from those studies do not identify the mechanisms by which the transport of phagosomes regulates the biochemical activities during maturation.
During maturation, phagosomes must continuously interact with endolysosomes and other organelles to complete their biogenesis. The dynamics and subcellular localization of phagosomes and endolysosomes are guided by the polarized tracks of actin filaments and microtubules. Therefore, it is reasonable to hypothesize that the transport of phagosomes on actin filaments and microtubules exerts temporal control over the maturation process by delivering phagosomes and other organelles to the right locations at the right times. Testing this hypothesis, however, poses unique challenges. Each phagosome functions as an independent signaling unit that evolves over time at its own rate. The chemical composition of both its membrane and the contents of its lumen change transiently, as does the dynamics of phagosome transport. Precisely because of such challenges, studies so far have relied heavily on approaches involving pharmacological inhibition to confirm the importance of the phagosome transport without pinpointing the specific mechanisms.
In this study, we overcame these challenges by developing particle sensors as phagocytic targets that allowed us to combine magnetic manipulation, biochemical imaging, and dynamic tracking of single phagosomes in living cells. With this integrated approach, we provided direct evidence that the actin- and microtubule-based transport of phagosomes regulates the timing of the maturation process via distinct mechanisms. Specifically, we show that the velocity of microtubule-dependent transport of phagosomes directly regulates the rate of acidification of their lumen by promoting phagosome-lysosome fusion, but it doesn’t influence the final pH of phagosomes. In contrast, we found that the timing of phagosome transport from the actin cortex to the microtubules controls early phagosome assembly and biogenesis, including the transient recruitment of early phagosome markers (Rab5 and PI3P). This determines the fate and kinetics of the entire phagosome maturation. Taken together, our results elucidate the mechanisms governing the orchestration of the dynamical and biochemical signaling processes that occur during phagosome maturation.
Results
Design and characterization of pH-responsive rotational particle sensors (RotSensors)
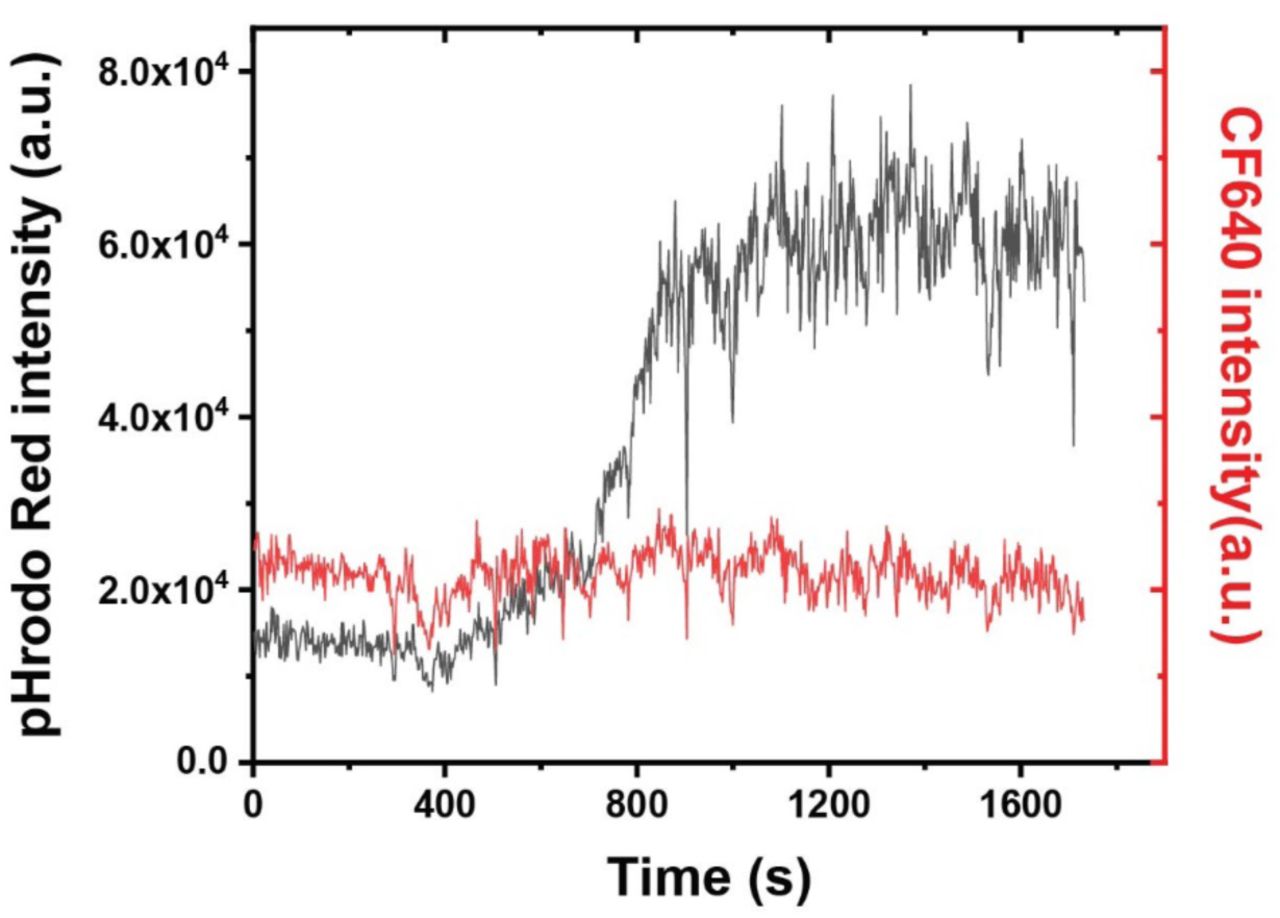
The decrease the pH of the lumen of a phagosome is an early indicator of its maturation and a requisite for many subsequent maturation events, including the activation of degradative enzymes and the production of reactive oxygen species (ROS) (Claus et al., 1998; Savina et al., 2006). Therefore, we first designed pH-responsive RotSensors to simultaneously measure both the acidification of single phagosomes and their intracellular transport dynamics, including both translational and rotational movements (Figure 1A). Each RotSensor consists of a pH-responsive particle of 1 μm in diameter covalently conjugated with a 100 nm fluorescent particle (Figure 1B). The “snowman”-like design allowed us to track both the translational and rotational motion of single phagosomes encapsulating the RotSensors. The centroid position of individual 1 μm particles as a function of time reports the translational motion of single RotSensors. The orientation and projection distance between each pair of particles within a single RotSensor report the azimuthal (φ) and polar (θ) angles, respectively, as previously described (Figure 1B) (Y. Q. Yu, Gao, & Yu, 2018). To report the pH changes of the phagosome lumen, the 1 μm particle in each RotSensor was biotinylated and subsequently conjugated with two types of streptavidin, one type labeled with the pH-indicator pHrodo Red and the other with the reference dye CF640R. The fluorescence emission of pHrodo Red increases significantly as the pH of its surroundings decreases from neutral to acidic (Arppe et al., 2014), making it an ideal indicator for phagosomal pH. CF640R was chosen as a reference dye because it is pH insensitive and photostable (Figure 1—figure supplement 1). We found that streptavidin is critical in the RotSensor design because it acts as a cushion layer to separate the pHrodo Red dye from the particle surface. Without the streptavidin linker, pHrodo Red that was directly conjugated onto the particle surface exhibited little pH sensitivity.

Simultaneous measurement of phagosome transport dynamics and acidification. (A) Schematic illustration of the experimental design. The pH-sensitive rotational particle sensors (RotSensors) were internalized into phagosomes in activated RAW264.7 macrophage cells. (B) Schematic illustration of the design of RotSensors and the principle of single-particle rotational tracking. Each RotSensor contains a 1 µm silica particles tethered with a 100 nm fluorescent particle. The 1 µm silica particles were coated with streptavidin (SAv)-pHrodo Red (pH reporter dye) and SAv-CF640R (reference dye). The RotSensors were opsonized with physically adsorbed immunoglobulin G. The azimuthal (φ) and polar (θ) angles of each RotSensor were analyzed based on its projection fluorescence image. In the schematic, d indicates the projection inter-particle distance, and r indicates the physical inter-particle distance. (C) The trajectory of a representative RotSensor-containing phagosome in a cell. Black line indicates the translational movement of the centroid of the phagosome. Each vector indicates the orientation of the RotSensor pointing from the centroid of the 1 µm particle to that of the 100 nm particle. Vectors are color-coded based on time. Scale bar, 2 µm. (D-G) Fluorescence images and line curves showing acidification and transport dynamics of a representative RotSensor-containing phagosome in a cell. In the top row of fluorescence images in D, the pHrodoRed-functionalized 1 µm particle and its tethered 100 nm yellow-green particle are shown in red and green, respectively. Fluorescence images in the bottom row in D show the pHrodoRed-functionalized 1 µm particle color-coded based on pH. Scale bar, 1 µm. The phagosome pH vs. time plot (E) is fitted with sigmoidal-Boltzmann function (shown as the black solid line) to determine the initial pH, final pH, the period of rapid acidification (tinitialto tfinal), and acidification rate, as indicated by the red dotted line. (F-G) Plots showing the translational and rotational velocities of the phagosome against time, respectively. Darker lines are velocities values after wavelet denoising. (H-I) Scatter plots showing acidification rates against translational and rotational velocities of single phagosomes during rapid acidification period (from tinitial to tfinal). Each data point represents a single phagosome data. Data points from multiple phagosomes within the same cells are shown in the same solid color. Data points from cells containing only one phagosome are shown as black circles. Correlation between the phagosome acidification rate and transport velocities is indicated by the linear regression with a Pearson’s coefficient of 0.78 in (H) and 0.81 in (I).
To quantify the pH response of the RotSensors, we measured the ratio of fluorescence emission intensities of pHrodo Red and of the reference dye CF640R; IpHrodo/Iref, as we varied pH inside phagosomes in living RAW264.7 macrophage cells and in aqueous buffers (Figure 1—figure supplement 2). For both cases, the ratio IpHrodo/Iref of the RotSensors increased linearly as pH decreases, which is consistent with previous reports (Deriy et al., 2009). When performing the pH calibration, we observed that the pH responses of individual RotSensors, including the initial IpHrodo/Iref ratio and slope, vary slightly from one to another. This was likely due to the different amounts of dyes on different particles and the different phagosomal lumen environments (Canton, Khezri, Glogauer, & Grinstein, 2014; Naufer et al., 2018; Nunes, Guido, & Demaurex, 2015; Ogawa et al., 2010). We compensated for the effect of such variation by performing a normalization analysis in all single phagosome pH measurements (details in Materials and Methods section).
Temporal correlation between different stages of phagosome acidification and transport
We opsonized pH-sensitive RotSensors with immunoglobulin G (IgG) to initiate Fc receptor (FcR)-dependent phagocytosis in activated RAW264.7 macrophage cells. Using transmission electron microscopy (TEM), we confirmed that ≈86% of internalized RotSensors remained tightly wrapped by the phagosome membrane at the end of our experiments (50 min after the addition of particles to cells) (Figure 1—figure supplement 3). Based on the tight membrane fitting and the presence of IgG binding to FcRs, the RotSensors are unlikely to freely rotate inside the phagosomes and thus their movements faithfully report the movements of the phagosomes they reside in.
We then performed simultaneous three-color live cell imaging of the pH response and transport dynamics (both translational and rotational) of single phagosomes encapsulating RotSensors. For transport dynamics, we observed that the phagosomes first moved slowly both translationally and rotationally after internalization, but later moved bi-directionally and rapidly with frequent rotations (Figure 1C). During the slow transport period, their average velocities (0.023 ± 0.015 µm/s and 0.038 ± 0.026 rad/s) were comparable to that of phagosomes in cells treated with 10 μM of the microtubule inhibitor nocodazole (0.025 ± 0.015 µm/s and 0.035 ± 0.023 rad/s; Figure 1—figure supplement 4). This is evidence that the slow movements are independent of microtubules. We further confirmed that this slow transport period involved movements of phagosomes in the actin cortex, based on the results that the length of the slow transport period changed by Myosin V and VI inhibition (see details in later section). After a few minutes of slow transport, the phagosomes started rapid bi-directional movements with velocities as high as 0.1 µm/s during runs (representative trajectory in Figure 1C). The phagosomes also rotated frequently in between segments of translational runs with rotational velocities up to 0.15 rad/s. These dynamic behaviors, particularly the phagosome rotation, are characteristic of cargo transport driven by microtubule-based molecular motors, as we previously reported (Gao, Anthony, Yu, Yi, & Yu, 2018). Such rapid translational and rotational dynamics disappeared in cells treated with nocodazole, which confirms the dependence on microtubules (Figure 1—figure supplement 5). The results show that, during engulfment and the earliest stages of maturation, phagosomes move from the actin cortex to microtubules (schematic illustration in Figure 1A), which agrees with the general notion put forward in previous studies (Al-Haddad et al., 2001; Araki, 2006; Gibbs et al., 2004; Gibbs et al., 2003; Granger et al., 2014; Harrison & Grinstein, 2002; Hewage & Altman, 2018; M. Jiang et al., 2015; Kapitein et al., 2013; Kelleher & Titus, 1998).
After engulfment, the phagosomes acidified in their lumen, as indicated by the fluorescence changes of the RotSensors (Figure 1D). By plotting pH vs. time for single phagosomes, we noticed three stages of phagosome acidification. The process started with a standby period during which the phagosome pH remained at the extracellular pH of ≈ 7.3. This was followed by a rapid acidification period when the pH quickly dropped over a period of a few minutes. Phagosome acidity eventually reached a plateau at pH 4.5-5.0. This acidic pH is known to be necessary for activating degradative enzymes (Rybicka et al., 2012; Yates, Hermetter, & Russell, 2005). While individual phagosomes reach slightly different final pH, their pH-time acidification profiles mostly (≈74% of a total of 57 phagosomes) follow a sigmoidal-Boltzmann function:  , in which t0 is the half-response point, and tinitial and tfinal denote the beginning and the end of the rapid acidification, respectively (Figure 1E). Slope at t0 is the acidification rate by definition.
We noticed that the beginning of the rapid acidification period appears to coincide with the onset of fast microtubule-based transport (Figure 1E-G). To confirm this observation quantitatively, we imaged phagosome acidification and translational transport in cells expressing actin-GFP, in which intensity changes of actin-GFP can be used to pinpoint the time of particle internalization. As in previous reports (Huang et al., 2014; Scott et al., 2005), we observed that actin rapidly polymerized around nascent phagosomes and then depolymerized at its base, resulting in an actin-GFP intensity peak (Figure 1—figure supplement 6A-B). This actin intensity peak indicates the completion of engulfment (Scott et al., 2005). Using the actin peak as the reference time zero, we found that phagosomes start rapid acidification 620 ± 292 sec (mean ± s.d.) after internalization. This time period is referred to as “pH standby time” (Figure 1—figure supplement 6D). Meanwhile, the rapid microtubule-based transport of phagosomes starts 440 ± 266 sec (mean ± s.d.) after internalization. During this period, phagosomes move from the actin cortex onto microtubules; it is therefore referred to as the “actin-to-microtubule transition time” (Figure 1—figure supplement 6C). On average, phagosomes start rapid acidification 186 ± 266 sec (mean ± s.d.) after they move onto microtubules (Figure 1—figure supplement 6F). When plotting the pH standby time of single phagosomes against their actin-to-microtubule transition time, we observed that phagosomes with longer actin-to-microtubule transition time on average had longer pH standby time, as indicated by the linear fitting with a Pearson’s coefficient of 0.44 (Figure 1—figure supplement 6E). The results suggest a temporal correlation between the two distinct stages of internalization and transport with phagosome acidification. Phagosomes largely maintain a neutral pH during their transport within the actin cortex, and rapidly acidify after starting transport on microtubules. We next sought to differentiate the roles of the actin-and microtubule-based transport in phagosome maturation.
Correlation between phagosome acidification kinetics and microtubule-based transport velocity
We first focused on the stage when phagosomes move on microtubules and also rapidly acidify. We first confirmed that the successful acidification of phagosomes requires intact microtubules, as phagosomes failed to acidify in cells treated with nocodazole (Figure 1—figure supplement 7). To search for a possible correlation between the two processes, we calculated the acidification rate of single phagosomes from the sigmoidal fitting of their individual pH-time plots (Figure 1D and Figure 1—figure supplement 8). We then plotted the acidification rate of single phagosomes against their individual translational and rotational velocities during the rapid acidification phase (from tinitial to tfinal) (Figure 1H-I). Phagosomes acidify at an average rate of 0.33 ± 0.28 pH unit/min, but the acidification rate varies broadly for single phagosomes, even those from the same cells, reflecting the individuality of the phagosome maturation process. Despite this heterogeneity, the acidification rates of single phagosomes exhibit a linear relationship with both their translational and rotational velocities with a Pearson’s coefficient of 0.78 and 0.81, respectively. This observation applies not only to phagosomes from different cells but also to those from the same cells. This is shown in Figure 1H-I, in which data of phagosomes from the same cells are colored the same. It indicates that more motile phagosomes acidify faster. Surprisingly, the final pH of phagosomes shows no correlation with either the translational or the rotational velocities of the phagosomes (Figure 1— figure supplement 7). We confirmed that the correlation between phagosome transport dynamics and acidification rate is a general phenomenon independent of the activation status of macrophage cells. Resting RAW264.7 cells, compared to activated cells, have a less flattened shape with fewer visible thick microtubule filaments (Figure 1—figure supplement 9). Phagosomes in resting cells move and acidify slightly faster with less phagosome-to-phagosome variation (Figure 1—figure supplement 10A-B). Nevertheless, results from both resting and activated cells, when merged, follow a single linear correlation relationship (Figure 1—figure supplement 10A-B), indicating the generality of this observation.
Correlation of phagosome-lysosome fusion kinetics with microtubule-based transport velocity
During maturation, phagosome acidification is driven by the activity of the proton-pumping vacuolar H+-ATPase (V-ATPase), which is acquired by fusion with endolysosomes (Canton et al., 2014; Mcneil, Tanasugarn, Meigs, & Taylor, 1983; Pauwels, Trost, Beyaert, & Hoffmann, 2017; Riazanski et al., 2015; Sun-Wada et al., 2009). Based on our observation that faster moving phagosomes also acidify more rapidly, we next investigated whether phagosome-lysosome fusion also correlates with the motility of phagosomes. We measured the kinetics of phagosome-lysosome fusion using an assay based on Förster Resonance Energy Transfer (FRET). In this assay, FRET-sensitive RotSensors were labeled with streptavidin that was conjugated with the donor fluorophore Alexa568 (Figure 2A). Meanwhile, lysosomes were labeled with fluid-phase biotinylated bovine serum albumin (BSA) that was conjugated with the acceptor fluorophore Alexa647. We confirmed that the biotin-BSA-Alexa647 resided in lysosomes based on their colocalization with the lysosome marker LysoTracker in cells (Figure 2—figure supplement 1). The FRET assay worked on the principle that once the contents of lysosomes are delivered to phagosomes during fusion, the biotin-BSA-Alexa647 from lysosomes will bind to the streptavidin-Alexa568 on the RotSensors in the phagosomes, leading to increased FRET between Alexa568 and Alexa647. The magnitude of the FRET signal directly indicates the extent of phagosome-lysosome fusion. During live cell imaging, we observed that lysosomes loaded with biotin-BSA-Alexa647, which appeared as fluorescent puncta, docked on phagosomes (Figure 2B). The RotSensors inside phagosomes exhibited decreased emission of Alexa568 (donor) and simultaneous increase of Alexa647 (acceptor) under excitation of the donor fluorophore (a representative phagosome shown in Figure 2C). The FRET ratio, defined as the normalized ratio between the donor and acceptor emission intensity, increased continuously until it reached a plateau (Figure 2D). This is a general phenomenon confirmed in over 40 phagosomes from 26 cells (additional representative results are shown in Figure 2—figure supplement 2A). The gradual increase in FRET ratio indicates continuous fusion between the phagosome and labeled lysosomes. The plateau does not necessarily indicate the end of phagosome-lysosome fusion. Instead, it is likely results from all streptavidin binding sites on the RotSensors being occupied by biotin-BSA-Alexa647. Based on the FRET ratio vs. time plots of single phagosomes, we quantified the phagosome-lysosome fusion rate by calculating the slope of the linear portion of each plot (referred to as “FRET rate”). As expected, the FRET rate differed greatly among phagosomes even when they were in the same cell (Figure 2—figure supplement 2). However, all single phagosome FRET ratio data fall into a linear correlation with the translational and rotational velocities of phagosomes, with a Pearson’s coefficient of 0.65 and 0.68, respectively (Figure 2E-F). Surprisingly, phagosomes that move faster along microtubules also tended to fuse more rapidly with lysosomes. Phagosome-lysosome fusion was diminished when microtubules were disrupted by nocodazole treatment, indicating its dependence on microtubules (Figure 2— figure supplement 3). We next asked whether the faster transport of phagosomes on microtubules promotes their fusion with lysosomes, and hence faster acidification.

Simultaneous measurement of phagosome-lysosome fusion and phagosome transport dynamics. (A) Schematic illustration of the Förster resonance energy transfer (FRET)-based fusion assay. Streptavidin conjugated with the donor fluorophore Alexa-568 was coated on the RotSensor and BSA-biotin conjugated with the acceptor fluorophore Alexa-647 was encapsulated in lysosomes. Phagosome fusion with lysosomes leads to binding between streptavidin and BSA-biotin, which induces FRET between Alexa-568 and Alexa-647. (B-D) Fluorescence images and plots showing the FRET signal change of a representative phagosome during maturation in an activated RAW264.7 macrophage cell. The FRET ratio is defined as the ratio of donor (Alexa568) and acceptor (Alexa647) fluorescence emission intensity under donor excitation. Scale bar, 5 µm. Scale bar in inset, 2 µm. (E-F) Scatter plots showing FRET rates against translational and rotational velocities of single phagosomes during phagosome-lysosome fusion period. Each data point represents a single phagosome data. Data points from multiple phagosomes within the same cells are shown in the same solid color. Data points from cells containing only one phagosome are shown as black circles. The black lines indicate linear regression with a Pearson’s coefficient of 0.65 in (E) and of 0.68 in (F).
Magnetically accelerated phagosome transport promotes acidification via phagosome-lysosome fusion
To determine whether the motility of phagosomes regulates their acidification and fusion with lysosomes, we applied magnetic tweezers to manipulate the intracellular transport of single phagosomes and simultaneously measure changes in phagosome maturation (Figure 3—figure supplement 1). We designed 1 μm magnetically modulated phagosome sensors (MagSensors) that were also pH-responsive (Figure 3A). As for RotSensors, the MagSensors were biotinylated and conjugated with streptavidin-pHrodo Red (pH indicator) and streptavidin-CF640R (reference), and exhibited similar pH responses (Figure 3—figure supplement 2). In all experiments, the solenoid tip was positioned on the opposite cell side from the phagosome of interest to pull it from the cell periphery towards the center. The magnetic force exerted on individual MagSensors changes with their distance from the solenoid tip following the theoretical predictions (Figure 3C) (C. Jiang, Lionberger, Wiener, & Meyhofer, 2016). On average, the solenoid tip was positioned ≈ 43 μm from the MagSensor of interest. This means that the average force on the MagSensors was ≈ 21 pN at the beginning of manipulation and reached as high as ≈ 31 pN after they moved closer to the tip at the end of imaging (Figure 3—figure supplement 3).

Phagosome acidification during magnetically manipulated transport. (A) Schematic illustration of the experimental design. Magnetic pulling force was applied on MagSensors after internalization in resting RAW 264.7 macrophage cells. The 1 µm MagSensors were coated with pHrodo Red-SAv (pH indicator), CF640-SAv (reference), and physically adsorbed IgG. (B) Bright-field image of a representative cell overlaid with the trajectory of a MagSensor-containing phagosome under magnetic pulling. The start and end time points of magnetic force are indicated. Scale bar, 5 µm. (C) Calibration plot showing the magnetic force exerted on the MagSensors as a function of the distance from the MagSensor to the tip of the magnetic tweezers solenoid (shown in inset). Error bars are standard deviation from 5 samples. (D) Fluorescence images and line curves showing changes of pH and actin intensity of a representative phagosome during acidification that was magnetically pulled. Fluorescence images showing the phagosome pH and actin-GFP in cells are color-coded based on the scales indicated. Scale bars, 1 µm. The change of phagosome pH and the corresponding sigmoidal-Boltzmann fitting are plotted in black lines. Data of actin-GFP intensity around the phagosomes are plotted in red lines. The “on” and “off” time points of magnetic pulling are indicated. (E) Statistic result showing the average acidification rate of phagosomes with or without magnetic pulling. The average acidification rate is 0.48 ± 0.34 pH unit/min without magnetic manipulation (N = 33) and 0.79 ± 0.54 pH unit/min with magnetic pulling (N = 38). (F) Statistic result showing the average final pH in different experiment conditions as indicated. The average final pH is 4.7 ± 0.3 without magnetic manipulation (N= 33) and 4.7 ± 0.4 with magnetic pulling (N = 38). In both scattered plots, each box plot indicates the mean (horizontal line) and the interquartile range from 25% to 75% of the corresponding data set. Statistical significance is highlighted by p-values (student’s t-test) as follows: ** p < 0.01, NS p > 0.05.
To ensure that magnetic force was applied only after the internalization of MagSensors, we performed the magnetic experiments in resting actin-GFP-expressing macrophages. We used resting cells for this experiment because they exhibit a similar acidification-phagosome motility correlation to activated cells (Figure 1—figure supplement 10) but are less flat which allows for better magnetic manipulation of the phagosome. In these experiments, we turned on the magnetic force immediately after the MagSensors were internalized into phagosomes as indicated by the actin-GFP intensity peak, and pulled the MagSensor-containing phagosomes from the cell periphery towards the center (Figure 3A). The magnetic force remained on throughout imaging. Under the magnetic pulling force, phagosomes moved towards the magnetic tip with accelerated translational velocity (Figure 3—figure supplement 4), but the trajectories of pulled phagosomes were zigzagged (Figure 3B), likely because the magnetic force applied on the MagSensors was only slightly larger than the collective forces from the microtubule-based molecular motors. As mentioned above, the magnetic pulling force on single MagSensors was ≈ 21 to 31 pN (Figure 3— figure supplement 3). For comparison, microtubule-based molecular motors were shown to exert collective forces as high as ≈ 20 pN on vacuoles encapsulating 1 µm particles (Hendricks, Holzbaur, & Goldman, 2012). Therefore, the zigzagged movements of phagosomes are plausibly a result of the combined influence of the magnetic force and the forces exerted by molecular motors. As the translational velocity of phagosomes accelerated under magnetic pulling, we found that they also acidified more rapidly. Phagosomes that were magnetically manipulated acidified at an average rate of 0.79 ± 0.54 pH unit/min (N > 30), in contrast to the average rate of 0.48 ± 0.34 pH unit/min without magnetic forces (N > 30) (Figure 3E). Surprisingly, the magnetic manipulation had no effects on the final pH of the phagosomes. Phagosomes with or without magnetic manipulation reached an average final pH of 4.7 ± 0.4 and 4.7 ± 0.3, respectively (Figure 3F). This results evidently demonstrate that faster transport of phagosomes leads to their faster acidification.
We next investigated how magnetic pulling affects phagosome-lysosome fusion using the FRET fusion assay shown in Figure 2. We found that the FRET ratio, which indicates the extent of phagosome-lysosome fusion, increased more rapidly for magnetically pulled phagosomes (representative single phagosome data in Figure 4A). We confirmed the generality of this observation by plotting the results from >15 individual phagosomes with and without magnetic forces in heatmaps (Figure 4B). Overall, the FRET signals from magnetically pulled phagosomes were noticeably more intense and increased more rapidly, indicating enhanced phagosome fusion with lysosomes. To investigate whether the movement of phagosomes alone is sufficient to facilitate productive fusion with lysosomes, we next treated cells with nocodazole, which disrupts microtubule-based transport of both phagosomes and lysosomes. We then magnetically moved phagosomes the same way as in non-treated cells. Despite the fast movement of phagosomes under magnetic pulling forces, they exhibited minimal fusion with lysosomes and minimal acidification (Figure 4—figure supplement 1). We therefore conclude that productive phagosome-lysosome fusion requires active transport of not only the phagosomes but also the lysosomes that they fuse with.

Phagosome-lysosome fusion during magnetically manipulated transport. (A) Line plots showing FRET ratio vs. time for two representative phagosomes with or without magnetic pulling. Time zero indicates the start of magnetic pulling force. (B) Heatmaps showing color-coded FRET ratio vs. time of all phagosomes (N = 15 for each graph) with or without magnetic pulling.
The results clearly demonstrate a causal link between microtubule-based transport of phagosomes and their maturation. Efficient transport of phagosomes on microtubules promotes their encounters with lysosomes, which causes their acidification. Unexpectedly though, enhancing the movement of engulfed phagocytic targets causes enhanced fusion with lysosomes, and thus, more rapidly acidify. This provides an explanation of why phagosome transport velocity positively correlates with acidification rate and with phagosome-lysosome fusion kinetics (Figure 1H-I and Figure 2E-F)
Causal link between actin-based phagosome transport on early phagosome assembly and maturation progression
We next sought to investigate the role that actin-based phagosome transport plays in the overall process of maturation. Because we observed that phagosomes acidify after transferring onto the microtubules, we expected that the period of phagosome transport in the actin cortex should overlap with early maturation activities prior to acidification. The first maturation activity we measured was the transient recruitment of the small GTPase Rab5 and its subsequent replacement by Rab7. Rab5 and Rab7 are markers for early and late phagosomes, respectively (Poteryaev, Datta, Ackema, Zerial, & Spang, 2010; Rink, Ghigo, Kalaidzidis, & Zerial, 2005). The Rab5-to-Rab7 transition is a key mechanism of the progression of phagosome maturation (Kinchen & Ravichandran, 2008; Mottola, 2014; Poteryaev et al., 2010), so we simultaneously monitored both by imaging Rab5-RFP with actin-GFP or Rab7-GFP in cells. We began by confirming that Rab5 was rapidly recruited to phagosomal membrane after particle engulfment, as indicated by the actin-GFP intensity peak (Figure 5—figure supplement 1). After its transient accumulation, Rab5 intensity gradually decreased over time with large fluctuations. Meanwhile, Rab7 was recruited to the same phagosomes until its intensity reached a plateau (Figure 5A-B). This Rab5-to-Rab7 transition was observed in most phagosomes, but the intensity and duration of Rab5 association varied significantly among different phagosomes (Figure 5—figure supplement 2A-B). While Rab5 quickly dissociated within a few minutes on some phagosomes, it remained for a prolonged period on others (Figure 5—figure supplement 3). We then imaged the recruitment of each GTPase in tandem with phagosome acidification (Figure 5C-D). It is clear that the phagosomes remain at a neutral pH when a transiently high level of Rab5 is present on the phagosome membrane. As Rab5 dissociates from phagosomes and Rab7 is recruited, phagosomes start to acidify. The sequence of events is schematically illustrated in Figure 5E. By plotting the recruitment of Rab5 and Rab7 together with the translational velocity of phagosomes as a function of time, we observed that Rab5 recruitment starts during the slow transport of phagosomes within the actin cortex, but its replacement by Rab7 can continue into the period when phagosomes are transported along microtubules (Figure 5— figure supplement 2C).

Dependence of early-to-late phagosome transition on actin-to-microtubule transport. (A-B) Fluorescence images and intensity plots showing the dynamic distribution of Rab5-RFP and Rab7-GFP around a representative phagosome during maturation in an activated RAW 264.7 macrophage cell. In the overlaid fluorescence images in (A), the pH-sensor containing phagosome is shown in red, Rab5-RFP in cyan and Rab7-GFP in green. Scale bar, 2 µm. The thick blue line indicates sigmoidal-Boltzmann function fitting to the Rab7-GFP data. The green shaded area indicates the period of Rab5-to-Rab7 transition from the first Rab5 intensity peak to the plateau of Rab7-GFP intensity. (C-D) Line plots showing average normalized intensity of Rab5-GFP (in C), Rab7-GFP (in D), and average normalized phagosome pH (in both plots) as a function of time. The line curves were averaged from 26 and 17 individual phagosomes in Rab5-RFP and Rab7-GFP expressing cells, respectively. Vertical bars indicate standard deviations. (E) A schematic showing the dynamic changes of Rab5, Rab7, and pH during singe phagosome acidification. (F) Scatter plot showing actin-to-microtubule transition time of single phagosomes with or without drug treatments as indicated. The average actin-to-microtubule transition time of phagosomes is 440 ± 266 s in cells without drug treatment (WT), 276 ± 214 s in cells with Myosin V inhibitor, and 1026 ± 487 s in cells with Myosin VI inhibitor. In all scattered plots, each box plot indicates the mean (horizontal line) and the interquartile range from 25% to 75% of the corresponding data set. Statistical significance is highlighted by p-values (student’s t-test) as follows: **** p < 0.0001, * p < 0.05. (G) Plots showing average normalized intensity of Rab5-GFP as a function of time with or without drug treatments as indicated. The line curves were averaged from 26, 10, and 16 individual phagosomes in cells without drug treatment (WT), with Myosin V inhibitor, and with Myosin VI inhibitor, respectively. Vertical bars represent standard deviations. (H) Plots showing the average normalized intensity of p40PX-GFP, a probe for PI3P, in cells under different drug treatment. The line curves are averaged from 12, 14, and 8 individual phagosomes without drug treatment (WT), with Myosin V inhibition, and with Myosin VI inhibition, respectively. Vertical bars represent standard deviations.
To determine the role of actin-based phagosome transport in phagosome maturation, we inhibited Myosin V and VI separately in cells and quantified their effect on the recruitment of Rab5. Myosin V moves cargos along actin filaments from the minus end to the plus end, and was shown to tether endosomes and phagosomes strongly to the actin cortex and delay their transport onto microtubules (Al-Haddad et al., 2001; Kapitein et al., 2013; Lecuona et al., 2009; Maschi, Gramlich, & Klyachko, 2018; Provance et al., 2008). Contrary to the case of Myosin V, Myosin VI transports cargos from the plus end of actin to the minus end (Wells et al., 1999). It facilitates cargo transport from actin to microtubules, as its inhibition causes phagosomes and endosomes to be entrapped in actin cortex (Aschenbrenner, Lee, & Hasson, 2003; Aschenbrenner, Naccache, & Hasson, 2004; Hewage & Altman, 2018). Indeed, in cells treated with the Myosin V inhibitor MyoVin-1, phagosomes started microtubule-based rapid transport sooner than those in non-treated cells, with a shortened actin-to-microtubule transition time of 276 ± 214 sec (Figure 5F and Figure 5—figure supplement 4A-C). On the contrary, phagosomes in cells treated with the Myosin VI inhibitor 2,4,6-triiodophenol (TIP) remained in the actin-based slow-moving stage for a prolonged period of 1026 ± 487 sec (Figure 5F and Figure 5—figure supplement 4E-G). The results confirm that inhibition of Myosin V promotes the handover of phagosomes from actin to microtubules, whereas inhibition of Myosin VI delays this transition. Correspondingly, we found that the duration of Rab5 association on phagosomes was shortened upon Myosin V inhibition, but prolonged upon Myosin VI inhibition (Figure 5G). We observed the similar effects of myosin inhibition on another early phagosome marker phosphatidylinositol 3-phosphate (PI3P), which is labeled with a genetically encoded biosensor p40PX-GFP. PI3P is a phospholipid generated after Rab5 recruitment by the class III phosphoinositide 3-kinase Vps34 and required for phagosome maturation (Gillooly, Simonsen, & Stenmark, 2001). As shown in Figure 5H, inhibition of Myosin V led to shorter duration of PI3P in the phagosomal membrane, whereas inhibition of Myosin VI caused the opposite effect. The observations from Rab5 and PI3P consistently show that a faster actin-to-microtubule transition with Myosin V inhibition shortens the duration over which Rab5 and PI3P are present on phagosomes. On the other hand, a slower actin-to-microtubule transition due to Myosin VI inhibition prolongs Rab5 and PI3P association with phagosomes. The results evidently show that the timing of transition of phagosomes from actin onto microtubules regulates the turnover of Rab5 and PI3P on phagosomes.
Because both Rab5 and PI3P are early phagosome markers and their turnover determines the progression of phagosome maturation (Chua & Deretic, 2004; Jeschke et al., 2015; Kitano et al., 2008; Levin, Grinstein, & Schlam, 2015; Schnatwinkel et al., 2004; Vieira et al., 2003), we postulated that the inhibition of Myosin V and VI should also affect phagosome acidification. Indeed, we found that the inhibition of Myosin V led to an earlier onset of rapid acidification (pH-standby time 371 ± 200 sec). It also led to a faster acidification rate (0.54 ± 0.32 unit/min) and a lower final pH (4.8 ± 0.7), compared to non-treated cells (pH-standby time: 620 ± 292 sec; acidification rate: 0.34 ± 0.14 unit/min; final pH: 5.5 ± 0.8) (Figure 6A-C, Figure 1—figure supplement 6D and Figure 5—figure supplement 4D). The opposite effect was observed with Myosin VI inhibition: phagosomes exhibited a delayed start of acidification (pH-standby time 718 ± 323 sec), a slower acidification rate (0.25 ± 0.14 unit/min), and a higher final pH (5.9 ± 1.0). By plotting the pH-standby time of single phagosomes against their actin-to-microtubule transition time (Figure 6D), we confirmed the positive correlation between the two variables. Phagosomes with shorter actin-to-microtubule transition time overall had shorter pH-standby time. It is therefore clear that the timing of phagosome transport from actin to microtubules regulates acidification. Phagosomes that moved faster from the actin cortex onto microtubules started acidification sooner, acidified more rapidly, and reached a lower final pH. We have observed that the actin-to-microtubule transport of phagosomes regulates the turnover of Rab5 and PI3P, both of which are a prerequisite for phagosome acidification (Fratti, Backer, Gruenberg, Corvera, & Deretic, 2001; Jeschke & Haas, 2018; Law et al., 2017; Vergne et al., 2005). Thus, it is plausible that the actin-to-microtubule transition regulates phagosome acidification as a downstream consequence of regulating this turnover. Our results here demonstrate that the timing of actin-to-microtubule transport of phagosomes regulates the transient recruitment and dissociation of Rab5 and PI3P on phagosomes and therefore acts as a temporal control of the maturation of phagosomes, including their acidification.

Dependence of phagosome acidification on actin-to-microtubule transport. (A) Line plots showing the average normalized pH as a function of time with or without drug treatments as indicated. The line curves are averaged from 22, 19, and 25 individual phagosomes in cells without drug treatment (wild type), with Myosin V inhibitor, and with Myosin VI inhibitor, respectively. Vertical bars represent standard deviations. (B) Scatter plot showing pH standby time of single phagosomes with or without drug treatments as indicated. The average pH standby time of phagosomes is 620 ± 292 s without drug treatment (WT), 371 ± 200 s with Myosin V inhibition, and 718 ± 323 s with Myosin VI inhibition. (C) Scatter plot showing acidification rate of single phagosomes with or without drug treatments as indicated. The average acidification rate of phagosomes is 0.34 ± 0.14 pH unit/min in cells without drug treatment (WT), 0.54 ± 0.32 pH unit/min with Myosin V inhibition, and 0.25 ± 0.14 pH unit/min with Myosin VI inhibition. In all scatter plots, each box plot indicates the mean (horizontal line) and the interquartile range from 25% to 75% of the corresponding data set. Statistical significance is highlighted by p-values (student’s t-test) as follows: * p < 0.05, ** p < 0.01, *** p < 0.001, NS p > 0.05. (D) Scatter plot showing pH standby time against actin-to-microtubule transition time of single phagosomes with or without drug treatments as indicated.
Correlation between Rab5-to-Rab7 transition and phagosome transport velocity
During the analysis of the Rab5 and Rab7 recruitment to phagosomes, we observed some correlation between the duration of the Rab5-to-Rab7 transition and the phagosome velocity that follows. Phagosomes from the same cell are compared in Figure 7A-B. The figure shows that phagosomes that had less Rab5 association (shorter duration and lower integrated intensity) and a faster transition to Rab7 moved faster during the microtubule-based transport and acidified more rapidly (Figure 7A-B). When we quantified the duration of the Rab5-to-Rab7 transition as the time from the initial Rab5 peak to the point when Rab7 intensity reaches a plateau (shaded area in Fig. 5A), we noticed that it showed an inverse correlation with the microtubule-based velocity of phagosomes with a Pearson’s coefficient of −0.72 (Figure 7C). These observations suggest that phagosomes with a faster Rab5-to-Rab7 conversion move faster afterwards on microtubules. However, we do not yet know the causal relationship between them. It is plausible that the two processes form a positive feedback loop, in which the efficient exchange of Rab5 by Rab7 facilitates phagosome transport on microtubules, which in turn promotes Rab7 recruitment.
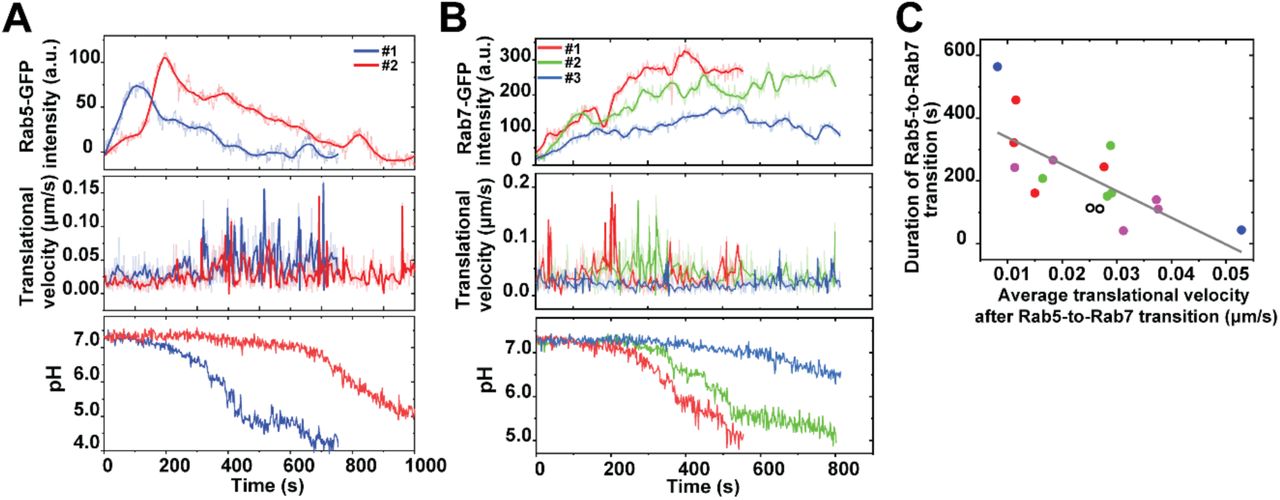
Rab5 and Rab7 recruitment and transport dynamics of single phagosomes from same cells. (A) Fluorescence intensity of Rab5-GFP, translational velocity, and phagosome lumen pH from three individual phagosomes within a same cell are plotted as a function of time. (B) Fluorescence intensity of Rab7-GFP, translational velocity, and phagosome lumen pH from three individual phagosomes within a same cell are plotted as a function of time. (C) Scatter plot showing the duration of Rab5-to-Rab7 conversion of individual phagosomes against their translational velocity after the Rab5-to-Rab7 conversion phase in activated RAW264.7 macrophage cells. Data points from multiple phagosomes within the same cells are shown in the same solid color. Data points from cells containing only one phagosome are shown as black circles. The linear regression has a Pearson’s coefficient of −0.72.
Discussion
The intracellular trafficking of phagosomes is known to be important for their maturation and, thus, for the effective degradation of pathogens. However, little is known about how the motility of phagosomes regulates the biochemical progression of phagosomes during maturation. In this study, we developed multi-functional particle sensors as phagocytic targets to combine biochemical imaging, tracking, and magnetic manipulation of single phagosomes in living cells. This integrated approach allowed us to discover two distinct mechanisms by which the intracellular trafficking of phagosomes regulates the timing of their maturation process. First, microtubule-dependent transport of phagosomes promotes their acquisition of late-phagosome and phagolysosomal characteristics. Their transport velocity directly regulates how fast they fuse with lysosomes, which in turn regulates how fast they acidify. However, it doesn’t influence the final pH of the phagosomes. Second, phagosome transport from actin cortex to microtubules regulates the assembly of proteins to nascent phagosomes and the subsequent maturation progression. Timing of the actin-to-microtubule transition regulates the duration of Rab5 and PI3P recruitment to phagosomes, which further influences the progression to late phagosomes (Rab7 recruitment) and the acidification. These two mechanisms are not exclusive of one another; in fact, they are interconnected. This is indicated by the observation that phagosomes with faster Rab5-to-Rab7 transition tend to be more mobile on microtubules in the late phagosome stage.
One of the key findings of our study is that the transport velocity of phagosomes on microtubules directly regulates phagosome fusion with lysosomes and consequently their acidification rate. It is known that phagosome fusion with lysosomes requires microtubule-dependent transport (Blocker et al., 1997; Desjardins et al., 1994; Dumas et al., 2015; Funato et al., 1997; Huynh et al., 2007; A. Rai et al., 2016; A. K. Rai, Rai, Ramaiya, Jha, & Mallik, 2013; Sun-Wada et al., 2009). By fusion with lysosomes, phagosomes acquire proteins essential for maturation, including V-ATPase for acidification (Sun-Wada et al., 2009). However, unlike previous studies, our results reveal a causal and quantitative relationship between these processes. By simultaneously tracking the transport dynamics and maturation of single phagosomes, we first determined that more mobile phagosomes experience faster fusion with lysosomes and acidify faster. We then confirmed the causal nature of this relationship using magnetic tweezers experiments. In these experiments we showed that when phagosomes are accelerated, they speed up their fusion with lysosomes and their acidification. We further showed that the probability of productive phagosome-lysosome fusion is determined by the motility both of phagosomes, and also of lysosomes. Phagosomes failed to fuse with lysosomes or to acidify in cells with disrupted microtubules, even if phagosomes were moved magnetically. This finding demonstrates that the active transport, rather than simple diffusion, of phagosomes regulates phagosome-lysosome fusion and the acidification kinetics. Our results here do not exclude other possible mechanisms that might link the microtubule-based transport of phagosomes with the maturation kinetics. In fact, our observation that the rotational velocity of phagosomes correlates with the acidification rate suggests possible involvement of molecular motors. We have shown in previous studies that cargos rotate during transport on microtubules because of the “tug-of-war” between molecular motors (Gao, Anthony, Yi, et al., 2018; Gao, Anthony, Yu, et al., 2018). Other studies have also shown that the Rab7-RILP (Rab7-interacting lysosomal protein) complex induces the recruitment of the dynein-dynactin motor protein complex to phagosomes (Johansson et al., 2007; Jordens et al., 2001), late endosomes and lysosomes (Harrison, Bucci, Vieira, Schroer, & Grinstein, 2003) to regulate the retrograde transport of cargos. The Rab7-RILP complex also directly recruits the V-ATPase subunit V1G1 for phagosome maturation (Kissing et al., 2015). It is possible that the Rab7-RILP complexes function as the molecular link relating the phagosome motility with their acidification.
Surprisingly, we showed that the microtubule-based transport of phagosomes plays no role in determining the final pH of single phagosomes, which is an indicator of their degradative capacity. Instead, the final pH of a phagosome is affected by its transport within the actin cortex prior to moving onto microtubules. We found that, different from the microtubule-based transport, the period of phagosome transport from actin cortex onto microtubules regulates the initiation of phagosome maturation. Previous studies have shown that nascent phagosomes continue to acquire the molecules needed for maturation throughout their transition in the actin cortex (Heinsbroek et al., 2009; Kinchen et al., 2008; Yeung et al., 2009). In particular, proteins such as Rab5 and PI3P, which are required for the fusion of phagosomes with early endosomes (Duclos et al., 2000; Jeschke & Haas, 2018), are recruited onto phagosome membranes before microtubule-based transport (Chua & Deretic, 2004; Feliciano et al., 2011; Kitano et al., 2008). However, the role of actin in this process is unclear. Our results here demonstrate that the actin-to-microtubule translocation of phagosomes plays a much more significant role than merely proceeding coordinately with the early-to-late phagosome transition. We showed that prolonging the entrapment of phagosomes in actin cortex through Myosin VI inhibition significantly extended their early phagosome phase. This was indicated by the observation that the duration of Rab5 and PI3P association was prolonged and the onset of phagosome acidification was delayed. On the other hand, speeding up the transport of a phagosome from actin to microtubule transport through Myosin V inhibition shortened the early phagosome phase and accelerated its transition to a late phagosome. Our findings reveal that the timing of phagosome transport from actin filaments to microtubules involves a mechanism that directly regulates early phagosome biogenesis, which then, in turn, regulates the subsequent cascades of phagosome maturation activities, including acidification. Several pathways exist by which the duration of phagosome entrapment in the actin cortex might control the assembly of Rab5 and PI3P onto phagosomes. Membrane-bound actin was shown in in vitro assays to facilitate the fusion of purified phagosomes with endosomes (Jahraus et al., 2001) and between purified yeast vacuoles (Eitzen, Wang, Thorngren, & Wickner, 2002). The disruption of actin was also found to reduce the delivery of early endosomal content to pathogenic mycobacteria containing phagosomes (Guerin & de Chastellier, 2000). Therefore, the retention of phagosomes in cortical actin might control the timing of their fusion with early endosomes to acquire proteins such as Rab5. Meanwhile, the timing of switching onto microtubules can also affect the delivery of Rab5-activating protein 6 (RAP6, also known as Gapex-5) (Kitano et al., 2008) and late endocytic content (Liebl & Griffiths, 2009) to the phagosomes. This, in turn, affects the timing of Rab5-to-Rab7 conversion and phagosome maturation.
Another interesting observation of our study is that the duration of Rab5-to-Rab7 conversion is inversely correlated with the transport velocity of phagosomes on microtubules. Phagosomes with a shorter duration of Rab5 association and faster conversion to Rab7 move faster on microtubules after this conversion. We do not yet know what causal relationship might underlie this phenomenon. It is plausible that the two processes form a positive feedback loop. On the one hand, efficient replacement of Rab5 by Rab7 can facilitate phagosome transport on microtubules, as the Rab7-RILP complex recruits the dynein-dynactin motor protein complex to phagosomes (Harrison et al., 2003). Rab7 also enhances phagosome-lysosome fusion by recruiting the homotypic fusion and vacuole protein sorting (HOPS) complex (Balderhaar & Ungermann, 2013). It thus regulates acidification. On the other hand, interactions of phagosomes with non-motor microtubule associated proteins (MAPs) and MAP-binding proteins were also found to be essential for the activation of Rab GTPase (Feliciano et al., 2011; Kitano et al., 2008). This observation points out that despite the different roles of actin-based and microtubule-based transport in phagosome maturation, the underlying mechanisms are likely to be interconnected.
Individual phagosomes, even those from the same cells, exhibit a significant level of variation in maturation kinetics. There is no known mechanism that regulates the individual rate of phagosome maturation. Our results demonstrate that the intracellular transport of phagosomes functions as a maturation clock. Phagosome interaction with the cytoskeleton network can shape their degradative functions. This finding provides new insights into how pathogens might alter the subcellular environment in host cells, including the cytoskeletal structure and activities of molecular motors, to manipulate the degradative capacity of phagosomes as an immune-evasion strategy.
Materials and Methods
1. Materials
Carboxylate-modified yellow-green fluorescent polystyrene nanoparticles (diameter 100 nm), carboxylate-modified superparamagnetic Dynabeads (diameter 1 µm), eentylamine-biotin, Alexa Fluor 568 NHS ester (succinimidyl ester), Alexa Fluor 647 NHS ester (succinimidyl ester), pHrodo iFL Red STP Ester, Streptavidin, LysoTracker Green DND-26, Alexa Fluor 488 anti-tubulin-α antibody, Alexa Fluor Plus 647 phalloidin were purchased from ThermoFisher (Waltham, MA). Immunoglobulin G from rabbit plasma, albumin from bovine serum (BSA), biotin N-hydroxysuccinimide ester (biotin-NHS), nocodazole, lipopolysaccharides, MyoVin-1, and 2,4,6-triiodophenol (TIP) were purchased from Sigma-Aldrich (St. Louis, MO). Monodisperse amine-modified silica particles (diameters 1.0 μm) were purchased from Spherotech Inc. (Lake Forest, IL). Sylgard 184 PDMS base was from Dow Corning (Midland, MI). 1-(3-Dimethylaminopropyl)-3-ethylcarbodiimide hydrochloride (EDC) was purchased from Alfa Aesar (Haverhill, MA). Nigericin sodium salt was purchased from Tocris Bioscience (Minneapolis, MN). Recombinant Murine IFN-γ was purchased from Peprotech (Rocky Hill, NJ). CF640R-amine was purchased from Biotium (Fremont, CA). FuGENE HD transfection reagent was purchased from Promega (Madison, WI). GFP-Rab5, RFP-Rab5, GFP-Rab7, and p40PX-GFP were prepared as previously described(Ellson et al., 2001; Kanai et al., 2001; Vieira et al., 2003). RAW264.7 macrophage cells were purchased from ATCC (Manassas, VA). RAW264.7 macrophages stably expressing EGFP-actin have been previously described(Scott et al., 2005). Ringer’s solution (pH = 7.2, 10 mM HEPES, 10 mM glucose, 155 mM NaCl, 2 mM NaH2PO4, 5 mM KCl, 2 mM CaCl2, 1 mM MgCl2) was used for live-cell imaging. Potassium-rich solution (135 mM KCl, 2 mM K2HPO2, 1.2 mM CaCl2, 0.8 mM MgSO4) was used for intracellular pH calibration. Acidic washing solution (135 mM KCl, 2 mM K2HPO2, 1.2 mM CaCl2, 0.8 mM MgSO4, 5 mM sodium citrate) at pH of 4.5 was used for particle washing in the EDC coupling step of the RotSensor fabrication. Artificial lysosome fluid (55 mM NaCl, 0.5 mM Na2HPO4, 0.26 mM trisodium citrate dihydrate, 0.79 mM glycine, 150 mM NaOH, 108 mM citric acid, 0.87 mM CaCl2·2H2O, 0.27 mM Na2SO4, 0.25 mM MgCl2·6H2O, 0.46 mM disodium tartrate, 1.6 mM sodium pyruvate) was prepared following a previously reported protocol (Pelfrene, Cave, Wragg, & Douay, 2017) and used for washing particles during the protein conjugation step of the RotSensor fabrication.
2. Cell Culture, Pharmacological Treatments, and Transfection
All RAW264.7 cells were cultured in Dulbecco’s Modified Eagle Medium (DMEM) complete medium supplemented with 10% fetal bovine serum (FBS), 100 units/ml penicillin and 100 μg/ml streptomycin at 37°C and 5% CO2. Resting RAW 264.7 cells were activated with a combination of 50 ng/ml LPS and 100 units/ml IFN-γ for 9 hr. For microtubule depolymerization, 10 µM nocodazole was added to cells 0.5-1 hr prior to live cell imaging and kept in the imaging buffer during live cell imaging. For Myosin inhibition, Myosin V inhibitor MyoVin-1 and Myosin 6 inhibitor 2,4,6-triiodophenol (TIP) was separately dissolved in DMSO and added to cells 10 min before live cell imaging. The working concentration was 15 µM for MyoVin-1 and 5 µM for TIP. For cell transfection, 0.15 million RAW264.7 macrophage cells were seeded on a glass coverslip in 24 hr prior to transfection. Transfection was carried out according to manufacturer’s instructions. In brief, 500 ng of plasmids and 1.5 µl of FuGENE HD transfection reagents were mixed in 100 µl DMEM and kept at room temperature for 15 min. The transfection reagents were then added gently to the cells and incubated overnight before being removed.
3. Fabrication and Characterization of Phagosome Sensors
3.1 Rotational Phagosome Sensors (RotSensors)
pH-RotSensors
The first step was to covalently conjugate the amine-modified non-fluorescent silica particles (1 µm) and the carboxylate-modified yellow-green fluorescent nanoparticles (100 nm) at 1:1 ratio. Amine-modified non-fluorescent silica particles (1 µm) were first incubated with 150 µg/ml biotin-NHS in NaHCO3 solution (10 mM, pH 8.25) for 2 hr at room temperature and then with 500 µg/ml of biotin-NHS for a second round of biotinylation. After biotinylation, the silica particles were washed in methanol and deionized (DI) water. Carboxylate-modified yellow-green fluorescent nanoparticles (100 nm) were mixed with the biotinylated amine-modified silica particles at a molar ratio of 333:1 in phosphate buffer (10 mM, pH 7.0) containing 1.0 mg/ml EDC for the coupling. After 2 hr incubation, particles were washed with acidic washing solution and then 1×PBS to remove the non-covalently bounded 100 nm particles. The second step was to conjugate fluorescently labeled streptavidin onto the RotSensors. Streptavidin-pHrodo Red conjugates (SAv-pHrodo Red) were prepared according to manufacturer’s instructions. To synthesize streptavidin-CF640R conjugates (SAv-CF640), 0.7 mg of streptavidin, 80 µg of CF640R-amine, and 3 mg of EDC were mixed in 350 µl MES buffer (50mM, pH 4.5) for 3 hr. After the labeling, free dyes were removed by centrifugal filtration using Amicon Ultra filters (30K). RotSensors was then incubated with 25 µg/ml of SAv-pHrodo Red, 2.5 µg/ml of SAv-CF640R, 5 µg/ml of BSA and 1 µg/ml of IgG in 1×PBS for 5 hr at room temperature. Unbound proteins were rinsed off with artificial lysosome solution and 1×PBS. The ratiometric pH-RotSensors were further opsonized with 30 µg/ml IgG in 1×PBS for additional 2 hr before live cell experiments.
FRET-RotSensors
Streptavidin-Alexa568 (SAv-Alexa 568) conjugates were first synthesized following manufacturer’s instructions. The RotSensors were then incubated with 27.5 µg/ml of SAv-Alexa 568, 5 µg/ml of BSA, and 1 µg/ml of IgG in 1×PBS for 5 hr at room temperature. Unbound proteins were rinsed off with artificial lysosome solution and 1×PBS. The FRET-RotSensors were further opsonized with 30 µg/ml of IgG in 1×PBS for additional 2 hr before live cell experiments.
3.2 Magnetically Modulated Phagosome Sensors (MagSensors)
pH-MagSensors
For biotinylation, 10 µl of magnetic particles (1 mg/ml) were rinsed three times with MES buffer (50 mM, pH 6.2) and resuspended in 100 µl of MES buffer (50 mM, pH 6.2) containing 10 mg/ml EDC and 1 mM of biotin pentylamine. After 1-hr incubation at room temperature, particles were washed and resuspended into 100 µl of 1×PBS. SAv-pHrodo Red and SAv-CF640R were then mixed with the MagSensors for 1 hr at room temperature. The working concentration for SAv-pHrodo Red and SAv-CF640R was both 50 µg/ml. Finally, particles were opsonized with 1 mg/ml IgG in 1×PBS for 1 hr before live cell experiments.
FRET-MagSensors
Biotinylated magnetic particles were washed and resuspended in 1×PBS buffer containing 50 µg/ml of SAv-Alexa 568. The biotin-streptavidin conjugation was carried out for 1h at room temperature. Particles were opsonized with 1 mg/ml IgG in 1×PBS for 1 hr before live cell experiments.
4. Magnetic Tweezers Setup and Force Calibration
Magnetic tweezers were built on an inverted fluorescence microscope system (Nikon Eclipse Ti-U, Nikon, Tokyo, Japan), as shown in Figure 3—figure supplement 1A. The setup mainly includes a solenoid and a power supply. The solenoid was assembled by inserting a high permeability HyMu-80 alloy rod (Carpenter Technology, Reading, PA) into an aluminum bobbin wrapped with 600 turns of copper coil (Zahn et al., 2017) (Figure 3—figure supplement 1B). The tip of the rod has a diameter of ≈ 1 µm (Figure 3—figure supplement 1C). Position of the solenoid was controlled with a manual micromanipulator (Narishige NMN-21) to achieve independent control of its position in the x-, y-, and z-direction with a minimum graduation of 250 nm in the x-y plane and 1 µm in the z-direction. The current going through the solenoid was generated by a programmable power supply (Tekpower, Montclair, CA) with a maximum power output of 5 A.
Magnetic force was calibrated as a function of particle-to-tip distance by measuring the movements of single magnetic particles in the magnetic field. The particles were first conjugated with the CF-640R dye via EDC-mediated amine-carboxyl coupling following the manufacturer’s protocol, and then mixed in PDMS base at a concentration of ≈ 3.0 × 10⁵/ml. This low particle concentration was necessary to avoid particle aggregation and inter-particle magnetic inference (Etoc et al., 2013). The PDMS base, which has a high viscosity of 5.1 Pa·s, was chosen to slow down particle movements to make particle tracking feasible. The initial positions of the solenoid tip and of the magnetic particles were imaged in bright field before time-elapse epi-fluorescence images of particles were acquired with an interval time of 0.2 s. Working current of the magnetic tweezers was 1.0 A in the calibration. The relationship between magnetic force F(r) and particle-to-tip distance r was fitted using equation  which has the property that F(r0) = F0. F0 is a force constant with the unit of pN; r0 is a distance constant with the unit of µm; CF is unitless (Zahn et al., 2017).
5. Fluorescence Microscopy
5.1 Single-phagosome pH Assay
To synchronize particle uptake, cells were put on ice for 3 min before the addition of RotSensors and MagSensors, centrifuged at 200×g at 4°C for 30 s, and then incubated for 5 min at 37°C before live-cell imaging. Epi-fluorescence imaging was done using Nikon Eclipse-Ti inverted microscope equipped with a 1.64 N.A. ×100 TIRF objective (Nikon, Tokyo, Japan) and an Andor iXon3 EMCCD camera (Andor Technology, Belfast, U.K.). Fluorescence emissions at three wavelengths (ex: 488, 561, and 640 nm; em: 515, 586 and 680 nm) were acquired for the time-lapse multi-channel imaging.
5.2 Single-phagosome FRET-fusion Assay
Cells were cultured in serum-containing DMEM supplemented with 5 µg/ml biotin-BSA-Alexa 647 overnight. For probing phagosome-lysosome fusion, biotin-BSA-Alexa 647 was chased in serum-containing DMEM 2 hr before live cell imaging to ensure its accumulation in lysosome compartments, following previously reported protocols (Becken, Jeschke, Veltman, & Haas, 2010; Jeschke & Haas, 2018; Jeschke et al., 2015). Cells were then prepared the same way for synchronized particle uptake as single-phagosome pH assay. Time-lapse multi-channel epi-fluorescence images were acquired to record fluorescence emission of donor Alexa 568 (ex/em 561/586 nm), acceptor Alexa 647 (ex/em 561/680 nm), and the 100 nm green fluorescence particle (ex/em 488/515 nm). Image acquisition rate was 2 s/frame and 7 s/frame for RotSensors and MagSensors, respectively. A slight spectral overlap was observed that a low level of fluorescence emission of Alexa 568 under the excitation of 561 nm leaked into the acceptor emission channel (680 nm). Because this crosstalk was constant during imaging, it was measured and subtracted from the acceptor emission signal. Following previous protocol (Kaufmann, Goldman, & Krise, 2009), the FRET ratio was calculated as the ratio of the emission intensity of acceptor after crosstalk subtraction Iacceptor to the emission of intensity of the donor Idonor at the donor excitation (561 nm). In the FRET-ratio-vs-time plot, the slope of the increment portion of the FRET ratio curve, named FRET rate, was used for the quantification of phagosome-lysosome fusion rate (Figure 2—figure supplement 2).
5.3 Fluorescence Labeling and Imaging
RAW 264.7 macrophages were plated on 35 mm glass coverslips overnight before immunofluorescence staining. Cells were washed with 1× PBS and fixed with 2% PFA at room temperature for 5 min, permeabilized with 0.1% Triton X-100 at room temperature for 5 min, blocked with 2% BSA at room temperature for 1 hr, and stained with 2 µg/mL Alexa Fluor 488 anti-tubulin-α antibody and 2 µg/mL Alexa Fluor Plus 647 phalloidin for 1 hr. Super-resolution structured illumination microscopy (SIM) images of immunostained α-tubulin and F-actin were acquired using a DeltaVision OMX SR imaging system equipped with a Olympus Plan Apo 60×/1.42 PSF objective and a sCMOS camera. To label lysosomes with biotin-BSA-Alexa 647 and Lysotracker, biotin-BSA-Alexa 647 was chased in RAW 264.7 macrophage for 1.5 hr. Cells were then incubated with 50 nM Lysotracker Green DND-26 for 30 min. After that, cells were rinsed twice with Ringer solution to remove the remaining dye and imaged using Re-scan Confocal Microscopy (RCM) equipped with a 1.64 N.A. ×100 TIRF objective and ORCA-fusion CMOS camera.
5.3 Images Analysis
(1) Image Registration
Image registration was done to correct for the optical shift between different imaging channels. 100 nm TetraSpeck fluorescent particles (Ex/Em: 360/430 nm, 505/515 nm, 560/580 nm, and 660/680 nm) were adsorbed on polylysine-coated coverslips at a surface density of ≈ 0.10 bead/μm2 and used as markers for image registration. After sequential imaging of the marker particles in three channels (Ex: 488, 561, and 640 nm), an affine transformation (in ImageJ) was applied to align particle localization maps from 488 and 640 nm channels (termed target images) to that from the 561 nm channel (reference image). A global mapping matrix was obtained to record all the transformation steps and used to apply the same operations to all images.
(2) Single-Particle Localization and Intensity Determination
The centroids of single particles in epi-fluorescence images were localized using a Gaussian-based localization algorithm in the ImageJ plugin Trackmate. To measure the emission of CF640R and pHrodo Red on pH-RotSensor and pH-MagSensor, pixel intensities within a radius of 2 μm from the localized centroid of the particle were integrated and background-corrected using custom MATLAB algorithms. Same procedure was carried out for determining Idonor and Iacceptor during phagosome-lysosome fusion assay. To determine the localization uncertainties, RotSensors were immobilized on glass coverslips and imaged for 200 consecutive frames. Localization uncertainty was defined as the standard deviation of the tracked particle positions in x-and y-coordinates. The localization uncertainties of the 1 µm and 100 nm particles were determined to be 20.64 ± 4.05 nm and 13.12 ± 2.32 nm, respectively (Figure 1—figure supplement 11).
(3) Translational and Rotational Tracking Analysis of RotSensors
The single particle tracking analysis was done as described previously (Sanchez, Yi, & Yu, 2017; Y. Q. Yu et al., 2018). Briefly, translational velocity was determined from the centroid location of the 1 μm red fluorescent particle (Xred,Yred) as a function of time. For rotational tracking, a vector was drawn from the centroid of the 1 μm red fluorescent particle (Xred,Yred) to that of the 100 nm yellow-green particle (Xgreen,Ygreen) belonging to the same RotSensor. Orientation of the vector was obtained as the in-plane angle, φ, for the single RotSensor. The length of the vector was used to calculate the out-of-plane angle, θ, using the equation below:
 where d is the projection inter-particle distance between a pair of green and red dots in each given image, and r is the physical inter-particle distance. Because r varies slightly from one particle to another due to the size distribution, r was obtained as the maximal projected inter-particle distance dmax when a RotSensor samples all possible orientations and the dmax was larger than 550 nm. In cases when dmax < 550 nm, r was set to 550 nm. Rotational velocity was determined from the rotation matrix derived from φ and θ at consecutive frames.
(4) Intracellular pH Calibration
The intracellular pH calibration of pH-RotSensors and pH-MagSensors was done following a previously published protocol (Naufer et al., 2018). Macrophages seeded on glass coverslips were pretreated with 10 µM concanamycin in Ringer’s solution for 10 min before the addition of particles and then incubated at 37°C for 10 min to promote particle phagocytosis. Cell medium was replaced with potassium-rich buffers at different pH values. All buffers contain 20 µM of nigericin, but different buffering agent: 5 mM sodium citrate for pH 4.5, 5 mM MES for pH 5.5, and 5mM HEPES for pH 6.5 and 7.3. The pH calibration was done from pH 7.3 to 4.5. For each pH, cells were rinsed twice with the correspondingly buffer and allowed to equilibrate for 5-10 min before image acquisition. Fluorescence emission of the pHrodo Red at 586 nm (IpHrodoRed) and reference dye CF640 at 680 nm (Iref) was obtained at various pH and background-corrected to obtain ratiometric pH calibration plots (Figure 1—figure supplement 2). In live cell imaging, pH calibration was done for individual internalized pH-RotSensors and pH-MagSensors to eliminate the effect of particle-to-particle variation in their pH responses. In brief, the ratiometric emission of the pH-RotSensors and pH-MagSensors before acidification was obtained as IpHrodo/Iref at pH 7.3 in each cell sample. After live cell imaging, the same cell sample was incubated in pH 4.5 potassium-rich pH calibration buffer containing 20 µM of nigericin to obtain the ratiometric emission (IpHrodo/Iref) at pH 4.5. An internal calibration curve was generated and fit onto a linear function that relates the ratiometric emission (IpHrodo/Iref) of the pH-RotSensor and pH-MagSensor at pH 4.5 and pH 7.3. The resulting linear function was used to convert the ratiometic fluorescence measurements to luminal pH values for that series.
(5) Image Analysis of the Recruitment of Rab5, Rab7, actin, and PI3P marker
The accumulation of Rab5-GFP around the particle-containing phagosome was analyzed using ImageJ and MATLAB. The following protocol is written using Rab5-GFP as an example, but the same method was applied for analyzing other proteins including Rab5-RFP, actin-GFP, Rab7 GFP and p40PX-GFP. In brief, we first localized the centroid position of the particle in ImageJ. Two circular masks, one with a radius of 1 μm and the other 1.5 μm, were applied and centered at the localized centroid of the particle (Figure 5—figure supplement 5). The average GFP intensity of all pixels located within the inner circular mask (1 μm radius) was obtained as the signal, and the average fluorescence intensity of all pixels located between the inner and outer circular masks was obtained as the local cytosolic background. The average Rab5-GFP intensity recruited to the phagosome was then obtained by subtracting the cytosolic background from the signal. In order to compare the duration of Rab5-GFP recruitment between different phagosomes imaged in different cells (as in Figure 5C and Figure 5—figure supplement 1), we normalized the measured arbitrary intensities of Rab5-GFP to the obtained maximum intensity value in each cell. Same imaging analysis was applied to other proteins including Rab5-RFP, actin-GFP, Rab7-GFP and p40PX-GFP.
(6) Transmission Electron Microscopy
Cell samples for TEM imaging were prepared based on a previously reported protocol with slight modification (Sanchez et al., 2017). Particle sensors were incubated with cells for 50 min at 37 °C before trypsinization. After centrifugation, the cell pellet was fixed on ice for 1 hr by using a mixture of 2.5% (w/v) glutaraldehyde and 1% (w/v) osmium tetroxide in 1×PBS buffer. Subsequently, the pellet was stained in 0.5% (w/v) uranyl acetate aqueous solution for 12 hr on ice. Cell pellets were dehydrated sequentially in a series of ice-cold aqueous solutions containing 30% (v/v), 50%, 75%, 90%, 95% and 100% ethanol for 5 min each. Dehydration in 100% (v/v) ethanol was repeated three times at room temperature. The dehydrated cell pellet was immersed sequentially in resin infiltration solutions that contain ethanol and Spurr’s resin at various volume ratio (ethanol: resin, 2:1, 1:1 and 1:2) for 30 min each at room temperature. Cells were cured in 100% resin for 18 hr at 65°C prior to microtome sectioning. Sections were stained with 2% (w/v) uranyl acetate for 10 min before imaging. Samples were imaged with a JEOL JEM-1010 Transmission Electron Microscope (Electron Microscopy Center, Indiana University).
Data Availability
All data generated or analyzed during this study are included in the manuscript. Source data that were used to generate Figures 1D-I, 2B-F, 3B-F, 4A-B, and 5A-H, 6A-D and 7A-C have been deposited on Figshare (Y. Yu, 2021).
Figures and figure supplements
Line plots showing the fluorescence emission intensity vs. time of pHrodo Red and CF640R on a representative RotSensor during phagosome acidification.

Representative intracellular pH calibration curves for 16 RotSensors in phagosomes. The fluorescence emission ratio IpHrodo/Iref at each pH was normalized to that at pH 7.3. Black lines indicate linear fittings of the data. An average R2 value of 0.98 ± 0.02 was obtained from the individual linear fittings.

Characterization of the tightness of phagosome membrane wrapping around internalized particle sensors. Inset is a representative TEM image showing particle sensors encapsulated inside phagosomes. Fraction of occupied area is defined as the ratio of the area occupied by the particle sensor to the total area of the phagosome in each given TEM section.
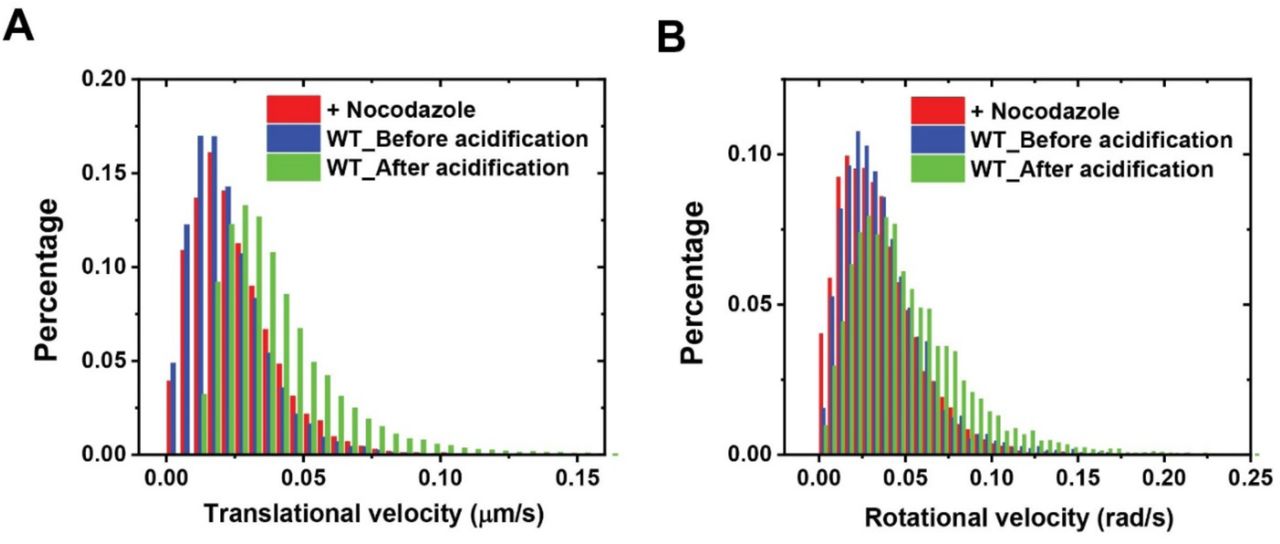
Histograms showing the distribution of (A) translational and (B) rotational velocities of phagosomes in control cells (WT) and cells treated with nocodazole, a microtubule-depolymerizing reagent. Data were obtained from 8 individual phagosomes from nocodazole-treated cells and 30 phagosomes from control cells.

The acidification (A) and translational velocity (B) of a representative phagosome in nocodazole-treated cell. Thick line in (B) indicates data after wavelet denoising.

Phagosome dynamics and acidification in resting and activated actin-GFP macrophage cells. (A) Fluorescent images showing subcellular locations of RotSensor-containing phagosomes at different time points in actin-GFP expressing cells. Scale bar, 2 µm. (B-D) Plots showing the normalized actin-GFP intensity (B), translational velocity (C), and pH (D) of the phagosome shown in (A) as a function of time. In (C), the blue shade indicates the actin-to-microtubule transition period (T1). In (D), the thick red line indicates pH after sigmoidal-Boltzmann fitting. The red shade indicates pH standby time (T2). (E) Scatter plot showing actin-to-microtubule transition time against pH standby time of single phagosomes in the activated and resting actin-GFP macrophage cells. The thick blue line indicates a linear fit to the data points from activated cells, which has a Pearson’s coefficient of 0.44. (F) Box plots showing the time difference between actin-to-microtubule transition time and pH standby time (T2-T1) for activated and resting actin-GFP macrophage cells. Each box plot indicates the mean (horizontal line) and the interquartile range from 25% to 75% of the corresponding data set. NS represents not significant.

(A-D) Scatter plots showing acidification rate and final pH of single phagosomes plotted separately against their translational and rotational velocity during rapid acidification period in control cells (WT) and cells treated with nocodazole. (E) Acidification, translational velocity and rotational velocity profiles of a slow-moving phagosome indicated by the arrows in (B) and (D).

Acidification profiles of two phagosomes from a same cell. The pH-time plot of phagosome B is fitted with sigmoidal-Boltzmann function (shown as thick red line) to determine the acidification rate, the beginning (tinitial) and the end (tfinal) of the rapid acidification.

Structured illumination microscopy (SIM) images showing immunostained actin (shown in red) and microtubules (green) in resting (A) and activated (B) macrophages. Scale bars, 10μm.

Scatter plots showing acidification rates against average translational (A) and rotational (B) velocities of single phagosomes during their rapid acidification period in activated and resting macrophages. Black lines indicate linear fitting to the data. Pearson coefficients are 0.68 and 0.69 for the fitting in (A) and (B), respectively.

Histograms showing localization uncertainties for tracking the two particle components in a single RotSensor: the 100 nm yellow-green nanoparticle and the 1 μm pHrodoRed-coated particle.

Re-scan confocal microscopy (RCM) images showing the colocalization of Lysotracker Green with intracellular organelles containing BSA-Alexa647 in activated RAW 264.7 macrophage cells. Scale bar, 10μm.

Plots showing (A) FRET ratio vs. time and (B) translational velocity of two phagosomes within a single cell. Slope of the linear portion of each plot in (A), as indicated by the thick blue and red lines, was obtained as FRET rate. Dark lines in (B) are velocities values after wavelet denoising.

Scatter plots showing FRET rate against the average translational (A) and rotational (B) velocities of single phagosomes during phagosome-lysosome fusion in cells with or without nocodazole treatment.

Magnetic tweezers setup. (A) Picture of the magnetic tweezers setup installed on an inverted Nikon microscope. (B) Picture of the solenoid. The metal core is inserted into an aluminum bobbin wrapped with copper coils. (C) Bright-field image of the solenoid tip.

Extracellular pH calibration of MagSensors. Fluorescence intensity of pH-indicator pHrodo Red (A) and reference dye CF640R (B) on individual MagSensors is plotted against pH in aqueous buffer solutions. Each curve represents data from a single MagSensor and a total of 15 particles were analyzed for each sample. (C) The fluorescence intensity ratio of pHrodo Red and CF-640R of individual MagSensors was calculated and averaged to obtain a pH calibration plot in aqueous buffer solutions. Error bars are standard deviations from 15 individual MagSensors. R2 value of the linear fitting is 0.99.

Distribution of estimated magnetic force exerted on individual phagosomes at the beginning (A) and the end of experiments (B). The average magnetic force exerted at the beginning and the end of magnetic pulling was around 21 pN and 31 pN, respectively.
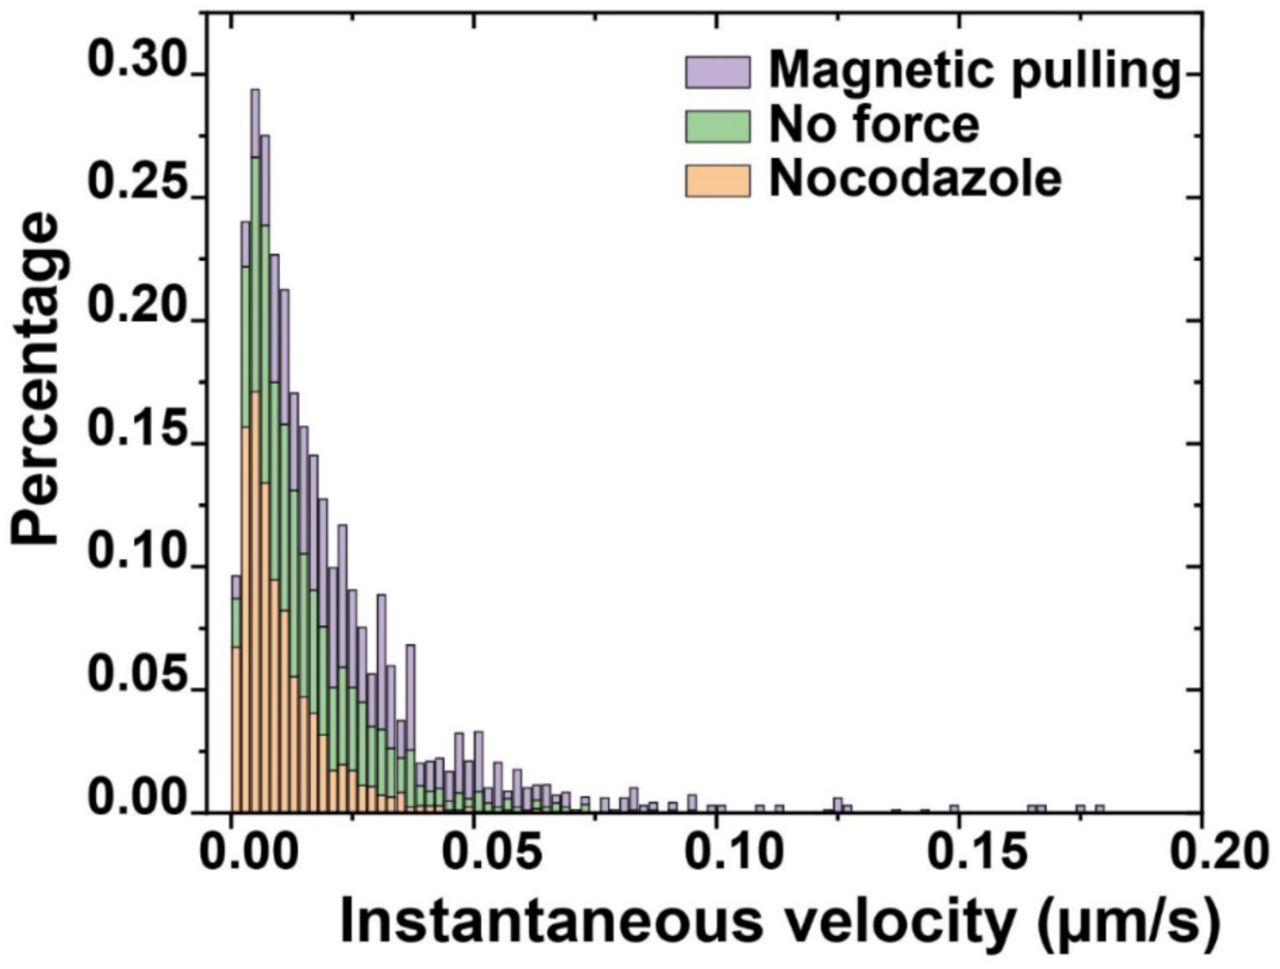
Histograms showing the distribution of instantaneous velocities of phagosomes in resting RAW264.7 macrophage cells under different experimental conditions: without or with magnetic pulling, and after nocodazole treatment. Each set of data includes results from 5 individual phagosomes from 5 cells.

Acidification profile of representative single phagosomes after nocodazole treatment without (A) or with (B) magnetic pulling. Each pH-time curve is fitted with sigmoidal-Boltzmann function.

Data showing normalized fluorescence intensity vs. time for actin-GFP and Rab5-RFP on phagosomes obtained from dual-channel simultaneous imaging. Fluorescence intensity of actin-GFP and Rab5-GFP was separately normalized based on its cytosolic background. Each plot is an average of results from 9 independent phagosomes and error bars indicate standard deviations.
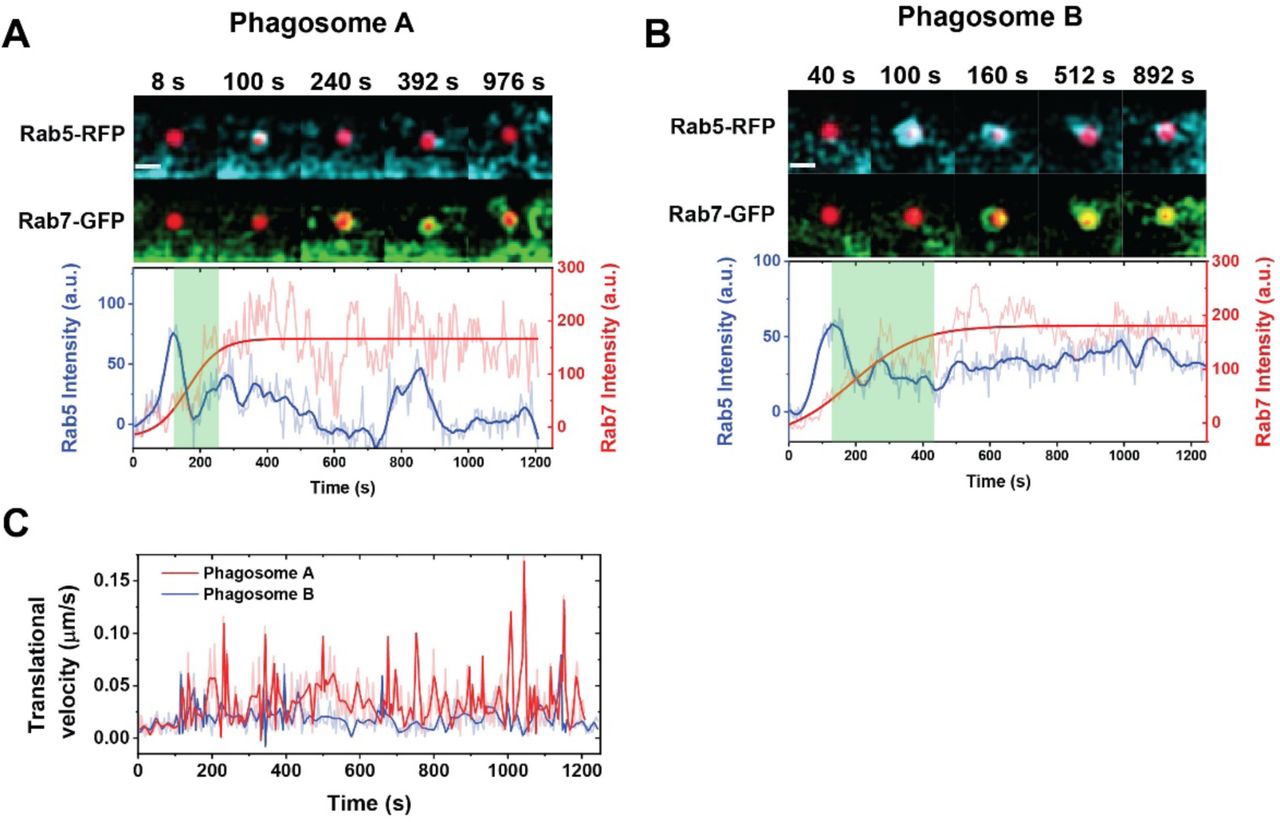
(A-B) Fluorescence images and intensity plots showing the dynamic distribution of Rab5-RFP and Rab7-GFP around two phagosomes within the same cell. The fluorescence images show the overlay between pH-sensor (red) with Rab5-GFP (cyan) and Rab7-GFP (green) separately. Scale bars, 2 µm. The green shades in the fluorescence intensity vs. time plots indicate the duration of Rab5-to-Rab7 transition that begins at the Rab5-RFP intensity peak and ends at the onset of Rab7-GFP intensity plateau determined by sigmoidal-Boltzmann function fitting. (C) Data showing the translational velocities vs. time for phagosome A and B as indicated. Dark lines are velocities values after wavelet denoising.

Plots showing normalized fluorescence intensity of Rab5-GFP (A) and phagosome pH (B) as a function of time. Each curve represents data of a single phagosome. In (A) and (B), data of three representative phagosomes are highlighted in red, blue, and green. In (B), thick lines are sigmoidal-Boltzmann function fitting to the individual phagosome acidification profile.
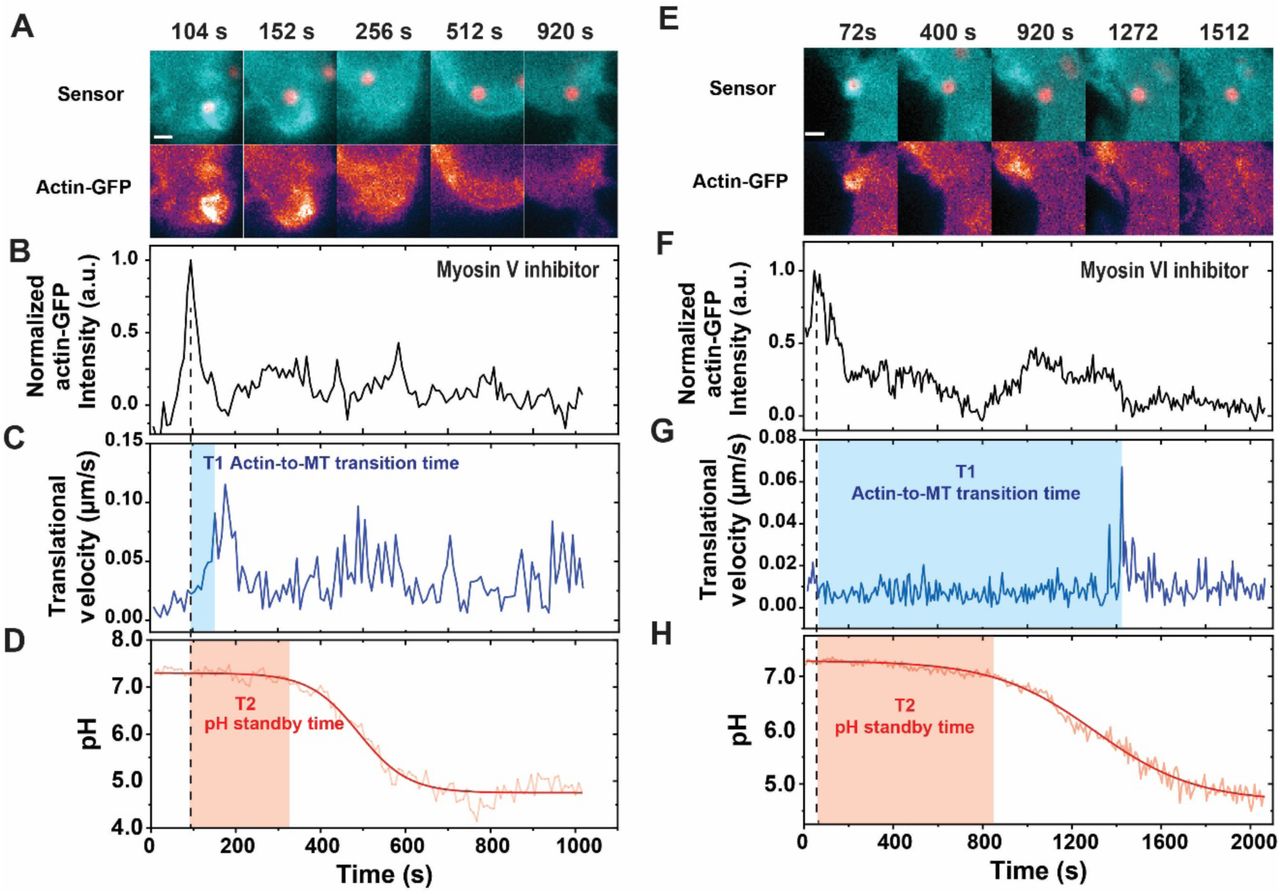
Phagosome dynamics and acidification after Myosin V (A-D) and Myosin VI inhibition (E-H). (A and E) Fluorescence images showing subcellular locations of two single phagosomes at various time points in actin-GFP expressing macrophage cells. Scale bar, 2 µm. (B and F) Plots showing normalized fluorescence intensity of actin-GFP around the phagosome of interest as a function of time. (C and G) Translational velocities of the two phagosomes of interest are plotted as a function of time. The blue shades indicate the actin-to-microtubule transition period (T1). (D and H) Plots showing pH vs. time for the two phagosomes of interest. The red shades indicate pH standby time (T2).

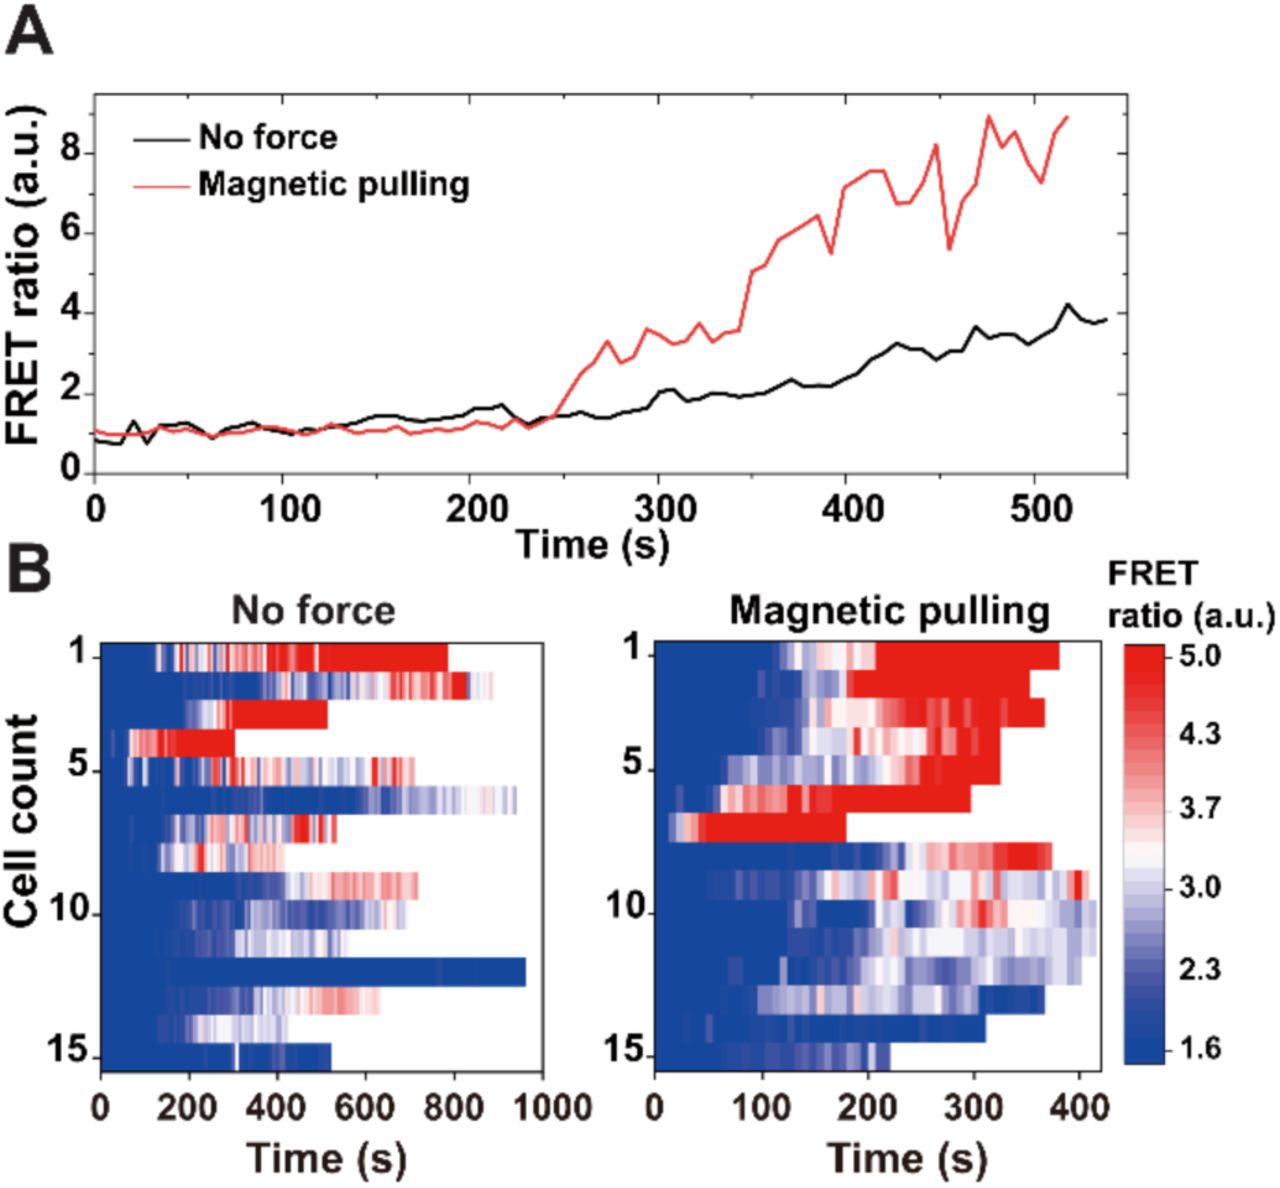
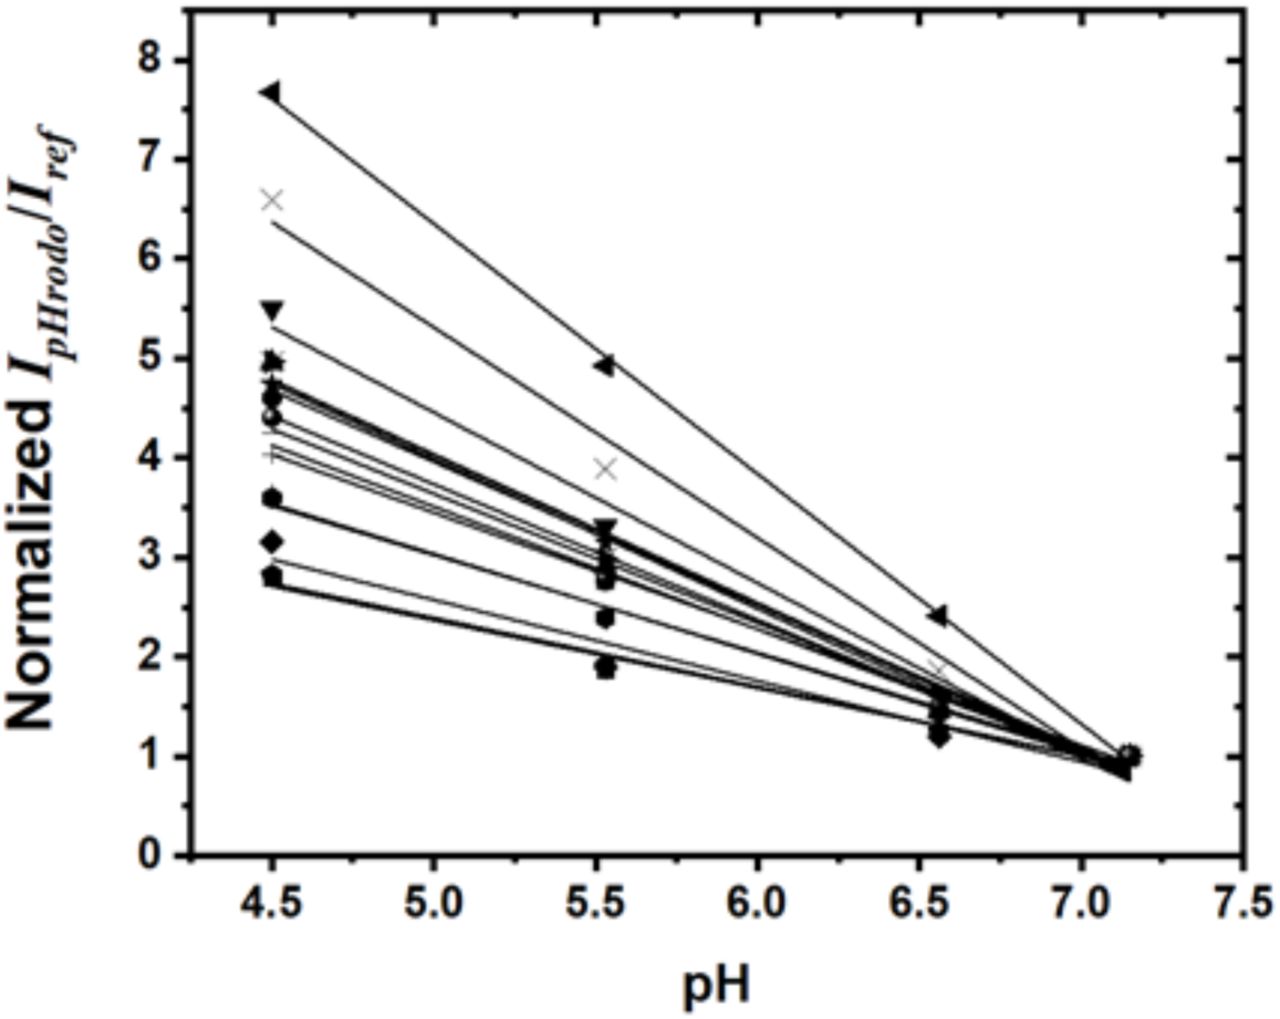
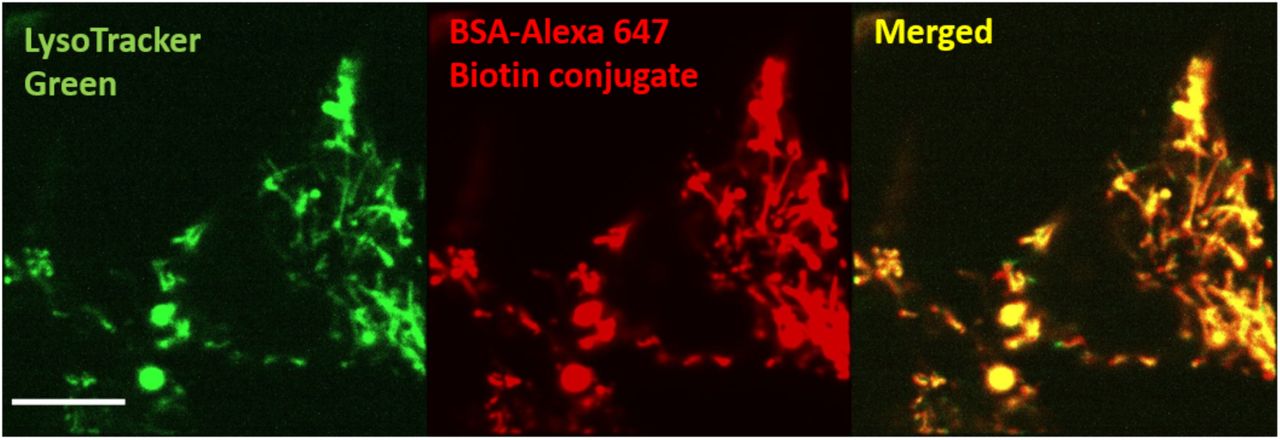
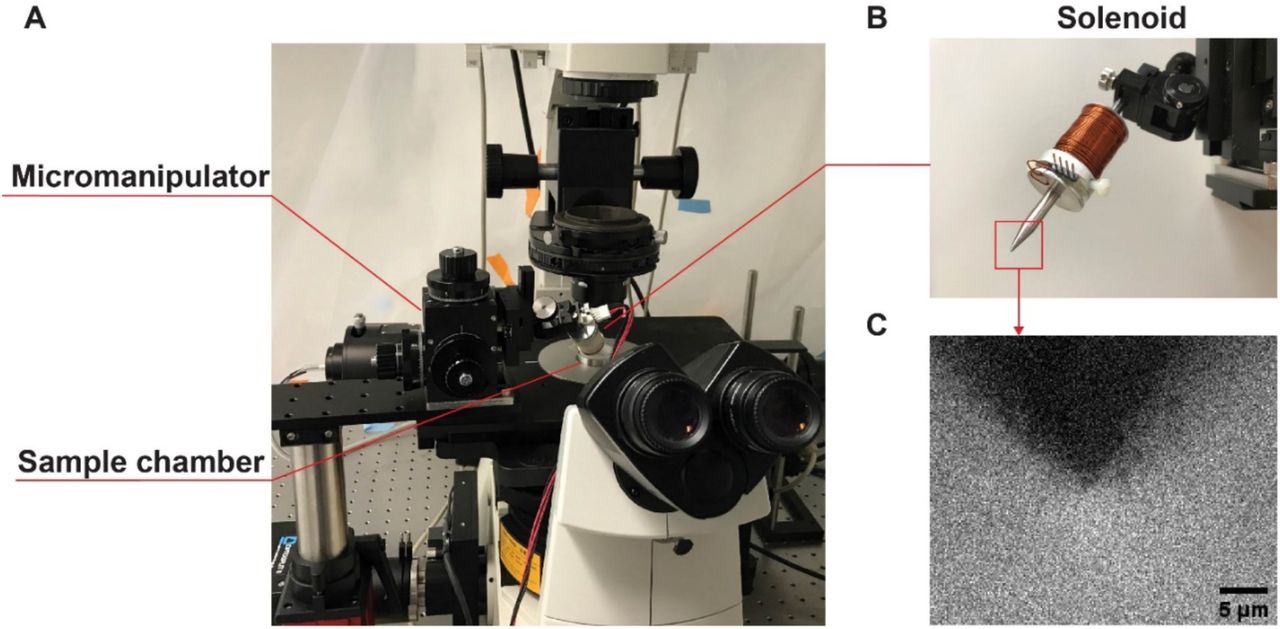
Recruitment of Rab5 on phagosomes differs with subcellular locations. (A) A representative 3D intensity histogram showing inhomogeneous fluorescence distribution of Rab5-GFP in an activated RAW 264.7 macrophage cell (in this case Rab5-GFP). (B) To quantify intensity of Rab5-GFP on single phagosomes and its cytosolic background, two circular masks, indicated as mask 1 and mask 2, were super-imposed on the localized phagosome. The average pixel intensity within circular mask 1 was obtained as signal, and that in between circular mask 1 and 2 was obtained as cytosolic background level. Scale bar, 1 µm. (C) Plots showing the Rab5-GFP intensity after background subtraction for the two phagosomes of interest shown in (A).
Acknowledgments
We thank Prof. Sergio Grinstein at University of Toronto for his helpful discussion. We thank Mr. Andy Alexander at the Electronic Instrument Services of Indiana University for assistance with the setup of magnetic tweezers. We thank Dr. Barry Stein at the IUB Electron Microscopy Imaging Center, Dr. Jim Power at the IUB Light Microscopy Imaging Center (LMIC), Dr. Yi Yi at the Nanoscale Characterization Center for assistance with instrument use. The development of single-particle rotational tracking method was supported by the National Science Foundation, Division of Chemical, Bioengineering, Environmental, and Transport Systems under Award No. 1554078. All other research reported in this publication was supported by the National Institute of General Medical Sciences of the NIH under Award No. R35GM124918 (Y. Y.). G.F.W.W. is supported by a Vanier Canada Graduate Scholarship (CIHR). The content is solely the responsibility of the authors and does not necessarily represent the official views of the NIH.
Footnotes
Competing Interest Statement: The authors declare no conflict of interest.
References


