

Abstract
Purpose Characterize how metabolic function in the murine retina and retinal pigment epithelium-choroid-sclera (eyecup) complex is impacted by natural aging.
Methods We examined scotopic and photopic visual function of young (3-6 months) and aged (23-26 months) C57Bl/6J mice using electroretinograms (ERGs). Metabolic changes in retina and eyecup explants were characterized by measuring uptake and usage of U-13C-glucose or U-13C-glutamine at different timepoints by gas chromatography-mass spectrometry (GC-MS), measuring oxygen consumption rate (OCR) using a perifusion apparatus, and determining ATP levels with a bioluminescence assay.
Results Scotopic and photopic ERG responses declined in aged mice. Glucose metabolism, glutamine metabolism, OCR, and ATP pools in retinal explants were mostly unaffected by the age of the mouse. In eyecups, glutamine usage in the Krebs Cycle decreased while glucose metabolism, OCR, and ATP pools remained stable.
Conclusions The ex vivo approach in our study to examine aging glucose and glutamine metabolism in retina and RPE showed negligible impact of age on retina and an impairment of glutamine anaplerosis in eyecups. The surprising metabolic stability of these tissues ex vivo suggests age-related metabolic alterations in these tissues may not be intrinsic. Future experiments should focus on determining whether external factors including nutrient supply, oxygen availability, or other structural changes influence ocular metabolism in vivo.
Introduction
Aging is associated with vision loss which contributes to disability and reduces quality of life1,2. Over the course of physiological aging, tissues in the eye exhibit functional decline. The retinal pigment epithelium (RPE) accumulates lipofuscin and drusen, Bruch’s membrane thickens, and overall cellular organization decreases3–8. These alterations are also characteristic of age-related macular degeneration, a severe disease associated with aging that is a leading cause of vision loss2,9–12.Within the neural retina, mitochondria are damaged13–15, synaptic connections between cells deteriorate16,17, and the functional capacity of photoreceptors is compromised.
In mice and humans, scotopic and photopic electroretinograms (ERGs) decline with age18–21. Manipulating metabolism ex vivo directly influences ERG response22. Increasing evidence suggests there is extensive metabolic interplay between the highly glycolytic retina and the retinal pigment epithelium23–25 and that metabolic changes in RPE can affect the retina. Increasing or disrupting glucose conduction in the RPE can result in retinal degeneration26–28. Similarly, aging represents a form of gradual, natural decay that impacts the eye. Metabolic changes are a hallmark of aging29 in many tissues. Although steady-state metabolite levels differ in tissues isolated from young and middle-aged mouse eyes18, to our knowledge the cross-talk between aging and central energy metabolism in the mammalian retinal ecosystem has not been examined. When characterizing age-related metabolic changes, it is not always clear whether the observed alterations are intrinsic to the tissue, or due to differences in vascularization or nutrient availability. An ex vivo approach to metabolic characterization30 can facilitate the identification of intrinsic metabolic changes.
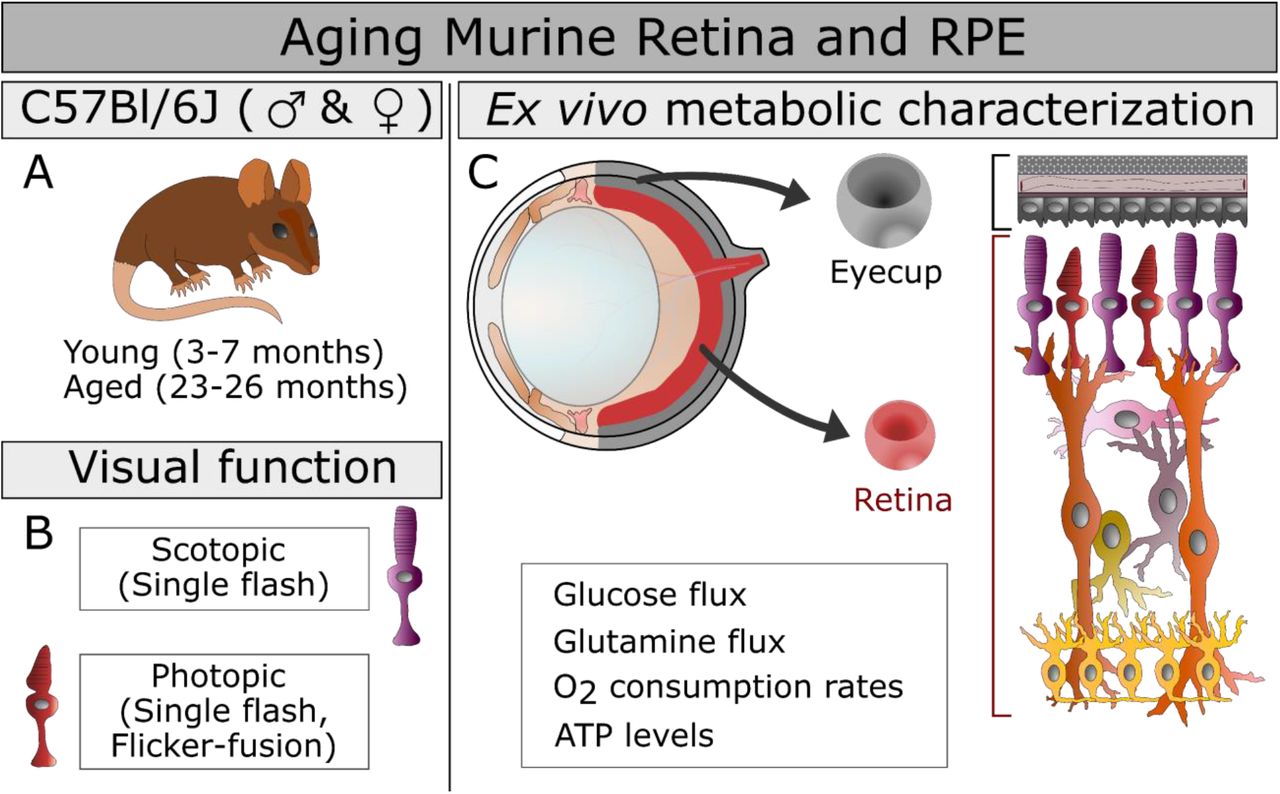
To investigate the relationship between functional decline and energy metabolism in aging retina and RPE (Study structure in Figure 1), we measured visual function in vivo by ERG and interrogated intrinsic alterations of metabolism by analyzing ex vivo tissue explants using stable isotope tracers and targeted metabolomics.

The study design is presented including the mouse groups, ages, and sex (A), the measures of visual function employed (B), and the ex vivo approaches to characterizing metabolism (C) in the aging eye. The functional metabolic measurements are listed below the structure of the murine eye (C, top left) from which we isolated two explants in this study (C, center): the retina RPE-choroid complex that includes the RPE, choroid, and sclera that has been cleared of connective tissue (Eyecup). The cellular composition of these explants (C, right) is highlighted with retinal cells shown in shades or red, purple, orange and yellow, while the eyecup is shaded in variations of gray.
Methods
Mouse ages, origin, and housing
C57Bl/6J mice of both sexes were obtained from the National Institute of Aging aged rodent colony (Bethesda, MD) and Jackson Laboratories (Bar Harbor, ME; Stock No: 000664). Young (3-7 months) and aged (23-26 months) mice were housed in groups of 5 or less in vivariums with ad libitum access to food (Rodent Diet 5053) and water. Some aged male mice were treated with saline via osmotic minipumps or provided water by bottle for 8 weeks prior to euthanasia as controls for separate studies unrelated to the eye. No differences were observed in ocular metabolism between untreated and control mice. Mice were confirmed free of the Crb1 mutation found in Rd8 models of retinal degeneration31,32. The light/dark cycle was 14 hours of light and 10 hours of dark. Experiments complied with the policies of the Animal Care and Use Committee at the University of Washington and the ARVO Statement for the Use of Animals in Ophthalmic and Vision Research.
Electroretinogram (ERG) set-up
Mice were dark adapted overnight, anesthetized with isoflurane, and eyes dilated with 2.5 % phenylephrine (Akorn, Inc; NDC 174780201-15) and 1% tropicamide (Bauch + Lomb; NDC 24208-585-64). Gold electrodes were placed on each cornea. A reference and ground electrode were positioned on the back of the head. Mice were placed inside a UTAS Visual Diagnostic System with BigShot Ganzfeld with UBA-4200 amplifier (LKC Technologies; Gaithersburg, MD). Readings were taken from both eyes whenever possible, and the eye with the best response was analyzed.
Single-flash ERGs
Recordings were elicited using flashes of LED white light at increasing flash intensities with two minute pauses between individual flashes under scotopic (−50 to 50 dB) and photopic (0 to 100 dB flashes, 30 cd/m2 background light) conditions. Readings were calibrated such that 0 db = 2.5 cd*s/m2. The a-wave amplitude was measured 8 ms after flash stimulus. The b-wave amplitude was measured as the magnitude from the a-wave minimum to the b-wave maximum.
Flicker-fusion ERGs
Temporal resolution was measured using a 5 db flash of varied frequencies (20-50 Hz) under photopic conditions. Ten second pauses were taken between frequencies and repeated 9 times each.
Measurements were taken at 0.5 s intervals for a total of 512 points in 0.255 s (sampling frequency = 2003.91 samples/s). At each frequency, replicates were averaged. Figure 2E and 2F show examples of these raw values at 37 Hz. A waveform was generated and the magnitude calculated using Fast Fourier Transform (Microsoft Excel Data Analysis ToolPak). The sampling frequency was 2003.9 samples/s and the step value was 3.91.

Single-flash ERGs were used to assess scotopic and photopic function in the retina. The averaged scotopic response curve in response to a 50 db flash (A) and the resulting a-wave amplitude from −50 to 50 db light at 8 ms after the flash (B) show a decline in the response of rod circuitry with aging. Sample sizes are 8 for young and 9 for aged. In photopic conditions (Background light of 30 cd/m2), the average response curve to a 50 db flash (C) and the resulting b-wave amplitude from flashes of 0 to 100 db (D) show a decline in the response of cone circuitry with aging. Sample sizes are 12 for young and 9 for aged. Photopic function and temporal resolution were examined with a 5 db flash which flickered between frequencies of 20-50 Hz. The averaged response to 5 db light flickering at 37 Hz is shown for young (E) and aged animals (F). The young have a more uniform and stronger response to equivalent stimuli than aged animals. Aging decreased the magnitude of the response at equivalent frequencies (G) as calculated by Fast Fourier Transform. Sample sizes are 8 for young and 9 for aged. Panels show the average ± standard deviation. Normality of data was determined using the Shapiro-Wilk test and p-values were calculated using unpaired t-tests (* = p < 0.05) or Mann-Whitney tests (# = p < 0.05, marker of non-significance enclosed in parentheses).
Isolation of retinas and eyecups
Animals were euthanized by awake cervical dislocation. Eyes were enucleated, cleared of excess tissue, and the retina separated from the RPE-choroid-sclera complex (eyecup) in Hanks’ Balanced Salt Solution (Gibco; Grand Island, New York). Tissues for ATP determination were snap frozen and stored in liquid nitrogen. Those for flux or OCR were used immediately.
Metabolic flux and metabolite extraction
Metabolite standards and buffer components were purchased from Sigma-Aldrich (MilliporeSigma; St. Louis, MO). Product numbers are included in Supplementary Table 2. Incubation medium was formulated as follows:
Krebs’s Ringer Buffer (KRB): 98.5 mM NaCl, 4.9 mM KCl, 1.2 mM KH2PO4, 1.2 mM MgSO4, 20 mM HEPES, 2.6 mM CaCl, 25.9 mM NaHCO3
Either 5 mM U-13C glucose alone or 5 mM unlabeled glucose and 2 mM U-13C glutamine U-13C metabolic tracers (99% isotopic purity) included 13C labeled D-Glucose and L-Glutamine (Cambridge Isotope Laboratories, Inc; Tewksbury, MA). Incubations, tissue extractions, and media extractions were performed as described previously30 with minimal changes. Some samples were split in half by volume before drying. All samples were spiked with methylsuccinate, L-norvaline, or L-norleucine as process and instrument controls. Metabolites were stored at −80°C until analysis.
GC-MS analysis
Metabolite standards between 1.25-35 μM were used to generate calibration curves. The derivatization and selected ion monitoring (SIM) methods have been described in detail30 with few changes. The incubation length with N-tertbutyldimethylsilyl-N-methyltrifluoroacetamide (MilliporeSigma; St. Louis, MO) was increased to 60 minutes. Samples were analyzed using a 49 minute gradient on an Agilent 7890/5975C GC-MS system (Agilent Technologies; Santa Clara, CA). Two Agilent columns were used: a DB-5MS (128-5522) and an HP-5MS (19091S-433I) with flow rates of 0.8 mL/min or 1 mL/min, respectively. For all derivatized metabolites, we used target ions for quantification and isotopologue distribution determination, and a qualifier ion for identity confirmation. Supplementary Table 2 describes SIM method details for individual metabolites. Peak areas for SIM ions were obtained in MSD Chemstation (Agilent Technologies; Santa Clara, CA) with manual verification of automated peak integrations. IsoCor v2 was used33,34 to correct for natural 13C abundance and determine percent enrichment of 13C. In individual metabolite isotopologues, the number of incorporated 13C is represented shorthand by “Mx”, where x is the number of 13C (M0, M1, M2, etc.).
Oxygen consumption rate
For each replicate, two retinas or four eyecups were quartered and loaded into a perifusion system that assesses oxygen consumption as described35,36 with minimal changes. Tissue was perifused with Krebs-Ringer buffer maintained at equilibrium with 21% O2, 5% CO2, and 74% N2 by an artificial lung and supplemented with 0.1 g/100mL BSA, 1X antibiotic-antimycotic (Gibco; Grand Island, NY), and 5 mM glucose. Succinate (5 mM) was added when testing mitochondrial function. Flow rate over live tissue averaged 61.9 ± 5 μL/minute. OCR was calculated as the product of flow rate times the difference in outflow and inflow oxygen levels. Data was reported as a change in OCR after subtracting off the baseline OCR measured in 5 mM glucose alone.
ATP measurements
The pool of ATP in retinas and eyecups extracted in boiling water37 was measured via luminescence with the Molecular Probes® ATP Determination Kit per the manufacturer’s instructions. Values were normalized to protein content in the pellet and supernatant.
Protein concentration for normalization
Protein pellets were solubilized in RIPA buffer (150 mM NaCl, 1% Triton X-100, 0.5% sodium deoxycholate, 0.1% SDS, 50 mM Tris pH 8.0, 1X HALT protease/phosphatase inhibitor) and quantified using the Pierce™ BCA Protein Assay Kit per manufacturer’s instructions.
Grouping and statistics
Sample collection from young and aged groups occurred at different times. Sample sizes represent biological replicates. Extractions, derivatization, and sample runs were processed in batches including both ages, genders, matched retinas, eyecups, and/or their media, and random timepoints. To account for circadian contributions, the time of death for animals used in glucose flux, glutamine flux, and OCR are plotted in Supplementary Figure 1. Normality of data was determined using the Shapiro-Wilk test. Differences between young and old animals were examined using unpaired t-tests (Indicated with ns or *) or Mann-Whitney tests (Indicated with (ns) or #), and those associated with age and sex were considered using Kruskal-Wallis and Dunn’s multiple comparison tests. Values that did not reach statistical significance are marked “ns”.
Results
Scotopic and photopic vision declines in aging mice
We recorded ERGs under scotopic and photopic conditions in young (4-5 months) and aged (26 months) male mice. Single flash scotopic ERGs measured rod-mediated vision. The amplitude of the a-wave was extracted from raw traces (Figure 2A) 8 msec after the flash and averaged (Figure 2B). Responses declined significantly between young and aged mice at −30 db and between 0-50 db. This is consistent with previous findings that a-waves decline in mice as early as 16 months18,19.
Cone-mediated vision was characterized by examining the b-wave amplitude in raw traces (Figure 2C) in single-flash photopic ERGs. The b-wave amplitude declined significantly in aged animals relative to young (Figure 2D) at the flash intensities tested. Temporal resolution was considered by flicker-fusion ERG, which used a 5 db flashing light at frequencies between 20-50 Hz. An overall loss in temporal resolution was seen in the raw responses. Examples of averaged responses at 37 Hz are shown from young (Supplementary Figure 1A) and aged (Supplementary Figure 1B) mice. After Fast Fourier Transformation, the response magnitude was found to decline in aging (Figure 2E, main panel). Although the degree of change was variable, the magnitude declined significantly with age at all frequencies tested except 50 Hz.
Metabolic flux from glucose is preserved in retinal explants cultured ex vivo
We sought to determine if glucose usage in the retina and RPE were altered at an age with known functional decline (Figure 2). Retina and eyecups were isolated from young (3-5 months) and aged male (26 months) and female (23-25 months) mice. Explants were incubated in KRB with U-13C-Glucose for 2, 10, 20, 30, or 45 minutes. Labeled metabolites generated from glucose in tissues and incubation media were measured by GC-MS (Figure 3A). Metabolites were quantified in terms of pmol or nmol metabolite per μg of protein. We examined metabolites in the tissue or exported by the tissue and considered the percent of the total pool labeled with 13C, and product-reactant ratios for particular steps in glycolysis and the TCA cycle.

Metabolic activity was examined by incubating retinal and RPE-choroid (eyecup) explants in U-13C-glucose between 2-45 minutes. The tissue was washed and frozen, and aliquots of the incubation media were collected for analysis (A). Labeled intermediates downstream of glucose were quantified (B) in terms of percent 13C incorporation, pmol of 13C-labeled isotopologue per μg of protein in the retinal or eyecup explant, and product:reactant ratios for glycolytic reactions and those pathways that can be entered via pyruvate. Percent incorporation, pool sizes, and amount of isotopologue are shown in Supplemental Figure 3 and 4. To examine glycolytic activity, the amount of exported M3 lactate was measured in the incubation media of retinas (C) and eyecups (D). The slope of the lines were all non-zero in retina (pyoung = 0.002, paged = 0.0003) and eyecups (pyo∪⊓g = 0.03, paged = 0.009), but showed no significant age-related change (Regression slope: pretina = 0.7, peyecup = 0.3). Within tissues, product:reactant ratios in glycolysis and common exit points to other pathways were plotted at 30 minutes because both tissues had reached a steady state. No significant age-related changes were seen in retina (E, G) or eyecup (F, G). Moving into the Krebs Cycle (B) at 30 minutes, no statistically significant age-related were observed in retina (H) or eyecup (I) explants. Normality of data was determined using the Shapiro-Wilk test and p-values were calculated for age-related comparisons using unpaired t-tests (* = p < 0.05) or Mann-Whitney tests (# = p < 0.05, marker of non-significance enclosed in parentheses). Error bars represent the standard deviation, except in Panels C and D which show the 95% confidence interval for the linear regression.
Abbreviations: Glyceraldehyde 3-phosphate (GAP), Dihydroxyacetone phosphate (DHAP), 3-phosphoglycerate (3PG), Phosphoenolpyruvate (PEP), Pyruvate (Pyr), Alanine (Ala), Citrate (Cit), α-ketoglutarate (AKG), Succinate (Succ), Fumarate (Fum), Malate (Mal)
In tissues, we first examined glycolytic intermediates (Figure 3B) in retina and eyecup. We found no consistent change in pool size, percent 13C-incorporation, and labeled isotopologues in either tissue (Supplementary Figure 2). There was no significant change in export of M3 lactate from retinas (Figure 3C) or eyecups (Figure 3D) into incubation medium. We examined product:reactant ratios at 30 minutes in both tissues when label incorporation has stabilized. There were no substantial age-associated changes in glycolytic reactions in the retina (Figure 3E and 3G) or eyecup (Figure 3F and 3G). Glycolytic function appears preserved in both tissues.
We next considered how age impacts the Krebs cycle. As with glycolysis, we saw no consistent changes in retinas (Supplementary Figure 3A-C) or eyecups (Supplementary Figure 3D-F) in pool size, percent 13C incorporation, or labeled isotopologues. There were no significant age-related changes in product:reactant ratios in retinas (Figure 3H) or eyecups (Figure 3I) at the same 30-minute time point considered for glycolysis. Age did not significantly impact the Krebs cycle in retinas and eyecup explants.
Sexual dimorphism can influence outcomes in biological studies38, and can differentially impact the visual system generally39 and in the context of aging40,41. We considered glucose processing in young and aged female mice in parallel to males at 2 minutes. Total protein content in retinas was unchanged between males and females (Supplementary Figure 1A), however in eyecups (Supplementary Figure 1B) there was a change in aged males that was accounted for by normalizing all values to protein content in tissues. There were no significant contributions of age or sex in pool size or isotopologues (Supplementary Figure 4A and B) in retina or eyecups (Supplementary Figure 4C and D). No sex-dependent differences in aging retinal or eyecup metabolism were found.
Glutamine metabolism is altered ex vivo in aged eyecups
Mitochondrial dysfunction is a known hallmark of aging29. To more directly investigate mitochondrial metabolism in aged ocular tissues we examined the usage of glutamine and succinate, which are oxidized by mitochondria in the RPE42,43.
Glutamine usage in ex vivo eyecup and retina explants was measured in 5 mM 12C-glucose and 2 mM U-13C-glutamine for 20 or 90 minutes. Metabolite pool size was diminished in aged eyecups at both timepoints (Supplementary Figure 5A) in glutamine, glutamate, and the downstream Krebs cycle metabolites α-ketoglutarate, fumarate, malate, and aspartate. Since we did not observe this defect in eyecups supplied with glucose alone (Figure 3), we hypothesized aged eyecups may have a defect in mitochondrial glutamine metabolism. After incubation in 13C labeled glutamine, M5 glutamine and glutamate (Figure 4B and 4C) were not significantly lower in aged eyecups. However, levels of M5 α-ketoglutarate, M4 Fumarate, M4 malate, and M4 aspartate (Figure 4D-G) did trend lower in aged eyecups compared to young. The percent labeled with 13C (Figure 4H-M) varied by metabolite. Notably, M5 glutamine, M4 fumarate, M4 malate, and M4 aspartate were consistently lower in young eyecups at 20 minutes, but had essentially matched the aged by 90 minutes. No significant changes in product:reactant ratios (Supplementary Figure 5B) occurred with age. These data suggest that glutamine anaplerosis is diminished in the aged eyecup.

Metabolic activity with glutamine - and in the mitochondria more broadly - was examined by incubating eyecup explants in U-13C-glutamine for 20 or 90 minutes. The M4 and M5 labeled isotopologues entering into and proceeding through the Krebs cycle (A) were quantified in terms of pmol of 13C-labeled isotopologue per μg of protein in eyecup explants (B-G). Glutamine (B) and glutamate (C) trended lower in the aged eyecups at both timepoints examined, but did not reach statistical significance. In the downstream intermediates AKG (D), fumarate (E), malate (F), and aspartate (G) that decline was increased. The percent incorporation of 13C remains essentially unchanged in aged eyecups at both timepoints (H-M). Percent 13C incorporation rises past the aged in glutamate (I) and AKG (J). However, in glutamine (H), fumarate (K), malate (L), and aspartate (M), the percent 13C incorporation is consistently lower in young eyecups at 20 minutes, but had essentially matched the aged by 90 minutes. These changes can be related back to pool size and product:reactant ratios, which are included in Supplemental Figure 6. Normality of data was determined using the Shapiro-Wilk test and p-values were calculated (* = p < 0.05, ** = p < 0.0001) for age-related comparisons using unpaired t-tests or Mann-Whitney tests (# = p < 0.05, marker of non-significance enclosed in parentheses). Error bars represent the standard deviation.
The same analysis was performed in retinas. In contrast, no significant age-related changes in pool size or 13C-labeled intermediates (Supplementary Figure 6A and C) were observed. The percent incorporation at 20 minutes was higher in later Krebs cycle intermediates but remained unchanged by 90 minutes while younger retina label uptake trended higher (Supplementary Figure 6B). No significant changes in product:reactant ratios (Supplementary Figure 6D) were observed.
We postulated the declines in eyecup glutamine metabolism indicated a decline in mitochondrial function. We approximated mitochondrial function by measuring oxygen consumption rate (OCR) and ATP levels in young and old retinas and eyecups. Succinate is a mitochondrial respiratory substrate that is preferentially oxidized by the RPE42. Succinate-driven OCR was calculated for each animal by taking the maximum steady-state OCR of tissue respiring on 5 mM glucose + 5 mM succinate and subtracting the 5 mM glucose baseline OCR (Supplementary Figure 7A) and retinas (Supplementary Figure 7B). Steady-state OCR values are listed in Supplementary Table 1. As reported previously, succinate stimulates OCR in eyecups to a significantly greater degree compared to retina42. Neither retinas nor eyecups exhibited significant age-related changes in succinate-stimulated O2 consumption (Supplementary Figure 7C, 8D). Steady-state levels of ATP (Supplementary Figure 7E) also showed negligible changes.
Discussion
Aging drastically alters visual function in humans20,21. We observed the same trend in 26 month-old C57Bl/6J mice where rod function, cone function, and photopic temporal resolution declined relative to young mice (Figure 2). By 26 months, C57Bl/6J mice are roughly equivalent to 79 year-old humans44 and functional changes are representative of advanced age, as roughly 25% of the population would have died45,46.
Rapid aerobic glycolysis in the retina is required for visual function22,24. Despite the observed visual decline in aged mice, the metabolic function of the retina in terms of glucose and glutamine metabolism is stable ex vivo. Glycolysis had reached a steady-state, but both glycolytic and Krebs cycle intermediates (Figure 3, Supplementary Figure 2, 3) were essentially unchanged between young and aged retinas. There was no observed effect of sex (Supplementary Figure 4), and mitochondrial OCR and ATP levels were also unchanged. Glutamine metabolism is linked to synaptic transmission through the neurotransmitter glutamate47. However, it is unlikely the minor defect we observed in the percent incorporation of 13C from U-13C-glutamine in late Krebs cycle intermediates (Supplementary Figure 6) will impact neurotransmission. We postulate that aging retina is robust and retains metabolic function on par with young retinas despite significant physiological decline in vivo.
Glucose metabolism appears to also be preserved in aging eyecups (Figure 3, Supplementary Figures 3 and 4). However, glutamine metabolism in aged eyecups is significantly different from young. The pool size (Supplementary Figure 5) and isotopologues were decreased with age. However, the percent 13C incorporation into glutamine intermediates (Figure 4) remained stable in aging eyecups compared to the increasing percent in young. We hypothesize that this indicates aged eyecups are deficient in glutamine metabolism and reach their maximum metabolic capacity faster than their younger counterparts. While the decreased M5 Glutamate:M5 Glutamine ratio could be indicative of decreased glutaminase activity in aging RPE, enzyme activity assays from glutaminase to fumarase would allow more targeted identification of the source of the defect in glutamine metabolism we observed.
Both metabolic changes and mitochondrial dysfunction are hallmarks of aging29. Glycolytic capacity declines with age in tissues like the brain and effector T Cells48–51. Young hearts subsist on fatty acid oxidation, but switch to glycolysis and ketone body usage in aging and heart failure52,53. Liver and skeletal muscle experience metabolic shifts with age54–59. Our results show that metabolism in retina and RPE are surprisingly robust in aging relative to these other systems despite functional visual decline in aged mice in vivo. This may indicate that the main driver of metabolic change in the aging eye is not intrinsic, but is due to nutrient or oxygen availability from blood. Blood vessel function around the retina has been shown to decline in aging people60–62. Oxygen extraction is lower in aged human retina63. Retina and eyecup explants are exposed to ambient oxygen and levels of glucose (5 mM) that are physiological to young mice, with few barriers to transport. Within the aged animal, these tissues may have restricted access to nutrients and oxygen due to the aforementioned declines in circulation and oxygen extraction. While retina and eyecup maintain their metabolic function in aging ex vivo, they may still experience a non-cell autonomous functional decline.
Considerations for future studies
A complementary in vivo approach is necessary to determine whether metabolic changes in the aging eye are due solely to intrinsic properties of the tissues or may be related to alterations in the vasculature and tissue structure. We will utilize direct infusion of 13C-labeled fuels64 to test this hypothesis. Our study focused on fuels of known importance in retina and RPE (glucose, glutamine, and succinate), but other metabolic pathways known to be important in these tissues merit consideration in the aging eye42,43,65–68.
Finally, it is important to consider that mitochondria have diverse functions outside of cellular respiration69–71. Abundance of Krebs cycle intermediates provides a direct link to epigenetic change72,73. Mitochondrial dysfunction is also involved in aging and cellular signaling that can have broad implications in an organ system29,70,74–77. While the tissues in the eye we examined - especially the retina - appear to be resilient to age-related defects in metabolism, future research will be critical to improve understanding of how the mitochondria in the retina and RPE can influence the broader ocular ecosystem.
Funding Information
NIH/NIA
Peter S. Rabinovitch and David J. Marcinek - Mitochondrial Protective Interventions, Aging and Healthspan: 5P01AG001751-36
Kristine A. Tsantilas T32 - Genetic Approaches to Aging Training Grant T32 AG000057
Kristine A. Tsantilas T32 - Biological Mechanisms for Healthy Aging Training Grant T32 AG066574
Mariya T. Sweetwyne K01 - Mitochondrial Protection to Derive Expanded Aged Renal Glomerular Progenitor Cells: K01 AG062757-02
NIH/NEI
James B. Hurley R01 - Determinants of Rod and Cone Response Characteristics: 5R01EY006641
James B. Hurley R01 - Control of Photoreceptor Metabolism: 5R01EY017863
Celia M. Bisbach F31 - Understanding the role of cytosolic NADH production in maintaining aerobic glycolysis in the retina: F31EY031165
Daniel T. Hass T32 - Vision Training Grant: T32EY007031
NIH/NIDDK
Ian R, Sweet - Cell Function Analysis Core of the Diabetes Research Center: P30 DK017047
Commercial Relationships Disclosures
None to list
Acknowledgements
The authors would like to thank the animal care teams at the University of Washington that made this study in mice possible. Jeanne Fredrickson helped coordinate logistics of the study. Kelie Gonzalez assisted with genotyping. Finally, the authors thank Susan E. Brockerhoff, Jennifer R. Chao, David W. Raible, Andrea E. Wills, Mark A. Kanow, and Christopher C. Farnsworth for thoughtful discussion.
References


