

Abstract
Th17 cells protect mucosal barriers, but their aberrant activity can cause autoimmunity. Molecular networks dictating human Th17 function are largely unexplored, and this hinders disease-studies. Here, we investigated the functions of the AP-1 proteins FOSL1 and FOSL2 in inducing human Th17 responses. Transient knockdown and over-expression strategies demonstrated the two proteins to inhibit Th17-cell identity, while revealing a novel cooperativity between their functions. Strikingly, FOSL1 plays different roles in human and mouse and FOSL-mediated Th17 regulation is opposed by the AP-1 factor, BATF. Genome- wide occupancy analysis indicated the co-localization of FOSL1, FOSL2 and BATF in the proximity of key Th17 genes. The functional interplay among these transcription factors (TFs) is potentially governed by sharing interactions with a common set of lineage-associated proteins. We further discovered that the genomic binding sites of these factors harbor a large number of disease-linked SNPs, many of which alter the ability of a given factor to bind DNA. Our findings thus provide crucial insights into the pathology of Th17-mediated diseases.
Introduction
Th17 cells are leading players of mucosal defense against extracellular bacteria and fungi. Their uncontrolled response, however, can lead to autoimmune conditions such as rheumatoid arthritis (RA), multiple sclerosis (MS) and inflammatory bowel disease (IBD). Characterization of the molecular circuits that direct Th17 cell-function, is thus critical for therapeutic development of immune-mediated disorders. Primarily, Th17 differentiation is initiated when naive CD4+ T cells are exposed to IL-6 and TGF-β (with or without IL-1β or IL-23). The early stages of differentiation involve signaling cascades that endorse lineage- defining gene-expression programs and restrict the diversification to alternative T-cell fates. These events are dictated by a well-coordinated network of transcription factors (TFs), many of which have been functionally characterized in both human and mouse. Key studies using gene-knockout mouse models have demonstrated how pioneer factors, such as STAT3, BATF and IRF4, nucleate key Th17-defining proteins (RORγT, RORα) over cytokine gene, RORα) over cytokine gene) over cytokine gene loci (IL-17A, IL17F and IL22) 1 .
The AP-1 complex, which is comprised of JUN, FOS and ATF family members, is reported to control Th17-regulatory circuits in mouse 1–6. Included within the FOS family are FOSL1 and FOSL2 (also known as FRA-1 or FRA-2), two paralogous TFs that share limited sequence similarity (<40%) and exhibit different functions. Their importance in the regulation of embryonic development, cancer progression, ECM synthesis and immune cell responses is well-established 7–13. Further, they exert opposite effects on murine Th17- development. While FOSL1 positively regulates the process, FOSL2 acts as a repressor of the lineage 1, 3, 4. Though these molecular players have been prodigiously studied in mouse, their roles have not been confirmed in human. Heterogeneity between human and mouse with regard to cytokine-responses, T cell-activation, γT, RORα) over cytokine gene δ T-cell function and interferon signalling are quite well-known 14. Significant differences have also been reported for the proteomic profiles of early-differentiating Th17 cells in the two species 15. Moreover, genes such as AHR 16, 17, PRDM1 18, 19 and SATB1 15, have been found to exhibit divergent functions in human and mouse Th17-regulation. These discrepancies should be especially borne in mind while extrapolating information from murine studies for therapeutic interventions. They further underscore the need for validating murine gene-functions using human cells.
FOS and ATF proteins lack a transactivation domain and thus need to heterodimerize with JUN proteins to execute their gene-regulatory roles 8, 20, 21. Since the resulting transcriptional activity is dictated by both proteins forming the dimer, dissecting the individual function of the monomers has proved to be challenging. Findings across cell types have identified both co-operative and antagonistic relationships among AP-1 proteins, which are further known to exhibited in a context-dependent manner 8, 21. Thus, investigating the AP- 1 complex requires more comprehensive approaches where the molecular interplay between its members could be addressed. Such interconnectivity has previously been reported for FOSL2 and BATF in murine Th17 cells, where the two factors overlap and occupy lineage- specific loci, yet regulate Th17-fate in an opposite fashion 1, 5. While their interplaying roles are largely unexplored in human T cells, the functional relationship between FOSL1 and BATF stands undetermined in either of the species.
In the present study, we investigated the individual and connected roles of FOSL1, FOSL2 and BATF in regulating human Th17 cell-identity, while highlighting species- specific differences. By combining global gene-expression analysis with genome-wide occupancy studies, we dissected the genes that are directly-regulated by these TFs. Our results demonstrate an evident cooperation between FOSL1 and FOSL2 functions, while verifying their antagonistic relationship with BATF in human Th17 cells. Further analysis revealed that the genomic regions bound by these AP-1 proteins harbor hundreds of disease- linked single nucleotide polymorphisms (SNPs), many of which altered the ability of these TFs to bind DNA. Disrupting the binding-affinities of these factors to the target gene- regulatory sites could subsequently alter their roles in instrumenting Th17 responses and contribute to disease development. Together, findings from this study provide a better understanding of the transcriptional regulation of human Th17 responses, which could help in designing new therapeutic strategies for Th17-associated diseases.
Results
FOSL1 and FOSL2 negatively influence early human Th17 responses
The Th17-specific expression profile of the genes encoding FOS-like proteins was examined using RNA-seq data from our previously published study 22. FOSL1 and FOSL2 transcript levels were plotted for human umbilical cord blood (UCB)-derived naive CD4+ T cells, which were cultured either under activation (Th0) or Th17-polarizing conditions (TGF-β, IL-6 and IL-1β), over a time course (Fig. 1a). When compared to activated T cells, the Th17-lineage showed a significant increase in levels of both factors. These changes were subsequently validated at the protein level by immunoblot analysis (Fig. 1b; Fig S1a). While both proteins were the most differentially upregulated at 24h, FOSL2 depicted a more-striking trend at all of the evaluated time points.

a. Expression kinetics of FOSL1 (left) and FOSL2 (right) RNA in human naive CD4+ T cells which were cultured under activation (Th0, dotted line) or Th17-polarizing (colored) conditions, over a time course (Published RNA-seq data was used 22). Line graph represents Rpkm values.
b. Immunoblot images show FOSL1 (bottom left) and FOSL2 (bottom right) protein levels at different time points of activation (Th0) or Th17-polarization. Actin was used as loading control. Blots from three biological replicates were quantitated and corresponding intensity values (normalized to actin) are plotted in the adjoining graphs (above).
c. Flow cytometry was used to estimate FOSL1 (left) and FOSL2 (right) protein levels in naive CD4+ T cells that were cultured for 24h, either under conditions of activation (Th0), Th17-polarization or activation in presence of the different Th17-polarizing cytokines (alone or in combination with each other). Bar plot shows median fluorescence intensity (MFI) values, normalized to Th0 condition. Data is shown for three biological replicates. Significance is calculated by comparing each condition to Th0.
d. Flow cytometry was used to estimate FOSL1 (left) and FOSL2 (right) protein levels in non-targeting control (SCR) or STAT3 KD Th17 cells, which were cultured for 72 h. Bar plot shows MFI values normalized to SCR control for four biological replicates.
e. Naive CD4+ T cells were silenced for FOSL1 or FOSL2 using two different siRNAs each, and further polarized to Th17-fate for 24h. Knockdown was analyzed using immunoblotting and actin was used as loading control. Blots are representative of three biological replicates.
f. ELISA was used to estimate IL-17A secretion in supernatants of FOSL1 and FOSL2- silenced Th17 cells (left and right, respectively) at 72h of polarization. Values were initially normalized to live cell count, followed by normalization with non-targeting control. Data represents four or five biological replicates, as indicated.
Graphs in the above panels show mean ± SEM. Statistical significance is calculated using two-tailed Student’s t test (*p < 0.05; **p < 0.01, ***p < 0.001).
On the basis that TCR signaling is known to upregulate AP-1 activity 8, 23, we investigated which of the Th17-polarizing cytokines increase FOSL expression above TCR- induced levels. To achieve this, naive CD4+ T cells were activated in the presence of different Th17-cytokines, used individually or in combination, and FOSL1 and FOSL2 protein levels were analyzed by flow cytometry (Fig. 1c). IL-1β and IL-6 were found to significantly enhance the expression of both proteins (relative to Th0), with IL-6 showing a stronger effect. In addition, TGF-β suppressed FOSL1 expression but promoted FOSL2 expression, as has been previously reported 24, 25.
The IL-6/STAT3 signaling axis is known to drive the expression of FOS-like proteins 3, 15, 26–28. Given the importance of STAT3 in establishing Th17-cell identity 26, 29, we sought to determine if the IL-6-induced increase in FOSL expression required STAT3 function in Th17 cells. To address this, FOSL1 and FOSL2 levels were examined in STAT3-depleted Th17- polarized cells by immunoblotting (Fig. 1d). Although the loss of STAT3 reduced the expression of both factors, the effect was more pronounced on FOSL2. Notably, in an earlier study 26, we have found STAT3 to occupy the promoter region of FOSL2 but not FOSL1, which might explain the more robust effect on the former.
The early and sustained expression of FOS-like proteins suggests their potential involvement in steering Th17-differentiation. To determine their precise roles, we silenced each of these proteins individually with RNAi and probed for an effect on IL-17 cytokine, which is a key marker of the Th17 lineage. To ensure reproducibility with minimal off-target phenotypes, FOSL1 and FOSL2 were each targeted by two different siRNAs. Naive CD4+ T cells were nucleofected and cultured according to the workflow in Fig. S1b. The siRNA- efficacy was confirmed using western blotting (Fig. 1e; Fig. S1c). In agreement with earlier findings 30, silencing FOSL1 did not alter FOSL2 expression, and vice-versa (Fig. 2a). Interestingly, individual depletion of FOSL1 or FOSL2 increased IL-17 secretion at 72h of polarization, which highlights the negative influence of these factors on human Th17 cell- function (Fig. 1f). This also proves that although FOSL2 shows similar functions, FOSL1 exhibits divergent roles in human and mouse 1, 3.

a. Naive CD4+ T cells were silenced for FOSL1, FOSL2 or both factors in parallel (DKD), and cultured under Th17-polarizing conditions for 24 h. Total FOSL1 (left) and FOSL2 (right) protein was stained (Alexa-647) and analysed by flow cytometry using overlay histograms. Non-targeting siRNA (SCR) was used as nucleofection control. Data represents four biological replicates. Adjoining legend describes the color-codes for the different conditions.
b. Naive CD4+ T cells were treated with in-vitro transcribed GFP-FOSL1 RNA or GFP- FOSL2 RNA or both (DOE). After resting the cells (18–20 h), total FOSL1 (left) and FOSL2 (right) proteins were stained (Alexa-647) and analysed by flow cytometry using overlay histograms. Empty GFP RNA was used as control. Data represents four biological replicates, and the adjoining legend describes the color-codes for the different conditions.
c & d. Bar plot shows ELISA results for IL-17A secretion in supernatants of naive CD4+ cells that were treated with the indicated conditions of FOSL knockdown (panel c) or overexpression (panel d), and differentiated to Th17 phenotype for 72 h. Values were first normalized to live cell count, and then to the respective control condition (SCR or GFP). Data represent four biological replicates.
e & f. qRT-PCR analysis was used to determine IL-17A (left) and IL-17F (right) RNA levels in FOSL single/double KD (Panel e) or FOSL single/double OE Th17 cells (Panel f), at 72 h of polarization. Fold-change normalized to the respective controls (SCR or empty GFP) was plotted for four biological replicates.
For panels c-f, bar plots show mean ± SEM. Statistical significance is calculated using two- tailed Student’s t test (*p < 0.05, **p < 0.01, ***p < 0.001, ****p<0.0001).
FOS-like proteins cooperatively inhibit IL-17 expression
FOS and JUN proteins can cooperatively regulate gene-transcription 31, 32. Whether such synergy exists between FOSL1 and FOSL2, is yet to be explored. Since both of them regulated IL-17 secretion in a similar fashion, we examined if their simultaneous perturbation causes enhanced changes. To achieve this, siRNA knockdown (KD) as well as RNA-based over-expression (OE) strategies were used. For simultaneous silencing (double KD or DKD), naive CD4+ T cells were co-nucleofected with a combination of FOSL1 and FOSL2- targeting siRNAs and immunoblotting was performed to confirm the parallel reduction in their protein levels (Fig. 2a; Fig. S2a). Cells individually silenced for either of these factors served as single KD controls. To assess the effects on the expression and secretion of IL-17 cytokine, qPCR and ELISA analyses were performed at 72 h. Notably, FOSL1 and FOSL2 co-depletion additively augmented IL-17 levels, relative to the single KD controls (Fig. 2c and e).
To authenticate these findings, we simultaneously over-expressed the two proteins, using in-vitro transcribed (IVT) RNA. Naive CD4+ T cells were nucleofected with a combination of FOSL1 and FOSL2 IVT RNAs (double OE or DOE), and flow cytometry analysis confirmed the lateral increase in their levels (Fig. 2b; Fig. S2b). Parallel overexpression of the two proteins caused an additive inhibition in IL-17 levels, as compared to the single factor controls (Fig. 2d and f). This strengthened our RNAi findings and confirmed a functional cooperativity between FOSL1 and FOSL2.
Perturbing FOS-like proteins triggers important changes in Th17 gene-expression programs
To globally unravel the individual and combined gene targets of FOSL proteins, RNA- sequencing and differential expression (DE) analysis was performed for KD and DKD Th17 cells. For FOSL1, FOSL2 and DKD conditions, respectively, our analysis detected 466, 1,529 and 2,000 DE genes at 24h and 315, 150 and 1,500 DE genes at 72h of polarization (false discovery rate (FDR) ≤ 0.1). A similar analysis was performed for OE and DOE Th17 cells (at 72 h) resulting in the identification of 30, 352 and 522 DE transcripts for FOSL1, FOSL2 and DOE conditions, respectively (FDR ≤ 0.1). It was thus evident that co-perturbing these factors altered a higher number of genes.
To further identify the cooperatively-regulated targets, the fold-changes for the affected genes were compared in KD versus DKD and OE versus DOE conditions. A significant number of targets showed more pronounced expression changes when both the factors were simultaneously perturbed (Fig. 3a and b). These included key Th17-marker genes such as IL17A, IL17F, IL23R and CCR6, all of which were negatively-regulated. Similarly, other genes reported to guide Th17-cell function or inflammatory responses (FASLG 33, 34, IL7 IL12RB149, IL11 small number of lineage-associated factors (IL21, USP18, GZMB, IL3 and OASL) were observed to be altered by FOSL1 and FOSL2 in a non-synergistic fashion. This suggests that apart from coordinated roles, the two factors also independently guide Th17-gene networks.
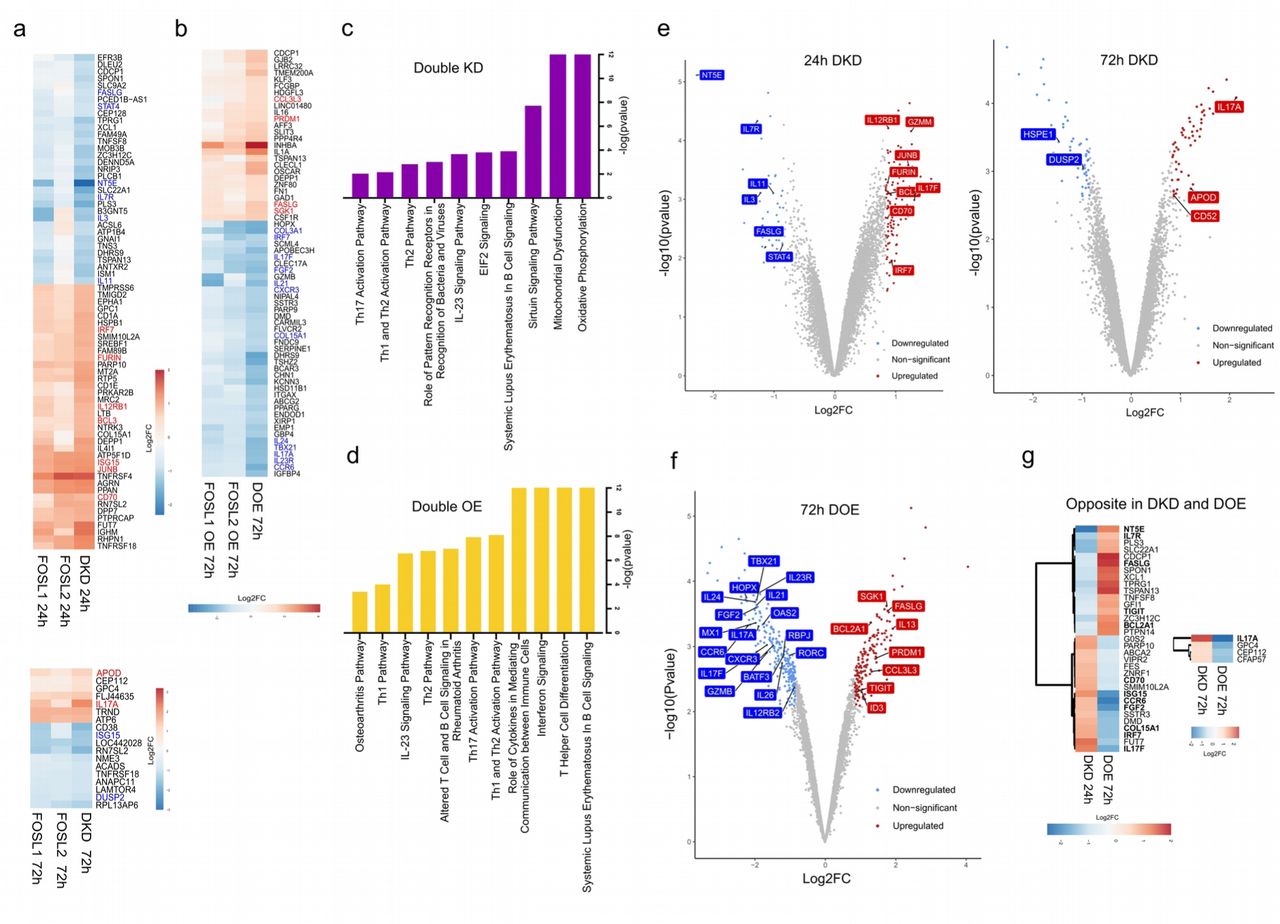
a. Heatmap illustrates the DE genes that are more profoundly altered in FOSL Double KD Th17 cells, relative to the corresponding single KD controls at 24h (upper) and 72h (lower) of polarization. Genes with Th17-relevance are highlighted; upregulated genes are in red, and downregulated are in blue.
b. Heatmap includes the DE genes that are more pronouncedly perturbed in FOSL double over-expression (DOE) Th17 cells as compared to the single OE controls at 72h of differentiation. Upregulated genes with Th17-relevance are in red, whereas the downregulated ones are in blue. For panels a & b, Log2fold-change was calculated relative to the respective control conditions (scramble or empty GFP)
c & d. Ingenuity pathway analysis was used to identify signaling pathways that are altered upon simultaneous silencing (panel c) or simultaneous over-expression (panel d) of FOS-like proteins.
e. Genome-wide expression analysis of human Th17 cells that were simultaneously silenced for FOSL1 and FOSL2. Volcano plot highlights the Th17-associated transcripts that are differentially expressed upon co-depletion of FOSL1 and FOSL2, at 24h (left) and 72h (right) of Th17 polarization.
f. Volcano plot highlights the Th17-associated genes that are differentially expressed upon double over-expression of FOSL1 and FOSL2 at 72h of polarization. For panels e & f, targets with FDR≤0.1 and |fold-change|≥1.8 have been plotted. Upregulated genes are in red, and the downregulated ones are in blue.
g. Strongest regulatory targets of FOS-like proteins. Heatmap depicts the differentially expressed genes that show opposite changes in FOSL DKD and FOSL DOE cells, at the indicated time points of Th17 polarization. The selected genes in highlighted text have reported functions in Th17-signaling.
Since co-perturbation altered a wider range of T-cell-related genes, we hereby focused on analyzing the DKD and DOE datasets. In the case of DKD, our analysis revealed a poor overlap between the genes affected at 24h and 72h of polarization, which suggests time- distinguished functions (Fig. S3c). Ingenuity pathway analysis (IPA) revealed that FOSL DKD or DOE conditions affect mitochondrial dysfunction, oxidative phosphorylation, T- helper cell differentiation, IL-23 signaling, Interferon signaling, Th1/Th2/Th17 activation and autoimmune-associated processes (RA, systemic lupus erythematosus (SLE)) (Fig. 3c and d). The DKD and DOE data combined, revealed that FOSL factors synchronously repress several genes that support Th17-differentiation (RORC, BCL3 57, FGF2 47, IL21 58, JUNB 2, 6, CD70 44–46, IL12RB1 49, CD52 59, 60, RBPJ 61, and FURIN 62) or imprint autoimmune phenotypes (OAS2, MX1 and ISG15 63) (Fig. 3e and f; Fig. S3a and b). At the same time, genes that inhibit Th17 cell-function or inflammatory responses (IL13 64, IL7R 35, PRDM1 19, DUSP2 48, BCL2A1 65, ID3 66, TIGIT 67 and NT5E 36–39) were positively regulated by these factors. Also, several targets of STAT3 (HOPX, IL24, FNDC9, NR4A2, GZMB) 26, which is a master-regulator of the lineage, were found to be influenced by FOSL in the opposite- direction. This ascertains the role of FOSL1 and FOSL2 in preventing induction of Th17-fate.
To further identify the strongest synergistic targets of FOSL1 and FOSL2, the subset of genes that show contrasting expression changes in DKD versus DOE conditions were selected (Fig. 3g). We found 37 such genes, many of which were functionally associated with the Th17 lineage. These included IL17F, IL17A, CCR6 68–70, FASLG 33, 34, FGF2 47, IL7R 35 ,BCL2A1 65, TIGIT 67, NT5E 36, 37, 39, CD70 44–46 and IRF7 56. Out of these, we validated the expression changes for CCR6 70 which is a Th17-specific chemokine receptor, using flow cytometry analysis (Fig. S3d). To further authenticate our RNA-seq findings, the cooperative effects of FOSL were confirmed on other lineage-associated targets (NT5E, STAT4, CD70, APOD, JUNB), using either immunoblotting or flow cytometry (Fig. S3e; Fig. S4a-d). NT5E or CD73 is a 5′ectonucleotidase, which is known to resolve uncontrolled inflammation 37, 71. A positive correlation was reproducibly detected between NT5E and FOSL expression (Fig. S3e and Fig. S4b), which could suggest their interlinked participation in keeping inflammatory responses in check. Further, co-depletion of FOSL1 and FOSL2 induced a significant increase in levels of JUNB, CD70 and APOD, all of which have reported links to Th17- regulation 2, 6, 15, 45, 46, 72 (Fig. S3e and Fig. S4a, c, d). These results thus connote a concrete involvement of FOSL proteins in moderating Th17 transcriptional networks.
FOSL1 and FOSL2 share occupancy over co-regulated Th17 genes
AP-1 proteins function as transcriptional regulators by directly binding to the target gene loci. To elucidate the global occupancy profiles of FOSL1 and FOSL2 in human Th17 cells, we performed chromatin immunoprecipitation, followed by sequencing (ChIP-seq) analysis. Since these factors portray cell type-specific cellular localization 73, 74, immunofluorescence analysis was used to first confirm their predominant nuclear profile in Th17 cells (Fig. 4a). Our ChIP-seq analysis identified 22,127 peaks for FOSL2 and 4,088 peaks for FOSL1 (with irreproducible discovery rate (IDR) significance of < 0.01). In agreement with previous findings, a large fraction of these peaks covered intergenic/intronic regions, thereby suggesting that these factors regulate gene-expression through distal regulatory elements (Fig. S5a) 75–77. Interestingly, comparing the peak distribution profiles of the two proteins indicated a close similarity (Fig. 4b). Further, known FOSL2-binding motifs were detected within FOSL1 peaks and vice-versa, which underscores their propensity to bind to overlapping regions (Fig. 4c). We additionally performed de-novo motif enrichment analysis to identify the consensus DNA-binding sequences of these TFs (Fig. 4c).

a. Immunofluorescence images showing nuclear localization of FOSL1 (red, upper) and FOSL2 (red, lower) in Th17 cells polarized for 72 h. Lamin A/C (in green) marks the nuclear periphery, whereas phalloidin (in blue) stains the cytoplasmic actin.
b. ChIP-seq analysis was performed for FOSL1 and FOSL2 using 72h Th17 cells. Figures on the left show distribution of FOSL1 and FOSL2 binding sites relative to the position of the closest transcription start site (TSS). TSS is defined to be at position zero. The adjoining figure on the right is an overlay plot that compares the individual profiles of the two factors.
c. The topmost consensus sequence for FOSL1 and FOSL2 genomic-binding were identified using de-novo motif enrichment analysis by Homer. FOSL1 (left) and FOSL2 (right) peaks were further analyzed for enrichment of known TF motifs. Top six motifs identified using Homer are shown. Peaks with IDR p<0.01 were used for motif discovery.
d. ChIPpeakAnno was used to determine the overlap in the genome-binding sites of FOSL1 and FOSL2 (peaks sharing 200 bp or more were recognized as true overlaps). Genes neighboring to these overlying sites, which were differentially expressed under DKD or DOE conditions were assigned as the shared-direct targets of FOSL1 and FOSL2 (DE genes with FDR≤0.1, |fold-change|≥1.5). Selected shared targets are depicted in the adjoining volcano plots; downregulated genes are in blue, and upregulated ones are in red. Those showing FOSL occupancy over promoter regions (5-kb window around TSS) are highlighted in yellow.
e. Integrative Genomics Viewer snapshots show the shared-binding of FOSL1 and FOSL2 over selected Th17 genes.
FOSL1 and FOSL2 are reported to co-occupy selective gene targets in breast cancer cells 30. We examined if a similar paradigm exists in human Th17 cells which directs the synergistic control of these factors over the lineage. Our genome-wide occupancy analysis revealed 3,711 binding sites to be common in FOSL1 and FOSL2 (Fig. 4d). Strikingly, more than 150 genes proximal to these shared sites were co-perturbed by the two factors in our transcriptome analysis (both DKD and DOE conditions) (Fig. 4d). These were assigned as the shared-direct targets of FOSL1 and FOSL2, which included several Th17-relevant genes that were either activated (IL13 64, IL7R 35, JAK2 78, BCL2A1 65, FASLG 33, 34, 79, PRDM1 19, etc.) or repressed (IL17F, IL23R, FURIN 62, RBPJ 61, CXCR3 80–82, MIAT 83, IL24 53–55 , ETV6 1, ZAP70 84, RORA, etc.). An intriguing target among these was PRDM1 (or BLIMP1), an inhibitor of Th17-differentiation 19 that was observed to be directly-bound and positively regulated by FOSL1 and FOSL2. We found this to corroborate with findings reported in other cell types 11, 85. Such coordinated expression could be executed through two AP-1 binding sites that exist in proximity of the BLIMP1 promoter 86, which potentially facilitate the co- binding of the FOSL factors.
Only about one-third of the shared targets showed FOSL occupancy over a 5-kb region around their TSS (putative-promoter region) (Fig. S5b; Fig. 4d). The remaining majority, which included several Th17-linked genes, were bound over intronic or intergenic sites (IGV images for selected targets in Fig. 4e). This highlights that FOSL TFs regulate their Th17-targets presumably by binding to either enhancer or silencer elements in the genome.
FOS-like proteins and BATF co-localize over key Th17 genes and regulate their expression in an opposite fashion
Genomic co-occupancy is a distinguished feature of FOS, JUN and ATF family members 12, 87–89. In light of this, the FOSL1 and FOSL2 ChIP-seq peaks were screened for the presence of known TF-motifs. Our analysis revealed binding motifs for BATF, JUNB, FOS and ATF3, among the top identifications (Fig. 4c). A former study suggested an antagonistic relationship between BATF and FOSL2 while regulating murine Th17 differentiation 1. We aimed at verifying whether BATF similarly interplays with FOSL1 and FOSL2 for directing human Th17 cell-function.
BATF is a well-known regulator of murine Th17 fate 5, 90, however its role in the human counterpart remains unknown. This was addressed using RNAi, where naive CD4+ T cells were nucleofected with BATF-targeting siRNA and further polarized to Th17 phenotype. Loss of BATF significantly reduced CCR6 and IL-17 levels at 72h post differentiation (Fig. 5a-d). Further bolstering these results, transcriptome analysis of BATF KD cells showed downregulated expression of multiple Th17-marker genes such as IL17A, IL17F, IL23R, CCR6 and IL21 (Fig. 5c and S6a). Additionally, Ingenuity Pathway Analysis found BATF to alter genes involved in IL-23 signaling, T-helper cell differentiation, Th17 activation, and autoimmune function (SLE, RA) (Fig. 5d). We then examined the global occupancy profile of BATF by performing ChIP-seq analysis on 72h cultured Th17 cells. We detected a total of 16,479 binding sites (IDR significance < 0.01), more than 5000 of which occurred within promoters of genes. These included several (35 genes) transcriptional targets of BATF, many of which are reported to direct Th17 function (IL21, CCR6, PRDM1, IL17A and FASLG) (Fig. 5g). Further, motif analysis of the ChIP-seq peaks revealed BATF as the topmost known-motif and also identified the consensus sequence for its binding (Fig. 5f)

a. Immunoblot shows BATF protein levels in non-targeting (SCR) and BATF KD Th17 cells at 24h of differentiation. Adjoining flow cytometry plot depicts percentage of CCR6 positive cells in the mentioned conditions at 72h of polarization. Data is representative of three biological replicates.
b. ELISA was used to measure IL-17A levels in supernatants of cells treated with SCR or BATF siRNA and further polarized under Th17 conditions for 72h. ELISA readings were first normalized to live cell count, followed by normalization with SCR values. Graph shows mean ± SEM for three biological replicates. Statistical significance was calculated using two- tailed Student’s t test (**p < 0.01)
c. Volcano plots highlight the significantly upregulated (red) and downregulated (blue) genes in BATF-silenced Th17 cells at 24h (left) and 72h (right) of polarization (FDR≤0.1, |fold change|≥1.8). DE genes with known relevance to Th17 function are shown in labelled boxes.
d. IPA (Ingenuity pathway analysis) was used to identify pathways altered upon silencing of BATF in Th17-polarized cells (24h and 72h targets were combined).
e. ChIP-seq analysis was performed for BATF using 72h cultured Th17 cells. Figure shows distribution of BATF binding sites relative to the position of the closest transcription start site (TSS). TSS is defined to be at position zero.
f. Figure shows the top consensus sequence for BATF-binding that was identified using de- novo motif enrichment analysis by Homer. Peaks bound by BATF were further analyzed for enrichment of known TF motifs. Top six motifs identified using Homer are shown. Peaks with IDR p value < 0.01 were used for motif discovery.
g. Venn diagram shows the intersection between the genes that are bound by BATF over promoters and those that are altered upon BATF KD (24h & 72h). The overlapping area represents the promoter-bound direct targets of BATF. The adjoining heatmap shows their corresponding Log2FC values in BATF-silenced Th17 cells (24h or 72h). IGV images illustrate BATF occupancy over its selected targets that have known relevance to Th17- function.
The above findings collectively establish that BATF positively regulates early Th17 differentiation in human and thus exhibits functions antagonistic to FOSL proteins. To dissect this antagonism at the level of gene targets, we compared the DE genes for BATF KD and FOSL DKD and focused on the candidates that were common but regulated in an opposite fashion (Fig. 6a, top). Likewise, the genes that were similarly altered between BATF KD and FOSL DOE were selected (Fig. 6a, bottom). Based on our analysis, those genes that support Th17 cell-function (IL17A, IL17F, IL21, RORA, IL23R and CCR6) and were activated by BATF, were found to be negatively regulated by FOSL. Concurrently, the Th17-suppressor genes (PRDM1 19, ID3 66) that were inhibited by BATF, were observed to be positively regulated by FOS-like proteins.

a. Genes oppositely regulated by FOS-like proteins and BATF. Heatmap on the top shows fold-change values for the DE genes that were regulated in an opposite fashion in FOSL DKD versus BATF KD Th17 cells. Heatmap on the bottom depicts DE genes that are similarly regulated in FOSL DOE and BATF KD Th17 cells, at the indicated time points. Th17-relevant genes are highlighted in red.
b. ChIP-seq analysis of FOSL1, FOSL2 and BATF using Th17 cells cultured for 72h. Graph (upper panel) shows overlay between peak distribution profiles of FOSL1, FOSL2 and BATF. TSS is defined to be at position zero. Bar plot (lower panel) depicts peak-annotation results for binding sites of FOSL1, FOSL2 and BATF.
c. Heatmap with k-means clustering shows the enrichment of ChIP-seq signals at a 2-kb window upstream and downstream of the peak centers of FOSL1, FOSL2 and BATF binding sites in Th17 cells.
d. Venn diagram showing an overlap between genomic targets of FOSL1, FOSL2 and BATF (Peaks sharing 200 bp or more across the ChIP-seq datasets were considered to be true overlaps). Adjoining heatmap depicts fold-changes for the gene targets that are bound, and oppositely-regulated by FOSL proteins and BATF. Genes showing shared occupancy of the three TFs, over putative-promoter regions have been highlighted (asterisk). Th17-relevant targets are marked in bold.
e. IGV track snapshots illustrate the co-localization of FOSL1, FOSL2 and BATF over selected Th17-regulatory genes. Profile of H3K27ac marks around the shared sites has also been shown.
f. Bar plot depicts immunoblot-based expression analysis of STAT4 in FOSL DKD (left) and BATF-silenced (right) cells, cultured under Th17-polarizing conditions for 72h. Data shows mean ± SEM for three or four biological experiments, as indicated. Statistical significance is calculated using two-tailed Student’s t test (*p < 0.05). Adjoining IGV track shows shared occupancy of FOSL1, FOSL2 and BATF flanked by H3K27ac marks near the STAT4 locus.
To further examine which of the genes regulated in an opposite fashion are also bound by these TFs, we compared the ChIP-seq profiles of the three proteins. An overlay of their peak distribution plots suggested co-localized occupancy (Fig. 6b, top). Further, plotting the ChIP-seq signal intensities 2 kb upstream and downstream of the peak centers for FOSL1, FOSL2 and BATF, evidently demonstrated the unanimity in their DNA binding pattern (Fig. 6c). Their individual sites were further clustered; where clusters 2-4 and 7 showed relatively higher enrichment of BATF, whereas clusters 5, 8, 9 & 10 portrayed greater signal densities for FOSL1 and FOSL2. We then used the R package ChIPpeakAnno 91 to determine the exact overlap in their binding sites and found a total of 2,624 sites to be common (Fig. 6d). Interestingly, several genes neighboring these common binding sites were antagonistically regulated by BATF and FOSL (Fig. 6d) and many genes controlling Th17 effector-functions (RORA, IL17F, ROR1, IL23R, PRDM1, FASLG, IL12RB2) were included within this group (highlighted in Fig. 6d). We thus propose that BATF and FOSL contextually or competitively bind to a common set of Th17-defining genes and oppositely regulate lineage-establishment. Also, the concerned factors were observed to primarily occupy regulatory DNA elements distal to the promoter (introns/intergenic regions) (Fig. 6b, bottom) in order to influence their targets (excluding genes marked (*) in Fig. 6d).
AP-1 proteins have the ability to bind to common interacting partners. This reportedly creates molecular competition and mediates functional antagonism between specific members of this family 21. BATF for instance, competes with FOS proteins for partnering with JUNB, which allows BATF to negatively influence FOS activity 92. To address if a similar mechanism facilitates the BATF-FOSL antagonism in our study, it is important to primarily check for their common binding partners in human Th17 cells. The interactomes of FOSL1 and FOSL2 in human Th17 cells were uncovered by an ongoing study of our lab, using global proteomics approaches (unpublished data). The two proteins were found to share numerous binding partners, many of which regulate T cell signaling processes (RUNX1, SIRT1, EIF4E, JUN, JUNB, SERBP1, HSPH1, IFI16) (Fig. S7a). Out of these, JUN TFs are known to interact with BATF as well, in other studies (STRING network of Fig. S7b). To verify these findings in human Th17 cells, we immunoprecipitated BATF from 72h-polarized populations and performed immunoblot analysis (Fig. S7c). Apart from JUN (JUN, JUNB), BATF interaction was also checked for other selected, shared partners of FOSL (RUNX1 and SIRT-1). Our results confirmed that BATF reliably associates with JUN, JUNB and RUNX1, all of which are established regulators of Th17-differentiation 2, 3, 6, 93, 94. Interestingly, these identified interactors are known to exhibit context-specific roles, based on their choice of binding partner 21, 94. This implies that BATF and FOSL proteins potentially compete to interact with common proteins and differentially orchestrate human Th17 responses. Notably, STAT3 and IRF4, which are known to form pioneering complexes with BATF in mouse Th17 cells 1, 95, showed no interaction with it in the human counterpart (Fig. S7d). This may hint at subtle differences in the early signaling events of the two species.
Multiple SNPs linked to autoimmune diseases were enriched within the genomic binding sites of FOSL1, FOSL2 and BATF
Functional analysis of data from genome-wide association studies (GWAS) has revealed that SNPs associated with disease phenotypes can alter binding sites of key TFs 96. The presence of a SNP can abrogate or enhance TF occupancy, which might subsequently influence gene- expression profiles 26. Interestingly, 90% of the disease-linked SNPs are reported to occur within non-coding genomic regions 97, which also appear to accommodate a major fraction of the AP-1 TF ChIP peaks in our study. With this in view, we sought to determine whether the genome-binding sites of FOSL1, FOSL2 and BATF harbor any autoimmune-associated SNPs that could disrupt the occupancy of the respective factors.
We used the NHGRI-EBI GWAS catalogue from Caucasian populations to primarily query SNPs with reported links to 11 different autoimmune phenotypes (celiac disease, IgA immunodeficiency, RA, ankylosing spondylitis (AS), Crohn’s disease (CD), MS, psoriasis (PS), primary biliary cholangitis, type I diabetes and ulcerative colitis (UC) (Fig. 7a). Upon intersecting these with the TF peaks identified in our study, we detected 114, 571 and 573 disease-linked SNPs (and their proxies) within FOSL1, FOSL2 and BATF binding sites, respectively. Importantly, the genomic regions shared between the three factors harbored as many as 64 disease-associated SNPs.

a. Enrichment of disease-associated SNPs (or their proxies in Caucasian populations) at FOSL1, FOSL2 and BATF binding sites, relative to random sets of background SNPs.
b. SNPs relevant to the study were shortlisted. Among these, the SNPs that were functionally validated in DNA-affinity precipitation assays have been shown here.
c & d. DNA-affinity precipitation assay was performed to determine if any of the shortlisted SNPs altered the binding of FOSL1, FOSL2 or BATF to their genomic sites that were identified by ChIP-seq. Wildtype (WT) oligonucleotides containing the binding motif for either of the TFs (at different genomic loci) and mutant oligonucleotides harboring the SNP within the motif, were used as baits. A WT oligonucleotide with a conserved binding site for BATF (BATF WT) and the corresponding mutant sequence that is known to disrupt BATF occupancy (BATF MUT) were used as experimental controls. DNA-binding was quantitatively tested using western blotting. Immunoblot results for the TF-specific SNPs (panel c) and the SNPs common across the three factors (panel d) are shown. Data is representative of three biological replicates.
We further shortlisted the SNPs with potential relevance to our study by screening for the ones that overlap with the AP-1 TF binding sites in the vicinity of Th17-relevant genes. Additionally, the SNPs that were common across the three factors and harbored within canonical AP-1 motifs were selected (Fig. S8a). DNA-affinity precipitation (DAPA) assay was then performed to determine if any of the shortlisted SNPs affect the binding of FOSL1, FOSL2 or BATF to DNA. Wildtype oligonucleotides with TF binding motifs (identified from FOSL1, FOSL2 or BATF ChIP-seq) and mutant oligonucleotides with the SNP introduced within the motif, were used as baits for the assay. DAPA analysis of selected SNPs (Fig. 7b) revealed important changes in the binding affinities of the three TFs. For instance, we detected altered binding of FOSL2 to mutant oligonucleotides harboring the following five SNPs: rs8023164 (MS and SLE), rs17103360 (MS and RA), rs10515944 (CD), rs3116497 (CD) and rs7414934 (AS, CR, PS, RA, and UC) (Fig. 7c; Fig. S8b). These SNPs appeared to occur in the regulatory regions that are neighboring to TRAF3, BATF, CD28 and RUNX3 genes, which could be potential targets of FOSL2. Interestingly, TRAF3 is reported to enhance T cell activation 98, restrain IL-2 dependent generation of thymic Tregs 99 and impair IL-17R proximal signaling 100. BATF is a well-known regulator of Th17 responses 5, whereas low CD28 co-stimulation has been found to promote Th17-development 101, 102. Furthermore, while RUNX transcription factors are recognized modulators of Th17 differentiation 103, RUNX3 expression in particular, is reported to be increased in CD4+ T cells of PS patients. Notably, loss of RUNX3 impairs Th17 and Th22 differentiation, both of which are required for the pathogenesis of psoriasis 104. Our findings thus suggest that a SNP mutation in the identified FOSL2 binding regions affects its ability to bind regulatory DNA segments near genes that are involved in Th17 signaling.
We similarly identified three SNPs for BATF (near IL21R, GATA3 and STAT3) and one for FOSL1 (near STAT3), which when introduced within the corresponding TF motif, significantly disrupted occupancy of these factors (Fig. 7c; Fig. S8b). IL-21 and STAT3 positively regulate Th17 cell programs while GATA3 is a master TF for Th2 cell differentiation, which also restrains the Th17 lineage. Interestingly, a BCL10-proximal SNP rs9887879, which overlaps the shared genomic regions of FOSL1, FOSL2 and BATF, reproducibly reduced DNA-binding affinities for all of them (Fig. 7d; Fig. S8b). BCL10 suggestively regulates Th17 function as a part of a signaling complex 105. It is a key component of the Carma1-Bcl10-Malt1 complex that is essential for pathogenic Th17 responses 106. We additionally validated the functional effects of two other SNPs - rs17293632 near SMAD3 (AS, CR, MS, PS, RA and UC) and rs6784841 near LMOD3/FRMD4B genes (CD) (Fig. 7d; Fig. S8c). These SNPs occurred within consensus AP-1 motifs at the shared genomic regions of the three TFs and significantly altered the binding propensities for all of them. The ability of the above SNPs to perturb AP-1 TF occupancy could trigger changes in their Th17-regulatory roles, thereby facilitating the development of multiple autoimmune phenotypes.
Discussion
FOS and ATF proteins are established regulators of proliferation, differentiation and apoptosis in many cancers. Their involvement in lineage specification of T-helper cell types, however, has been investigated only recently. Th17-specific AP-1 networks have been mostly studied in mouse models. Taking into account the recently established heterogeneity between human and mouse Th17 cells 15, we used human T cells to verify the roles of FOSL1 and FOSL2 during early stages of Th17 differentiation. Using complementary approaches, we demonstrated that both factors negatively influence Th17-induction, thereby highlighting that FOSL1 has different roles in human and mouse 3.
AP-1 factors interact in a well-coordinated manner to drive gene-expression profiles21. FOS proteins, in particular, exhibit functional redundancy that allows them to compensate for the loss of each other 21, 107, 108. Data from the present study revealed that perturbing FOSL1 or FOSL2 individually only modestly altered Th17 cell-identity. Disrupting them in parallel, however, caused additive changes in gene-expression that indicate a distinct cooperativity between these factors. Remarkably, co-depletion or dual over-expression of the two proteins synergistically affected several genes associated with Th17-function (IL17A, IL17F, NT5E 36, 37, 39, CCR6, IL7R 35, IRF7 56, BCL2A1 65, DUSP2 48, PRDM1 19, IL21 58, JUNB 2, 6, IL23R, CXCR3 80, IL12RB1 49, CD52 59, 60, TIGIT 67, ID3 66, etc.). Our findings thus confirm these paralogs to jointly instruct the initial stages of human Th17 differentiation.
Previous studies in mouse indicated that FOSL2 suppresses Th17-responses, yet promotes the expression of genes involved in sustenance of the lineage 1. Our results portray a different scenario. Genes associated with Th17-maintenance (Il23r, Il12rb1 and Il211) that were activated by FOSL2 in mouse 1 were in fact, inhibited by FOSL1 and FOSL2 in human Th17 cells. This implies that although FOSL2 similarly inhibits Th17 cell-effector genes in the two species, its involvement in parallel signaling networks may differ in human and mouse. FOSL proteins further co-influenced multiple genes (TBX21, GATA3, IFNG, BATF3, IL12RB2, HOPX and IL13) that orchestrate the development of alternative T-helper cell fates. For instance, FOSL1 and FOSL2 negatively-regulated Th1-lineage genes (TBX21109, 110, IFNG111, IL12RB2112 and HOPX113), while promoting the expression of Th2-specific factors (GATA3114, IL13115 and IL3116). It however remains to be understood if these AP-1 factors restrain Th17 responses by modulating helper-T-cell diversification.
Though murine studies have examined the molecular networks that drive the transition from homeostatic- to pathogenic-Th17 fate, this switch is still poorly understood in human. Our transcriptome analysis revealed FOSL1 and FOSL2 to jointly suppress several genes that promote Th17-pathogenicity (GZMB 117, IL23R 118, 119, RBPJ 61, BCL3 57, IFN-γ 46, TBX21 103, 117, 120). Interestingly, over-expressing these AP-1 factors downregulated IL-26, a cytokine that marks inflammatory Th17-populations in patients suffering from Crohn’s disease 121. They further co-inhibited expression of FGF2, which coordinates with IL-17A to drive autoimmune arthritis 47. These findings suggest that FOSL1 and FOSL2 could help in retaining the protective nature of Th17 cells, under conditions of adversity. Additionally, these factors synergistically altered several receptors/ligands that govern the migration of inflammatory T cells in autoimmune phenotypes (CCL3L3 122, CCL4 123, CXCL8 124, CXCR3 80–82, CCR6 70). Further investigation on how FOSL proteins modulate pathogenic Th17- signaling, could define their potential in treatment of relevant diseases.
STAT3 acts as a master-regulator of Th17-differentiation in human and mouse 26, 43, 125–128. We found that FOSL proteins inhibit several STAT3-induced genes (HOPX, IL23R, RBPJ, IL24, CCR6, GZMB)26 that drive Th17-effector responses. Despite their opposite roles in controlling Th17-fate, STAT3 positively regulated FOSL1 and FOSL2 expression in human Th17 cells. The existence of a STAT3-based mechanism to drive such lineage- inhibiting TFs could be explained through recent studies in which STAT3 was found to propel a negative-feedback loop that limits Th17-mediated tissue-damage in human 129.
The functional antagonism between FOSL2 and BATF is well-reported in mouse 1. Our study is the first one to investigate the relationship between these factors in human Th17 cells. Our findings further reveal how BATF function diverges from FOSL1 at the level of transcriptional regulation, which has not been addressed before. BATF and FOSL factors were found to directly bind and oppositely-regulate key Th17 marker genes (IL17A, IL17F, IL23R, CCR6, IL21), along with other candidates that are associated with the lineage (IL3, STAT4, FASLG, PRDM1, IL12RB2, HOPX). A cardinal target among these was FASLG, which is a crucial regulator of apoptosis 33, 34, 79. We found its expression to be driven by FOSL proteins and inhibited by BATF. Responsiveness to FAS-signaling contextually varies for pro-inflammatory and anti-inflammatory cells and is reported to subsequently decide whether autoimmunity develops 33, 130, 131. Insights on AP-1-controlled FAS networks could thus hold significance in disease-research.
In the present study, BATF directly regulated expression of Th17-lineage genes by occupying their putative promoter-regions. However, the BATF-bound sites that co-localized with FOSL in the vicinity of their oppositely-regulated targets, mostly occurred within intergenic or intronic elements. In mouse, several AP-1 factors were found to co-bind intergenic sites at the Il17a/Il17f locus and regulate its expression 2 . These shared regions resemble canonical AP-1 binding sequences. This paradigm appears to be conserved, since we discovered FOSL1, FOSL2 and BATF to similarly intersect over the human IL17 loci. Many studies including ours, reveal that such binding convergence occurs over enhancer landscapes 76, 89, 132, which could drive subset-specific gene expression in CD4+ T cells. Helper T-cell differentiation also requires pioneering functions from BATF, which mediates nucleosomal clearance at key lineage-associated loci 133. Although FOS proteins extensively overlap with BATF-bound sites, their ability to alter chromatin accessibility during early stages of differentiation is yet to be examined.
Using data from genome-wide association studies, we identified hundreds of autoimmune disease-associated SNPs within the genomic regions bound by FOSL1, FOSL2 and BATF. Findings from an ongoing study of our lab further revealed that a large fraction (60–80%) of the binding sites for these TFs also overlap with Th17-specific enhancers. Remarkably, the enhancer-specific binding sites of FOSL1, FOSL2 and BATF harbored as many as 100, 470 and 478 disease-linked SNPs, respectively. Notably, over 50 of these SNPs were common across the three factors. These single-base changes could significantly alter AP-1 function at distal regulatory elements that dictate Th17 gene expression programs. To further explore the functional significance of our SNP analysis, we performed in vitro DNA- binding assays. These demonstrated that introducing selected SNPs within the identified AP- 1 binding sites, altered the ability of a given TF to occupy its motif. This could influence gene-expression profiles and disrupt the regulatory networks governed by FOS and ATF proteins in early-differentiating Th17 cells, thus contributing to the development of autoimmunity.
Author contributions
A.S designed and performed the experiments, analyzed data, prepared figures, performed part of computational analysis, and wrote the manuscript; S.K.T. initiated the study, designed and performed the experiments, provided expertise, analyzed data and wrote the manuscript; S.J performed major part of computational analysis for the data, interpreted the results, prepared figures and wrote part of the methods; T.B performed experiments, analyzed data, prepared figures and wrote part of the methods; R.B. prepared cultures and assisted with experiments;
S.D.B. analyzed data and prepared figures for FOSL protein-interaction study; T.E analyzed a part of the ChIP-seq data; A.L performed preliminary analysis for transcriptomics; R.M provided expertise on FOSL protein-interaction study; O.R. provided expertise, assisted with experiments and edited the manuscript; S.G. provided expertise and supervision and edited the manuscript; L.L.E. provided expertise, participated in the interpretation of the results, provided guidance and supervision and edited the manuscript; R.L. designed the study setup, provided expertise, participated in the interpretation of the results, provided guidance and supervision, and wrote the manuscript. All authors have contributed to the manuscript.
Conflict of interest
The authors declare no conflict of interest.
Methods
Primary human CD4+ T-cell isolation and Th17 culture
Human cord blood mononuclear cells (CBMCs) were isolated from the umbilical cord blood of healthy neonates (Turku University Central Hospital, Turku, Finland) uisng the Ficoll- Paque density gradient centrifugation (Ficoll-Paque PLUS; GE Healthcare). Naive CD4+ T cells were further purified using CD4+ Dynal positive selection beads (Dynal CD4 Positive Isolation Kit; Invitrogen). CD4+ T-cells were stimulated with plate-bound α) over cytokine gene-CD3 (3.75 µg/ml; Immunotech) and soluble α) over cytokine gene-CD28 (1 μg/mL; Immunotech) in X-vivo 20 serum-freeg/mL; Immunotech) in X-vivo 20 serum-free medium (Lonza). X-vivo 20 medium was supplemented with L-glutamine (2 mM, Sigma- Aldrich) and antibiotics (50 U/mL penicillin and 50 μg/mL; Immunotech) in X-vivo 20 serum-freeg/mL streptomycin; Sigma-Aldrich). Th17 cell polarization was induced using a cytokine cocktail of IL-6 (20 ng/mL; Roche), IL- 1β (10 ng/mL) and TGF-β (10 ng/mL) in the presence of neutralizing anti-IFN-γT, RORα) over cytokine gene (1 μg/mL; Immunotech) in X-vivo 20 serum-freeg/mL) and anti-IL-4 (1 μg/mL; Immunotech) in X-vivo 20 serum-freeg/mL) to block Th1 and Th2 differentiation, respectively. For the control cells (Th0), CD4+ T-cells were TCR stimulated with α) over cytokine gene-CD3 and α) over cytokine gene-CD28 in the presence of neutralizing antibodies (without differentiating cytokines). All cytokines and neutralizing antibodies used in the study were purchased from R&D Systems unless otherwise stated. All cultures were maintained at 37°C in a humidified atmosphere of 5% (v/v) CO2/air.
Western blotting
Cell culture pellets were lysed using RIPA buffer (Pierce, Cat no. 89901), supplemented with protease and phosphatase inhibitors (Roche) and sonicated using Bioruptor UCD-200 (Diagenode, Seraing, Belgium). Sonicated lysates were centrifuged at 14,000 rpm for 20 min at 4°C and supernatants were collected. Samples were estimated for protein concentration (DC Protein Assay; Bio-Rad) and boiled with 6x Laemmli buffer (330 mM Tris-HCl, pH 6.8; 330 mM SDS; 6% β-ME; 170 μg/mL; Immunotech) in X-vivo 20 serum-freeM bromophenol blue; 30% glycerol). Samples were loaded on gradient Mini-PROTEAN TGX Precast Protein Gels (BioRad, Helsinki, Finland) and transferred to PVDF membranes (Trans-Blot Turbo Transfer Packs, BioRad).
The following antibodies were used: anti-FOSL1 (Cell Signaling Tech, Cat no. 5281), anti-FOSL2 (Cell Signaling Tech., Cat no.19967); anti-STAT3 (Cell Signaling Tech., Cat no. 9139); anti-BATF (Cell Signaling Tech., Cat no. 8638), anti-STAT4 (Cell Signaling, 2653); anti-NT5E/CD73 (Cell Signaling Tech., Cat no. 13160); anti-APOD (Santa Cruz, Cat no. sc- 166612); anti-JUNB (Santa Cruz, Cat no. sc-8051); anti-RORC (eBioscience, Cat no. 14-6988-82) and anti-β-actin (SIGMA, Cat no. A5441). HRP conjugated anti-mouse IgG (SantaCruz, Cat no. sc-2005) and anti-rabbit IgG (BD Pharmingen, Cat no. 554021) were used as secondary antibodies.
Flow cytometry
The following antibodies were used for flow cytometry: anti-CCR6 PE (BD Cat no. 559562); anti-FOSL1 (Santacruz Biotechnology, Cat no. sc-28310); anti-FOSL2 (Cell Signaling Tech., Cat no.19967); APC-NT5E (CD73) monoclonal antibody (AD2) (Thermo Fischer, Cat no.17- 0739-42), PE anti-human CD70 antibody (Biolegend, Cat no. 355103). For the primary antibodies that were unlabeled, the following secondary antibodies were used: Alexa 647 anti-mouse (Life Technologies, Cat no. A21235) and Alexa 647 anti-rabbit (Life Technologies, Cat no. A21245).
Anti-CCR6, anti-CD70 and anti-CD73 surface staining was performed 72 h after initiation of Th17 culture, for which cells were washed twice with FACS buffer (0.5% FBS/0.1% Na-azide/PBS) and incubated with pre-labelled antibody for 20 min at 4°C. For intracellular staining, cultured cells (24 or 72 h) were fixed and permeabilized according to the manufacturer’s instructions by IC staining buffers (Invitrogen, Cat nos. 00-5223-56; 00- 5123-43; 00-8333-56). Cells were incubated with primary antibodies for 2 h and subsequently washed using Perm Buffer. This was followed by 30-min incubations with labelled secondary antibodies. Suitable isotype or secondary antibody controls were maintained. Samples were acquired on LSRII (BD Biosciences, Franklin Lakes, NJ); live cells were gated based on forward and side scattering. The acquired data was analyzed with FlowJo (FLOWJO, LLC).
Cytokine-induction assay
Naive CD4+ T cells were cultured under the following conditions: CD3/CD28 activation (Th0), Th0 with IL-6, Th0 with IL-1β, Th0 with TGF-β, Th0 with IL-6 and IL-1β, Th0 with IL-6 and TGF-β, Th0 with IL-1β and TGF-β, and Th17 differentiation conditions for 24 h. The neutralizing antibodies anti-IFN-γT, RORα) over cytokine gene and anti-IL-4 were added to each of these conditions. All cytokine and antibody concentrations were as described for Th17 culture conditions. FOSL1 or FOSL2 levels were estimated using Flow cytometry by performing Intracellular staining (described in the Flow Cytometry methods).
RNAi silencing
CD4+ T cells from umbilical cord blood were suspended in Opti-MEM I (Invitrogen) and transfected with the respective targeting siRNA using the nucleofection technique of Lonza. Control cells were treated with non-targeting siRNA (Sigma).
I. STAT3 and BATF knockdown (KD)
Four million cells were transfected with 6 µg of STAT3- or BATF-targeting siRNA after which the cells were rested at 37° C for 36–40 h in RPMI 1640 medium (Sigma-Aldrich) supplemented with pen/strep, L-glutamine (2 mM) and 10% FCS, and subsequently activated and cultured under Th17 conditions.
For identification of BATF target genes, cells were harvested at 24 and 72 h post- induction of polarization. Three biological replicates were prepared, each time, including BATF targeting siRNA and non-targeting control siRNA. Total RNA was isolated and samples were prepared. A pool of two siRNAs was used for silencing BATF. II.FOSL1/FOSL2 knockdown (KD) and double KD (DKD)
For single KD, four million cells were transfected with 5 µg of FOSL1 or FOSL2-targeting siRNAs, and the rest of the protocol was followed as described in (I). Two different siRNAs were used to target FOSL1 and FOSL2 each.
For double KD (DKD), four million cells were nucleofected with 10 μg/mL; Immunotech) in X-vivo 20 serum-freeg of FOSL- targeting siRNA (5 µg FOSL1 + 5 µg of FOSL2) or 10 μg/mL; Immunotech) in X-vivo 20 serum-freeg of Scramble siRNA. FOSL1 or FOSL2 single knockdown (KD) nucleofections were performed for comparison (5 µg FOSL1/FOSL2 siRNA + 5 µg of control siRNA). The rest of the protocol was followed as described in (I). For identification of global targets - SCR, KD and DKD Th17 cells were harvested at 24 and 72h of polarization. Three biological replicates were prepared and subjected to further downstream analysis.
FOSL1/ FOSL2 over-expression (OE) and Double over-expression (DOE)
I. Generating in-vitro transcribed (IVT) RNA
To generate linearized vectors for the IVT reaction, the T7 promoter containing plasmids - empty pGEM-GFP64A, pCMV6-AC-GFP-FOSL1 (Origene, Cat no. RG202104) and pCMV6-AC-GFP-FOSL2 (Origene, Cat no. RG204146), were in vitro digested using the restriction enzymes Spe1 (NEB, Cat no. R0133), Xma1 (NEB, Cat no. R0180) and Ssp1 (NEB, Cat no. R3132), respectively. Digestion was performed for 1 h using Cut Smart Buffer (NEB, Cat no. B7204S). Next, using the generated templates, IVT RNA was produced using Cell Script MessageMAXTM T7 ARCA-Capped Message Transcription Kit (Cell Script, Cat.no. C-MMA60710, Madison, WI), as per manufacturer’s instructions. Precipitation with 10 M lithium chloride (LiCl) was used to precipitate the product (-20○C, O/N), followed by 70% ethanol washes (two washes, each followed by a 10-min centrifuge spin) and resuspension in nuclease-free water. The size of the RNA was confirmed using BioRad Experion or Agilent Bioanalyzer at this step. The RNA was further poly-adenylated using Cell script A-Plus™ Poly(A) Polymerase Tailing Kit (Cell Script, Cat no. C-PAP5104H). LiCl precipitation was repeated, and the final pellet was resuspended in nuclease-free water. RNA concentration was determined using a Nanodrop™ detector (Thermo Scientific) and the IVT RNA was stored at -80○C till further use.
II. Nucleofection
For double over-expression (DOE), 4 million cells were nucleofected with either FOSL1+FOSL2 IVT RNA (56 pmoles of FOSL1 + 56 pmoles of FOSL2) or control GFP RNA (112 pmoles). Single over-expression controls (OE) for FOSL1/FOSL2 were also maintained (56 pmoles of FOSL1/FOSL2 + 56 pmoles of control siRNA). We ensured equimolar RNA amounts across the different nucleofection conditions. Cells were rested for 16–20 h post-nucleofection and further cultured under Th17 conditions. For identification of global targets - GFP, single OE and double OE Th17 cells were harvested at 24 and 72 h of polarization. Three biological replicates were prepared and subjected to sample preparation for RNA-sequencing analysis (as described under ‘gene-expression analysis’).
IL-17 secretion
Secreted IL-17A levels were estimated using cell-culture supernatants of 72-h cultured Th17 cells using either the Milliplex MAP human IL-17A kit (Merck Millipore; HCYTOMAG- 60K-01), Bioplex human IL-17A Cytokine/chemokine 96-Well Plate Assay (Bio Rad; Cat. no. 171B5014M, 171304090M) or human IL-17A Duoset ELISA kit (R&D Biosystems DY317-05, DY008). The amount of IL-17A secreted by Th17 cells was normalized with the number of living cells determined based on forward and side scattering in flow cytometric analysis (LSRII flow cytometer; BD Biosciences).
Immunoprecipitation
Immunoprecipitation for BATF was performed using Pierce MS-Compatible Magnetic IP Kit (Thermo Fischer, Cat no.90409). 72-h cultured Th17 cell pellets were lysed in appropriate volumes of cell-lysis buffer provided in the kit. BATF antibody (Cell Signaling Tech., Cat no. 8638) or control rabbit IgG (Cell Signaling, Cat no. 2729) was pre-incubated with protein A/G beads for 4–5 h to form antibody-bead complexes. Lysates were first pre-cleared with control IgG-bead complexes for 3 h. The pre-cleared lysates were then incubated overnight with BATF antibody-bead complexes (test IP) or control IgG-bead complexes (negative IP control). Immunoprecipitated protein complexes were washed (following manufacturer’s protocol) and further eluted with appropriate volume of elution buffer. Eluted protein was run for immunoblotting.
Antibodies used for IP-immunoblotting are as follows: anti-BATF (Cell Signaling Tech, Cat no. 8638); anti-RUNX1 A-2 (Santa Cruz Biotechnology, Cat no. sc-365644); anti- JUNB C-11 (Santa Cruz Biotechnology, Cat no.sc-8051); anti-STAT3 (Cell Signaling Tech., Cat no. 9139); anti-IRF4 (P173) (Cell Signaling Tech., Cat no. 4964); anti-SIRT1 (Cell Signaling Tech., Cat no. 2496); anti-JUN (BD Biosciences, Cat no.610326). Conformation- specific rabbit HRP (Cell Signaling Tech., Cat no.5127) and mouse HRP (Cell Signaling Tech., Cat no. 58802) were used as secondary antibodies.
Immunofluorescence analysis
CD4+ T cells were cultured for 72 h under Th17 differentiation conditions and then spun down on poly-L-lysine-coated coverslips at 800 rpm. Cells were washed, fixed and permeabilized using Ebioscience Intracellular Staining kit (Invitrogen Cat nos.00-5223-56, 00-5123-43 and 00-8333-56). Permeabilized cells were further incubated overnight with primary antibodies against FOSL1 (Santacruz Biotechnology, Cat no. sc-28310) / FOSL2 (Cell Signaling Tech, Cat no.19967) and Lamin A/C (Santacruz Biotechnology, Cat no. sc- 7292). Cells were washed with Permeabilization buffer and further incubated for 60 mins with the respective anti-mouse or anti-rabbit Alexa flour secondary antibodies (Invitrogen Cat nos. A11031; A31572; A21202). Atto-Phalloidin A647 (Sigma, Cat no.65906) was used to stain cytoplasmic actin. Stained cells were finally mounted in Prolong Gold Antifade Mountant with DAPI (Life Technologies, Cat no. P36941) and imaged on Zeiss 780 Confocal microscope.
Gene-expression analysis
I. RNA Isolation and RNA-Seq Sample Preparation
RNA was isolated (RNeasy Mini Kit; QIAGEN, Cat no. 74104) and given on-column DNase treatment (RNase-Free DNase Set; QIAGEN) for 15 min. The removal of genomic DNA was ascertained by an additional treatment of the samples with DNase I (Invitrogen, Cat no. 18068-015). After RNA quantification (using NanoDrop™ 2000) and quality control (using BioRad Experion or Agilent Bioanalyzer), libraries for RNA-Seq were prepared. The high quality of the libraries was confirmed with Advanced Analytical Fragment Analyzer (Advanced Analytical Technologies, Heidelberg, Germany) or with Agilent Bioanalyzer, and the concentrations of the libraries were quantified with Qubit® Fluorometric Quantitation (Life Technologies, ThermoFisher). Sequencing was performed at the Finnish Functional Genomics Centre (FFGC) using HiSeq3000 Next-Generation Sequencing platform.
II. Alignment and Differential Expression Analysis
50-bp single-end reversely-stranded sequencing reads were checked for quality using FastQC (v.0.11.14) 134 and MultiQC (v.1.5)135. High-quality reads were aligned to the human reference genome (hg38) using R (v.3.6.1) 136/ Bioconductor(v.3.9) 137 package Rsubread (v.1.34. 138 which was also used for producing the gene-wise read counts based on RefSeq gene annotations. Statistical testing and differential expression analysis was performed using Bioconductor package ROTS (v.1.12.0)139. For each comparison, the expressed genes (CPM expression value > 1) in at least 50% of the replicates in one of the compared sample groups were included in the statistical testing. DE genes were identified with cut-offs of false discovery rate (FDR) < 0.1 and absolute fold- change > 1.8 (unless otherwise specified). The DE gene heatmaps were produced using R package pheatmap (v. 1.0.12).
III. Quantitative real-time PCR
Total RNA was isolated as described earlier in ‘RNA Isolation and RNA-Seq Sample Preparation’. cDNA was synthesized using SuperScript II Reverse Transcriptase and oligo(dT) primers as described in the manufacturer’s instructions (Invitrogen, Cat nos. 18064-014 and 18418012). TaqMan primers and probes were designed with Universal Probe Library Assay Design Centre (Roche). All Taqman reactions were performed using Absolute QPCR Mix, ROX (Thermo scientific, Cat no. AB1139A). EF1α) over cytokine gene was used as endogenous control. The qPCR runs were analysed using the 7900HT Fast Real- Time PCR System (Applied Biosystems).
ChIP-seq analysis
I. Sample preparation
CD4+ T cells were cultured under Th17 cell polarizing conditions for 72 h. Chromatin was prepared from 40–50 million cells using Diagenode Chromatin shearing optimization kit (Cat no. C01010055) and further subjected to sonication using Bioruptor sonicator (Diagenode) to obtain chromatin fragments of 100–500 bps. Fragmented chromatin was incubated with 10-– 12 µg of FOSL1 (Santacruz Biotechnology, Cat no.sc-28310), FOSL2 (Cell Signaling Tech, Cat no.19967) or BATF (Cell Signaling, Cat no. 8638) antibody and incubated with magnetic beads for crosslinking (Dynal Biotech/Invitrogen, Cat no. 112.04). The crosslinks were further reversed (65°C for 12–16 h, mixer conditions), treated with proteinase K and RNase A and then purified using QIAquick PCR purification kit (QIAGEN, Cat no. 28104). DNA libraries were prepared using two replicates of each TF ChIP and sequenced on Miseq Nano (Fasteris Life Sciences, Plan-les-Ouates, Switzerlan).
II. Analysis
75-bp paired-end reads were obtained, and quality control was performed with FastQC (v. 0.11.4) (https://www.bioinformatics.babraham.ac.uk/projects/fastqc/). The adapter sequences present in the raw reads were trimmed using TrimGalore! (v. 0.4.5) (https://www.bioinformatics.babraham.ac.uk/projects/fastqc/), and the trimmed reads were mapped to the hg38 reference genome using Bowtie2 (v. 2.3.3.1) 140. Duplicate reads were marked with Picard tools (v. 2.20.2) (https://broadinstitute.github.io/picard/) MarkDuplicates function and reads with mapping quality < 30 were filtered out using samtools (v. 1.9) 141. Sample quality was controlled by calculating cross-correlation scores and the non-redundant fraction with phantompeakqualtools (v. 1.2) 142, 143 and preseq (v. 2.0) 144, respectively. Peaks were called using MACS2 (v. 2.1.0) 145, and reproducible peaks were identified using IDR 146 with an FDR cut-off of 0.01. R packages ChIPpeakAnno (v. 3.21.7) 91, and EnsDb.Hsapiens.v86 (v. 2.99.0) were used to annotate the peaks and identify peaks common to all three transcription factors with a minimum overlap of 200 bp. In addition to the nearest features, the annotation includes any features that overlap the peaks resulting in more than one row per peak for many of the peaks in the excel files provided as supplementary files. The number of peaks common to the transcription factors reported in the main text and in the Venn diagrams, is the minimum number of overlapping peaks. Enriched transcription factor binding site motifs within the peaks were identified by Homer (v. 4.11) using both de novo and known motifs. A 200-bp region size was used for motif finding.
III. Re-alignment of publicly available H3K27Ac dataset
Publicly available H3K27Ac ChIP-seq 147 data for FACS-sorted Th17 cells derived from human peripheral blood and further activated for 5 days, was acquired from GEO (GSE101389). Since the original alignment was to hg19, raw reads were obtained and re- aligned to hg38 with Burrows-Wheeler alignment (BWA). Bigwig files were generated using bam coverage, normalized to Rpkm. Input subtracted files were generated using Compare Utility from deepTools.
IV. Data representation
a. Clustered heatmap
b. Heatmap for direct targets of FOSL1, FOSL2 and BATF
Common sites for FOSL1, FOSL2 and BATF obtained from ChIP-peak Anno analysis, were annotated to the nearest TSS using Homer. Of these, the genes differentially regulated in DKD or DOE (FDR < 0.1 and fold-change > 1.5) were considered. Their corresponding RNA-seq expression changes were acquired using ‘Joint two files’ operation on Galaxy Europe. Subsequent heatmaps were plotted using ‘plotHeatmap’ function from deepTools 149.
Ingenuity Pathway Analysis (IPA)
Pathway analysis was performed using Ingenuity Pathway Analysis (IPA, www.qiagen.com/ingenuity; Qiagen; March 2019) tool. IPA pathways with p-value <0.01 were considered as significantly enriched.
Volcano plots
I. Volcano plot for double KD, double OE and BATF KD RNA-seq targets
List of DE targets was acquired from RNA-seq analysis of double KD (24 and 72 h), double OE Th17 (72 h) or BATF-silenced (24 and 72 h) Th17 cells. Volcano plots were generated using the ‘Volcano Plot’ function of Galaxy Europe under ‘Graph/Display Data’ 149. Targets with FDR < 0.1 and fold change > 1.8 were highlighted in red (upregulated) or blue (downregulated). Selected Th17-relevant genes were represented with labelled boxes.
II. Volcano plot for direct targets shared between FOSL1 and FOSL2
FOSL1 and FOSL2 common sites obtained from ChIP-peak Anno analysis, were annotated to the nearest TSS using Homer. Of these, the genes differentially regulated in double KD or double OE (FDR<0.1 and fold-change>1.5) were considered. The corresponding RNA-seq expression changes for the listed targets were acquired and subsequent volcano plots were created as described above 149.
Cytoscape networks for shared interactors of FOSL1 and FOSL2
The list of shared interactors for FOSL1 and FOSL2 was obtained from an ongoing study of our lab (unpublished data). The common binding partners with known relevance to T-cell function were mapped against the STRING database. The assigned protein-protein interaction (PPI) network was further visualized using Cytoscape 151.
STRING interactome for BATF
A predictive interactome network for BATF was acquired using the STRING database (Only ‘Text mining’ and ‘Experiments’ were considered as the information source for the predicted partners). The minimum required interaction score was set to 0.7 (high confidence). The maximum number of interactors to be displayed in first shell was restricted to 10.
Graphical representation and Venn diagrams
All graphs were plotted using GraphPad Prism software (V8.3.0). Two-tailed students T-test was used to calculate statistical significance, unless otherwise mentioned. All Venn diagrams were generated using Biovenn 152 or Venny 153.
SNP analysis
SNPs associated with 11 auto-immune diseases within the peaks were analyzed for enrichment with R package snpEnrichR (v. 0.0.1) 154. The SNPs were queried from the NHGRI-EBI GWAS catalogue; SNPs from studies with meta-analysis of more than one disease and from populations other than Caucasian were excluded from further analysis, and correlated SNPs were clumped (distance = 1000 kb, LD r2 = 0.8). Random SNP sets matching the disease-associated SNPs were produced using SNPsnap 155 server with default parameters except distance = 1000 kb, LD buddies ±20%, r2 = 0.8. Proxy SNPs for both disease-associated and random SNPs were calculated using Plink (v1.90b6.16) (www.cog-genomics.org/plink/1.9/) 156 from 1000 genomes EUR population. SNPs and their proxies (distance within 100 kb and r2 > 0.8, determined from 1000 genomes Eur population) overlapping the peaks, were identified and annotated to the nearest neighbor gene using ChIPpeakAnno. SNPs and proxies overlapping known transcription factor motifs were identified using annotatePeaks.pl from Homer. Motifs were searched within a 30-bp region around each SNP coordinate.
DNA affinity precipitation assay
DNA affinity precipitation assay (DAPA) experiments were performed as described 26, 96, 157 with minor modifications. In brief, annealed biotinylated sense and non-biotinylated antisense bait oligonucleotides were purchased from Integrated DNA Technologies, Inc. Oligonucleotide probes containing the FOSL1, FOSL2 and BATF DNA binding motif were designed with or without SNP mutation . Mutations introduced to the oligonucleotides are highlighted in bold. BATF-specific and mutated sequences were used as a positive control.
Neutravidin beads (Ultralink immobilized neutravidin protein, Pierce) were washed 4x with buffer A (10 mM HEPES pH 7.9, 60 mM KCl, 2 mM EDTA, 1 mM EGTA, 0.1% Triton X-100, 1 mM DTT, and protease and phosphatase inhibitors from Roche). Annealed oligonucleotides were incubated with 25 μg/mL; Immunotech) in X-vivo 20 serum-freel of beads in 200 μg/mL; Immunotech) in X-vivo 20 serum-freel buffer A for 1.5 h at +4°C with rotation at 360° rotator, followed by 4x wash with buffer A. Nuclear fraction isolated from Th17 cells cultured for 72 h (Nuclear and Cytoplasmic Extraction Reagents kit, Pierce) was subjected to buffer 2 (10 mM HEPES, pH 7.9, 2 mM EDTA, 1 mM EGTA, 0.1% Triton X- 100, 1 mM DTT, and protease and phosphatase inhibitors from Roche) to dilute any KCl salt. Pre-clearing was performed with unconjugated beads by incubating for 1.5 h in a 360° rotator at +4°C. Binding reactions of pre-cleared nuclear fraction with bead-conjugated oligonucleotides was performed for 4 h at +4°C, followed by washing four times with buffer
A. Protein pull-down precipitates were eluted by incubating beads at 95°C for 5 min in 50 μg/mL; Immunotech) in X-vivo 20 serum-freel of 2xSDS buffer (125 mM Tris-HCl, pH 6.8, 4% w/v SDS, 20% glycerol, 100 mM DTT). FOSL1, FOSL2 and BATF protein was analyzed by western blotting using rabbit monoclonal FOSL1 antibody (D80B4; 1:500), rabbit monoclonal FOSL2 antibody (D2F1E; 1:1000) and rabbit monoclonal BATF antibody (D7C5; 1:1000) from Cell Signaling Technology.
Supplementary Figures and Legends

a. Immunoblot images show FOSL1 and FOSL2 protein levels in naive CD4+ T cells cultured under activation (Th0) or Th17 differentiation conditions, for the indicated time points. Actin has been used as loading control. Data represents biological replicates for Fig. 1b.
b. Nucleofection workflow. Naive CD4+ cells were treated with FOSL1 or FOSL2 targeting siRNAs, rested for 36-40 h, and further cultured under Th0 or Th17-polarizing conditions (IL-6, IL-1β and TGF-β) for 72 h.
c. Immunoblots depict FOSL1 and FOSL2 protein levels in naive CD4+ T cells that were silenced for the respective factors and cultured under Th17-polarizing conditions for 24h. Non-targeting siRNA (Scramble or SCR) was used as nucleofection control and actin was used as loading control. Blots shown are biological replicates for Fig. 1e.

a & b. Naive CD4+ T cells were treated with FOSL KD/DKD (panel a) or OE/DOE (panel b) conditions. Treated cells were differentiated to Th17 fate for 24h and then stained (Alexa- 647) for total FOSL1 and FOSL2 protein. Expression was analyzed using flow cytometry and overlay histograms were plotted. Data shows biological replicates for Fig.2a and Fig.2b.

a & b. Heatmaps show scaled expression values for selected DE genes (FDR≤0.1, |fold change|≥1.5) in FOSL DOE (Panel a) and FOSL DKD (Panel b) Th17 cells, at the indicated time points. Targets associated with Th17-function are highlighted.
c. Venn diagram shows the overlap for the statistically significant DKD targets (FDR≤0.1, | fold change|≥1.8) at 24h and 72h of Th17 polarization.
d. CCR6 expression was analyzed by flow-cytometry in KD/DKD (right panel) or OE/DOE cells (left panel), at 72h of Th17 polarization. MFI values were normalized to the respective controls (SCR or Empty GFP) and plotted. Data represents three or four biological replicates, as indicated. Statistical significance has been calculated using two-tailed Student’s t test (*p < 0.05, **p < 0.01, ***p < 0.001).
e. Figure shows flow-cytometry analysis of NT5E (left panel) and CD70 (right panel) expression in FOSL KD/DKD cells at 72h of Th17 polarization. Bar plots show MFI values that are normalized to control. Data is representative of three biological replicates. Statistical significance has been calculated using two-tailed Student’s t test (*p < 0.05, **p < 0.01, ***p < 0.001).

a-d. Western blots show protein-level expression of STAT4, NT5E, APOD and JUNB in FOSL KD and DKD Th17 cells (72h). The immunoblots (lower panel) were quantitated using ImageJ and the corresponding intensity values were plotted as bar graphs (upper panel). Actin served as loading control and was used for normalization. The JUNB and STAT4 blots for replicate 4 share the same loading control. Data is representative of three (NT5E, APOD) or four biological replicates (JUNB, STAT4). Graphs show mean ± standard error of the mean (SEM). Statistical significance has been calculated using two-tailed Student’s t test (*p < 0.05; **p < 0.01).

a. Bar plot depicts stacked peak-annotation results for binding sites of FOSL1 and FOSL2 in 72h Th17-polarized cells.
b. Genes that were cooperatively-regulated and showed co-localized binding of FOSL1 and FOSL2 were annotated as their shared-direct targets. Venn diagram in the figure highlights (in bold) the DE genes that show shared occupancy of the two factors within putative- promoter regions (5kb around TSS). Selected candidates with relevance to Th17-regulation are marked in the volcano plots of Fig. 4d.

a. Heatmaps show top DE genes (FDR≤0.1, |fold change|≥1.8) in BATF-silenced Th17 cells at 24h (left) and 72h (right) of polarization. Scaled expression values are plotted and genes associated with Th17 function are highlighted (upregulated genes are in red, downregulated genes in blue).
b. Bar plot shows percentage of CCR6 positive cells in non-targeting versus BATF-silenced Th17 cells at 72h of polarization.
c. qRT-PCR analysis shows fold changes of IL-17A (left) and IL-17F (right) transcripts in non-targeting and BATF-silenced Th17 cells at 72h of polarization.
d. Western blot analysis shows STAT4, RORC and BATF protein levels in BATF KD cells that were polarized to Th17 fate for 72h. Data for three biological replicates is shown and the quantified bar plot is provided as a part of main Fig. 6f

a. Network illustrates the common binding partners of FOSL1 and FOSL2 in Th17-polarized cells (72h). Data for the network was obtained from an ongoing study of our lab (unpublished data). Interactors having reported roles in T cell function are shown.
b. STRING network analysis for human BATF has been shown. Width of lines between the nodes indicate confidence values for each association. Only interactions with a minimum score of 0.7 are shown (high confidence).
c & d. Immunoprecipitated BATF was analyzed for its interaction with a few selected binding partners of FOS-like proteins (JUNB, SIRT-1, JUN and RUNX1), using western blotting (panel c). Additionally, BATF-interaction with STAT3 and IRF4 was analyzed to validate their previously-known association in mouse (panel d, data is representative of three biological replicates).

a. Table illustrates information on the autoimmune-linked SNPs that are harbored within consensus AP-1 binding sequences and occur at the common binding sites of FOSL1, FOSL2 and BATF. The sequence logos shown have been derived from the respective TF ChIP-seq peaks using Homer.
b & c. DAPA analysis was performed to test the effect of specific SNPs on DNA-binding abilities of FOSL1, FOSL2 and BATF. The immunoblot images in panel b and c show biological replicates for Fig. 7c and 7d respectively.
Acknowledgements
We thank all voluntary blood donors and personnel of Turku University Hospital, Department of Obstetrics and Gynecology, Maternity Ward (Hospital District of Southwest Finland) for the umbilical cord blood collection. We are grateful to Marjo Hakkarainen and Sarita Heinonen for their excellent technical help and Saurabh Pradhan for assistance with bioinformatic analysis. We duly acknowledge the Turku Bioscience Centre’s core facilities, namely, the Finnish Functional Genomics Centre (FFGC), Turku Proteomics Facility and Cell Imaging Core (CIC) Facility supported by Biocenter Finland, for their assistance. The Finnish Centre for Scientific Computing (CSC) is acknowledged for its efficient servers and data analysis resources.
A.S was supported by Erasmus Mundus Scholarship and University of Turku (UTU). S.K.T. was supported by the Juvenile Diabetes Research Foundation Ltd (JDRF; grant 3-PDF-2018- 574-A-N);
R.L. received funding from the Academy of Finland (grants 292335, 292482, 298732, 294337, 298998, 31444, 315585, 319280, 329277, 323310, 331790) by grants from the JDRF, the Sigrid Jusélius Foundation (SJF); Jane and Aatos Erkko Foundation and the Finnish Cancer Foundation. L.L.E received grants from the European Research Council ERC (677943), Academy of Finland (296801, 310561, 314443, 329278, 335434 and 335611), and Sigrid Jusélius Foundation during the conduct of the study. Our research is also supported by University of Turku Graduate School (UTUGS), Biocenter Finland, and ELIXIR Finland.
References
- 1.↵
- 2.↵
- 3.↵
- 4.↵
- 5.↵
- 6.↵
- 7.↵
- 8.↵
- 9.
- 10.
- 11.↵
- 12.↵
- 13.↵
- 14.↵
- 15.↵
- 16.↵
- 17.↵
- 18.↵
- 19.↵
- 20.↵
- 21.↵
- 22.↵
- 23.↵
- 24.↵
- 25.↵
- 26.↵
- 27.
- 28.↵
- 29.↵
- 30.↵
- 31.↵
- 32.↵
- 33.↵
- 34.↵
- 35.↵
- 36.↵
- 37.↵
- 38.
- 39.↵
- 40.
- 41.
- 42.
- 43.↵
- 44.↵
- 45.↵
- 46.↵
- 47.↵
- 48.↵
- 49.↵
- 50.
- 51.
- 52.
- 53.↵
- 54.
- 55.↵
- 56.↵
- 57.↵
- 58.↵
- 59.↵
- 60.↵
- 61.↵
- 62.↵
- 63.↵
- 64.↵
- 65.↵
- 66.↵
- 67.↵
- 68.↵
- 69.
- 70.↵
- 71.↵
- 72.↵
- 73.↵
- 74.↵
- 75.↵
- 76.↵
- 77.↵
- 78.↵
- 79.↵
- 80.↵
- 81.
- 82.↵
- 83.↵
- 84.↵
- 85.↵
- 86.↵
- 87.↵
- 88.
- 89.↵
- 90.↵
- 91.↵
- 92.↵
- 93.↵
- 94.↵
- 95.↵
- 96.↵
- 97.↵
- 98.↵
- 99.↵
- 100.↵
- 101.↵
- 102.↵
- 103.↵
- 104.↵
- 105.↵
- 106.↵
- 107.↵
- 108.↵
- 109.↵
- 110.↵
- 111.↵
- 112.↵
- 113.↵
- 114.↵
- 115.↵
- 116.↵
- 117.↵
- 118.↵
- 119.↵
- 120.↵
- 121.↵
- 122.↵
- 123.↵
- 124.↵
- 125.
- 126.
- 127.
- 128.↵
- 129.↵
- 130.↵
- 131.↵
- 132.↵
- 133.↵
- 134.↵
- 135.↵
- 136.↵
- 137.↵
- 138.↵
- 139.↵
- 140.↵
- 141.↵
- 142.↵
- 143.↵
- 144.↵
- 145.↵
- 146.↵
- 147.↵
- 148.↵
- 149.↵
- 150.↵
- 151.↵
- 152.↵
- 153.↵
- 154.↵
- 155.↵
- 156.↵
- 157.↵


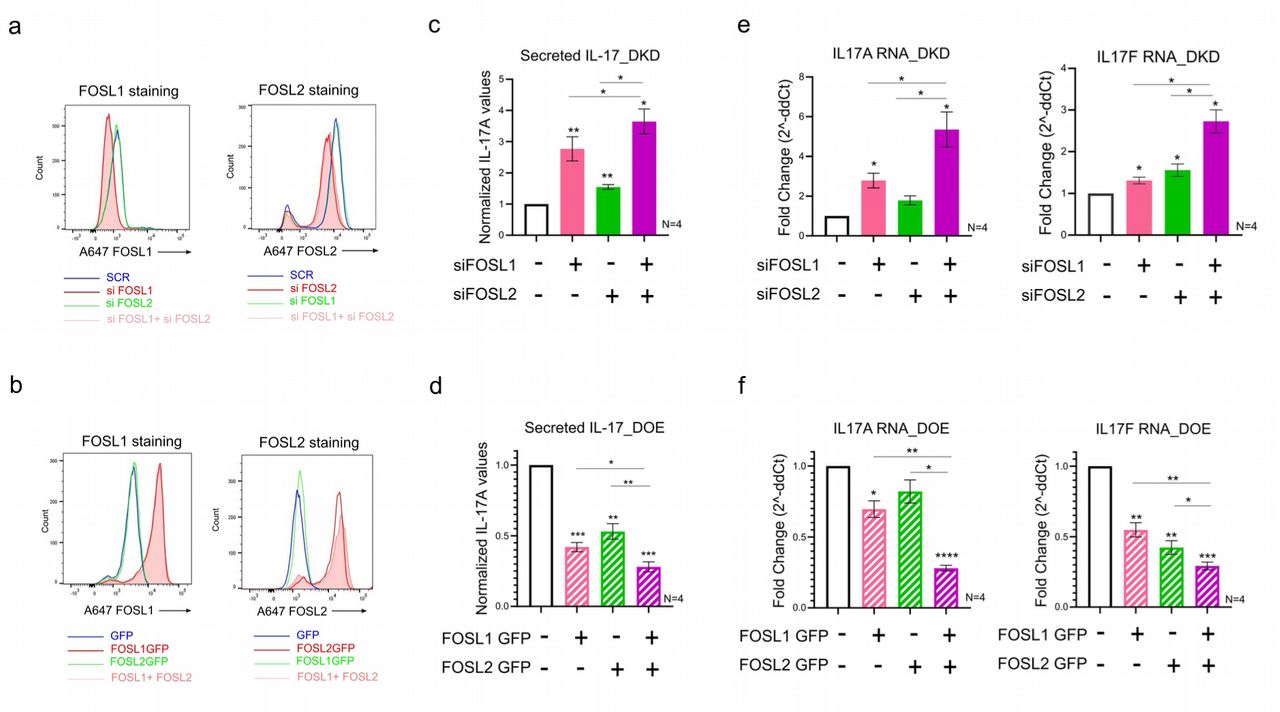
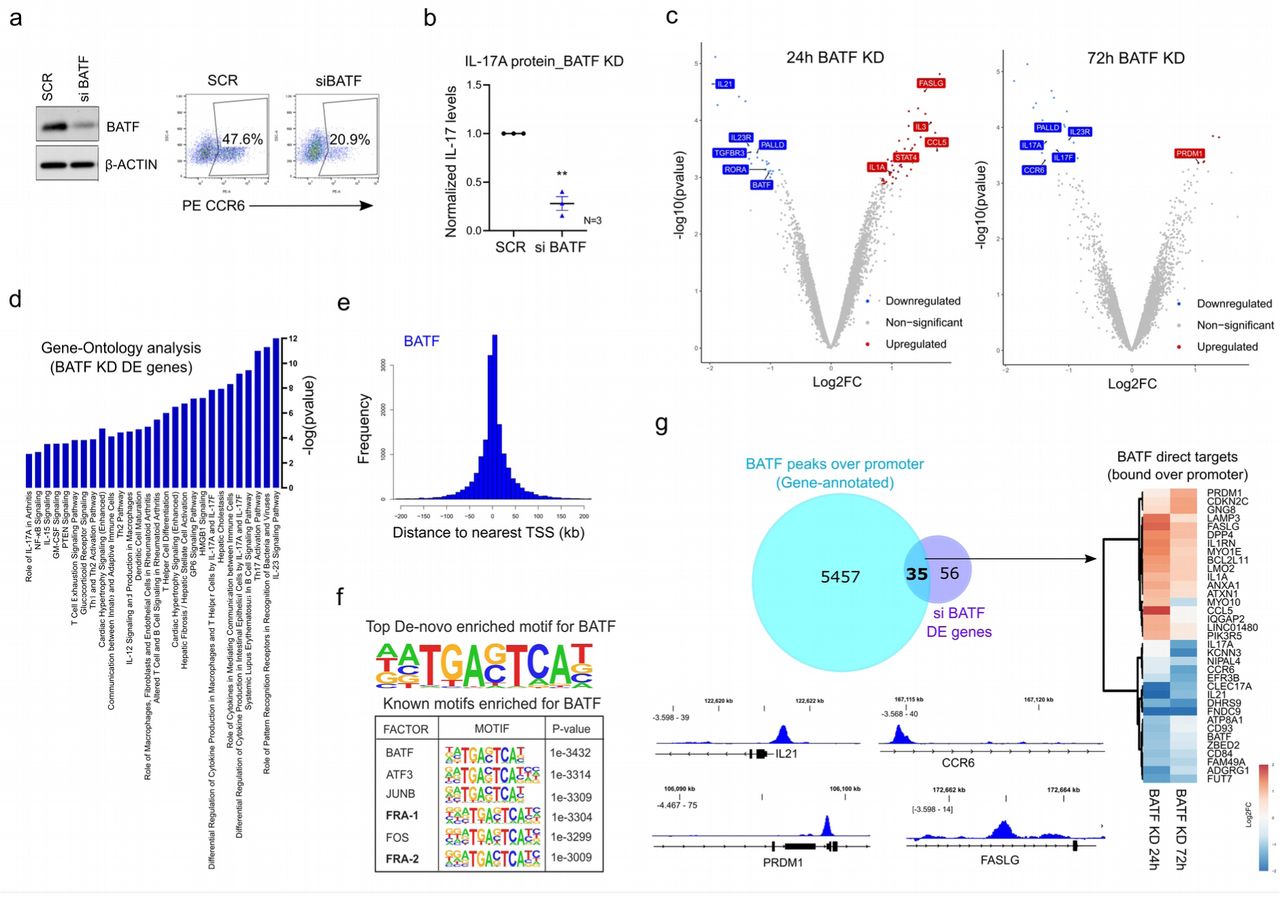
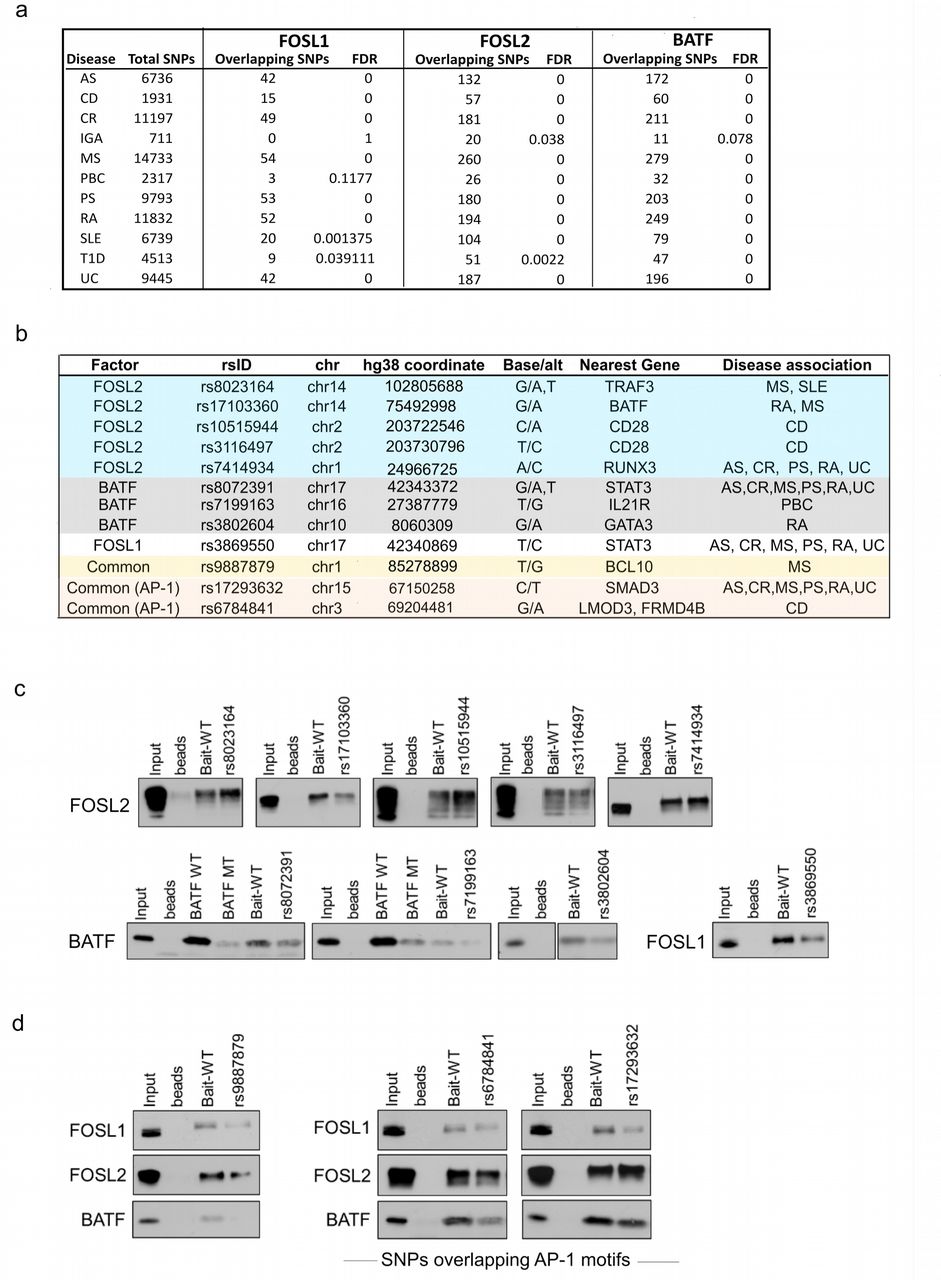
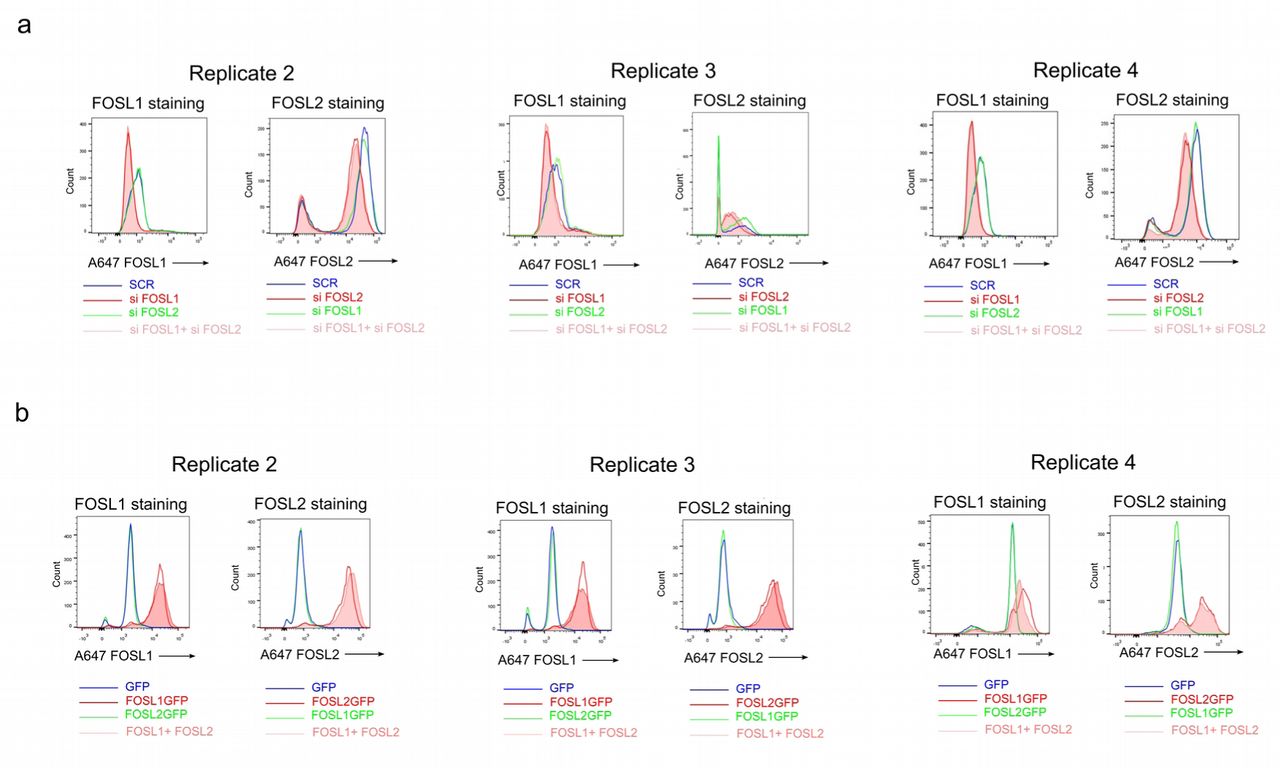