

Abstract
The process of deciding what a sensory stimulus is and how to act on that decision seem distinct, yet they appear to be coupled at the neural level. Neurons in the parietal cortex of monkeys represent both the integration of evidence toward a decision and the behavior used to report the decision. This raises the possibility that monkeys evaluate sensory percepts in terms of their motor affordances rather than their abstract identity. It is not clear how monkeys can evaluate sensory percepts when unaware of the motor actions they bear upon. We investigated this by training monkeys to make perceptual decisions about the direction of motion in a noisy random-dot display. They learned to associate leftward and rightward with two colors, and to select from a pair of colored targets, which were displayed after the motion at unpredictable locations. Surprisingly we found that monkeys postpone decision formation until the pertinent motor actions are revealed. Neurons in parietal cortex represent the accumulation of evidence sampled from short term memory of the motion display. The findings demonstrate that abstract decisions are framed in terms of their motor affordances and highlight the capacity for integration of evidence from memory.
Introduction
A decision is a commitment to a proposition or plan of action based on evidence, prior knowledge, priorities and value. Perceptual decision-making refers to the class of decisions in which the dominant source of evidence is derived from sensation and in which the decision is a provisional action or a mental assignment to a category. Viewed from the perspective of information processing, perceptual decision-making establishes a compressed distillation of sensory data into distinct categories. Viewed from the perspective of behavior, it effects an intention, satisfying policy objectives such as obtaining reward. These perspectives are naturally connected because we decide about a perceptual category in order to make a choice. For animals, perceptual decisions typically guide foraging and social choices. For humans, perceptual decisions seem like they are about the perception itself, involving no more than an internal report or change in ideation. The study of decision-making in laboratory animals tends to conflate these depictions, perhaps by necessity.
There is recent interest in characterizing the neural processes that underlie decisions about category membership, independent of intention (e.g., Freedman et al. 2001; Freedman and Assad 2006; Seger and Miller 2010; Goodwin et al. 2012), what we will refer to as abstract decisions. Categorical labels introduce flexibility to sensorimotor programs (Tenenbaum et al., 2011; Chafee and Crowe, 2012). For example, one can assign the abstract labels “rightward” and “leftward” to consolidate motion perceived to the right or left, irrespective of its precise direction or motion strength. These abstract labels then allow for the implementation of flexible action plans such as “press a red button if you see rightward motion”.
The extent to which nonhuman primates can assign abstract labels to sensory percepts and exploit them to be flexible in their actions is unclear. The process of abstraction, by definition, unyokes the sensory evaluation processes from the process of acting on the sensory information. However, multiple lines of research in macaques suggest that the process of sensory evaluation is intimately coupled to the actions that can result from the evaluative process (Cisek, 2007; Shadlen et al., 2008; Cisek and Kalaska, 2010). This framework, wherein cognitive processes are embodied in terms of the motor actions they afford, is supported by the patterns of neural activity found in association and premotor cortices of monkeys (Cisek, 2007; Klaes et al., 2011; Shadlen and Kiani, 2013). But monkeys can be trained to decide on properties of sensory stimuli even when unaware of the exact motor action that will be required of them to report their decision (Freedman et al., 2001; Gold and Shadlen, 2003; Freedman and Assad, 2006; Genovesio et al., 2009; Bennur and Gold, 2011; Goodwin et al., 2012; Wang et al., 2019). In these studies, monkeys were required to commit to a category assignment without committing to an action. These studies do not address the process by which sensory evidence is evaluated towards an abstract decision and how such decisions can flexibly recruit motor actions. That is what we set out to do.
We trained two monkeys to decide on the net direction of stochastic random dot motion and associate two possible directions with two colors. The monkeys reported the direction of motion by making an eye movement to the target of the associated color, but these targets were revealed at unpredictable locations after the motion stimulus had been extinguished. To perform the task well, monkeys needed to integrate motion information in the stimulus over time to make an abstract decision about the direction of motion. This imposition allowed us to investigate how an abstract perceptual decision is formed when the actions associated with the decision are yet to be specified. Further, since the decision making phase is unyoked from the motor planning phase, the task also permits investigation of the conversion of an abstract decision to an action.
Surprisingly, we found that evidence evaluation and action selection—the two aspects of abstract decision making that our task was supposed to unyoke—were, in fact, intimately coupled. The behavior of the monkeys showed that they based their decision on motion evidence integrated over time. However, this integration transpired during the action selection epoch instead of the epoch when the evidence was presented. Further, activity of neurons in the sensorimotor association area LIP represented decision formation during the action selection epoch. Our results suggest that monkeys form abstract perceptual decisions by evaluating sensory information from iconic short term memory for action selection.
Results
We trained two monkeys to decide whether the net direction of a random dot motion (RDM) stimulus was to the right or left. The monkeys reported their decision by making an eye movement to a blue or yellow target based on the association they had learned between the direction of motion and target colors (Fig. 1). The two targets appeared after a short delay (200-333 ms) following the termination of the motion stimulus, and the locations of the two targets were randomized across trials. Thus all the evidence bearing on the decision was supplied before the monkeys were instructed about the motor act that would be required to report the decision. Both monkeys were naïve to the RDM stimulus when they began training on the task. Since one of our goals was to investigate how decisions are converted to motor actions, the monkeys were allowed to report the decision as soon as the targets were presented (go-task). Monkey-SM was also trained on a variant of the task in which an additional waiting time was imposed after the appearance of the targets (wait-task).

The monkey fixates at an instructed location (red dot). After a delay, a random dot motion stimulus appears around the fixation point. The stimulus terminates after a variable duration (350-800 ms). After another short delay (200-333 ms), a blue and a yellow target appear at unpredictable peripheral locations. In the go version of the task (top panel), the fixation is extinguished at the time the targets appear and the monkey can report the decision by choosing one of the colored targets. In the wait version of the task (bottom panel), the monkey must wait until the fixation point is extinguished before choosing a target. During recording sessions, the target locations on each trial are pseudorandomly chosen from a restricted set of locations based on the receptive field of the neuron being recorded. The unchosen locations are illustrated by dashed gray circles (not shown to the monkey). During training sessions, the target locations were less constrained.
The abstract decision-making task proved to be challenging for the monkeys to learn (Figure 2-Figure Supplement 1). Monkey-AN required 28 sessions to acquire the motion-color association, and failed to improve beyond competency at the highest motion strengths for the next ~40 sessions (~50,000 trials). Only then did the monkey begin to exhibit gradual improvement, quantified by a reduction in psychophysical threshold—the motion strength required to support accuracy greater than 75% correct (Eq. 1). Monkey-SM learned the motion-color association quickly but made little progress over months of training. After 127 sessions (983 trials per session on average), the thresholds still hovered around 25% coherence. This monkey was then trained on the wait variant of the task for an additional 58 sessions (740 trials per session) until the thresholds decreased and stabilized at ~ 11% coherence.

Psychophysical thresholds during training. The motion strength required to support 75% accuracy is plotted as a function of training day. The values are interpolated from a Weibull fit (Eq. 1) to proportion accuracy vs. |coherence|. Green lines indicate the thresholds from all neural recording sessions. The purple line in the bottom panel indicates the thresholds for monkey-SM from the last four sessions of training on the go-task (the sessions included in Fig. 3C-D). Grey lines show the running geometric mean of thresholds from 11 consecutive sessions.
By the final training session, both monkeys performed the task above chance for all non-zero motion coherences (Fig. 2A,B), although they made many errors on the easiest motion strength. Such asymptotic performance, also known as lapses, is often attributed to guessing and amounted to 9% and 11% of trials for monkeys AN and SM, respectively. Notably, monkeys performing the same direction discrimination task with a direct mapping between motion direction and actions typically exhibit lapse rates under 1-2%. We consider the nature of the lapses below. The important point here is that the task is challenging, but for the vast majority of trials, both monkeys used evidence from the RDM to choose the appropriate color.

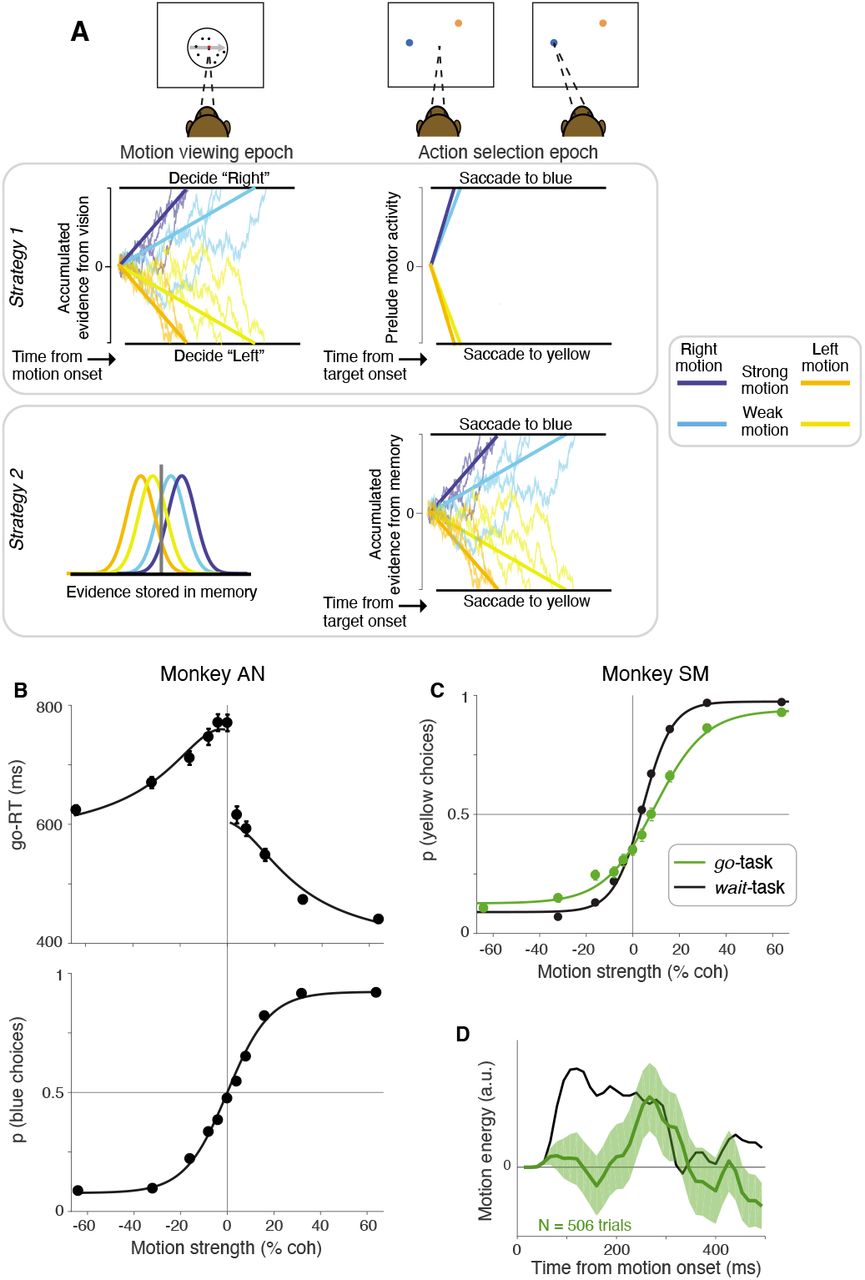
A, Effect of motion strength on decisions for monkey-AN on the go-task. Monkey-AN was trained to associate blue with rightward and yellow with leftward. The proportion of blue (rightward) choices are plotted as a function of signed motion strength (rightward motion is positive signed). Curves are logistic regression fits to the data. Error bars are s.e. B, Effect of motion strength on decisions for monkey-SM on the wait-task. Monkey-SM was trained to associate yellow with rightward and blue with leftward. The proportion of yellow (rightward) choices are plotted as a function of signed motion strength. Otherwise, same conventions as in A. C–D, The influence of fluctuations in motion information on choices plotted as a function of time from motion onset. Curves represents the mean motion energy in support of the direction chosen by the monkey on 0% coherence trials (shading, ±1 s.e.m.).
Figure 2–Figure supplement 1. Psychophysical thresholds during training
This conclusion is further supported by identifying the times during motion viewing that random fluctuations of motion energy influence the decision. Such psychophysical reverse correlation reveals that both monkeys based their decisions on information acquired over several hundred milliseconds (357 ms and 261 ms for AN and SM, respectively Fig. 2C & D). For both monkeys, this evidence was acquired before the color-choice targets appeared. We therefore hypothesized that when the color-choice targets appeared, both monkeys had already formed a decision about which color to choose. Alternatively, they might store the experienced stream of evidence in short-term memory during the motion presentation epoch and consult this memory later to decide between the blue and yellow choice targets. We evaluate these alternatives separately for the two monkeys. Monkey-SM was forced to wait through a variable delay period before indicating its choice, whereas monkey-AN was allowed to indicate the decision as soon as the colored targets appeared. This latency, termed the go-RT, proved informative.
Action selection during abstract decision making is a deliberative process
If, by the time the color targets appeared, monkey-AN had made a decision about the direction of motion, then the go-RT should be fast (Fig. 3A, Strategy 1). The monkey must simply choose between two highly discriminable colors, which ought to take ~200 ms (Schall and Thompson, 1999; Seideman et al., 2018). Alternatively, if monkey-AN were to form the decision from samples of evidence in short-term memory, the go-RT might be longer (Fig. 3A, Strategy 2). The data support the latter alternative. Not only were the go-RTs longer than expected, they exhibited clear dependence on the strength and direction of the random dot motion (Fig. 3B, top). The average go-RT for correct decisions ranged from 440 ms for the easiest condition to 771 ms for the most difficult. The pattern bears similarity to response times obtained from monkeys in earlier studies, where they were free to indicate their saccadic choices to visible targets any time during motion viewing (e.g., Roitman and Shadlen 2002). The prolongation of go-RTs is unlikely to be due to difficulty in distinguishing the colors of the targets. The observed go-RTs spanned 2-4 times the mean go-RT of ~ 190 ms previously reported in monkeys discriminating between distinctly colored targets (Tanaka et al., 2015).

A, Schematic of strategies that monkeys could adopt to solve the task. Strategy 1: During motion viewing, evidence for motion direction is accumulated to decide if the motion is to the right or left. The result of the decision about direction and/or its color association is stored. When the colored targets are presented, the previously made decision guides an immediate saccade to the target with the chosen color. The saccadic latency might vary by 10-20 ms as a function of confidence in the decision. Strategy 2: During motion viewing, the experienced evidence is stored in short term memory. When the targets are shown, the stored evidence is evaluated to decide which of the two colored targets to choose. The four curves (left) represent distributions of noisy samples of evidence associated with a strong and weak motion strength for the two directions. Instead of integrating them immediately (as in Strategy 1) they are stored in short-term memory. The recalled samples are acccumulated during action-selection (right). The drawing gives the impression of many samples, but the samples themselves might represent several tens of ms of motion information (as in Kang et al. 2021). B, Go-RTs of monkey-AN plotted as a function of signed motion coherence (top). Curves are fits to a bounded drift-diffusion model. The model is also constrained by the choice proportions. Bottom, Same data as in Fig. 2A. Curve is the fit of the bounded diffusion model, which accounts for both the choice proportions and the go-RTs. C, Proportion of rightward (yellow) choices as a function of motion strength for monkey-SM from the last four training sessions on the go-task (green). The same data as Fig. 2B is shown for comparison (black). Lines are logistic regression fits to the data. D, Influence of motion fluctuations on choice in the last four training sessions of the go-task for monkey-SM (green curve). Same conventions as Fig. 2D. Data from the wait-task (black curve, same as in Fig. 2D) is shown for comparison.
Figure 3–Figure supplement 1. Model comparison
Figure 3–Figure supplement 2. Further confirmation that monkey-SM did not accumulate evidence on the go-task

We consider two plausible explanations of the errors at the strongest motions strengths. Both models use bounded drift diffusion with symmetric, collapsing bounds (Eq. 8) and can thus explain go-RT on errors. Direction-Color Confusion (solid traces). A fraction of trials, λ, deploy the wrong association between motion direction and color. For the strongest motions, this explains all lapses (λ = 9%). At weaker motion strengths the confusion contributes a fraction of both error and correct choices (open and filled symbols). The nondecision time( or
or  ) is associated with the sign of the terminating bound, so opposite that of the rendered choice on these trials. Low Sensitivity (broken traces) The lapses are a sign of lower sensitivity to all motion strengths. This is the diffusion model without direction-color confusion. The Direction-Color Confusion model is clearly superior to Low Sensitivity model.

We introduced two variants of the go-task to evaluate the hypothesis that monkey-SM used only a brief sample of the random dot stimulus to inform its choice. A, Step version. Each trial started at 0% coherence and stepped to ±32% or ±64% at a variable time. Choice accuracy is plotted as a function of step time (4 sessions, N=4663 trials). B, Ramp version. The motion strength changed linearly as a function of time from 0% to ±32% or ±64% coherence. The rate of change was varied across trials. Choice accuracy is plotted as a function of the time when the coherence reached its maximum (3 sessions; N=3054 trials).
We therefore considered the possibility that the pattern of go-RTs might result from sequential sampling of evidence experienced earlier in the trial (Fig. 3A, Strategy 2). To evaluate this, we appropriated a bounded evidence-accumulation model (drift-diffusion) that is known to reconcile the choice proportions with the response times of subjects when they are allowed to answer whenever ready. In such free response tasks, the decision-maker knows how to answer while viewing the motion and simply stops the trial by pushing a button or making an eye movement to one of two visible targets. We wondered if the same type of model could reconcile the choices and go-RTs of monkey-AN. Intuitively, when motion is strong, the noisy samples of evidence are mostly of the same sign, so the accumulation is an approximately linear rise or decline—a ramp-like path toward a positive or negative stopping bound, ±B. If the mean sample of evidence is  it will take 10 time steps to reach the positive bound, on average. If the mean of the samples is zero, the path is the accumulation of random positive and negative steps—an unbiased random walk. Such paths are guaranteed to terminate in one or the other bound with equal probability. If the standard deviation of the samples is
  , the expectation of the number of steps to reach a bound is 100. For intermediate levels of signal to noise, the terminations are governed by a mixture of the signal- and noise-dominant regimes.
The curves in Fig. 3B are fits of a bounded drift-diffusion to the proportion of blue choices and the mean go-RTs. The simplest version of this model assumes the drift rate is proportional to signed motion coherence and the terminating bounds do not change as a function of time (Palmer et al., 2005). Any bias is accommodated by an offset to the drift rate (Hanks et al., 2011). The mean go-RT for each signed motions strength is predicted by the expectation of the bound termination times plus a constant non-decision time, which captures contributions to the response time that do not depend on the motion strength and bias. We used separate terms,  and
and  , to describe the faster blue and slower yellow choices. The model to this point uses only five degrees of freedom to explain the choice proportions and mean go-RT across 11 motion strengths (Eq. 3 and Eq. 4).
We incorporated one additional feature to accommodate the failure of monkey-AN to achieve perfect performance on the easiest conditions (±64% coh). Such errors are typically attributed to lapses in which the subject ignores the evidence and guesses. However we noticed that the go-RTs associated with errors on the strong leftward condition (blue choices), had the slow go-RTs associated with correct leftward (yellow) choices. Similarly, the errors associated with the strong rightward condition (yellow choices) had the fast go-RTs associated with correct rightward choices (Figure 3-Figure Supplement 1). This indicates that the lapses were not guesses but an error in the association between direction and color. We accommodated this feature in the model, assuming that this type of error occurred with equal frequency at all motion strengths (see Methods). The model captures the coherence dependence of the go-RTs on correct choices (R2 = 0.99) while also accounting for the accuracy of the monkey’s choices. The fidelity of the fits supports the hypothesis that the prolonged go-RTs reflect a bounded sequential sampling of information leading to the rendering of the decision. As this sampling began at least 300 ms after the motion stimulus was extinguished, these samples must be derived from short-term memory.
We are suggesting that a substantial fraction of errors—indeed the vast majority of errors at the strongest motion strengths—are explained by a mistaken association of direction with color. This idea deserves further scrutiny. We compared the model to an alternative account that explains the rate of errors without the mistaken association. Instead it attributes these errors to a noisier or less inefficient decision process, perhaps because the evidence must be held in memory. To conduct this comparison, we endowed the diffusion model with additional parameters that allow it to explain the go-RT on errors (Eq. 8). Model comparison provides decisive support for mistaken associations of direction and color (ΔBIC = 1242; Figure 3-Figure Supplement 1). It thus appears that on the vast majority of trials the monkey forms a decision based on the accumulation of evidence from memory and makes the opposite color choice on ~ 9% of trials. The best fitting model yields an expectation of the integration time for each motion strength. For 0% coherence, the expectation is 228 ms, which is consistent with the psychophysical reverse correlation analysis, above (Fig. 2C). Note that the reverse correlation analysis also shows that the monkey uses the earliest epochs of motion evidence to inform its decision. Taken together, the analyses of go-RT suggest that monkey-AN stores at least 300 ms of information about the motion in some form, because the duration of stimulus information needed for decision termination is not known before the accumulation process transpires, later in the action selection epoch.
We are unable to analyze go-RTs for monkey-SM because we enforced a wait time of at least 600 ms after onset of the color-choice targets. We nonetheless suspected that this monkey also formed its decision in the action-selection epoch. Recall that monkey-SM failed to show behavioral signatures of deliberation in the go version of the task. Monkey-SM learned the direction-color association and performed better than monkey-AN at the strongest motion conditions, but failed to achieve proficiency on the more difficult conditions (Figure 2-Figure Supplement 1). Even after extensive training, sensitivity plateaued at an unacceptable level (Fig. 3C, green), and psychophysical reverse correlation revealed only a weak, transient impact of motion information on choice (Fig. 3D). We therefore suspected that this monkey based its decisions on a brief sample of information from the first, last or random glimpse of the display (e.g., see Stine et al. 2020). We confirmed this suspicion using a variant of the go task in which the strength of motion was modulated as a function of time within a trial (Figure 3-Figure Supplement 2). The coherence started at 0% and either stepped or changed gradually to a large positive or negative value. The time of the step or the rate of change varied across trials. The monkey’s performance deteriorated to chance when the strong motion was concentrated at the end of the trial (Figure 3-Figure Supplement 2). We deduced that the monkey based its decisions on motion information sampled over a short time window at the beginning of the trial. Not surprisingly, the go-RTs exhibited no sign of deliberation. They were nearly as fast as a simple saccadic reaction time to a single target (192 ± 0.4 ms) and showed no influence of the previously experienced motion strength.
Based on our experience with monkey-AN, we wondered if monkey-SM failed to integrate after the color-choice targets appeared. We therefore introduced a wait time after the onset of the targets. This simple modification led to a twofold improvement in sensitivity (Fig. 3C, green vs. black traces; also see Figure 2-Figure Supplement 1). This degree of improvement would require at least a fourfold increase in the number of independent samples of evidence the monkey used to form its decision. Indeed, psychophysical reverse correlation revealed a longer time window over which motion information influenced decisions: from 40 ms, before the introduction of the enforced wait, to 261 ms, after ~40 sessions of training (Fig. 3D), Thus, the imposition of a wait after the onset of the targets encouraged monkey-SM to use more information to inform its decision—information that was acquired earlier, in the motion viewing epoch.
The behavioral data from both monkeys therefore provides complementary evidence that deliberation during the action-selection epoch is necessary for integrating previously observed motion information. During motion viewing both monkeys must store some representation of the motion in short term memory. The go-RTs from monkey-AN indicate that the stored information is sampled sequentially in the action selection period. Monkey-SM either uses the same strategy as monkey-AN or, conceivably, deliberates to a decision before the color-choice targets appear. Owing to the enforced wait, we lack meaningful go-RTs for this monkey. Therefore we cannot distinguish between these alternatives. However, as we next show, the neural recordings from monkey-SM are informative.
The evolution of neural responses in LIP during action selection reflect previously presented evidence
We recorded from single units with spatially selective persistent activity in area LIP (Gnadt and Andersen, 1988; Barash et al., 1991). Such neurons are known to represent an evolving decision variable—the accumulated evidence for and against a motion direction—when one of the choice targets is in the neural response field (RF) (Shadlen and Newsome, 1996; Roitman and Shadlen, 2002). The present study differs from previous reports in two critical aspects: (i) the choice targets were not visible during motion viewing, and (ii) the locations of the choice targets were unpredictable. Under these conditions, the neural responses accompanying motion-viewing were only weakly modulated by motion strength in monkey-AN (Fig. 4A) and unmodulated in monkey-SM (Fig.4B).

The graphs show average normalized responses as a function of time aligned to motion onset, target onset, or time of saccade. Data from the two monkeys are shown separately (top row, AN, 29 neurons; bottom row, SM, 31 neurons). A,B Responses aligned to motion onset. All trials are included. C–F Data from trials in which the blue (C,D) or yellow (E,F) target was in the neuronal response field. The responses are aligned to the onset of the target (left) or the time of saccade (right). Insets show residual responses after removal of the large visual response to the target. They isolate the component of the response that is controlled by the strength and direction of motion. In all panels, coherences are grouped as High (±64% and ±32%), Medium (±16%), Low (±8% and ±4%) and 0%. Grouping of the direction of motion is based on the preferred color-motion association for each neuron. This was consistent with the association the monkey had learned between motion direction and target color, except for six neurons in monkey-SM for which the association was reversed (see Methods). In panels C-F, for the responses aligned to target onset (left) all trials, including errors, are included in the averages grouped by signed coherence; for the responses aligned to saccade (right) errors are excluded.
The action selection epoch begins with the appearance of the color-choice targets. When a target was in the neural RF, it elicited a strong visual response beginning ~50 ms after onset (Fig. 4C-F), consistent with previous reports (Bisley and Goldberg, 2003). The subsequent evolution of the response reflected both the strength and direction of the RDM stimulus that had been presented in the previous epoch. To better visualize the relationship between the neuronal response and the previously presented RDM stimulus, we removed the visual response (see Methods). The residual responses (Fig. 4C-F, insets) are effectively detrended with respect to any influences that are unaffected by the strength and direction of motion. As shown in Fig. 4C-F (insets), the residual responses exhibit a clear dependency on the strength and direction of the RDM.
To quantify the rate of change of residual responses (buildup rate), we identified the time at which the raw responses first diverge. For each neuron, we then computed the buildup rate for each coherence as the slope of a line fit to the average of the residual firing rates. Each point displayed in Fig. 5 is the mean buildup rate across neurons. These buildup rates exhibited a linear dependence on motion strength. For monkey-SM, the linear dependence was statistically significant in all four conditions (i.e., for all combinations of direction of motion and color of target in the RF; see Table 1). For monkey-AN, the linear dependence was statistically significant in three of the four combinations of motion and direction (p < 0.05, Table 1). The magnitude of the dependencies are comparable to those obtained under simpler task, when the motion is viewed in the presence of saccadic choice targets (e.g., see Fig. 3G in Shushruth et al. 2018).

Buildup rates were estimated for each neuron, using trials with the same motion strength, direction, and color-target in the response field (top, monkey-AN; bottom, monkey-SM). Symbols are averages across neurons (error bars are s.e.m.) The lines in the graph are weighted least square fits to the average buildup rates, grouped by motion direction. The 0% coherence point (gray) is included in both weighted regressions in each panel.
Dependence of buildup rates on motion strength.
Thus for both monkeys, the neural responses during action selection exhibit the hallmark of a decision variable, which must be informed by information acquired earlier. This is consistent with the pattern of go-RTs in monkey-AN, which also support sequential sampling of evidence during the action-selection epoch. Analyses of the time dependent changes in response variance and autocorrelation lend additional support for sampling of noisy evidence from memory in both monkeys.
Neural responses in LIP are consistent with the instantiation of a sequential sampling process
The coherence dependent ramping evident in trial-averaged response residuals could reflect the accumulation of noisy samples of evidence on single trials. The trial-averages suppress the noise, leaving mainly the deterministic component of the accumulation—a ramp with slope equal to the statistical expectation of the momentary evidence for yellow or blue. On single trials, theoretically, the decision variable also includes an accumulation of noise. This is the diffusion component of drift-diffusion, which is thought to explain stochastic choice and variable decision times. Although suppressed in the trial averages, the diffusion component can be detected in the evolution of the variance and autocorrelation of the neural firing rates (Churchland et al., 2011; de Lafuente et al., 2015; Shushruth et al., 2018). The procedure utilizes spike counts from single trials, which provide a noisy estimate of the rate over a short counting window. The counts are thus conceived as the result of a doubly stochastic process: a rate that represents a diffusion (or random walk) process, which differs from trial to trial, and the stochastic point process that renders spike-counts from the rate. The strategy is to remove the latter component of the total variance to reveal the variance of the conditional expectation of that count. Hence we refer to variance of the rate, at the time of a counting window, as the variance of the conditional expectation (VarCE) of the count. We adapted this procedure to the current data set in order to ascertain whether the residual firing rates on single trials incorporate the accumulation of independent samples of noise (see Methods, Eqs. 9-13).
We divided the period following target onset into 60 ms bins and computed the VarCE across trials for each bin. We identified the epoch of putative accumulation to coincide with the time of the buildup. The VarCE underwent a linear increase as a function of time over most of this epoch (Fig. 6A and Fig. 7A). This is the pattern expected for partial sums (i.e., accumulation up to time, t) of independent samples of noise. The autocorrelation of the responses (CorCE) also showed signatures of a diffusion process: a decrease in autocorrelation as a function of the time separation between the bins (i.e., lag) and an increase in autocorrelation between adjacent bins as a function of time (Fig. 6C,E and Fig. 7C,E). The estimated autocorrelation pattern for both monkeys hewed closely to the theoretical predictions (R2 = 0.84, monkey-AN, Fig. 6D; R2 = 0.89, monkey-SM, Fig. 7D). Such conformance lends further support to the idea that the LIP responses represent the accumulation of independent samples of noisy evidence during the action-selection epoch. In contrast, the second order statistics of neural responses during the RDM presentation epoch did not show conformance to the theoretical predictions of a diffusion process in either monkey (R2 = 0.45, monkey-AN, Figure 6-Figure Supplement 1; R2 = 0.26, monkey-SM, Figure 7-Figure Supplement 1). Thus, it is unlikely that the neurons we recorded from are participating in evidence accumulation during motion viewing.
Same analysis as in Figure 6, using data from the motion viewing epoch.
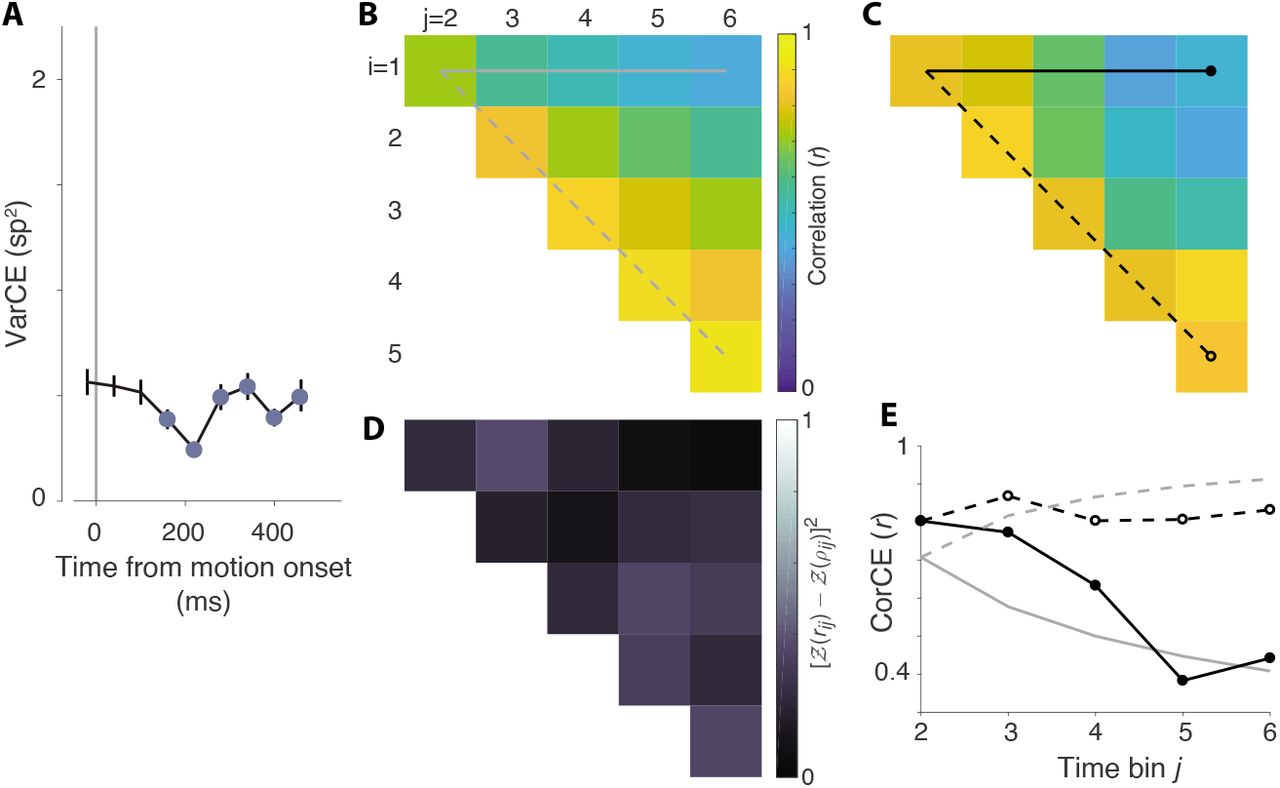
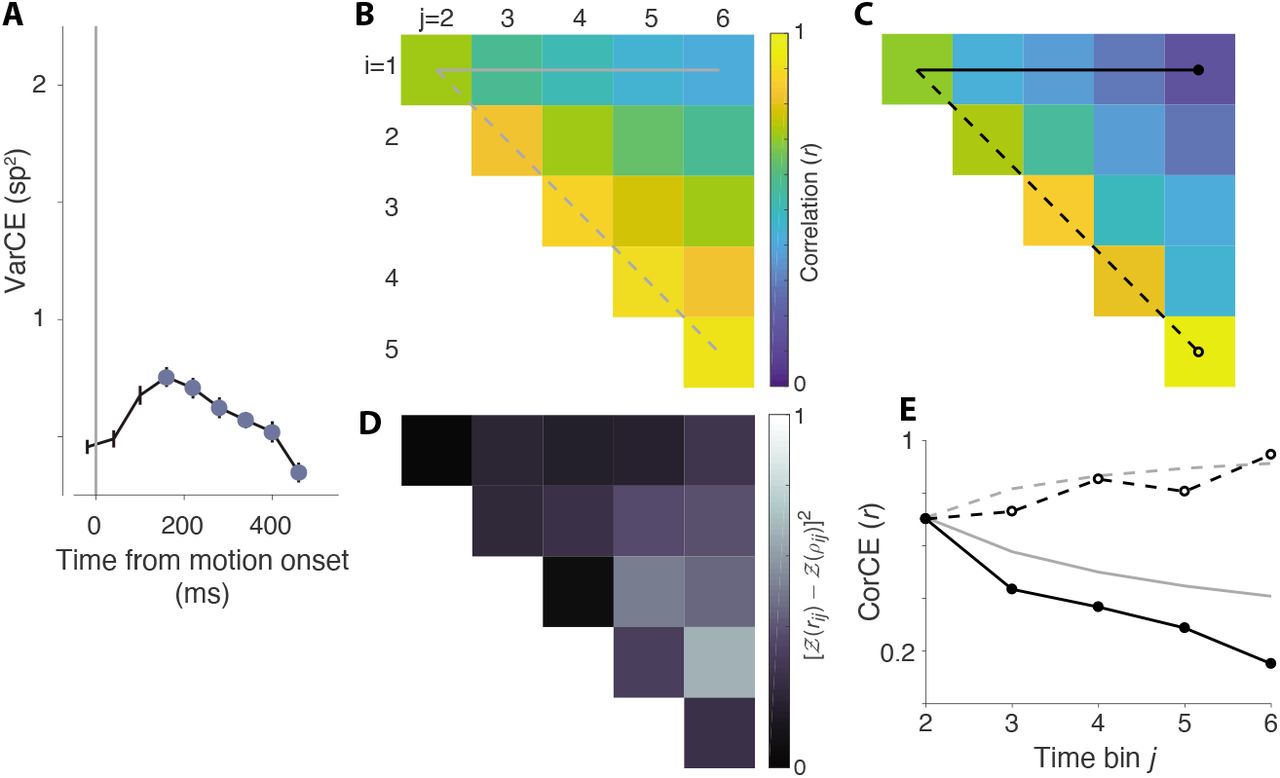
The go-RTs from monkey-AN suggest that decisions are formed by accumulation of noisy evidence to a terminating bound. The analyses depicted here evaluate predictions that the decision related activity on single trials includes a representation of accumulated noise. A, Variance of neural responses aligned to target onset. Filled symbols are estimates of the variance of the conditional expectations (VarCE) of the spike counts in six 60 ms bins spanning the putative integration epoch. This is an estimate of the variance of the firing rate in the bin, across trials. B, Theoretical correlations between the cumulative sums of independent, identically distributed random numbers from the 1st to ith and from 1st to jth samples. The 15 unique correlation values of the 6 × 6 correlation matrix are displayed as an upper triangular matrix (i.e., rows 1-5 and columns 2-6). The horizontal solid line shows the correlation between the first sample and the cumulative sum to the jth sample (lag = j – i). It shows decreasing correlation as a function of lag. The dashed line identifies the first juxtadiagonal set of correlations between pairs with the same lag = 1. It shows an increase in correlation as a function of time of the pairs of samples. The theoretical values for all correlations is given by  . C, Correlations estimated from the neural response. These are the correlations between the conditional expectation of the spike counts (CorCE) in time bins i and j. This is an estimate of the correlation between the firing rates that gives rise to these counts. If the rates on single trials are determined by unbounded drift-diffusion, these correlations should match the values in panel B. The top row and first juxtadiagonal are identied as in B. D, Deviance of the estimated from theoretical correlations (sum of squares measure). E, Comparison of theoretical and estimated correlations in the top row and first juxtadiagonal of the matrices in B & C. Gray traces show the theoretical values in B. Black lines connect the CorCE values in C. Line and symbol styles distinguish the top row (correlation as a function of lag) and first juxtadiagonal (correlations of neighboring bins as a function of time).
Figure 6–Figure supplement 1. VarCE and CorCE during motion viewing in monkey-AN
Figure 6–Figure supplement 2. Analysis of an alternative variable-rate-of-rise model

Here we leverage the CorCE estimate of response autocorrelation to evaluate an alternative to unbounded drift-diffusion. A, The expected CorCE if the neural responses represent a linear rise with variable slope across trials. Inset, Examples of latent rate function from single trials. B, The deviation of CorCE estimated from neural data from the expectation shown in A. This deviation was significantly worse than the deviation from the expectation of diffusion (ΔBIC=148 cf. Fig. 6D) C The comparison between expected and estimated CorCE for the top row and the first juxtadiagonal, as in Fig. 6E.

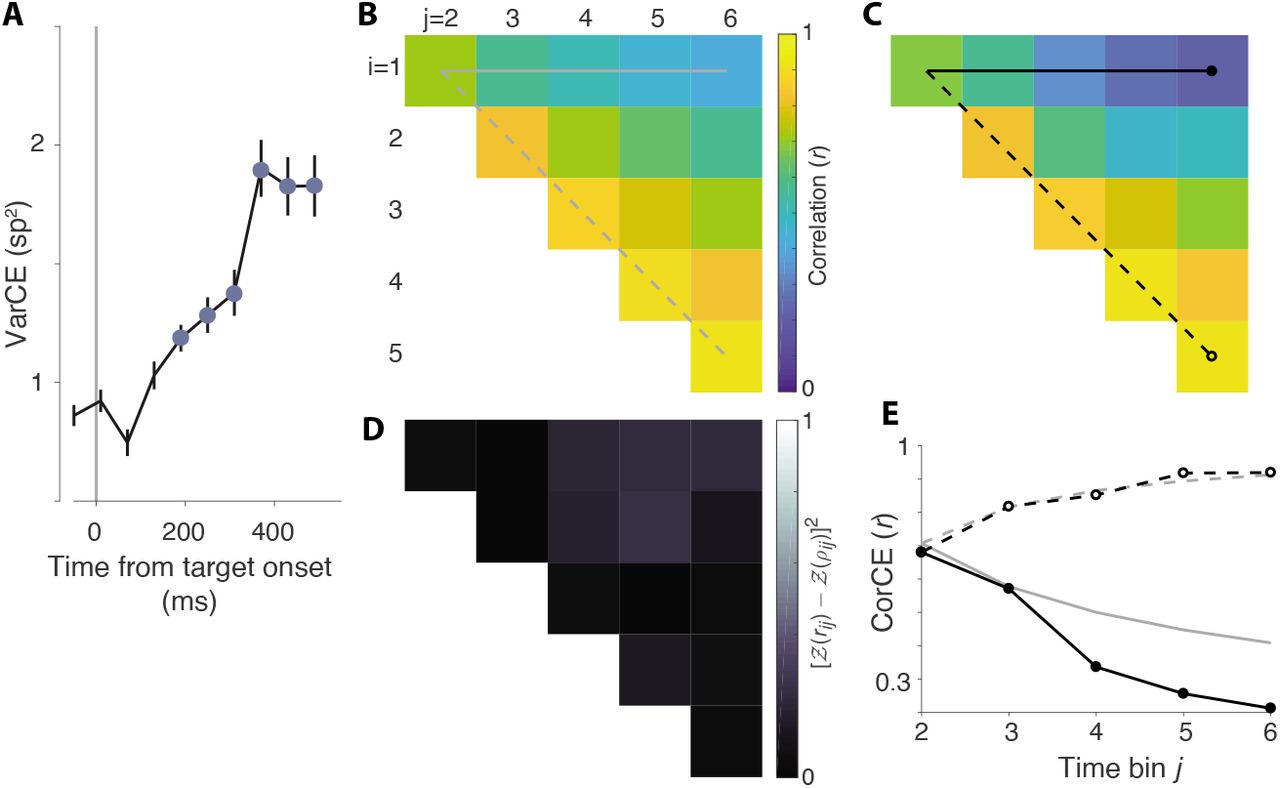
The same analysis as in Fig. 6 for monkey-SM.
Figure 7–Figure supplement 1. VarCE and CorCE during motion viewing in monkey-SM
Figure 7–Figure supplement 2. Analysis of alternative models

Same analysis as in Fig. 7, using data from the motion viewing epoch.
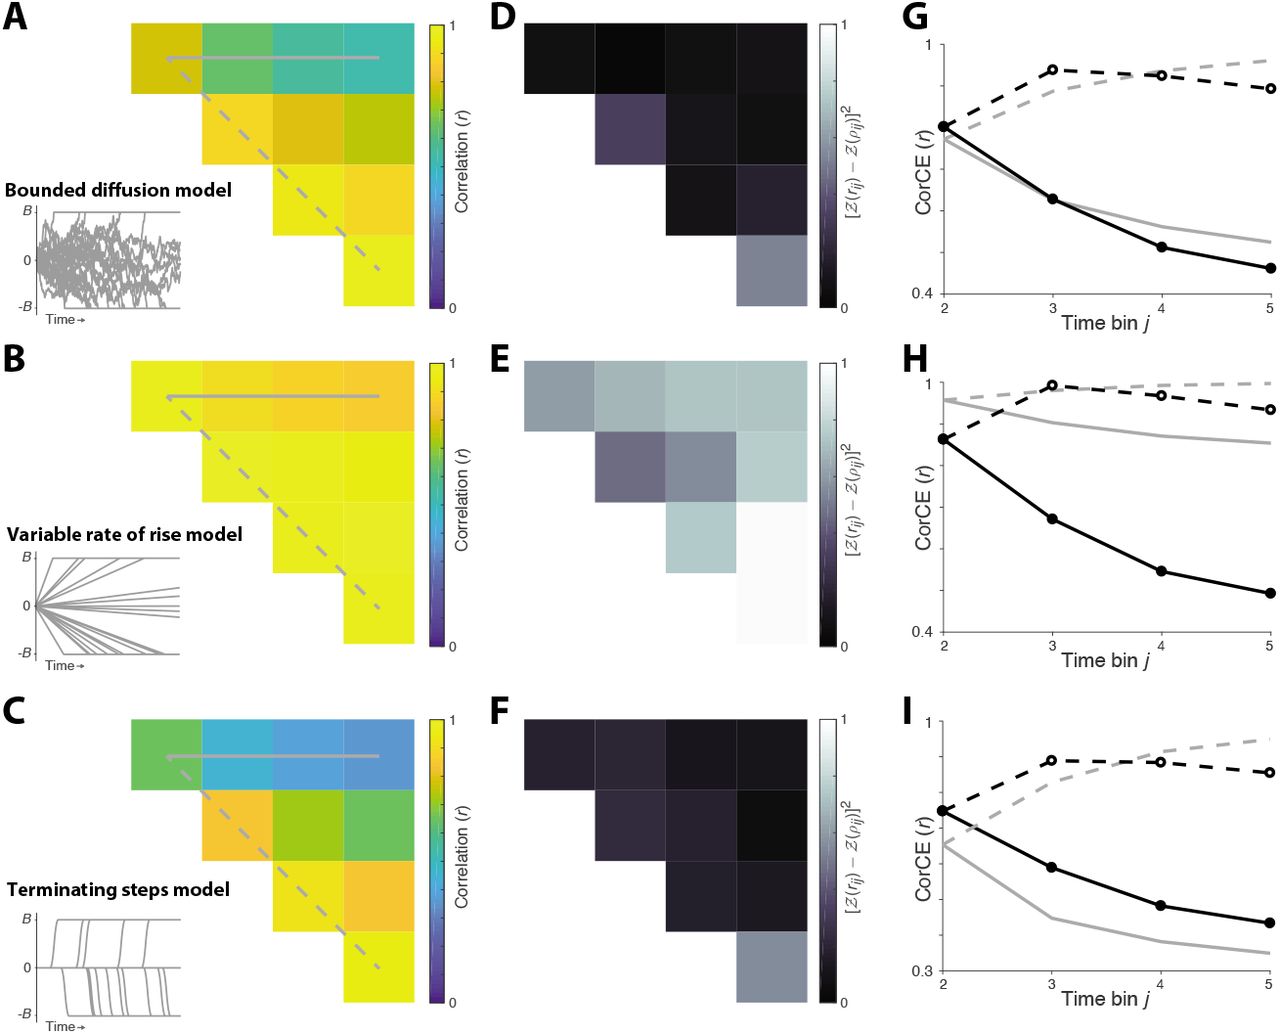
Here we leverage the CorCE estimate of response autocorrelation to compare three plausible accounts of the firing dynamics on single trials during the epoch of putative decision formation. Each of the models (rows) can explain the pattern of buildup of the residual firing rates observed in the averages across trials. Theoretical values of response autocorrelation were obtained by simulation. Examples are shown in the insets of panels A, B and C for the 0% coherence condition. A, Bounded drift-diffusion. Firing rates on individual trials represent the accumulation of unbiased, independent, indentically distributed random samples until the accumulation reaches a positive or negative bound. Thereafter the rate is determined by the value of the bound. B, Bounded variable rate of rise. The firing rate on single trials is a ramp with slope varying across trials. Same termination rule as in A. C, Constant firing rate with a step in firing rate at decision termination. D, E, F, Comparison of estimated CorCE from data with expected autocorrelation values obtained from simulation. The deviance is calculated as in Figs. 6 and 7. G, H, I, Comparison of expected autocorrelation and estimated CorCE using the same conventions as in Figs. 6 and 7. The bounded diffusion model was superior to the variable rate of rise model (ΔBIC=1378) and the terminating steps model (ΔBIC=129).
We also considered two alternatives to the accumulation of noisy evidence that might explain the coherence-dependent ramping seen in the average responses. (1) Residual firing rates on individual trials represent ramps that vary in their slope across trials. This might reflect the anticipation of reward or confidence in the decision. (2) Responses on individual trials represent a step at the termination of the decision. Consideration of these alternatives is especially warranted in the case of monkey-SM, as we lack access to the time of decision termination on individual trials. The VarCE and CorCE estimated from data supported the diffusion model over these alternatives (see Figure 6-Figure Supplement 21 and Figure 7-Figure Supplement 2).
The analyses of the neural responses lend additional support to the thesis that the monkeys form their decision in the action selection epoch, and do so though the accumulation of noisy samples of evidence to a threshold. These samples are derived from short term memories constructed during motion viewing.
Discussion
The study of perceptual decision-making in monkeys has provided insights into the process by which sequential samples of sensory evidence are accumulated over time (Newsome et al., 1989; Shadlen and Newsome, 1996). A peculiar observation in these studies is that the accumulation of evidence is instantiated by neurons associated with motor planning (Roitman and Shadlen, 2002; Kim and Shadlen, 1999; Ding and Gold, 2010,2012; de Lafuente et al., 2015). When monkeys are trained to indicate a decision between category A and B by action-1 and action-2, the neurons that represent the decision process are parsimonously characterized by their association with actions 1 & 2. This observation has led to the proposal that perceptual decision-making is embodied as a choice between potential actions (Shadlen et al., 2008; Cisek, 2007).
Yet monkeys can make perceptual decisions when they are unsure of the action that will be required of them to report their decision (Gold and Shadlen, 2003; Bennur and Gold, 2011; Wang et al., 2019). We set out to investigate how monkeys accumulate sensory evidence under these circumstances, and we did so using monkeys that had never learned an association between the decision and the action to report it. Instead they learned to associate leftward and rightward motion with the colors yellow and blue. No left-choice or right-choice targets were visible during motion viewing, but afterward, a yellow and a blue target were presented at unpredictable locations in the visual field and the monkey was required to choose one or the other color. We therefore predicted that they would not represent evidence in the form of an oculomotor plan but rather as a plan to invoke the appropriate rule: choose blue or choose yellow. Instead we found that the monkeys formed their decisions after the color-choice targets appeared—that is, during the period of action selection—after the source of sensory evidence had been extinguished.
Both monkeys based their decisions on samples of evidence that must have been retrieved from short-term memory. Monkey-AN developed this strategy spontaneously; monkey-SM did not, but appears to have adopted this strategy once we imposed a second waiting period during the action selection epoch. The striking change was evident in the longer time span of stimulus information used to inform decisions (Fig. 3D) to achieve a level of proficiency comparable to monkey-AN and many others we have trained on direction discrimination tasks. The go-RT from monkey-AN exhibited one peculiar feature. The difference in nondecision times for blue and yellow choices was nearly as long as the entire range of go-RT for either choice. The pattern suggests that monkey-AN makes a decision about blue and, failing to achieve sufficient support, switches to evaluating the evidence for yellow. This would seem absurd if stated as evidence for rightward and leftward motion, because evidence for rightward is evidence against leftward, and vice versa. However the sources of evidence bearing on the value of blue and yellow items do not typically have this antithetical relationship. We thus interpret the temporal offset in the blue and yellow go-RTs as a sign that the monkey makes two decisions in series (e.g., Kang et al. 2021) but is willing to terminate with a blue choice if there is sufficient evidence. This interpretation is based on only one monkey so must be regarded as provisional. Neural recordings from area LIP of both monkeys provided further confirmation that a sampling process transpired during the action selection epoch. On trials when one of the color-choice targets appeared in the neural response field, it produced a visual response plus a signal reflecting the direction and strength of the previously presented motion. The time course of the evolution was characteristic of an integration process—more specifically, the integration of noisy evidence acquired from the stimulus.
Previous studies of perceptual decisions, dissociated from action, have not implicated a role for memory, but we suspect it played a role. An effective strategy to dissociate a decision from a plan of action exploits the delayed match-to-sample design (Freedman et al., 2001), wherein a subject evaluates a sample stimulus and then, after a short delay, is presented with a second stimulus, which is compared to the first and classified as the same or different. It is assumed that the subject forms a categorical decision about the identity or category membership of the sample before the test stimulus is presented and therefore before an action associated with match and non-match can be planned. Using this approach, it has been shown that monkeys can report if the test and sample belong to the same category (Freedman et al., 2001; Freedman and Assad, 2006; Fitzgerald et al., 2011; Goodwin et al., 2012) or share similar properties like magnitude (Genovesio et al., 2011), numerosity (Nieder et al., 2002) or speed/direction (Hussar and Pasternak, 2009). These studies focus mainly on neural activity in association cortex during sample and delay period. This activity often varies systematically with the relevant properties of the sample stimulus and is thus interpreted as a decision about the identity or category membership of the stimulus, independent of any planned action.
Our results suggest an alternative interpretation. Instead of a decision about category, the information about the stimulus might be encoded in short term memory to support a comparison with the test stimulus, critically, to establish the behavioral response. This decision may require multiple samples, but not if the match/nonmatch comparison is easy or if the sample (and test) stimuli do not supply multiple samples. A mechanism like this has been observed in the setting of a vibrotactile comparison flutter vibration frequency (Brody et al., 2003). A related alternative is that the sample stimulus is processed as an instruction to brain circuits that organize the response to the test stimulus. The instruction might establish a criterion to classify the test or it might establish the appropriate sensory-response mapping. For example, test stimuli A and B might be associated with responses, match and non-match, respectively if the sample is A, or irrespectively if the sample is B. Such a mechanism has been documented in a simple olfactory delayed match to sample task in mice (Wu et al., 2020). It does not require making a decision about the sample, but it does require working memory to establish the mapping.
Other studies of abstract perceptual decision-making deployed a strategy similar to ours: the monkey is supplied evidence to make a decision before it can plan an action associated with the decision outcome. Gold and Shadlen (2003) used a RDM task nearly identical to ours, but they obtained a strikingly different result. Their monkeys exhibited saccadic latencies of ~200 ms from color-target appearance, suggesting they had formed their decision about the color rule before the targets appeared. They exhibited no behavioral signs of sampling from memory. The only salient difference is that their monkeys had been trained previously to associate motion with eye movements to targets. We suspect that having learned to accumulate evidence for motion as an evolving plan to make a saccade, they were able to form a decision in another intentional way—for color rule instead of target location. A similar explanation applies to the study by Bennurand Gold (2011). Their monkeys made their decisions in the presence of saccadic choice targets. They were required to associate up and down motion with up and down targets or with down and up targets, depending on a colored cue delivered after the motion had been shown. They too had learned an association with an action and thus required only a slight elaboration: to switch the stimulus-response associations in accordance with the color cue. In contrast, the monkeys in our study had never formed an association between the direction of RDM and an action. The only visual-motor association they were taught concerned color. The Gold and Shadlen (2003) and Bennur and Gold (2011) studies did not examine neural activity during the action selection epoch.
Our result was anticipated by Wang et al. (2019) who used a spatial integration task with separate evaluation and action selection epochs. The task structure used for one monkey resembles our go-task. It imposes a delay between the extinction of a static discriminandum and the presentation of the choice options. Similar to our monkey-AN, their monkey-T exhibited go-RTs that depended on the strength of the evidence experienced beforehand. They also report that the rate of rise of neuronal responses in Area PMd during action selection was dependent on stimulus strength. The Wang et al. study also supports the hypothesis that sampling of evidence from memory may be necessary to form a perceptual decision when the evidence is provided before it is possible to accommodate it in an intentional context.
The near limitless capacity for abstraction in humans gives an impression of disembodied ideation. Humans can evaluate propositions about the world—what things are and what categories they belong to—without using them as objects of possible action. An alternative formulation, rooted in ecological perception (Gibson, 1979), suggests that knowledge of the environment is in the service of what we might do, in the form of considerations and intentions (Merleau-Ponty, 1962; Clark, 1997). One activity humans pursue is reporting to other humans. The conversion of a provisional report to an action, like “look at the blue spot if the motion is rightward” permits humans to form a decision before the action is specified. The structure bears similarity to what monkeys— previously trained to associate rightward/leftward motion with an eye movement to the right/left— can achieve in abstract decision tasks like ours. If the human is not informed about the axis of discrimination until after the motion has been viewed, then like the monkey, humans too must rely on memory. Further, studies of iconic short term memory demonstrate that such memory can be formed strategically in order to anticipate knowledge of the operations that may be required (Sperling, 1960; Gegenfurtner and Sperling, 1993). Thus both monkeys in our task must have learned to store the appropriate motion information in short-term memory buffers to enable action selection based on the colors of the choice targets.
The difficulty that our abstract decision task poses for naive monkeys might raise concerns about the relevance of our finding to human cognitive function. But consider. The simpler (non-abstract) version of the motion task invites an association between a source of evidence, derived from one part of the visual field, that bears on the relative value of options, instantiated by targets elsewhere in the visual field. It is representative of the type of foraging decisions that monkeys make naturally, but it is not in the repertoire of the animal’s experiences. They must learn that the source of evidence bearing on action-selection derives from a patch of dynamic random dots and that the relevant information is represented by direction-selective neurons with receptive fields aligned to this patch. The same is true of a simpler blue-yellow decision task in which the color of an object near the point of fixation, say, determines whether a reward is associated with a blue or yellow choice target shown elsewhere in the visual field. The abstract decision in our task requires the animal to combine these types of decisions by either (i) building a hierarchical decision in which the outcome of the motion decision substitutes for the colored object, to instruct the blue-yellow choice, or (ii) storing evidence from motion to resolve the subsequent color choice.
The hierarchical strategy is the one humans appear to exercise, as the effect of the strength of evidence on go-RTs is minimal in human subjects (Twomey et al., 2016; Coallier and Kalaska, 2014). It is the way we would instruct another human to perform the task: “Decide whether the cloud of random dots is moving to the right or left; if right choose blue, and if left, choose yellow.” This is also the way monkeys previously trained on the non-abstract motion task solve the abstract task (Gold and Shadlen, 2003). Yet both monkeys in the present study used the second strategy. Neither showed any sign of integrating evidence toward a decision during motion viewing. We speculate that this is because they never had the experience of planning an action associated with a decision about motion. They were rewarded only for actions associated with color, and they could only discover a source of evidence associated with the color selection in short-term memory. It is an open question whether they improved their performance by learning to store more samples or by sampling more from passive storage that occurs naturally during perception, or both.
At first glance, the hierarchical strategy might appear to be the more sophisticated of the two. It is more complex, and the nested structure seems like a building block for language. Indeed, humans probably adopt this strategy because it is implied in the verbal instruction to perform the task. However the second strategy also connects to a sophisticated element of cognition: the capacity to use recent, but temporally non-adjacent, information to guide a decision. This is critical for learning causal relations, and it too plays a role in language. We make strategic use of short-term memory to store semantic content (analogous to samples of evidence) which we incorporate in locution later—analogous to action selection—in accordance with syntactic demands. The process is embarrassingly vivid when we lose the train of our thought. Such embarrassment is mitigated by the strategic use of short term memory, adhering to the old adage, “Put your mind in gear before you put your mouth in motion” (A. Shadlen, personal communication). Clearly expressions of perceptual decisions through eye movements and expressions of ideas through language invite more contrast than comparison, but the structural similarity may prove useful for neurobiology. Thus it is that the monkey’s crude approximation to abstract decision-making elucidates a critical building block of our own ideation.
Methods
All procedures were in accordance with the Public Health Service Policy on Humane Care and Use of Laboratory Animals, and approved by Columbia University’s Institutional Animal Care and Use Committee.
Behavioral Task and Electrophysiology
Two adult macaque monkeys (one female, AN; one male, SM) performed a behavioral task in which they decided whether the net direction of a stochastic random-dot motion (RDM) stimulus was to the left or right. The animals initiated trials by fixating on a point (fixation point; FP) presented on an otherwise black screen. The RDM stimulus was then presented within a circular aperture (radius 2.5° or 3°) centered on the FP. The first three frames of the stimulus consist of white dots randomly plotted at a density of 16.7 dots· deg-2· s-1. From the fourth frame, each dot from three frames before is replotted—either displaced to the right or left, or at a random location. The probability with which a dot is displaced to the right or left determines the stimulus strength (coherence; C) and on each trial, C was randomly chosen from the set {0, ±0.04, ±0.08, ±0.16, ±0.32, ±0.64}, the positive sign indicating rightward motion. The motion strengths and the two directions were randomly interleaved. The stimulus was presented for a variable duration drawn from a truncated exponential distribution (range 350-800 ms, mean 500 ms). Two targets, one blue and one yellow, were presented after a short delay (333 ms, monkey-AN; 200 ms, monkey-SM) at eccentric locations that varied across trials. The monkeys had to report the perceived direction of motion by choosing the target of the associated color (blue for rightward and yellow for leftward, monkey-AN; vice-versa for monkey-SM). In the go-task (Fig. 1, top), the FP was extinguished simultaneously with the onset of the colored targets. In the wait-task (Fig. 1, bottom), the FP stayed on for a variable duration (drawn from an inverted truncated exponential distribution, range 400-1200 ms, mean 900 ms).
We recorded spikes from 60 well-isolated single units (29 monkey-AN; 31 monkey-SM) in area LIPv (Lewis and Van Essen, 2000). MRI was used to localize LIPv and to guide the placement of recording electrodes. We screened for neurons that exhibited spatially selective persistent activity using a memory-guided saccade task (Gnadt and Andersen, 1988). In the screening task, a target is flashed in the periphery while the monkey fixates on a central spot. The monkey has to remember the location of the target and execute a saccade to that location when instructed. The response field (RF) of each neuron was identified as the region of visual space that elicited the highest activity during the interval between the target flash and the eventual saccade.
During recording experiments, the locations for target presentation were chosen based on the location of the neuronal RF. For monkey-AN, six locations (including the RF) were chosen, equally spaced on an imaginary circle. On each trial, pairs of locations 2π/3 rad apart were pseudorandomly selected to display the targets. The RF location was oversampled to increase the concentration of trials from which we could analyze neural data. A similar approach was taken in monkey-SM except that the number of possible locations were restricted to four and the target pairs were situated π/2 rad apart. Each colored target appeared in the RF on 33% and 28% of the trials for monkey-AN and monkey-SM, respectively. Note that the monkeys were trained to generalize across a larger set of locations and these spatial restrictions on target locations were implemented during recording sessions.
Analyses of behavioral data
Both monkeys were taught the association between the color of the target and the direction of motion using only the strongest motion strength (±64% coh). We then introduced the next easiest stimulus strength (±32% coh) and continued to add more coherences until we reached 0%. To assess the improvement of sensitivity across training sessions, we fit the choice-accuracy, Pco, as a function of motion strength, |C|, for each session with a Weibull function (Quick, 1974) of the following form:
 where λ is the lapse rate, β is the shape parameter, and α is the threshold if λ = 0. We interpolated from these fits the |C| that supports 75% accuracy and report that as the threshold (e.g., Figure 2-Figure Supplement 1).
The quantification of learning rate is from the introduction of the ±32% coh. The rates (e.g., Figure 2-Figure Supplement 1) are based on approximate number of sessions (and trials), because both monkeys experienced interruptions to training. For interruptions lasting more than a month, we excluded sessions after resumption until the monkey re-established thresholds similar to those prior to the interruption. This was also the case for monkey-SM when we switched from the go-task to the wait-task.
In Fig. 2A,B and Fig. 3C, we fit the choices of the monkeys with a logistic model of the following form:
 where λ, β0, β1 are fit parameters (Fig. 2A-B). This is also the analytic solution to symmetric diffusion (when λ = 0), and thus comparable to the fits of the models which are constrained to explain both choice and go-RT.
The go-reaction times (go-RT) of monkey-AN were fit with a bounded evidence accumulation model (Shadlen et al., 2006), modified to account for errors at the highest motion strength. In this model, the instantaneous evidence about motion at each time step is assumed to arise from a normal distribution with variance Δt and mean κ(C+C0)Δt, where C is the signed motion coherence, C0 is bias (expressed in units of signed coherence), and κ is a scaling parameter. The samples of instantaneous evidence are assumed to be independent and accumulated over time until the decision terminates, which occurs when the accumulated evidence reaches one of the bounds ±B leading to the choice of one of the targets. The mean go-RT is the expectation of the time taken for the accumulated evidence to reach the bound plus a constant—the non-decision time tnd comprising all contributions to the go-RT that do not depend on motion strength/direction and bias (e.g., sensory and motor delays). To account for asymmetric go-RTs in some configurations, we used two different non-decision times ( and
and  ) for blue and yellow target choices respectively.
In this framework, the mean go-RT for correct choices (i.e. choices consistent with the sign of the drift rate, κ[C + C0]) is described by
 where x ∈ {b,y} and θ are the fitted parameters {B, κ, C0,
  ,
,  }. The proportion of blue choices is determined by three of these parameters:
 where
where  is the probability of the diffusion process terminating at the bound for blue choices. We first established an estimate of the bias from a logistic fit to the choices Eq. 2, expressing the bias in units of coherence (ζ = β0/β1). Because the model explains the go-RT only when the choice is consistent with the sign of the drift rate (Ratcliff and Rouder, 1998), we used the mean go-RT for positive choices at C + ζ >0 and negative choices for C + ζ < 0.
Informed by the patterns of error go-RTs observed at the highest coherence (Figure 3-Figure Supplement 1B), we attribute the errors at the highest motion strength (lapse rate, λ) to a mistaken association between the sign of the terminating bound and its corresponding color-target (“direction-color confusion”). For weaker motion strengths the same confusion converts a fraction of correct terminations to erroneous color choices and the same fraction of incorrect terminations to correct color choices. We estimated λ from Eq. 2, thereby enabling conversion of  to the observed proportion of blue choices (Pb):

In our formulation, the trials with direction-color confusion inherit the tnd of the motion decision (not the chosen color) and the mean observed go-RT would include contributions from the trials lost and gained from that process. The fraction of confusion trials for blue choices at coherence C is
 and the mean go-RT for blue choices observed to be correct would be

We used a maximum likelihood procedure to fit this model to the choice and mean go-RTs on the correct (relative to ζ) choices (Fig. 3B).
We also fit an elaborated version of the bounded evidence accumulation model to include both correct and error trials. In this model, the decision bounds (B) collapse over time:
 where B0 is the initial bound height, B1 is the rate of collapse and Bdel is the delay to onset of collapse. The non-decision time was modeled as a normal distribution with mean tnd and standard deviation σnd. Instead of using Eq. 3 and Eq. 4,
  and
and  are obtained by numerical solution of Fokker-Planck equations (Chang and Cooper 1970; Kiani and Shadlen 2009). Again, separate non-decision times were used for decisions terminating at each of the two bounds and errors at the highest coherence were modeled as ‘direction-color confusion’ using the approach described above. This model furnished an expectation of the mean decision times for each coherence. We compared this model to one in which the errors at the highest coherence are not explained by direction-color confusion but by poor sensitivity (i.e. λ = 0; Figure 3-Figure Supplement 1). The observed pattern of error go-RTs also rules out the possibility that the errors at the highest coherence arise from the monkey disregarding motion information and choosing targets randomly. If this were true, those error trials would exhibit faster go-RT than the correct trials.
We augmented these analyses with psychophysical reverse correlation, to provide an empirical estimate of the epoch in which the RDM stimulus affected the choice. The motion energy on individual trials (0% coherence only) was computed using spatiotemporal filters as described in Kiani et al. (2008). The sign, right minus left or vice versa, was chosen such that positive indicates stimulus evidence in support of the monkey’s choice on that trial (Fig. 2C-D and Fig. 3D). To determine the actual duration of motion that had a significant influence on choices, we recalculated kernels using different lengths of the random dot movie shown in each trial. We report the length of time that the stimulus affects choice as the shortest movie-length that accounts for all the statistically significant bins obtained using the full-length movie.
Analyses of neural data
For visualization of population average firing rates (Fig. 4), spike times from single trials, si=1…n, were represented as delta functions δ(si–t) and convolved with an 80 ms boxcar filter. For each neuron we grouped trials based on what was presented in its RF: blue target, yellow target or neither. We averaged across trials for each group and determined the maximum of the average responses across the three groups. The responses on all individual trials were divided by this maximum to obtain normalized firing rates. The population responses shown in Fig. 4 were then computed from these normalized responses using relevant subsets of trials. For the motion viewing epoch, trials were grouped based on motion direction (0° or 180°) and coherence (High: 64% & 32%; Medium: 16%; Low: 8% & 4%; and 0%). In the target onset and saccade epochs, the grouping was based on which target was shown in the neuron’s RF (blue or yellow), coherence (same coherence groups as in the motion viewing epoch) and the direction of motion (preferred vs. non-preferred). For the majority of neurons, on trials in which a target appeared in the RF, a higher response was recorded when target appearance was preceded by the associated motion direction. For six neurons in monkey-SM, the non-associated direction elicited the higher response and was designated the preferred direction. To visualize the coherence dependent buildup of activity (insets of Fig. 4C-F), we detrended the population responses by subtracting the average responses to the 0% and ±4% coherence conditions. This detrending was done separately for trials with each colored target in the RF.
We pursued several analyses to characterize the neural responses during the epoch of action selection, after the onset of the color-choice targets. We defined the beginning of this epoch, t∇, as the first of three consecutive 40 ms time bins, beginning at least 50 ms after target onset, in which the average responses associated with correct choices at the strongest motion diverged (p<0.05, Wilcoxon rank sum test). For monkeys AN and SM t∇ = 170 and 100 ms, respectively. Our analyses focus on early decision formation, before many decisions would be expected to terminate on the more difficult conditions. For monkey-AN, we set the end of the epoch as t∇ + 300 ms or 200 ms before saccade initiation, whichever occurred first. There are no overt terminating events for monkey-SM. We therefore chose t∇ + 250 ms.
The effect of signed motion strength on build-up rate (Fig. 5) was established as follows. In the epoch defined above, we computed firing rates in 20 ms bins for each trial. For each neuron we grouped trials based on the target that appeared in the RF (blue or yellow). We removed the sensory component of the responses for each group by subtracting the average responses to the 0% and ±4% coherence conditions and computed the buildup rate for each coherence (the slope across bins). We excluded the ±64% coherence conditions from this analysis because there were too few time bins for monkey-AN, owing to fast go-RT, and an early plateau in monkey-SM, owing, we suspect, to fast decision terminations. We report the population mean and SE of the buildup rates and the fit to a linear model regressing these buildup rates against signed coherence in Fig. 5.
The analyses summarized in Fig. 6 & Fig. 7 compare the evolution of the variance and autocor-relation of the firing rate during the epoch of putative decision formation to the expected time course of these statistics under diffusion — if the spikes are associated with latent firing rates that represent the the sum of independent, identically distributed (iid) random numbers. The theory and algorithm are described in previous publications (Churchland et al., 2011; de Lafuente et al., 2015; Shushruth et al.,2018). We used the spike counts in 60 ms bins in the epoch described above. This analysis focused on trials with the three weakest motion strengths (0%, ±4% and ±8% coh) to exploit the longer duration over which the decision process unfolds in these trials. The trials are initially grouped by neuron, the 5 unique signed coherences, and the target in the RF. We used the residuals of responses for each group to remove the contribution of motion strength and direction.
Consider, for the moment, trials from one neuron and one time bin. For each trial, i, we measure the raw spike count and compute the residual count by removing the mean count for all trials of the same combination of signed coherence and the color of the target in the RF, j,

The total variance across trials, is
 because variance is a central moment. We assume the noise component of evidence samples is the same for all the motion strengths. Therefore the variance across all combinations of signed coherence and the color of the target in the RF is Var[ν],∀ j. This is the total variance of the counts in the time bin under consideration. We are interested in the variance of the latent rate that gives rise to the spike counts on each trial. This is obtained by subtracting off the component of the variance attributed to the variable spike counts that would be observed even if the latent rate were fixed. For a Poisson point process this would be
  , but we assume the point process is a generalized renewal (Nawrot et al., 2008) and is thus approximated by the point process variance,
 where the Fano factor, ϕ, is unknown. Note that the point process variance depends on the signed coherence. From the law of total variance, subtraction of this component from the total variance leaves the variance of the conditional expectation,
  . There is a bookkeeping step that respects the dependence of Vpp on signed coherence and neuron (see previous citations), but using the residuals, we can obtain an estimate of the VarCE across all neurons at one time bin. Dividing by 0.062 yields the variance of the latent rates (spikes2/s2) across trials (in the time bin under consideration), although it depends on the unknown ϕ. For unbounded diffusion the VarCE should increase linearly as a function of time, because it is a cumulative sum of iid random numbers.
Diffusion also specifies the autocorrelation, between the cumulative sum of the first i samples and the cumulative sum of the first j ≥ i values:

This implies a decay of correlation as function of lag, j – i, and an increase in correlation for fixed lag, as a function of time. We obtain the estimates, rij, from data by forming the autocovariance matrix on residuals from all neurons. Note that the Covpp = 0 for i ≠ j, because by construction, given the rate in time bin j the stochastic realization of spike count does not depend on the rate or realization of spike count in bin j. Therefore the covariance of the conditional expectation (CovCE) is the raw covariance for i ≠ j. Its diagonal (i = j) is the VarCE. This matrix is normalized in the usual way to produce a correlation matrix of conditional expectation (CorCE).
The CorCE depends on the VarCE which depends on ϕ, which is unknown. We chose the value that minimized the sum of squares,
 where
where  denotes standardization (Fisher-z transform).
The values of the variance plotted in Fig. 6 & Fig. 7 are VarCE, using the fitted ϕ. The standard errors are estimated from a bootstrap procedure (Efron, 1987) in which trials were sampled (with replacement) while maintaining their grouping (same neuron, dot direction, coherence and color of target in RF). We also performed the same analysis using neural responses in the epoch between 190 to 550 ms after RDM onset (Figure 6-Figure Supplement 1 & Figure 7-Figure Supplement 1).
We used the same approach to evaluate two alternatives to latent diffusion dynamics on single trials. Both are capable of mimicking the firing rate averages average observed in the a data (e.g., Fig. 4 inserts: (i) a linear buildup of activity with variable slope across trials; or (ii) a constant firing rate followed by a step to a high or low firing rate at the termination of the decision. We simulated 10000 trials for each of the alternatives and estimated the expected variance and autocorrelation (see also Churchland et al. 2011). The simulations were matched to have the same decision termination times and state at termination. The only difference across simulations on each trial was the path the simulated decision variable took to reach the point of termination.
We first simulated drift-diffusion dynamics (e.g., inset to Figure 7-Figure Supplement2A) wherein the responses (R) evolved over 300 ms. At each time step, Δt,
 where κ is the deterministic drift component (derived from the model fit to behavioral data from monkey-AN) and
  is the diffusion component (i.e., Normally distributed with mean zero and SD
  . The diffusion dynamics on each trial terminated if and when |R| ≥ B, the bound value derived from the fit to behavior. For each trial, we generated an equivalent trial in which (i) the responses increased or decreased linearly to the same termination point (the linear ramp model) or (ii) the responses remained constant and stepped up or down to bound ±B at the time point at which the corresponding diffusion path terminated (terminating step model). For monkey-SM, in the simulated trials that terminated before 300 ms, the responses stayed at B for the reminder of the trial. This simulates the wait time that was imposed on monkey-SM before being allowed to report its decision. For monkey-AN, spikes that occurred within 200 ms prior to the eye movement were excluded from neural analyses. Thus the model with terminating steps can be ruled out, as it predicts no change in firing rate (hence, no change in VarCE) in the analyzed epoch.
We used the same approach as before to compare the autocorrelation of the firing rate in the action selection epoch to the expectations from the simulations (Figure 6-Figure Supplement 2 & Figure 7-Figure Supplement 2). For each comparison, the value of ϕ was fit to minimize the sum of squares as in Eq. 13. Note that this is the only free parameter for each comparison. We report Bayesian Information Criterion across models.
Data and Code Availability
Raw data and code to generate the figures will be available on GitHub repository at publication.
Acknowledgments
The research was supported by HHMI, NIH and BBRF. We thank Brian Madeira and Cornel Duhaney for technical support and animal care. We thank Danique Jeurissen, Gabriel Stine, Natalie Steinemann, Simon Kelly, Redmond O’Connell and Ariel Zylberberg for comments on an earlier draft of the manuscript, and Arthur Shadlen (grandpa) for advice and/or reprimand. We are especially grateful to animal technicians, veterinary staff, and other essential workers at the Zuckerman Institute who made it possible to collect the data set from monkey-SM during the SARS-CoV-2 pandemic.
References


