

Abstract
Proliferation and motility are mutually exclusive biological processes associated with cancer that depend on precise control of upstream signaling pathways with overlapping functionalities. We find that STRN3 and STRN4 scaffold subunits of the STRIPAK complex interact with MAP4K4 for pathway regulation in medulloblastoma. Disruption of the MAP4K4-STRIPAK complex impairs growth factor-induced migration and tissue invasion and stalls YAP/TAZ target gene expression and oncogenic growth. The migration promoting functions of the MAP4K4-STRIPAK complex involve the activation of novel PKCs and the phosphorylation of the membrane targeting S157 residue of VASP through MAP4K4. The anti-proliferative effect of complex disruption is associated with reduced YAP/TAZ target gene expression and results in repressed tumor growth in the brain tissue. This dichotomous functionality of the STRIPAK complex in migration and proliferation control acts through MAP4K4 regulation in tumor cells and provides relevant mechanistic insights into novel tumorigenic functions of the STRIPAK complex in medulloblastoma.
Introduction
Medulloblastoma (MB) is the most common malignant brain tumor in children1. Four distinct molecular subgroups (Wingless (WNT), Sonic Hedgehog (SHH), group 3, and group 4) can be discriminated with a total of 12 subtypes that display differences in genetic alterations, clinical features, and outcomes2–4. With multimodal therapies, the survival rates across all MB age groups have reached 70-85%5–7. However, the characteristic tendency of MB cells to locally infiltrate the cerebrospinal fluid (CSF) via leptomeningeal dissemination reduces the efficacy of current treatments8. One key driver of tissue invasion and growth in MB is the Fibroblast Growth Factor Receptor (FGFR) signaling pathway9,10 The molecular mechanisms underlying MB tissue infiltration and growth are poorly understood and cannot be specifically targeted11. Infiltration, dissemination, and long-distance spreading of tumor cells are mediated by the transient or permanent induction of cell motility12. Cell migration relies on the complex orchestration of cytoskeletal remodeling, membrane dynamics, and cell adhesion to the extracellular matrix (ECM)13–15. Parallel, potentially redundant signaling pathways control these processes, and anti-dissemination therapies should specifically target the pro-migratory activity of a central component that integrates signals of several pathways.
We have identified the serine/threonine mitogen-activated protein kinase kinase kinase kinase 4 (MAP4K4/HGK/NIK), which is upregulated in MB patient samples, as a critical promoter of receptor tyrosine kinase (RTK)-induced MB cell dissemination16,17. MAP4K4 was originally identified as a Ste20 germinal center-like kinase18 involved in the activation of the c-jun N-terminal kinase (JNK)19,20. MAP4K4 controls a wide range of biological processes21–26, which can be explained by the interaction of MAP4K4 with a range of structurally and functionally different effectors. The pro-migratory function of MAP4K4 is in part due to its capability to directly phosphorylate the ezrin, radixin, moesin (ERM) proteins, which mediate lamellipodium formation in response to growth-factor (GF) stimulation27. MAP4K4 directly couples GF signaling to actin polymerization through phosphorylation of the actin-related protein 2 (Arp2) subunit of the Arp2/3 complex, which increases its actin nucleation activity and triggers membrane protrusion in response to EGF28. In MB, MAP4K4 promotes turnover and activation of the receptor tyrosine kinase c-MET and of the β-1 integrin adhesion receptor, which is necessary for membrane protrusion at the leading edge of invading cells17. However, the mechanisms orchestrating and balancing oncogenic functions of MAP4K4 in MB and other solid tumors remain unknown.
Using proximity-dependent biotin identification (BioID), we identified MAP4K4 as a component of the recently identified Striatin-interacting phosphatase and kinase (STRIPAK) complex29–31 in MB cells. We explored whether MAP4K4-STRIPAK components are implicated in FGFR-driven cell dissemination, tissue invasion and growth in MB, and we identified underlying changes in relevant signaling pathways by kinase activity profiling. Our study identified the MAP4K4-STRIPAK complex as a central hub and bifurcation point, which orchestrates tissue invasion and growth in MB tumors. It provides relevant mechanistic insights in the regulation of these central processes in MB, which will contribute to the design of more effective therapies for this devastating disease in the future.
Results
MAP4K4 is a component of the STRIPAK complex in MB cells
We used BioID to assess the MAP4K4 interactome and identified proteins biotinylated by FLAG-tagged N- or C-terminally biotin ligase-fused (BioID232) full-length MAP4K4 (BioID2-MAP4K4 and MAP4K4-BioID2) or BioID2-FLAG alone through mass spectrometry (MS)33,34 (Figure S1a). The expression of 3xFLAG-tagged MAP4K4-BioID2 was confirmed by anti-FLAG immunoblot (IB) analysis and of biotinylation activity by horseradish peroxidase (HRP)-coupled streptavidin binding (Figure 1a). Biotinylated proteins were enriched by affinity-capturing using streptavidin-conjugated beads and subjected to MS. We identified a total of 156 MAP4K4-specific proteins (Figure 1b, Table S1). Gene ontology (GO) analysis with these proteins predicted functions such as endosomal transport17, actin polymerization28, or regulation of cell adhesion26 (Figure 1c), and found enrichment of components of the STRIPAK complex (Figure 1c,d), a supramolecular scaffold held together by the striatin family proteins (STRN, STRN3, STRN4). STRNs act as a regulatory subunit of the protein phosphatase PP2A and are associated with STRN-interacting proteins (STRIP1/2) and with members of the germinal center kinase (GCK) families (Figure 1e)29,35. We confirmed the interaction of 3xFLAG-BioID2-MAP4K4 with STRN3, STRN4, and STRIP1 in HEK-293T cells (Figure 1f). In agreement with other studies36–39, these data confirm MAP4K4 association with the STRIPAK complex in cells, possibly through direct interaction with STRN4 and STRN3.

(a) Immunoblot analysis (IB) of HEK-293T total cell lysate or after immunoprecipitation (IP) with streptavidin-conjugated beads and detection with HRP-streptavidin. n=2 experiments. (b) Venn diagram of affinity captured proteins from HEK-293T cells. Comparison of BioID2-MAP4K4 with BioID2-CTRL is shown. Values of enriched proteins (p < 0.05, one-way ANOVA) are shown. n=3. (c) Gene ontology (GO) classifications of MAP4K4-interacting proteins. (d) Volcano plot of interacting proteins in N-BioID2-MAP4K4 (left) or C-BioID2-MAP4K4 (right) HEK-293T cells compared to BioID2-CTRL. Log10 ratios of cumulated peptide detection values plotted against negative Log10 p-values of Student’s t-test. Enriched proteins are highlighted in red (p < 0.05 and > 2-fold enrichment) and members of the STRIPAK complex indicated. (e) Architecture of the STRIPAK complex, adapted from81. (f) IB detection of BioID2-MAP4K4-FLAG and components of STRIPAK complex in anti-FLAG-IP in HEK-293T cells. (g) IB of FLAG-tagged BioID2 alone or fused to MAP4K4 in DAOY cell lysate or after pull-down with streptavidin-conjugated beads. (h) Venn diagram of affinity-captured proteins from DAOY BioID2-MAP4K4 cells compared to BioID2-CTRL. n=2. (I) IB of MAP4K4-FLAG and components of STRIPAK complex after anti-FLAG-IP in DAOY cells. (j) Top: MAP4K4 domain architecture and MAP4K4 constructs used. Numbers represent the amino acids corresponding to full-length MAP4K4. KD, kinase domain; ID, intermediate domain; CNH, citron homology domain; CC, coiled-coil. Lower: Co-IP and IB analysis of STRN4 and STRIP1 in DAOY cells transduced with lentiviral vectors expressing full-length or truncated MAP4K4-FLAG. Asterisks indicate relevant bands. (k) Quantification of co-IP from j (n=3, means ± SD). See also Figure S1.
We generated MB cell lines stably expressing either the 3XFLAG-BioID2-MAP4K4 fusion proteins or BioID2 alone to test MAP4K4-STRIPAK complex interaction in these cells (Figure 1g). BioID2-MAP4K4 localized to the cytoplasm, the primary residency of MAP4K4, where it co-localized with biotinylated proteins (Figure S1b). In contrast, BioID2 distributes throughout the cells, with enrichment in the nucleus. Streptavidin affinity purification-MS and anti-FLAG immunoprecipitation confirmed the association of MAP4K4 with the STRIPAK complex in MB cells (Figure 1h,i, Figure S1c, Table S2). Unlike other germinal center kinases that have been reported to interact with STRIP1 in an activity-dependent manner40, inhibition of MAP4K4 by GNE-495 did not impact its constitutive association with STRN4, STRN3, and STRIP1 (Figure S1d). We generated DAOY cells stably expressing 3XFLAG-tagged single domains or truncated versions of MAP4K4 (Figure 1J). We found that N-terminally truncated MAP4K4 (ID1-ID2-CNH, 290-1273) pulled-down STRN4 and STRIP1 more effectively than C-terminally truncated KD-ID1-ID2 (1-954) (Figure 1j,k). The kinase domain (KD, 1-289) or the intermediate domains (ID1, 290-634 or ID2, 635-954) alone are not sufficient for pulling down STRN4 or STRIP1. Combined, these results suggest that the citron homology domain (CNH, 954-1273) is required for MAP4K4-STRIPAK interaction.
STRIPAK complex is required for bFGF-induced collagen I invasion of MB cells
STRIPAK complex members STRN4, STRN3, and STRIP1 are highly expressed in MB, and the expression of STRNs correlates positively with site-specific phosphorylation of MAP4K4 in ID1 and negatively with phosphorylation in ID2 in vivo (41 and Figure S2a-d), suggesting a potential contribution of these proteins to MAP4K4 regulation and MB pathogenesis. MAP4K4 promotes GF-induced MB cell motility 16,17. Hence, we first tested the implication of STRIPAK complex proteins in invasive motility in DAOY (SHH) MB cell lines with a stable knockout (KO) of STRN4, STRN3, or STRIP1 (Figure S3a,b). Using the spheroid collagen I invasion assay (SIA42), we observed that STRN4 KO abrogated GF-induced cell invasion in DAOY cells, while KO of either STRIP1 or STRN3 had little or no effect (Figure 2A, Figure S3c).

(a) Invasion and representative images of 3D spheroid invasion assay (SIA) of DAOY cells KO for MAP4K4, STRN4, STRN3, or STRIP1 ± bFGF (100 ng/ml). Invasion is calculated as sum of the distances of each migrating cell from the center of the spheroids (n=3, means ± SD). (b) SIA of DAOY cells transfected with 10 nM of the indicated siRNA ± GFs (EGF: 30 ng/ml, bFGF: 100 ng/ml). n=4, means ± SD. (c) SIA and representative images of DAOY cells ± 100 ng/ml bFGF and ± increasing concentrations of PP2A inhibitor LB-100 (n=3, means ± SD). * p < 0.05, ** p < 0.01, *** p < 0.001, **** p < 0.0001 (one-way ANOVA). See also Figure S3.
We next determined the effect of simultaneous depletion of various STRIPAK components on GF-induced migration using siRNA (Figure S3d,e). siSTRN4 confirmed STRN4 implication in bFGF-induced collagen I invasion (Figure 2b). siSTRN3 also moderately reduced bFGF-induced invasion, whereas siSTRIP1 caused a marked increase in both EGF- and bFGF-induced invasion (Figure 2b). siSTRIP1-induced invasion was reverted when STRN4 was depleted simultaneously, indicating that the activity repressed by STRIP1 involves a STRN3/4-dependent mechanism. Consistent with a functional redundancy of STRN3 and STRN4, we observed that combined depletion of STRN3 and STRN4 had an additive effect on EGF- or bFGF-induced collagen I invasion. Thus, STRN3 and STRN4 are, together with MAP4K4, required for GF-induced collagen I invasion in MB, while STRIP1 has an inhibitory function in this process.
STRIPAK complex can regulate associated kinases by enabling dephosphorylation through the PP2A catalytic subunit43,44. Inhibition of PP2A sensitizes tumors to radiation and/or chemotherapy and attenuates cell migration45,46. The PP2A inhibitor LB-100 decreased EGF- and bFGF-induced collagen I invasion in a dose-dependent manner (Figure 2c, Figure S3f), without affecting cell viability (Figure S3g). PP2A is thus not acting as a negative regulator of STRIPAK complex-associated MAP4K4 towards GF-induced migration in MB, whereas STRN3/4 enable or facilitate the pro-invasive phenotype in GF-stimulated MB cells.
STRN3 controls GF-induced tissue expansion of tumor cell
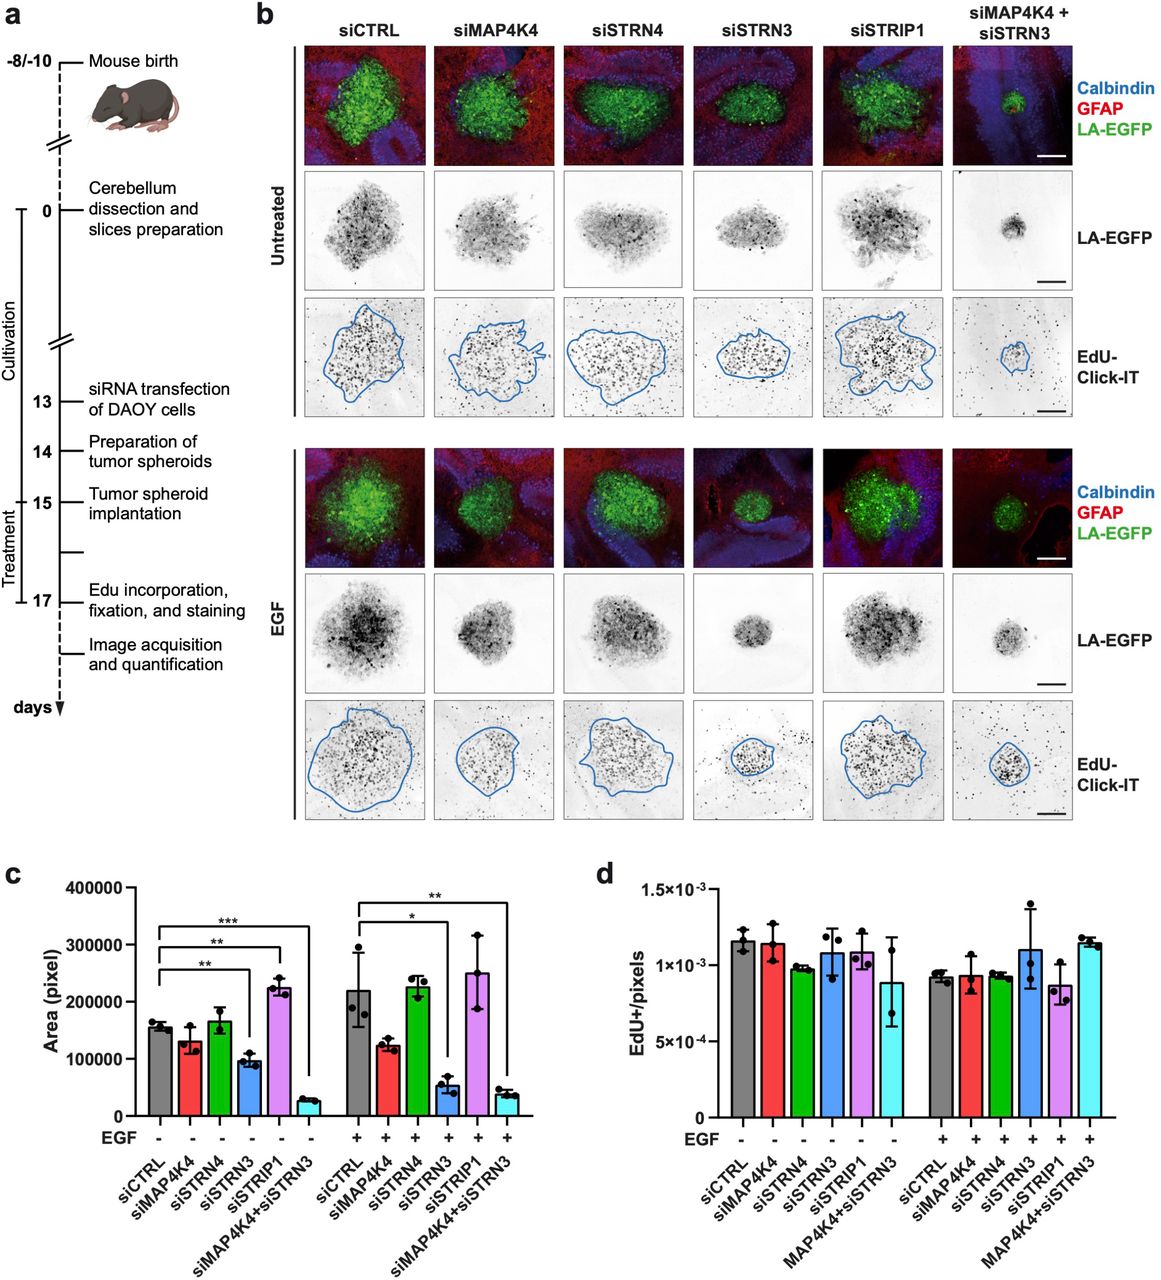
We used an ex vivo organotypic cerebellum slice culture model (OCSCs) to test STRIPAK implication in MB tissue invasion. OCSCs maintain key features of the normal cerebellum cytoarchitecture and constitute a physiologically relevant microenvironment model47, where FGFR signaling contributes to MB growth and tissue invasion9. We first tested whether the depletion of MAP4K4 or STRIPAK components prevented growth and tissue invasion of DAOY cells (Figure 3a). Treatment of the co-culture with EGF further enhances brain tissue invasion of the tumor cells. Depletion of MAP4K4 caused rounded cell morphology and moderately reduced EGF-induced invasion (Figure 3b,c, Figure S4). Depletion of STRN3 caused compaction of the tumor cell spheroids and prevented tissue invasion in basal and EGF-stimulated conditions. Conversely, depletion of STRIP1 induced a more infiltrative behavior, similar to what was observed in vitro (Figure 2b). The combined depletion of MAP4K4 and STRN3 in DAOY cells caused a dramatic reduction of tumor area, which is not solely caused by reduced cell proliferation (Figure 3c,d).

(a) Timeline of organotypic cerebellum slice culture (OCSC) and tumor spheroid implantation. (b) Maximum intensity projections (MIP) of representative confocal sections of OCSCs implanted with DAOY tumor cell spheroids ± 30 ng/ml EGF for 48h. Green: Lifeact-EGFP; blue: calbindin (Purkinje cells); red: GFAP. Middle: Inverted greyscale images of MIP of LA-EGFP channel, lower: Inverted greyscale images of MIP of EdU-Click-IT staining. Scale bar: 200 μm. (c) Quantification of LA-EGFP area of spheroids shown in b (n=3, means ± SD). (d) Number of EdU-positive nuclei normalized by the area of the tumor spheroids (n=3, means ± SD). * p < 0.05, ** p < 0.01, *** p < 0.001 (unpaired Student’s t-test). See also Figure S4.
To confirm STRIPAK complex implication in tissue invasion, we implanted HD-MBO3 group 3 MB cell lines KO for either MAP4K4, STRN4, STRN3, or STRIP1 (Figure S3b) in OCSCs. HD-MBO3 cells are invasive and display a high growth rate47. We observed a moderate for MAP4K4 KO and a significant reduction in the expansion for STRN3 KO cell-derived tumors, both after five days in basal or GF-stimulated conditions (Figure 4a,b, Figure S5). Moreover, the number of EdU-positive nuclei was considerably reduced in sgSTRN3 and sgSTRN4 but not in sgMAP4K4 cells (Figure 4c).

(a) Organotypic cerebellum slice culture implanted with tumor spheroids derived from HD-MBO3 cells KO for MAP4K4, STRN4, STRN3, or STRIP1. MIP of representative slices five days after implantation and ± treatment with 30 ng/ml EGF or 12.5 ng/ml bFGF. Green: Lifeact-EGFP; blue: calbindin (Purkinje cells); red: GFAP; yellow: Edu-Click-IT. Scale bar: 200 μm. (b) Areas of LA-EGFP positive spheroids showed in a. n=3, means ± SD. (c) Number of EdU-positive nuclei normalized by the area in pixels of the tumor spheroids (n=3, means ± SD). * p < 0.05, ** p < 0.01, *** p < 0.001, **** p < 0.0001 (unpaired Student’s t-test). See also Figure S5.
This data supports a model of STRIPAK-MAP4K4 complex control of growth and invasion of MB tumor cells in the cerebellum tissue environment.
Opposing functions of STRN3/4 and MAP4K4 in cell proliferation and YAP/TAZ target gene regulation
STRN3 and STRN4 but not MAP4K4 depletion reduce MB cell growth in the cerebellum tissue. We therefore tested MAP4K4-STRIPAK complex implication in colony-forming capability and clonal growth. Depletion of MAP4K4 caused a marked increase in colony number independent of growth factor stimulation in DAOY cells (Figure 5a). Conversely, depletion of STRN3 impaired colony formation and clonal growth. Consistently depletion of either STRN4 or STRN3 caused a significant decrease in the number of HD-MB03 colonies (Figure 5b), demonstrating that an intact STRIPAK complex is necessary for clonal growth and colony expansion in MB cells. The effect of STRN3 depletion is particularly striking under bFGF stimulation in HD-MB03, which promotes massive colony-forming activity in this group 3 MB model.
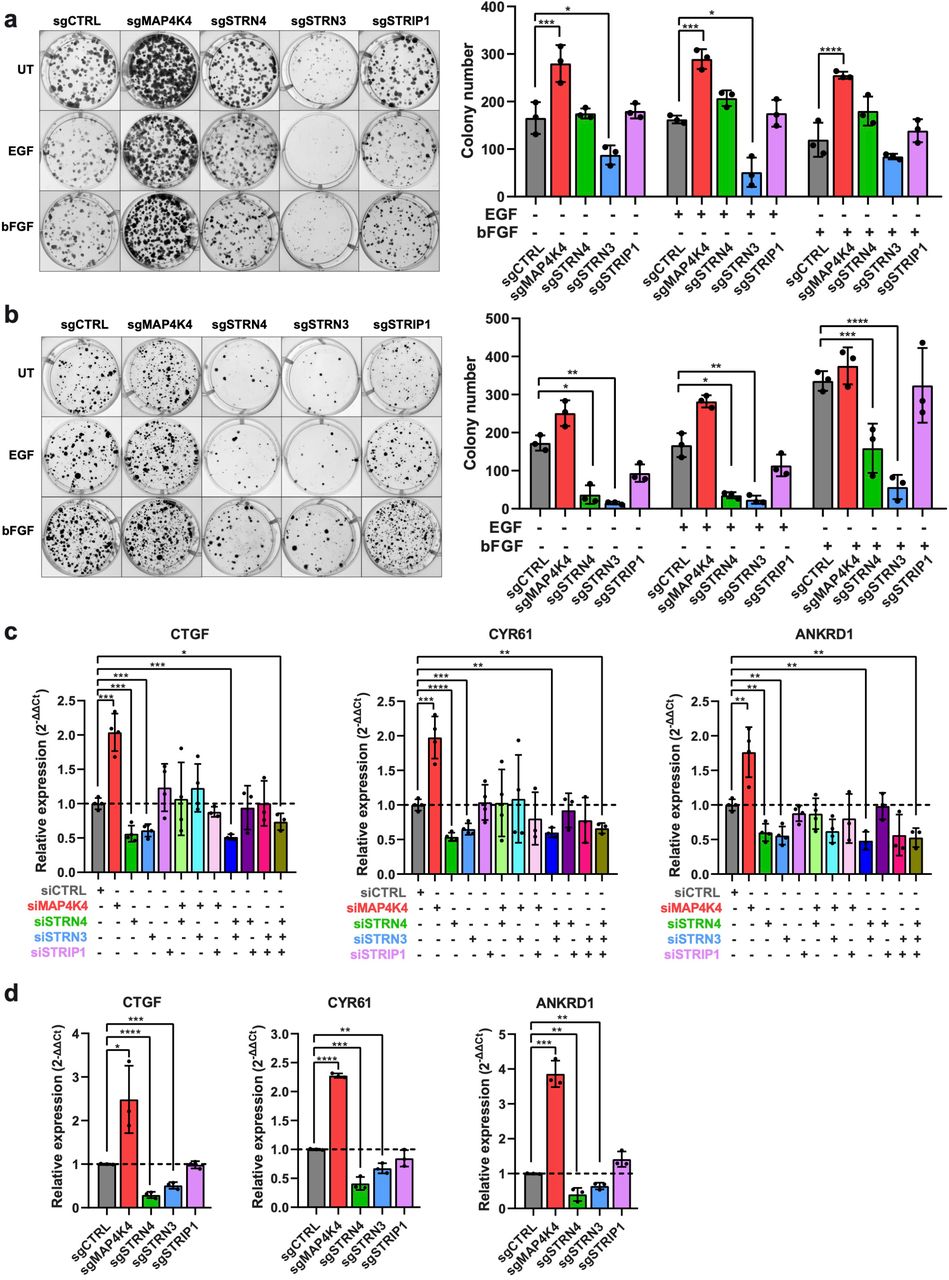
(a) Colony formation assay of DAOY cells KO for MAP4K4, STRN4, STRN3, or STRIP1 ± EGF or bFGF treatment (EGF: 30 ng/ml, bFGF: 100 ng/ml). Representative images (left) and quantification (right, n=3, means ± SD). (b) Colony formation assay using HD-MBO3 cells with treatments as in a. (n=3, means ± SD). (c) qRT-PCR analysis of YAP/TAZ target genes in DAOY cells 48 h after transfection with siRNAs as indicated. n=4, means ± SD. (d) qRT-PCR analysis of YAP/TAZ target genes in HD-MBO3 with CRISPR/Cas9-mediated knockout of MAP4K4, STRN4, STRN3, or STRIP1 (n=3, means ± SD). Statistical analyses in a and b were performed by one-way ANOVA, in c and d by unpaired Student’s t-test. * p < 0.05, ** p < 0.01, *** p < 0.001, **** p < 0.0001. See also Figure S6.
MAP4K4 is an activator of the Hippo tumor suppressor pathway, repressing YAP/TAZ target gene expression and growth48,49. By antagonizing these growth-repressive MAP4K4 functions, the STRIPAK complex halts Hippo pathway activation and promotes YAP/TAZ transcriptional activity37,38,50,51. We found that MAP4K4 depletion significantly increased the expression of the YAP/TAZ target genes CTGF, CYR61, and ANKRD1, which supports a Hippo-pathway activating function of MAP4K4 in MB cells (Figure 5c,d). Conversely, suppression of STRN3 or STRN4 decreased transcription of these genes and reverted the transcriptional activation induced by MAP4K4 depletion (Figure 5c).
Thus, MAP4K4 blocks MB cell proliferation, possibly by promoting the activation of the Hippo pathway, whereas the STRIPAK complex and, in particular, STRN3, antagonizes Hippo activation and is necessary for proliferation of MB cells (Figure S6).
Novel protein kinases C are downstream effectors of MAP4K4 and STRN3 in promigratory signaling
To identify effectors of the MAP4K4-STRIPAK complex downstream of FGFR activation, we profiled changes in global kinase activities using the PamGene array technology. FGFR signaling caused significantly increased activities of CDKs, PKC, SRC kinases, and FAK (Fig. 6a and Figure S7a). Several of these and additional bFGF-induced kinase activities require the expression of MAP4K4 or STRIPAK complex components (Figure 6a, Figure S7a). The most differently regulated Ser/Thr (STK) kinases cluster in the AGC (cAMP-dependent, cGMP-dependent, and PKC) family of kinases (Figure S7b-e). The activities of several AGC kinases were reduced when MAP4K4, STRN4, or STRN3 were downregulated and increased in STRIP1-depleted cells. Consistently, depletion of MAP4K4, STRN3 or STRN4, but not of STRIP1, caused a striking decrease in bFGF-induced activity of “novel” protein kinases C (nPKCs, PKCδ, ε, η and θ) (Figure 6a). This suggests that MAP4K4 and STRIPAK components are necessary for bFGF-induced activation of nPKCs and implies an effector role of nPKCs downstream of MAP4K4 and STRN3. STRIP1 depletion increased the activity of a MAP4K4 signature (Figure 6a), indicating that STRIP1 represses MAP4K4 in MB cells. The activated nPKC could constitute druggable effector kinases to repress MB cell dissemination. We tested this possibility using inhibitors specific for PKCδ (Rottlerin,52) and PKCθ (PKCθ I,53), and we observed a dose-dependent reduction of bFGF-induced cell dissemination in DAOY cells (Figure 6b,c). The combination of both inhibitors further reduced dissemination, suggesting that PKCδ and PKCθ functions in migration control are partially overlapping (Figure 6d). Notably, the inhibition of classical PKCα, β, γ kinases by Bisindolylmaleimide I (BIM) did not significantly repress MB cell dissemination (Figure 6e).

(a) Kinase activity prediction analysis in DAOY cells transfected with the indicated siRNAs and ± stimulation with 100 ng/ml bFGF for 15 min. The plots show predicted top 25 differentially activated serine/threonine kinases (STK). The x-axis indicates differences in the activity of the predicted protein kinase between the two groups, with effect size (values) and direction (>0=activation; <0=inhibition). The color of the bars represents the specificity score (darker to light is higher to lower score). Values >0.9 were considered as statistically relevant. First graph from left: comparison of bFGF stimulated siCTRL cells vs. untreated (UT); all other graphs: comparison of the indicated siTarget vs. siCTRL with bFGF stimulation. Highlighted in red are novel PKC isoforms (δ, ε, η and θ) (n=3). (b-e) Quantification and representative images of SIA with DAOY cells stimulated with 100 ng/ml bFGF and treated with increasing concentrations of PKC inhibitors. Invasion was quantified as the sum of invasion distances from the center of the spheroids. b: Rottlerin (PKCδ inhibitor, n=4, means ± SD). c: PKCθ inhibitor (n=4, means ± SD). d: Combination of Rottlerin and PKCθ inhibitor (n=3, means ± SD). e: Bisindolylmaleimide I (BIM, PKCα/β/γ inhibitor, n=4, means ± SD). * p < 0.05, ** p < 0.01, **** p < 0.0001 (one-way ANOVA). See also Figure S7.
Collectively these data demonstrate that MAP4K4 and STRN3 promote a pro-migratory phenotype in MB cells through the activation of common downstream effectors, which include novel but not classical PKC family members.
MAP4K4 and STRN3 enable bFGF-induced VASP Ser157 phosphorylation
Depletion of MAP4K4 in bFGF-stimulated DAOY cells resulted in an overall decrease in the phosphorylation of multiple STK and PTK consensus phosphorylation sites (Figure 7a, Figure S8, Table S3). Many of these alterations were phenocopied by the depletion of STRN3 (Figure 7a). Conversely, depletion of STRIP1 caused a global increase in the phosphorylation of STK substrates (Figure 7a, Figure S8a). Phosphorylation profiles of PTK substrates were similar under all conditions (Figure 7a, Figure S8b), with 23 substrates uniquely altered by MAP4K4 or STRN3 depletion (Figure 7b), including the phospholipase C-γ (PLC-γ)-binding site54 of FGFR1 (FGFRY766), and the SRC phosphorylation site of AKT (AKTY326)55 (Figure 7c). Additionally, we observed the reduction of FAK1Y570/576 and FAK2Y573/579 phosphorylation in siMAP4K4 and siSTRN3, supporting the previously described role of MAP4K4 in mediating FAK protein activation and focal adhesion assembly17 (Figure 7c).

(a) Heat map of increased (red) and decreased (blue) phosphorylation of Ser/Thr (STK, left) or Tyr (PTK, right) consensus peptides associated with lysates from siRNA transfected DAOY cells treated ± 100 ng/ml bFGF for 15 min. Log2 of the fold change between siTarget and siCTRL (n=3). (b) Venn diagram displaying the number of Ser/Thr and Tyr peptides with significantly changed phosphorylation (p < 0.1) in each siTarget versus siCTRL with bFGF stimulation (n=3). (c) Volcano plots representing the changes in phosphorylation of STK (circles) and PTK (diamonds) peptides in siMAP4K4 (left) or siSTRN3 (right) versus siCTRL with bFGF stimulation. Blue: peptides with significantly decreased (fold change < 1.35), red: peptides with significantly increased phosphorylation (fold change > 1.35). (n=3). See also Figure S8 and Table S3. (d) Single confocal section of VASP localization in DAOY cells seeded on collagen-coated plates ± 100 ng/ml bFGF for 15 min. 3X magnifications of boxed areas are shown. Red: VASP, Green: Lifeact-EGFP. Blue: DNA (Hoechst). Scale bar: 20 μm. (e) Maximum intensity projection of LA-EGFP fluorescence of tissue-invading HD-MBO3 CTRL or KO MAP4K4 or STRN3 cells. Scale bar: 10 µm. (f) IB and quantification of VASPS157 phosphorylation in DAOY cells 72 h after siRNA transfection ± 100 ng/ml bFGF for 15 min (n=3, means ± SD). (g-h) IB and quantification of VASPS157 phosphorylation in DAOY (g) and HD-MBO3 cells (h) after treatment for 4 h with increasing concentration of GNE-495 ± 100 ng/ml bFGF for 15 min. Quantification represents the ratio of p-VASPS157 over total VASP relative to untreated control (g: n=3, means ± SD. h: n=2, means ± SD). (i) Model for MAP4K4 and STRIPAK regulation of PKC and p-VASPS157 and its putative implication in filopodia formation.
Exploring potential direct substrates of MAP4K4, we found that both MAP4K4 and STRN3 depletion decreased the phosphorylation of VASPS157 (Figure 7c), an F-actin elongation promoting factor56,57. Phosphorylation of S157 enables VASP translocation to the plasma membrane at the leading edge of migrating cells58,59 and regulates anti-capping activity57. In bFGF-stimulated cells, VASP accumulated in the cortical cytoskeleton and the plasma membrane (Figure 7d), and in cells invading the brain tissue, we observed filopodia only in control but not in MAP4K4 or STRN3-depleted cells (Figure 7e). Consistently, depletion of MAP4K4 or STRN3 caused a robust reduction of bFGF-induced VASPS157 phosphorylation in cells seeded on collagen I matrix (Figure 7f). Under the same condition, VASPS157 phosphorylation is repressed by the MAP4K4 inhibitor GNE-595 in DAOY (Figure 7g) and HD-MBO3 cells (Figure 7h), supporting the notion that MAP4K4 directly phosphorylates this residue both under basal condition as well as in response to FGFR activation.
Taken together, these results identified VASPS157 phosphorylation as a novel effector mechanism of MAP4K4 and STRN3 downstream of FGFR signaling (Figure 7i).
Discussion
We found that MAP4K4 interacts with the STRIPAK complex in MB cells and revealed a dual function of the complex in growth and invasion control. An intact complex is necessary to maintain proliferation and to drive migration and invasion induced by FGFR signaling. Depletion of MAP4K4 shifts complex function towards increased clonal growth, increased YAP/TAZ target gene expression, increased tumor cell proliferation in the cerebellar tissue, and decreased invasiveness. Depletion of STRN3 repressed clonal growth, reduced YAP/TAZ target gene expression, and caused a significant reduction of tumor growth and invasion in the cerebellar tissue. We furthermore discovered a novel function of the MAP4K4-STRIPAK complex as a regulator of a set of migration and motility-associated effectors. These include novel PKCs, FAK, and VASP, which mechanistically link complex functions to cytoskeleton dynamics and cell motility. Thus, the MAP4K4-STRIPAK complex orchestrates signal transmission from activated RTKs either towards an invasion or a growth-promoting phenotype in MB.
The interaction of the STRIPAK complex with MAP4K4 we found in MB confirms previous findings describing direct interaction of STRIPAK with MST1/2, MST3/4, and MAP4Ks in other cell models35,39,43,44. In MB, MAP4K4 represses YAP/TAZ target gene induction and its depletion promotes colony formation and clonal growth, consistent with a canonical function of the STRIPAK complex37,38,51, where STRN3/4 block growth suppressing activities of MAP4K4 and additional kinases 48,49,60. From these findings, we conclude that MAP4K4 and STRN3 have opposing functions towards Hippo signaling in MB and that the STRIPAK complex exerts a growth promoting function by suppressing the activity of MAP4K4 specific to this context.
Parallel to antagonistic proliferation regulation of MAP4K4 and STRN3/4, we discovered that MAP4K4 and STRN3/4 display a co-operative function towards bFGF-induced invasion control. We identified AGC kinases and, in particular, novel PKCs (nPKCs), which are known promoters of tumorigenesis61, as downstream effectors of MAP4K-STRIPAK in invasion control, complementing previous reports of tumor invasion control by STRIPAK with mechanistic insight62,63. nPKC-driven invasion in MB may additionally involve the activation of adhesion and cytoskeleton-associated proteins like ezrin-radixin-moesin (ERM), β1D integrin, and focal adhesion kinase (FAK)64–68, the activity of latter we also found increased by bFGF in a MAP4K4 and STRN3/4-dependent manner.
Inhibition of PKCδ and PKCθ but not of classical PKCs caused robust blockade of FGFR-driven invasiveness. However, additional mechanisms of MAP4K-STRIPAK invasion regulation are likely. We consider the phosphorylation of VASPS157 particularly relevant because it couples STRIPAK function to VASP localization, cytoskeleton regulation, and cell migration57,58. We propose that MAP4K4-mediated VASPSer157 phosphorylation contributes to GF-induced MB cell motility and invasion by promoting filopodia formation. In support of this is our observation in previous studies9 and herein that tissue-invading MB tumor cells display bFGF-induced, filopodia-like protrusions and that loss of these filopodia-like protrusions is associated with reduced invasion. We found that MAP4K4 and STRN3 promote the activity of several AGC kinases that are implicated in VASPSer157 phosphorylation, like PKG and PKD169. VASP contributes to the etiology of prostate cancer, and VASPSer157 phosphorylation was recognized as a marker of metastatic progression70. VASPSer157 phosphorylation by STRIPAK-controlled MAP4K4 could have broad implications in controlling invasion and viability of MB cells in the brain tissue by providing signaling inputs from environment-sensing filopodia71,72. Growth cone turning and neuronal pathfinding depend on filopodia function73, whereby in particular low and high amplitude Ca2+ signaling is involved in environment sensing and filopodia signaling71. Consistent with MB cells possibly exploiting this feature of the developing nervous system, we detected a calcium-dependent kinase signature downstream of bFGF-induced MAP4K4-STRIPAK. Depletion of STRIP1 increased GF-induced migration in MB, perhaps by antagonizing MAP4K4 function. In support of this is an increase in MAP4K4 kinase activity signature after STRIP1 depletion, thus positioning STRIP1 as a negative regulator of MAP4K4-driven mesenchymal invasiveness in MB. We observed a rounded, filopodia-depleted morphology in cells devoid of STRN3 or of MAP4K4. STRIP1 has been associated with a contractile motility mode, supporting migration in confined, stiff spaces74. Rounded, blebbing motility may contribute to brain invasion, albeit at lower efficacy, and we previously observed a similar phenomenon in cells treated with the SRC-BCR/ABL inhibitor dasatinib, which represses mesenchymal migration75. This would explain why MAP4K4-depleted cells still display some invasiveness as MAP4K4 is mostly involved in mesenchymal migration in MB cells. Together, our data indicate that co-operation of MAP4K4 and STRN3/4 favors filopodia formation through the induction of Ca2+-activated kinases and the phosphorylation of VASPS157, which in concert with the previously identified regulation of ERM proteins and the Arp2/3 complex by MAP4K417,27,28, promote invasive motility in environments of variable complexity and stiffness.
In conclusion, we found that MAP4K4 exerts pro-invasive and anti-proliferative activities in MB cells and that STRIPAK complex components contribute to and modulate these MAP4K4 functions downstream of FGFR signaling. This dualism of MAP4K4 function in tumor cells provides an explanation why MAP4K4 inhibition alone is not sufficient to shrink tumor volume ex vivo, despite its anti-invasive activity. Remarkably however, co-depletion of MAP4K4 and STRN3 caused a near-complete eradication of the tumor cells and completely abrogated cell dissemination in vitro. These findings argue strongly for the development of STRN3 targeting strategies as therapeutic interventions to block MB cell proliferation and invasion. Peptide disruption of the STRN3-PP2A interaction has anti-tumor effects by impairing the phosphatase inactivation of the kinase in the complex and by activating the Hippo pathway50. However, PP2A inhibition repressed invasion in MB cells in a dose-dependent manner, indicating that STRIPAK-associated PP2A is rather unlikely to repress MAP4K4 pro-invasive activity and that co-targeting of MAP4K4 and STRN3 or of their common downstream effectors such as nPKCs, FAK and VASP could represent a successful strategy to impair both MB cell proliferation and spreading. Phosphorylation status of these proteins in patient samples may inform clinicians in the future about the potential susceptibility to therapies targeting this pathway.
Material and methods
Reagents
Protein phosphatase PP2A inhibitor LB-100 (S7537), PKC-θ inhibitor (S6577), Rottlerin (S7862), and Bisindolylmaleimide I (S7208) were purchased from Selleckchem, Houston, TX, USA. MAP4K4 inhibitor GNE-495 was kindly provided by Genentech Inc.76. EGF (100-47) and bFGF (100-18B) were purchased from PeproTech, London, UK. If not otherwise indicated, the cells were treated with growth factors at these concentrations: EGF: 30 ng/ml, bFGF: 100 ng/ml.
Cells and cell culture
DAOY human MB cells were purchased from the American Type Culture Collection (ATCC, Rockville, MD, USA) and cultured in Iscove’s Modified Dulbecco’s Medium (IMEM, Sigma). HD-MBO3 group 3 MB cells were generously provided by Till Milde (DKFZ, Germany) and cultured in RPMI medium (Sigma). Human embryonic kidney HEK-293T cells were cultured in Dulbecco’s modified Eagle’s medium (DMEM, Sigma). Cell culture media were supplemented with 10% fetal bovine serum (FBS, Sigma), 1% Penicillin-Streptomycin (ThermoFisher Scientific), and 1% GlutaMAX (Gibco). DAOY LA-EGFP and HD-MBO3 LA-EGFP cells were produced by lentiviral transduction of DAOY and HD-MBO3 cells with pLenti-LA-EGFP. The cells were maintained at 37°C in a humidified atmosphere containing 5% CO2. All cells were confirmed to be mycoplasma negative. Cell line authentication and cross-contamination testing were performed by Multiplexion by single nucleotide polymorphism (SNP) profiling.
Plasmids
Lentiviral constructs were ordered from VectorBuilder (Santa Clara, CA, USA). For BioID experiments, 3xFLAG-tagged BioID2 biotin ligase was fused to either the N-terminus (3xFLAG-BioID2-MAP4K4) or the C-terminus (MAP4K4-BioID2-3xFLAG) of human MAP4K4 cDNA (NM_145686.4). An extended flexible linker consisting of 13 repeats of GGGGS was inserted between MAP4K4 and the BioID2 ligase32. As negative controls, only BioID2-FLAG was used. Details of the vectors can be found at https://en.vectorbuilder.com/vector/VB180410-1463qqf.html (N-BioID-MAP4K4), https://en.vectorbuilder.com/vector/VB180410-1356dmp.html (C-BioID2-MAP4K4), and https://en.vectorbuilder.com/vector/VB180411-1121jky.html (BioID2-CTRL). See also Figure S1. For the analysis of MAP4K4 domains, we designed different constructs encoding 3xFLAG-tagged truncated versions of MAP4K4 cDNA (Figure 1j). Details of the vector can be found at: https://en.vectorbuilder.com/vector/VB190724-1021fsg.html (full-length MAP4K4), https://en.vectorbuilder.com/vector/VB190724-1072aza.html (ID1-ID2-CNH, residues 290-1273), https://en.vectorbuilder.com/vector/VB190724-1048drb.html (KD, residues 1-289), https://en.vectorbuilder.com/vector/VB190724-1089brg.html (KD-ID1-ID2, residues 1-954), https://en.vectorbuilder.com/vector/VB190724-1058sct.html (ID1, residues 290-634), and https://en.vectorbuilder.com/vector/VB190724-1062xrk.html (ID2, residues 635-954). All plasmids were verified by Sanger sequencing.
Mouse maintenance
Mouse protocols for organotypic brain slice culture were approved by the Veterinary Office of the Canton Zürich (Approvals ZH134/17, ZH116/20). Wild type C57BL/6JRj pregnant females were purchased from Janvier Labs and were kept in the animal facilities of the University of Zürich Laboratory Animal Center.
Immunoblotting (IB)
To analyze total cell lysates by immunoblot, 1 × 10⁵ DAOY wild type or 2.5 × 10⁵ HD-MBO3 cells were lysed using RIPA buffer supplemented with protease (Complete Mini, Roche) and phosphatase inhibitors (PhosSTOP, Roche) and cleared by centrifugation. Protein concentration was assessed using the Pierce BCA Protein Assay Kit (Thermo Fisher Scientific) according to the manufacturer’s instructions. Protein separation was performed on Mini-Protean TGX (4-15% or 4-20%) SDS-PAGE gel (Bio-Rad) and transferred to PVDF membranes (Bio-Rad). After 1 h of blocking with 5% non-fat milk, membranes were probed with primary antibodies listed in Supplementary material (Table 1). GAPDH or β-tubulin were used as internal loading control. HRP-linked secondary antibodies (1:5000) were used to detect the primary antibodies. Chemiluminescence detection was carried out using ChemiDoc Touch Gel and Western Blot imaging system (Bio-Rad). The integrated density of immuno-reactive bands was quantified using ImageJ (National Institutes of Health, USA).
To assess VASP S157 phosphorylation, the cells were seeded on a collagen-coated plate and starved for 16 h before treatment with growth factor and inhibitors. Protein extraction was performed by directly incubating the cells with a lysis buffer containing 2.5% SDS and 125 mM Tris-HCl (pH 6.8) at 95°C for 5 minutes. The lysates were resolved by SDS-PAGE and analyzed by IB as described above.
Biotin-streptavidin affinity purification
The protocol for isolating proteins biotinylated by biotin ligase was adapted from the BioID method 32,34. For proximity-labeling experiments with HEK-293T, 7 × 10⁶ cells were transiently transfected with N-BioID2-M4K4, C-BioID2-M4K4, or BioID2-CTRL plasmids using jetPRIME reagent (Polyplus Transfection) according to manufacturers’ instructions. Non-transfected WT HEK-293T cells were used as a negative control (to exclude biotin-independent binders). Twenty-four hours after the transfection, the cells were incubated with 50 μM biotin for 16 h. For proximity-labeling experiments with DAOY MB cells, we generated cells stably transfected with N-BioID2-M4K4, C-BioID2-M4K4, or BioID2-CTRL lentivirus. 5 × 10⁶ cells were incubated with biotin as above. Parental WT DAOY cells were used as a negative control. After 16 h of biotin incubation and two PBS washes, the cells were lysed at 4°C with 1 ml of lysis buffer containing 50 mM Tris-HCl (pH 7.5), 150 nM NaCl, 1 mM EDTA, 1 mM EGTA, 1% Triton X-100, 0.1% SDS and protease inhibitor tablet (Roche). The protein concentrations were normalized among the samples. Two mg of protein samples were incubated with 75 μl of pre-equilibrated Dynabeads MyOne Streptavidin T1 magnetic beads (65602, Thermo Fisher Scientific) in low-binding Eppendorf tubes. The mixtures were incubated for 3 h at 4 °C with end-over-end rotation. The beads were collected using a magnetic rack and washed twice with lysis buffer and twice with 50 mM ammonium bicarbonate (pH 8.3). 10% of the streptavidin-conjugated beads were used for immunoblotting. Proteins were eluted by heating the beads at 95°C for 5 min in Laemmli Sample Buffer (1610747, Bio-Rad) with 50 mM DTT followed by magnetic separation. The remaining beads with bound proteins were transferred to a fresh centrifuge tube, resuspend in 150 μl of 50 mM ammonium bicarbonate, and used for MS analysis. For each condition, three biological replicates were performed and analyzed by MS.
Mass spectrometry (MS)
Tryptic digestion of proteins isolated by streptavidin pull-down was performed based on the protocol described in33. Data acquisition was performed by the Functional Genomics Center Zurich (FGCZ). In brief, 50 μl of 8 M urea were added to 150 μl of bead-protein suspensions in 50 mM ammonium bicarbonate (pH 8.3). Beads were reduced by adding 4 μl of 100 mM Tris (2-carboxyethyl) phosphine (TCEP), alkylated with 4 μl of 500 mM chloroacetamide (CAA) and incubated at 30°C for 1 h in the dark using an Eppendorf Thermomixer at 700 rpm. Sample volume was adjusted by adding 200 μl of digest buffer (10 mM Tris-HCl, 2 mM CaCl2, pH 8.2) to dilute the 8 M urea to 1 M before trypsin digestion. The mixture was treated with 1 μg/sample trypsin and incubated for overnight digestion in the dark at 30°C using an Eppendorf Thermomixer at 1000 rpm. The supernatant was collected in a fresh Eppendorf tube after magnetic separation of the beads. The beads were washed twice with 100 μl 10 mM Tris-HCl pH 8.2/10% acetonitrile. These washes were pooled with the first eluate and acidified with 60 μl 5% trifluoroacetic acid (TFA). The Samples were desalted on SepPack C18 (Thermo Fisher Scientific), dried, and dissolved in 20 μl 0.1% formic acid. The samples were diluted 10-fold and transferred to autosampler vials for liquid chromatography-tandem mass spectrometry (LC-MS/MS). 2 μl of samples were injected. LC-MS/MS analysis was performed on an Orbitrap Fusion Tribrid Mass Spectrometer (Thermo Fisher Scientific). Peptides were separated by Easy Nano LC 1000 liquid chromatography (Thermo Fisher Scientific) at 0.3 ml/min flow rate interfaced to EASY-Spray Source (Thermo Fisher Scientific). A trap column (Acclaim PepMap 100 C18) and an analytical column (EASY-Spray C18) were used for separation. Peptides were eluted using an acetonitrile gradient.
Proteomic data analysis
The MS/MS raw data of three biological replicates were combined and searched against a SwissProt database with Homo sapiens taxonomy using Mascot (version 2.6.2, London, UK), with a parent ion tolerance of 10 ppm and a fragment ion mass tolerance of 0.030 Da. The database was also expanded with frequently observed contaminants, such as bovine serum albumin, trypsin, and keratins carbamidomethylation of cysteine residues (C) was specified as a fixed modification and oxidation of methionine (M) was set as a variable modification. Scaffold (version 4.8.9, Proteome Software Inc., Portland, OR) was used to validate MS/MS-based peptide and protein identifications. 1% and 0.1% false discovery rate (FDR) cutoff on peptide and protein, respectively, was used to control for false identifications. Protein identifications were accepted if they contained at least 2 identified peptides per protein. Proteins that contained similar peptides and could not be differentiated based on MS/MS analysis alone were grouped to satisfy the principles of parsimony. Proteins sharing significant peptide evidence were grouped into clusters. Proteins detected in the parental control samples (WT cells lacking BioID2 expression) were subtracted from the results. The significance of enrichment was tested using a two-tailed student’s t-test with equal variances. Hits were considered significantly enriched in MAP4K4-BioID2 cells compared the unspecific background (BioID2-CTRL) if they had > 2-fold enrichment and p-values < 0.05. Gene ontology (GO) enrichment analysis of MAP4K4-interacting partners was performed using Metascape (http://metascape.org/) 77.
Co-immunoprecipitation (Co-IP)
2.5 × 10⁶ DAOY or 3.5 × 10⁶ HEK-293T cells were lysed at 4°C with 400 μl of buffer containing 50 mM Tris-HCl (pH 7.5), 150 nM NaCl, 0.3% NP-40 with protease and phosphatase inhibitor cocktail. Lysates were cleared by centrifugation, and protein concentrations were normalized among the samples. For immunoprecipitation, 30 μl of Dynabeads Protein G magnetic beads (10004D, Thermo Fisher Scientific) were coated with 3 μg of anti-FLAG antibody by resuspending them in 60 μl PBS containing 0.02% Tween-20 (P1379, Sigma), and rotated for 45 min at 4°C. 1 mg of protein samples was incubated with the antibody-coated Dynabeads for 3h at 4 °C with end-over-end rotation. The beads were washed four times with TBS buffer (50 mM Tris-HCl pH 7.4, 150 mM NaCl). The proteins were eluted by incubating the beads with 35 μl 100 µg/ml 3xFLAG-Peptide (F4799, Sigma Aldrich) at room temperature for 20 min or by adding Laemmli Sample Buffer (1610747, Bio-Rad) containing 50 mM DTT and denaturation at 95°C for 5 min. The beads were then magnetically separated from the eluates and the samples analyzed by IB as described above.
Immunofluorescence analysis (IFA)
To visualize MAP4K4-BioID2 proteins, stably transduced DAOY cells were plated on glass coverslips and incubated with 50 μM biotin for 16 h. The cells were fixed and permeabilized as described in78. The fixed cells were incubated with Streptavidin Alexa Fluor 594 conjugate (Invitrogen) for 1.5 h at RT, followed by incubation with primary antibodies overnight at 4°C. Secondary antibodies were incubated for 2 h at RT.
For VASP localization analysis, 2000 LA-EGFP DAOY cells were seeded in a 384 well plate (781090, Greiner Bio-One) coated overnight with 0.07 μg/μl collagen I (5005-B, Cell systems) diluted in 70% EtOH. After seeding, the cells were starved for 16 h and treated with 100 ng/ml bFGF for 15 min. Cells were fixed and incubated with primary and secondary antibodies as described above.
Imaging acquisition was performed using an SP8 confocal microscope (Leica). The list of the primary and secondary antibodies used is provided in Supplementary material (Table 1).
Lentivirus Production and Transduction
Lentiviral particles were produced by transfection of HEK-293T cells with transfer plasmids, psPAX2 (#12260, Addgene) and pCMV-VSV-G plasmids (#8454, Addgene)79 in a ratio of 5:3:2 using polyethylenimine (24765-2, Polysciences). Virus supernatant was harvested 30 h after transfection, filtered, and concentrated using Amicon Ultra 15 ml Centrifugal Filters (Millipore). For the transduction, human MB cells were incubated for 24 hours with supernatant containing the viral particles and 8 µg/ml polybrene. Two days after transduction, cells were selected with puromycin (DAOY: 2 µg/ml, HD-MBO3: 1 µg/ml).
Generation of CRISPR/Cas9-mediated knockout cells
Gene-specific single-guide RNA (sgRNAs) were designed using the online design tool at https://design.synthego.com. Only highly specific target sites were selected, and the respective sequences are listed in Supplementary material (Table 2). Oligonucleotides specific for the target sites were synthesized with BsmBI restriction site overhangs by Microsynth (Balgach, Switzerland) and cloned into the LentiCRISPRv2 transfer plasmid (Addgene plasmid #52961) with a single tube restriction and ligation method as described in80. Production of lentiviral vectors and cell transduction was performed as described above. The efficiency of the knockouts was tested by immunoblot.
RNA interference
DAOY cells at approximately 70% confluency were transfected with DharmaFECT Transfection Reagent 4 (T-2004-03, Dharmacon) or Lipofectamine RNAiMAX Transfection Reagent (13778075, Thermo Fisher Scientific) with 10 nM siRNAs following the manufacturer’s instruction. The list of the siRNA used is provided in Supplementary material (Table 3). Non-Targeting Control siRNA (siCTRL, D-001210-02-05, Dharmacon) was used as a negative control for siRNA transfection. After 48 or 72 hours, RNA and proteins were isolated from the cells to determine gene expression by qRT-PCR and to evaluate protein expression by IB. For SIA, the cells were re-seeded to form spheroids in ultra-low adhesion plates 24 h after the transfection.
RNA extraction and quantitative Real-Time PCR (qRT-PCR)
Total RNA was isolated from cells with the RNeasy mini kit (74106, Qiagen). cDNA was obtained by retro-transcription of 1 μg total RNA using High-capacity cDNA Reverse Transcription Kit (4368813, Applied Biosystems). qRT-PCR was performed using PowerUp Syber Green (A25776, Thermo Scientific) under conditions optimized for the 7900HT Fast Real-Time PCR System (Applied Biosystems). The primers used were synthesized by Microsynth AG (Balgach, Switzerland). Primer sequences are detailed in Supplementary material (Table 4). The relative expression levels of each gene of interest were calculated using the 2-ΔΔCt method normalized to 18s.
Spheroid invasion assay (SIA)
SIA was performed and quantified according to42. In brief: 2500 cells/100 μl per well were seeded in cell-repellent 96 well microplates (650970, Greiner Bio-One, Kremsmünster, Austria). The cells were incubated at 37°C for 24 h to form spheroids. 70 µl medium was removed and replaced with 70 µl of a solution containing 2.5% bovine collagen I (CellSystems, Troisdorf, Germany). Polymerized collagen I hydrogels were overlaid with 100 µl of serum-free media containing growth factors and/or inhibitors 2x concentrated. The cells were allowed to invade the collagen matrix for 24 h, after which they were stained with Hoechst (1:2000, B2883, Sigma Aldrich) for 3-4 h. Images were acquired with an AxioObserver 2 mot plus fluorescence microscope (Zeiss, Munich, Germany) or with an Operetta high-content imaging system (PerkinElmer) at 5x magnification. When acquired with the Operetta microscope, the spheroids were localized in the well by acquiring 3 z-planes with 250 µm z-spacing, re-scanned by acquiring 16 z-planes with 25 µm z-spacing and a maximum intensity projection was computed and used for further analysis. Cell invasion was determined as the sum of the distance invaded by the cells from the center of the spheroid as quantified using an automated cell dissemination counter (aCDc)42 or using Harmony 4.5 software (PerkinElmer).
Colony formation assay
DAOY (400 cells/well) or HD-MBO3 (600 cells/well) cells were seeded in a 6-well plate in complete growth medium containing 10% FBS. The cells were allowed to adhere for 48 h, and the medium was replaced with fresh growth medium containing 1% FBS ± GF. The cells were cultured at 37°C for 10 days (DAOY) or 15 days (HD-MBO3) with medium changes every third or fourth day. The colonies were fixed in methanol for 10 min at −20°C and then stained with 0.5% crystal violet for 15 min. The number and the area of the colonies were quantified by ImageJ using the plugin colony area.
CellTox green cytotoxicity assay
Cytotoxicity was determined using the CellTox™ Green Cytotoxicity Assay (G8742, Promega, Dübendorf, Switzerland), according to manufacturer’s instructions. 2500 DAOY cells were seeded in 100 µl per well of complete medium in 96-well Corning black wall microplates with clear round bottom (Corning Incorporated, NY, USA). The cells were incubated at 37°C for 24 h to form spheroids. 50 µl of the medium were then removed from each well and replaced with 50 µL of fresh medium containing 1:500 of CellTox™ Green Dye and different drug concentrations. Wells with medium but without cells were used to measure background fluorescence. The fluorescence representing nonviable cell was measured after 24, 48, and 72 h of incubation using Cytation 3 imaging reader (BioTek, Sursee, Switzerland) at Ex/Em 485/520 nm.
Ex vivo organotypic cerebellum slice culture (OCSC)
Cerebellar slices were prepared from P8-10 C57BL/6JRj mouse pups as described in47. Slices were kept in culture for 15 days. Medium was changed daily, and cultures monitored for signs of cell death. Tumor spheroids from DAOY or HD-MBO3 LA-EGFP cells were used. For DAOY cells, the cells were re-seeded to form spheroids in ultra-low adhesion plate 24 h after transfection with siRNA and implanted on the slices 48 h after transfection. The slice-spheroid co-cultures were treated with EGF (30 ng/ml) or bFGF (12.5 ng/ml) where indicated for 2 days (DAOY) or 5 days (HD-MBO3). Following the treatment, the co-cultures were fixed and stained for calbindin, GFAP, or anti-human nuclei, as described in47, and analyzed using IFA. To evaluate the extent of proliferation both in the tumor cells and in the slice culture, we performed 5-ethynyl-2′-deoxyuridine (EdU) staining using the Click-iT EdU Alexa Fluor 647 imaging kit (C10340, Invitrogen). Four-color image acquisition was performed on an SP8 confocal microscope (Leica). The perimeter and the area of the infiltrating spheroids, and the number of EdU-positive nuclei were measured using ImageJ.
Patient gene expression and proteomic data
Gene expression and proteomic data of pediatric brain tumor patients were obtained from the ProTrack data portal (http://pbt.cptac-data-view.org/) from the Clinical Proteomic Tumor Analysis Consortium (CPTAC) and the Children’s Brain Tumor Tissue Consortium (CBTTC). The dataset used includes a cohort of 218 tumor samples representing seven distinct histological diagnoses, including medulloblastoma (MB), low-grade glioma (LGG), high-grade glioma (HGG), ependymoma (EP), craniopharyngioma (CP), ganglioglioma (GG), and atypical teratoid rhabdoid tumor (ATRT)41.
Protein kinase activity profiling
4.5 × 10⁵ DAOY cells were transfected with siRNA as described above. 72 h after the transfection and O/N starvation, cells were stimulated with 100 ng/ml bFGF for 15 minutes and lysed in M-PER protein extraction reagent (Thermo Fischer Scientific) supplemented with Halt Phosphatase Inhibitor Cocktail and Halt Protease Inhibitor Cocktail EDTA free (Thermo Fischer Scientific). Lysates were cleared by centrifugation, and protein concentrations were determined by Pierce BCA Protein Assay Kit (Thermo Fisher Scientific). Aliquots of 1 mg/ml of lysates were prepared and snap-frozen in liquid nitrogen. Kinase activity profiles were performed using the PamChip® serine/threonine (STK) and protein tyrosine (PTK) peptide microarray system from PamGene (‘s-Hertogenbosch, The Netherlands), according to standard manufacturer’s instructions. The PamChip® consists of 4 identical peptide arrays, each array containing 144 (STK) or 196 (PTK) peptides. The technology measures the phosphorylation of the arrayed STK and PTK peptides and compares derived peptide phosphorylation signatures to known consensus signatures of kinases to predict kinase activities. Three PamChip® microarrays were processed at the same time on the PamStation®12 (PamGene). One and five µg of protein extract were used for the STK array and the PTK array protocol, respectively, and the enzymatic assay was started by adding ATP (final concentration 100 μM). For the PTK array, fluorescein isothiocyanate (FITC)–labeled pY20 antibody was incubated on the chip, and the phosphorylation of the individual Tyr peptides was followed by fluorescence detection in real-time. For the STK array, the primary antibody mixture was incubated with the chip, and the secondary FITC-conjugated antibody was used to quantify the signal. For each condition, three biological replicates were performed and analyzed in three different runs.
Software and data analysis
The fluorescent signal intensity for each peptide on the PamChip® was quantitated by BioNavigator software (PamGene) and represented as linear regression slope as a function of exposure time. A local background correction was used per spot. Nominal CV (Coefficient of variation) was calculated per peptide with a 2-component error fit model, using the overall mean as input. Only peptides that showed nominal CV <0.5 were included in the analysis. Additionally, Combat correction/normalization was performed to correct for differences in batch effects. After averaging signal intensities across the 3 biological replicates per condition, the signal ratio between siTarget and siCTRL was used to calculate fold change (FC) values. Peptides with a fold change of at least 35% (i.e., FC > 1.35 or FC < 0.65) were considered differentially phosphorylated. To generate the peptide phosphorylation heatmap and compare the global phosphorylation levels, the linear regression slope of each peptide was log2 transformed. Peptides differently phosphorylated (p < 0.1) in siTarget vs. siCTRL were identified by ANOVA and postHoc Dunnett’s tests. Venn diagram analyses were performed in Venny 2.1 (https://bioinfogp.cnb.csic.es/tools/venny/). An upstream kinase prediction tool based on the PamApp on BioNavigator Analysis software was used to generate a putative list of kinases responsible for phosphorylating the phosphosites on the PamChip. The prediction of the differentially activated upstream kinases for each experimental group (siTarget vs. siCTRL, or bFGF vs. UT) is carried out by a comparison of the phosphorylation sites of the peptides on the array with databases containing experimental and literature-based protein modifications such as HPRD, PhosphoELM (http://phospho.elm.eu.org), PhosphoSite Plus (https://www.phosphosite.org), Reactome (http://reactome.org), UNIPROT (http://www.uniprot.org/) and in silico computational predictions database such as PhosphoNet (http://www.phosphonet.ca/). The prediction tool functional rank-orders the top kinases differentially activated between two compared groups. The mean kinase statistic represents the difference in the predicted protein kinase activity between the two compared groups. A positive value indicates an activation, while a negative value an inhibition. The specificity score indicates the specificity of the normalized kinase statistics with respect to the number of peptides used for predicting the corresponding kinase. The higher the specificity score, the higher is the power of the prediction. Values of the specificity score >0.9 were considered as statistically relevant. To group the kinases into sequence families, phylogenetic trees were created using the web-based kinome tool CORAL(http://phanstiel-lab.med.unc.edu/CORAL/).
Statistical analysis
Statistical analyses were performed using GraphPad Prism 8 software (San Diego, California). Statistical significance of differences between groups was determined using Student’s t-test (unpaired, two-tailed) or one-way ANOVA repeated-measures test with Bonferroni’s correction. The experiments were performed in at least three independent biological replicates (n=3) unless differently indicated, and results are shown as mean ± standard deviation (SD) or standard error of the mean (SEM). The results were considered significant when p < 0.05 (*p ≤ 0.05, ** p ≤ 0.01, *** p ≤ 0.001, **** p ≤ 0.0001). Where indicated, asterisks show statistical significances between control and test sample.
Author contributions
J.M. contributed to designing the study, planned and conducted all the experiments, prepared the figures, and wrote the manuscript. B.S. generated DAOY cells stably expressing different MAP4K4 domains. C.C. provided experimental support for image acquisition and quantification with the Operetta microscope. M.G. helped to draft the study. M.B. designed the study and wrote the manuscript.
Acknowledgments
The authors thank Dr. Savithri Rangarajan (PamGene International) for scientific support and analysis of PamChip imaging data and Dr. Jens Sobek (Functional Genomics Center Zurich) for assistance with the experiments performed on PamStation®12. We would like to thank members of the Functional Genomics Center Zurich for mass spectrometry support. Imaging was performed with equipment maintained by the Centre for Microscopy and Image Analysis, University of Zurich. This study was supported by grants from the Swiss National Science foundation (SNF_31003A_165860/1, SNF_310030_188793) and the Swiss Cancer League (SCL_KLS-3834-02-2016) to MB, the University of Zürich (Candoc) to J.M. and from the Childhood Cancer Foundation to MG.
Footnotes
↵* e-mail: Martin.Baumgartner{at}kispi.uzh.ch
References
- 1.↵
- 2.↵
- 3.
- 4.↵
- 5.↵
- 6.
- 7.↵
- 8.↵
- 9.↵
- 10.↵
- 11.↵
- 12.↵
- 13.↵
- 14.
- 15.↵
- 16.↵
- 17.↵
- 18.↵
- 19.↵
- 20.↵
- 21.↵
- 22.
- 23.
- 24.
- 25.
- 26.↵
- 27.↵
- 28.↵
- 29.↵
- 30.
- 31.↵
- 32.↵
- 33.↵
- 34.↵
- 35.↵
- 36.↵
- 37.↵
- 38.↵
- 39.↵
- 40.↵
- 41.↵
- 42.↵
- 43.↵
- 44.↵
- 45.↵
- 46.↵
- 47.↵
- 48.↵
- 49.↵
- 50.↵
- 51.↵
- 52.↵
- 53.↵
- 54.↵
- 55.↵
- 56.↵
- 57.↵
- 58.↵
- 59.↵
- 60.↵
- 61.↵
- 62.↵
- 63.↵
- 64.↵
- 65.
- 66.
- 67.
- 68.↵
- 69.↵
- 70.↵
- 71.↵
- 72.↵
- 73.↵
- 74.↵
- 75.↵
- 76.↵
- 77.↵
- 78.↵
- 79.↵
- 80.↵
- 81.↵
- 82.


