

Abstract
Strikingly elaborate weapons and displays are widespread features of male contests for mates across the animal kingdom. Male combat is familiar to students of behavior, and yet while we understand how female mate choice results in a runaway process, how such evolutionary extremes arise from male-male competition is unclear. In a quantitative genetic model of sexual selection for a male signaling trait that mediates aggression in male-male contests, we show that an honest indicator of aggression can generate selection on itself by altering the social environment. This can cause selection to accelerate as the trait is elaborated, which can ultimately lead to runaway evolution. Thus, the key unifying feature of runaway sexual selection driven by either male-male competition or female mate choice is an evolving source of selection provided by the social environment. Our model identifies simple conditions generating runaway evolution and provides clear, testable predictions for empirical studies.
INTRODUCTION
Darwin’s (1859, 1871) theory of sexual selection suggested that exaggerated, spectacular, and bizarre structures and behaviors found in males of many species evolve either because they enhance success in contests between males for access to females or because they are preferred by females when choosing mates. The suggestion that male-male competition is common was relatively uncontroversial; as Darwin (1871) wrote, “It is certain that amongst almost all animals there is a struggle between the males for the possession of the female. This fact is so notorious that it would be superfluous to give examples.” In contrast, the ability of females to influence evolution through choice of partners was almost immediately questioned and continued to be controversial for decades after Darwin (Wallace 1889; Huxley 1938). However, theoretical models of evolution via female choice (Lande 1981; Kirkpatrick 1982; Mead & Arnold 2004) and empirical research documenting female preference in nature (Andersson 1982, 1994; Rosenthal 2017) eventually led to mate choice becoming the dominant paradigm in studies of sexual selection. The development of formal mathematical models showing that male traits and female preferences can coevolve in self-reinforcing fashion, an idea first proposed by Fisher (1915, 1930), was particularly crucial to the acceptance of mate choice as an important evolutionary mechanism. The key component of the Fisher process is that female preference and a preferred male trait become genetically correlated. This can cause sexually selected male traits to evolve at ever-increasing speed, a pattern that has been referred to as an evolutionary “runaway” (Fisher 1930; Lande 1981; Bailey & Moore 2012) because the social environment evolves with the male trait influencing the social outcome.
Despite the current bias towards studies focused on mate choice, Darwin was not wrong about male-male competition. Members of entire taxa are characterized by highly modified sexually dimorphic structures that function only in male contests (e.g., Dermaptera, Briceño & Eberhard 1995). Weapons can evolve to be massive and create real functional constraints for the males that bear them, and such bizarrely elaborate and diverse structures associated with duels are indeed found across the animal kingdom (Emlen 2008, 2014; McCullough et al. 2016; O’Brien et al. 2018). In fact, male-male competition remains a more common source of selection shaping male traits that influence mating success, and traits expressed in male-male interactions can be as elaborate as those that are the target of female preferences (Darwin 1871; Huxley 1938; Andersson 1994; Moore & Moore 2006; Emlen 2008, 2014; McCullough et al. 2016; O’Brien et al. 2018). However, we still lack robust genetic models that may be used to generate testable predictions for the evolution of sexually selected traits via male-male competition. Notably, the potential for male-male competition to result in a runaway process that drives extreme trait elaboration remains unresolved.
Many elaborate male traits used in male-male contests, such as showy plumage (Hagelin 2002), color (Seehausen & Schluter 2004), pheromones (Moore et al. 1997b), and structures such as antlers (Wilkinson & Dodson 1997), horns (Emlen et al. 2005), forceps (Briceño & Eberhard 1995), and claws (Sneddon et al. 1997) function as signals that may provide information about some underlying qualities of the individuals, such as the willingness or ability to fight (Parker 1974; Maynard Smith & Harper 1988; Maynard Smith & Harper 2003; Emlen 2008, 2014). For example, there is often a positive association between signals or weapons and other traits such as body size (McCullough et al. 2016; O’Brien et al. 2018), making the signal or weapon an honest indicator of potential threat to an opponent. As such, males are expected to adaptively modulate their behavior in response to these signaling traits, escalating contests they are more likely to win and withdrawing from ones they are more likely to lose. Because the effect of signaling traits inherently depends on social context, such traits serve as both targets and sources of selection, potentially leading to self-reinforcing and accelerating selection as occurs in the runaway process driven by female preference (Lande 1981; Bailey & Kölliker 2019). However, despite insights from optimality models (Parker 1974; Maynard Smith & Brown 1986; Maynard Smith & Harper 1988; Maynard Smith & Harper 2003; Rutte et al. 2006), how this fundamental feature of extreme elaboration—an evolving source of selection—may arise within male-male contests is unclear.
Here, we utilize a framework that explicitly incorporates socially contingent trait expression and fitness (Moore et al. 1997a; Wolf et al. 1999; McGlothlin et al. 2010) to model trait evolution arising from male-male competition. We show that when honest signals are used to modulate the behavior of competitors, male-male competition leads to evolutionary elaboration of male traits. We identify the necessary and sufficient conditions for trait elaboration to become a runaway process and outline predictions that can be empirically tested to evaluate this scenario in natural systems. We show that sexual selection by male-male competition can have features that are analogous to those of runaway sexual selection by female choice; just as in female mate choice, the social environment in male-male contests may generate a self-reinforcing source of selection on the traits that mediate the interaction, potentially leading to self-sustaining and escalating selection.
MODEL
To capture the influence of the social environment in a model of male-male competition, we assume that individuals adjust their behavior in response to the signaling trait values of their social partners, an assumption that is supported empirically and theoretically (Parker 1974; West-Eberhard 1979; Maynard Smith 1982; West-Eberhard 1983, 1984; Moore et al. 1997a; West-Eberhard 2003; O’Brien et al. 2018; Tinghitella et al. 2018; Rico-Guevara & Hurme 2019; Wiens & Tuschhoff 2020). Because the social context (i.e., the social environment) is constructed from traits of conspecifics, this flexible response to social context provides the opportunity for indirect genetic effects (Moore et al. 1997a), which allow the social environment itself to evolve (Moore et al. 2002; Wolf 2003; Bijma & Wade 2008; McGlothlin et al. 2010). Evolutionary changes in the social environment can lead to concerted evolution because the social environment can be a source of selection on the traits that themselves compose the social environment (West-Eberhard 1979; Wolf et al. 1999; Bailey & Kölliker 2019; Araya-Ajoy et al. 2020; McGlothlin et al. 2021). Such “social selection” (West-Eberhard 1979, 1983, 1984; Wolf et al. 1999; Bijma & Wade 2008; McGlothlin et al. 2010) is expected to arise whenever traits act as both the agents and the targets of selection.
We assume that males use a trait (designated by the subscript S) to assess some underlying potential threat of their opponents in social contests. Such a trait can be a weapon or display that is used as a signal. Possible examples include traits such as a plumage badges, exaggerated weapons, or vocal or chemical signals. Elaboration of the signal may consist of an increase in size or complexity, although for heuristic simplicity, we discuss the evolution of increased signal size. Males also vary in the underlying quality trait that represents an index of their fighting ability or some other aspect of their phenotype that determines the threat they represent to their opponent in a contest. We describe this trait as body size (designated by the subscript B) for simplicity. As such, the signal may be genetically correlated to body size, providing a degree of signal honesty. Males respond to the assessment of the signal by modulating their behavior toward their opponent (“aggression,” designated by the subscript A) within the contest because the signal provides information on the quality of their opponent, and hence provides information on the likelihood that they would win an escalated contest (see below).
We assume that both signal size (ZS) and body size (ZB) are normally distributed metric traits influenced by many loci of small effect. Expression of these traits can be partitioned into heritable additive genetic effects (denoted aS and aB) and general non-heritable (environmental and nonadditive genetic) effects (denoted eS and eB). We assume that neither signal nor body size changes as a result of the social interaction. An individual’s total phenotypic value for each trait is then described by a simple sum of the heritable and non-heritable components, or
 where ai is normally distributed with mean
  and variance Gii and ei is normally distributed with mean 0 and variance Eii. We make the standard quantitative genetic assumption that heritable and non-heritable components are uncorrelated. We assume that signal may be genetically correlated to body size, providing a degree of signal honesty, which is quantified by the covariance between signal size and body size (GSB).
For simplicity, we model the outcome of pairwise duels between males drawn at random from the population. Our model is easily generalized to include multiple interactions between males (Appendix). We assume that aggressive behavior (ZA) in these male-male contests is context dependent and influenced by the relative signal size of the competing males, as suggested by West-Eberhard (1979, 1983, 1984). This assumption is well supported by optimality models and empirical studies (Huxley 1938; Parker 1974; Riechert 1984; Sneddon et al. 1997; Maynard Smith & Harper 2003; Emlen 2008, 2014). The phenotypic value of aggression can thus be written as
 where aA and eA represent standard additive genetic and uncorrelated non-heritable components, respectively, ZS is the signal of the focal individual,
  is the signal of the focal individual’s opponent. Here and elsewhere, terms with primes indicate a value assigned to the focal individual’s opponent. The coefficient δAS measures the influence of the difference in signal size on the expression of aggressive behavior. Thus, δAS is analogous to the ψ term in standard interacting phenotype models (Moore et al. 1997a), but differs because it depends upon the value of an interactant’s phenotype relative to the focal individual. Because signal size is heritable, the third term in Eq. 2 includes both a modification of the direct genetic effect (δASaS) and an indirect genetic effect
  , which is defined as the effect of a social interactant’s genes on the expression of a focal individual’s phenotype (Moore et al. 1997a). We describe the relationship between this model and the standard model of indirect genetic effects in the Appendix.
Because it is conditional and adjusted depending on the social context, the underlying additive genetic value of aggression is assumed to be uncorrelated to both signal size and body size (GSA = G BA = 0). However, the conditional expression of aggression leads males with larger signals and/or larger body size to be more aggressive on average (and vice versa). This can be viewed as the individual with the larger signal being more willing to escalate an encounter, while the individual with the smaller signal tends to retreat from the interaction.
Selection imposed by male-male competition
In social interactions, associations between traits and fitness may cause selection via two pathways, nonsocial selection (quantified by the gradient βN), which arises from effects of a focal individual’s traits on its own fitness, and social selection (quantified by the gradient βS), which arises from the effects of an opponent’s traits on the fitness of a focal individual (Wolf et al. 1999). When both are present, individual relative fitness can be written as
 where w0 is an intercept, z and z′ are column vectors of focal and opponent traits, βN and βS are vectors of nonsocial and social selection gradients, ε is an uncorrelated error term, and the superscript T denotes transposition (Wolf et al. 1999). Expressing relative fitness using Eq. 3 has two distinct advantages. First, selection gradients can be estimated in natural populations using multiple regression (Lande & Arnold 1983; Wolf et al. 1999; Formica et al. 2011; Fisher & Pruitt 2019), allowing our model to generate testable predictions. Second, selection gradients can be combined with genetic parameters to predict short-term evolutionary response to selection (Lande & Arnold 1983; Bijma & Wade 2008; McGlothlin et al. 2010).
While Eq. 3 provides a general framework for capturing sources of selection, to understand the origin and properties (i.e., the magnitude and direction) of these selection gradients, we can use evolutionary game theory to write a mechanistic expression for relative fitness based on the costs and benefits arising from male-male contests with signaling,
 where terms including b represent fitness benefits and terms including c represent fitness costs. In Eq. 4, the benefit term and the first cost term derive from the hawk-dove model of evolutionary game theory (Maynard Smith & Price 1973; Maynard Smith 1982; McGlothlin et al. 2021). The coefficient bA is the fitness benefit of winning a contest, which we assume derives from greater access to females. In a contest, access to females is determined by a focal individual’s aggression relative to its opponent. Multiplying bA by
  reflects the fact that the probability of winning a contest increases as a male becomes increasingly more aggressive than its opponent. The term
  is the fitness cost of aggression associated with escalation of encounters. Logically, an individual pays a cost for acting aggressive that depends on the level of aggression shown by its opponent. A second fitness cost
  reflects the fact that the fitness impact of aggression by an opponent
  depends on the size of the opponent
  . This cost, which we call the threat of the opponent, derives from the fact that larger males impose a greater risk of harm by being aggressive than do smaller males. Finally, we assume that a third cost
  arises from natural selection favoring some optimal trait value (θS), which therefore will oppose signal elaboration. Following a Gaussian model of selection (Lande 1976, 1979), natural selection against elaborate signals becomes stronger as the population mean of the signal
  becomes further away from its naturally selected optimum (θS). Although we do not do so here, this term could be replaced with a multivariate Gaussian term (Lande 1979) to add naturally selected optima for aggression and body size.
Because selection gradients are equivalent to partial regression slopes, we can use partial derivatives of Eq. 4 with respect to focal and opponent traits (evaluated at the population mean) to calculate nonsocial and social selection gradients (McGlothlin et al. 2021). Taking these derivatives, we find nonsocial selection gradients for each trait to be


 and social selection gradients to be


 In other words, males with large signals are selected against via nonsocial selection but interacting with such males does not directly impose social selection. Body size is not under direct nonsocial selection but imposes a fitness cost via social selection that increases with the population mean of aggression. Nonsocial selection favors aggression until the benefits of aggression are outweighed by the costs, while social selection imposed by opponent aggression is always negative, representing a net fitness cost. This gradient becomes increasingly negative as the population mean aggression and body size increase. These selection gradients suggest that signal size itself experiences no direct sexual selection. If signal size increases, it must do so as an indirect response to selection on a correlated trait.
Evolutionary response to selection
Selection within a generation is translated into an evolutionary response across generations through the association between the phenotype, upon which selection acts, and the genotype, which contributes to the inheritance of the traits across generations. In quantitative genetics, this genotype-phenotype relationship is most often summarized by the additive genetic variance, which is used to predict evolutionary response to selection across generations (Lande & Arnold 1983; Arnold 1994). However, for traits expressed in social interactions, we must also consider social pathways to fitness, which arise from indirect genetic effects and social selection, when calculating response to selection (Moore et al. 1997a; Bijma & Wade 2008; McGlothlin et al. 2010). Because the model of phenotypic modification described in Eq. 2 deviates from the standard model of indirect genetic effects, we develop a general equation for response to selection in the Appendix (Eq. 20). Using this equation, the response to selection for the three traits in our model can in general be written as


 The multiplier ½ in Eq. 7 arises because selection is acting only on males. Eq. 7a shows that modification of aggressive behavior in response to the signaling trait (δAS) causes both nonsocial and social selection gradients for aggression to contribute to signal evolution. This behavioral modification thus effectively causes both a direct genetic correlation between signaling and aggression and a nonrandom association between the genetic effect on aggression in the focal individual and the genetic effect on the signal in its opponent. This behavioral modification also contributes to evolution of body size when the signal is honest (GSB > 0; Eq. 7b). In contrast, behavioral modification does not contribute to evolution of aggression (Eq. 7c).
By substituting Eqs. 5-6 into Eq. 7, we can predict evolutionary change using our mechanistic fitness model (Eq. 4):


 Eq. 8a shows that when fitness is defined as in Eq. 4, evolution of the signaling trait beyond its naturally selected optimum depends crucially on behavioral modification. If males do not change their behavior in response to the signal (i.e., if δAS = 0), the population mean of the signaling trait cannot increase. From Eq. 8b, the evolution of body size depends on both δAS and the presence of signal honesty (i.e., genetic covariance between signal and body size, GSB). Eqs. 8a-b also show that evolution of the signaling trait and of male body size is potentially open-ended because the evolutionary response to selection for each trait becomes stronger as the population mean body size increases. In contrast, from Eq. 8c, the evolution of aggression is self-limiting because selection depends on the balance of the benefits and costs of aggression, the latter of which become more intense as mean aggression intensifies. This observation suggests that both signal size and body size may experience runaway evolution if the benefits of aggression and the threat of the opponent are strong enough to outweigh natural selection against elaborate signals, whereas aggression should always tend to quickly evolve to an equilibrium value.
To solve for equilibrium and to explore the conditions for such a runaway, we set Eqs. 8a-c equal to zero and solve for the equilibrium mean of each trait  , yielding


 As predicted, aggression will always reach a stable equilibrium whenever there is a cost of aggression (Eq. 9c, Fig. 1). Eqs. 9a-b predicts a line of equilibria for signal size and body size, because their evolutionary change is completely intertwined with the relationship
 (Fig. 1). The slope of the line of equilibria predicting mean signal size from mean body size, and hence the evolutionary allometry of signal size, is
  . This relationship indicates that when comparing population means through time or across space, positive allometry (i.e., a slope greater than unity) is predicted when the strength of behavioral modification multiplied by the threat of the opponent (δAScB) is greater than the strength of natural selection on signal size (cS). In general, when male behavior is more strongly dependent on the signal of their opponent (i.e., when δAS is larger), more elaborate signals are expected at equilibrium (Fig. 2).

Evolution of a male signal, body size, and aggression in response to male-male competition. Panels A and B show evolutionary trajectories for each trait over 200 generations, and panels C and D show predicted lines of equilibria (heavy line) and their stability (gray arrows). In all panels, all three traits have the same genetic variance (G = 1), benefit (bA = 0.2) and cost of aggression (cA = 0.05), fitness cost deriving from the threat of a male’s opponent (cB = 0.2), cost of signal size (cS = 0.05; with naturally selected optimum θS = 0), and a responsiveness of aggression to body size (δAS = 0.4). The line of equilibria is calculated from Eq. 9a using these values. In panels A and C, signal size is weakly correlated with body size (GSB = 0.4), while in panels B and D, the two traits are more strongly correlated (GSB = 0.8). When the genetic correlation between signal size and body size is weak, all three traits reach equilibria (A), with equilibrium aggression predicted solely by costs and benefits. Signal size and body size reach a point on the predicted line of equilibrium (C) that differs depending on their starting values. When the genetic correlation is strong, aggression still reaches an equilibrium, but signal size and body size run away together (B), overshooting the predicted line of equilibria (D). As in Fisherian selection from female mate choice (Lande 1981), male-male competition can drive traits to runaway elaboration or extinction when the line of equilibria is unstable (D).
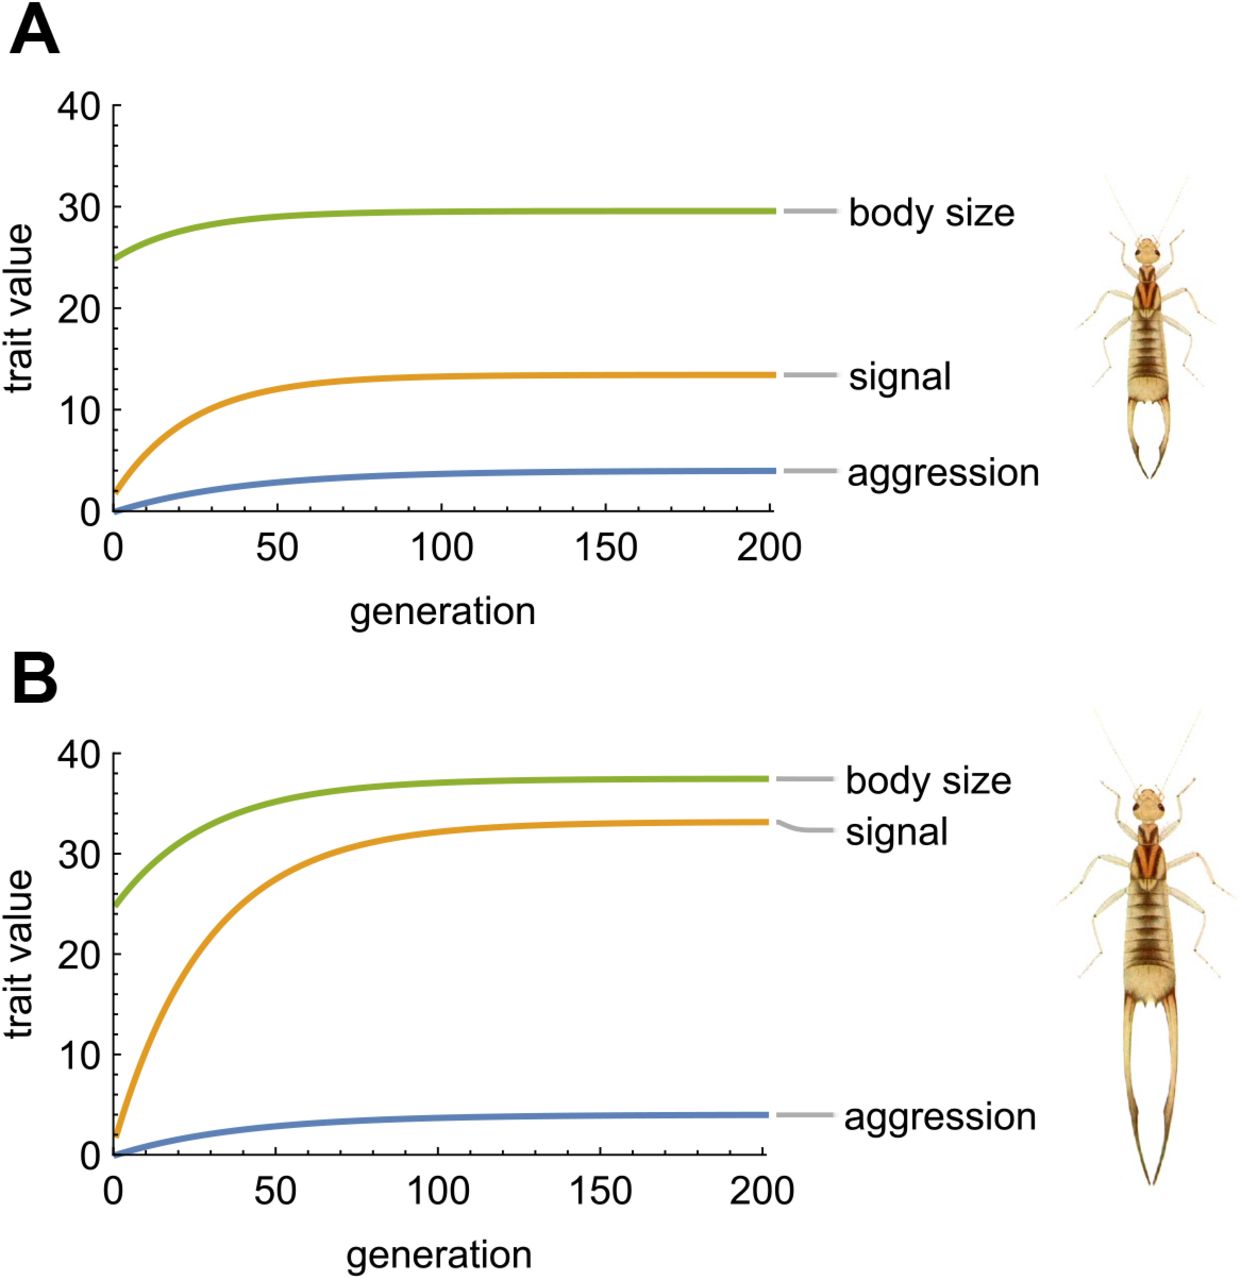
Stronger dependence of male aggressive behavior leads to more elaborate traits at equilibrium. Panel A illustrates a relatively weak influence of opponent signal on male aggression (δAS = 0.4), while panel B illustrates a stronger influence (δAS = 0.8). In each panel, we use starting values for traits relevant to the highly sexually dimorphic earwig Labidura riparia, which uses its forceps as a signaling trait and is shown to the right of each panel (drawing modified from Lucas 1920). Other parameters are the same as Fig. 1A. When the influence of opponent signal is weak (A), both body size and signal show a moderate evolutionary increase. When the influence is stronger (B), both body size and signal increase more, but the final signal size is much larger relative to body size. The highly elaborate elongate forceps in panel B may be found in other earwig species like Forcipula gariazzi.
Whether an evolving population will reach a predicted equilibrium or overshoot it also depends crucially on the rate of evolution of body size versus natural selection on signal size. Specifically, from Eq. 8a, in order for runaway evolution to occur, body size must evolve fast enough that  regardless of the population mean signal size. Because bA and θS are constants, this occurs when
  , or equivalently, when
 This result is also achievable by solving for the condition generating a negative eigenvalue of the Jacobian of
  , which indicates an unstable equilibrium (Lande 1981; Bailey & Kölliker 2019). The condition in Eq.10 indicates that runaway evolution of a signal may occur when it is honest (GSB is strong and positive), when it modifies aggressive behavior of social partners (δAS > 0), and when aggression imposes a fitness cost that increases when opponents are larger (cB). Fig. 1 illustrates a scenario in which the predicted outcome (equilibrium or runaway) depends upon the value of the degree of signal honesty (i.e., the genetic covariance GSB).
DISCUSSION
Our model provides explicit conditions for sexual selection arising from male-male competition to result in elaborate signals and runaway evolution. We model the origin of costs and benefits associated with male traits mediating male-male interactions using considerations from evolutionary game theory, which allows us to derive expressions for natural and social selection gradients that reflect the mechanistic properties of male contests. We then incorporate these expressions for selection into a model of trait genetics based on the interacting phenotypes framework, which accounts for the influence of indirect genetic effects arising from interactions with an opponent. Elaboration of a signal occurs whenever males adjust their level of aggression based on the signal of an opponent, and runaway evolution occurs when the genetic correlation between signal size and body size is large (i.e., the signal is honest), when aggression in a social partner is modified based on the focal male signal, and when aggression is costly when the opponent is larger (Eq. 10; Fig. 1, 2). In contrast, aggression always reaches an equilibrium, both because the fitness benefit of aggression is relative to that of the opponent and because of the fitness costs of escalated contests. Limits to runaway evolution of the signaling trait depend on the strength of natural selection opposing signal elaboration, which may arise through costs of producing or bearing the signal.
Our model provides predictions that are testable in natural populations. Specifically, we expect the evolution of elaborate signaling traits that resolve duels between males to evolve when three conditions are present. First, signals should be reliable predictors of body size or some other proxy of fighting ability. Indeed, such signal honesty, which is often characterized as positive allometry (McCullough et al. 2016; O’Brien et al. 2018) or a positive genetic correlation (Clark & Moore 1995; McGlothlin et al. 2005; Laidre & Johnstone 2013) between size and signal, is a common feature of traits involved in male-male competition. Second, males must modify their behavior in response to their opponent’s signal. We assume that males increase their aggression when encountering an opponent with a smaller signal than their own and reduce their aggression when encountering an opponent with a larger signal. Such adjustment is common in species that resolve contests via limited fights or displays (Darwin 1871; West-Eberhard 1979, 1983; Emlen 2008, 2014). In our model, this phenomenon alters the relationship between genotype and phenotype, causing a net force of social selection to contribute to signal evolution (Eqs. 7a, 8a). Finally, we expect social selection to be imposed via the aggression of opponents. This selection becomes stronger as male body size or fighting ability evolves due to the threat of escalation of fights with large opponents. Mean level of aggression need not change if the threat escalates. Our model makes specific predictions for the signs of these gradients when selection on signal size, body size, and aggression can all be measured (Eqs. 5-6). Most crucially, our model predicts negative social selection gradients for both body size and aggression, which reflect the costs of escalated contests. In populations that are experiencing an evolutionary runaway, these gradients should become stronger as body size and signal size coevolve. Although few studies have measured social selection gradients, the limited evidence that exists supports the existence of negative social selection gradients imposed by competitors (Formica et al. 2011; Fisher & Pruitt 2019).
Parallels to models of female choice
The results of our model are conceptually analogous to models of runaway sexual selection via female choice, suggesting some key parallels between the processes. Both our model and Lande’s (1981) model of female choice, which was the first formal model of Fisher’s runaway process, result in lines of equilibria that may be stable or unstable depending on the genetic parameters. For the scenario of relative mate preference in Lande’s model, the line of equilibria for a male trait  and a female preference
  can be written as
 where θ is the natural selection optimum, bSS is the strength of sexual selection, and cNS is the strength of natural selection. Eq. 11 directly parallels Eq. 9a from our model and emphasizes that in male-male competition, the force of sexual selection is provided not by direct female choice but by male body size (or some other measure of willingness or ability to engage in aggression). In male-male competition, the threat of the opponent (cB) leads to social selection, which is indirectly translated into evolutionary change in male signals via the parameter δAS, measuring the dependence of aggression on relative signal size of two competing males.
Similarly, the condition for runaway evolution of male traits and female preference driven by mate choice in Lande’s model can be written as
 where B represents the genetic covariance between male trait and female preference and G represents genetic variance of the male trait (Maynard Smith & Harper 2003). The condition in Eq. 12 directly parallels the condition in Eq. 10, emphasizing again that in male-male competition, δAScB provides the force of social selection that indirectly leads to an evolutionary increase in male signal size. Both types of runaway evolution are driven by genetic covariance. In mate choice, runaway is driven by the covariance between the sexes that arises from choosy females mating with attractive males, but in male-male competition, this effect arises directly from signal honesty, i.e., the genetic covariance between a signaling trait and the threat it signals. Moreover, if the mean level of aggression does not change, in male-male competition increasing costs are associated only with the increasingly elaborated signal. This may occur when aggression is not expressed outside of male-male competition and when limited fights settle contests (Maynard Smith & Harper 1988; Maynard Smith & Harper 2003). These are common conditions (Parker 1974; West-Eberhard 1983, 1984; Maynard Smith & Harper 1988; Andersson 1994), suggesting that runaway from male-male competition may occur frequently (McCullough et al. 2016; Rico-Guevara & Hurme 2019).
Conclusion
Ritualized displays and elaborated signals associated with the potential for aggression are readily observed in nature and their importance often obvious and spectacular (Darwin 1871; Parker 1974; Maynard Smith & Harper 1988; Maynard Smith & Harper 2003; Emlen 2008, 2014). Yet the details of how these might evolve have been unclear. Previous optimality models have shown that overt aggression can be ameliorated by conventional signals (Parker 1974; Maynard Smith 1982; Maynard Smith & Harper 1988; Maynard Smith & Harper 2003; Rutte et al. 2006), and verbal models have proposed that signaling traits associated with male-male competition evolve exaggerated expression because social selection is intense (West-Eberhard 1979, 1983, 1984). Male-male competition may well result in intense selection (Maynard Smith & Brown 1986) as mating can be highly skewed toward one or a few males in a population (Darwin 1871; Andersson 1994; Shuster & Wade 2003), but this alone is insufficient to result in exaggerated traits. Our model shows that feedback between the behavioral and morphological traits mediating male-male competition create runaway evolution. Thus, the unifying feature of runaway sexual selection by both male-male competition and female mate choice is an evolving source of selection provided by the social environment.
AUTHOR CONTRIBUTIONS
AJM, JWM, and JBW conceived the idea, developed the model, and wrote the paper.
ACKNOWLEDGMENTS
We thank our collaborators, students, and postdoctoral scientists over the years for discussions and comments on various earlier versions of the manuscript. This work was supported by grants from NERC (UK, NE/C510659/1 to JBW) and NSF (USA, IOS-1354358 to AJM, DEB-1457463 to JWM).
APPENDIX
General equation for response to selection
Here, we develop a general model for evolution when trait expression depends upon the difference between a focal individual’s own traits and traits of another individual encountered in the context of a social interaction. This model is directly applied to male-male contests in the main text and may be useful for considering many other types of social interactions. First, consider a vector of traits (z) whose expression can be decomposed into three components: a vector of additive genetic effects (a), a vector of environmental effects (e), and a social response term that depends on the difference between the traits of the focal individual and those of a social interactant (z ′):
 The matrix δ consists of components δii that translate the effect of differences in trait j into expression of trait i. Similarly, the phenotype of the social partner can be written as
 As we show below, because the term δ (z − z ′) in Eqs. 13-14 contains phenotypes of both individuals, it consists of a combination of direct and indirect genetic effects.
To calculate a response to selection for traits expressed as in Eq. 13, we first solve for the multivariate phenotypic mean. Assuming that environmental effects have a mean of zero, the trait mean is
 which means that the population trait mean will depend only on the mean additive genetic value. The vector of total breeding values (A), which represents the genetic contribution to the population mean and is used to calculate evolutionary responses to selection, is equivalent to the vector of additive genetic effects (a). Next, to derive an explicit definition of the phenotype, we first use substitution to write
 where I is the identity matrix. After some algebra, Eq. 16 allows us to write explicit definitions of the two phenotypes as
 and
and
 Response to selection can then be calculated following McGlothlin et al. (McGlothlin et al. 2010) as
 Substituting Eqs. 17-18 into Eq. 19 and simplifying yields
 where G is the additive genetic (co)variance matrix and r is relatedness. Eq. 20 can be used to generate the specific model in the text by setting parameters as
 and multiplying the result by
  to indicate selection acting only on males.
Relationship to indirect genetic effects models
The model described above differs from previous models of indirect genetic effects in that phenotypes may be adjusted in relation to both the phenotypes of a social partner and other phenotypes of the focal individual. The standard model of phenotypic expression used in trait-based genetic effects models (Moore et al. 1997a) is
 The relationship between the two models can be seen by adding an additional term to the standard model:
 The term ξz, which is similar to the developmental interaction effects considered by Wolf et al. (Wolf et al. 2001), contains a conditional modification of the direct genetic effect in response to other phenotypic traits, while the term Ψz′ contains indirect genetic effects (Moore et al. 1997a). When ξ = 0, model 23 is equivalent to model 22, and when ξ = −Ψ = δ, model 23 is equivalent to model 13.
Incorporating conditional direct genetic effects is a way to mechanistically represent genetic covariances in a quantitative genetic model (Wolf et al. 2001). Combining such effects with indirect genetic effects allows exploration of a wide variety of models of phenotypic adjustment, including behavioral modification, in evolutionary quantitative genetic models. For full generality, we give the equation for multivariate response to selection derived from model 23. First, the vector of total breeding values derived from the trait mean is
 By substitution of Eqs. 23-24 into Eq. 19, we find
 This equation is unwieldy in its multivariate form, but one can follow the approach we take here for male-male competition and use Eq. 25 to generate much simpler models of the evolution of systems of responsive traits given a set of assumptions about fitness and trait expression.
Extension to multiple opponents
Our results can be extended to incorporate interactions with multiple opponents. Suppose a male encounters opponents sequentially. The phenotype of a focal individual averaged over all encounters is then
 and the average of his social partners is
 where an overbar is now taken to indicate an average over an individual male’s encounters. If we assume that the fitness effects of individual encounters accrue additively, then Eq. 20 may still be used to predict the evolution of the population mean, with βN and βS now representing vectors of partial regression slopes of fitness on focal individual mean and social group mean phenotypes, respectively. Specific fitness models may be substituted into Eq. 20 in the same way as for models of single pairwise interactions.
Footnotes
Revised text, added figure 2


