

Abstract
Reading words aloud is a foundational aspect of the acquisition of literacy. The rapid rate at which multiple distributed neural substrates are engaged in this process can only be probed via techniques with high spatiotemporal resolution. We used direct intracranial recordings in a large cohort to create a holistic yet fine-grained map of word processing, enabling us to derive the spatiotemporal neural codes of multiple word attributes critical to reading: lexicality, word frequency and orthographic neighborhood. We found that lexicality is encoded by early activity in mid-fusiform (mFus) cortex and precentral sulcus. Word frequency is also first represented in mFus followed by later engagement of the inferior frontal gyrus (IFG) and inferior parietal sulcus (IPS), and orthographic neighborhood is encoded solely in the IPS. A lexicality decoder revealed high weightings for electrodes in the mFus, IPS, anterior IFG and the pre-central sulcus. These results elaborate the neural codes underpinning extant dual-route models of reading, with parallel processing via the lexical route, progressing from mFus to IFG, and the sub-lexical route, progressing from IPS to anterior IFG.
Introduction
Reading a word aloud requires multiple complex transformations in the brain - mapping the visual input of a letter string into an internal sequence of sound representations that are then expressed through orofacial motor articulations. Models of how this mapping occurs during reading invoke a dual-route architecture (Coltheart et al., 2001; Perry et al., 2007, 2010, 2019; Taylor et al., 2013), with a lexico-semantic route for rapidly reading known words and a sub-lexical route for constructing the phonology of novel words. A common method of targeting these two routes is to look at contrasts between phonological exception words and pseudowords (Fiebach et al., 2002; Sebastian et al., 2014; Shim et al., 2012; Taylor et al., 2013). Exception words contain irregular grapheme-phoneme associations (e.g. yacht, sew) and their phonologies must be retrieved from internal lexical representations as they cannot be accurately constructed de novo. In contrast, pseudowords have no stored representation and their phonology must be constructed rather than retrieved.
Ventral temporal cortex, particularly mid-fusiform cortex (mFus), is strongly associated with the lexical route. mFus is heavily implicated as the site of the orthographic lexicon, the long-term memory storage of which letter strings map onto known words (Glezer et al., 2015; Hirshorn et al., 2016; Kronbichler et al., 2004; Lochy et al., 2018; White et al., 2019; Woolnough et al., 2021). This region is sensitive to lexicality and word frequency (Kronbichler et al., 2004; White et al., 2019; Woolnough et al., 2021), and shows selective changes during visual word learning (Glezer et al., 2015; Taylor et al., 2019). The sub-lexical route, essential for articulating novel words, is thought to engage the inferior parietal lobe (IPL), dysfunction of which is associated with dyslexia (Raschle et al., 2011; Temple et al., 2003; Tomasino et al., 2020), dysgraphia (Rapp et al., 2016), in addition to phonological and semantic deficits (Binder et al., 2009; Hula et al., 2020; Numssen et al., 2021). The two routes are proposed to converge in the inferior frontal gyrus (IFG) (Taylor et al., 2013).
The majority of our knowledge regarding the neural architecture underlying reading aloud is derived from lesion data and functional MRI which provide accurate spatial localizations of function but lack crucial temporal information. We utilized intracranial recordings in a large cohort of patients (44 patients, 3,642 electrodes), with medically intractable epilepsy, while they read aloud known and novel words. This allowed us to comprehensively map the flow of information through these cortical networks and track the spatiotemporal dynamics of the cortical representation of behaviorally relevant lexical and sub-lexical factors.
Results
Participants were visually presented with phonologically regular words, exception words and novel pseudowords that they read aloud (Figure 1A). Electrophysiological recordings were performed from a total of 3,642 separate intracranial electrodes placed for the localization of intractable epilepsy (Figure 1B,C) - 4 participants had subdural grid electrodes (SDEs) and 40 had depth recordings using stereotactic EEG electrodes (sEEGs).

(A) Schematic representation of the reading task. (B) Representative coverage map (44 patients) and (C) individual electrode locations (3,642 electrodes) for the left hemisphere, highlighting responsive electrodes (1,158 electrodes; >20% activation above baseline).
Behavioral Analysis
Mean (± SD) response times (RTs) were: regular words (743 ± 122 ms), exception words (747 ± 125 ms) and pseudowords (923 ± 193 ms) (Figure 2A). Regular and exception words showed no difference in RT (Wilcoxon sign rank, p = 0.75; ln(Bayes Factor (BF10)) = −1.5) though pseudoword RT was slower than for exception words (p < 10−8, ln(BF10) = 28).
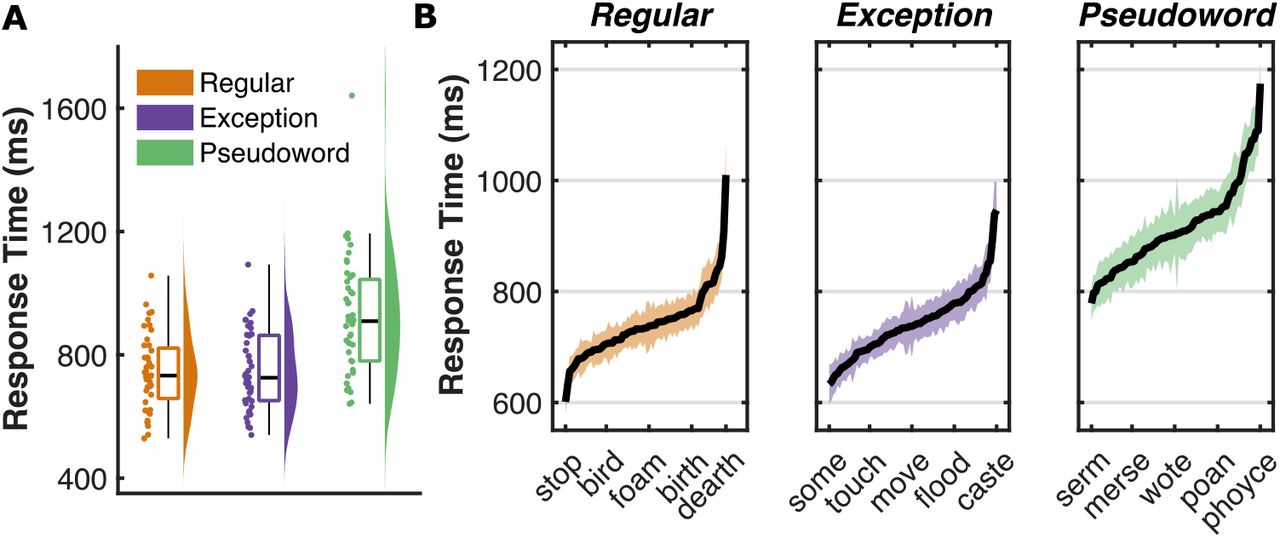
(A) Response time distribution for each of the three word classes, averaged within participant, (B) Mean (± SE) response times for each item within the three word classes, averaged across participants.
To determine the underlying properties of the words that modulate RT within this cohort, we performed linear mixed effects (LME) and Bayes factor (BF) analyses on each word class with fixed effects modelling linguistic factors commonly linked to word identification and articulation (Table 1). Regular words and exception word RTs showed the greatest modulation by word frequency. Pseudoword RT was most strongly associated with orthographic neighborhood.
As predictors were normalized, β values approximate change in RT between extreme values within the entire stimulus set (Supplementary Table 1). Factors with strong evidence of an effect (ln(BF10) > 2.3) are highlighted.
Spatiotemporal Mapping of Single Word Reading
We used a mixed-effects, multilevel analysis (MEMA) of broadband gamma activity (BGA; 70-150 Hz) in group surface normalized space to create a population level map of cortical activation across the population. This analysis is specifically designed to account for sampling variations and to minimize effects of outliers (Argall et al., 2006; Conner et al., 2014; Esposito et al., 2013; Fischl et al., 1999; Kadipasaoglu et al., 2014; Saad and Reynolds, 2012). All correctly articulated trials across all word classes, were used. 4D representations of the spread of activation across the cortical surface were generated by performing MEMA on short, overlapping time windows (150 ms width, 10 ms spacing) to generate successive images of cortical activity, time locked to stimulus onset (Video 1) or the onset of articulation (Video 2). The spatial distribution of activations was highly comparable across word classes (Supplementary Figure 1).
By collapsing across these frames, we visualized peak activations at each point on the cortical surface (Figure 3A). To create a more focused visualization of the spatiotemporal progression across reading-sensitive cortex, we selected 12 regions of interest (ROIs) in areas thought to be important to written word processing, speech production and speech monitoring (Figure 3B,C). This analysis highlights regions displaying primarily pre-articulatory processes, in ventral occipitotemporal cortex, inferior parietal lobe and the inferior frontal gyrus.

(A) Collapsed articulation-locked activation movie (Video 2) highlighting the amplitude of peak activation. (B) Representative ROIs in 12 anatomically and functionally distinct regions, showing all responsive electrodes. (C) Mean activation during word reading of each ROI, averaged within patient, time locked to stimulus onset (left) and articulation onset (right). Standard errors omitted for visual clarity. LOT, Lateral OccipitoTemporal cortex; mFus, mid-Fusiform Cortex; IPS, Inferior Parietal Sulcus; pCS, pre-Central Sulcus; pIFG, posterior Inferior Frontal Gyrus; aIFG, anterior Inferior Frontal Gyrus; FO, Frontal Operculum; iMC, inferior Motor Cortex; SMG, Supra Marginal Gyrus; SMA, Supplementary Motor Area; PI, Posterior Insula; STG, Superior Temporal Gyrus.
Spatiotemporal Representation of Lexical Factors
To distinguish activity patterns across word classes we contrasted grouped gamma power activations between exception vs. pseudowords (lexicality) and exception vs. regular words (regularity) using MEMA. The lexicality contrasts demonstrated clusters in mFus, precentral sulcus (pCS), inferior parietal sulcus (IPS) and anterior inferior frontal gyrus (aIFG).
To determine how distinguishable whole-network activity patterns are for each of these factors, within-individuals at a single trial level, we used a logistic regression decoder. Decoders trained to distinguish between exception word and pseudoword trials demonstrated high decoding accuracy, with some patients showing >80% decoding accuracy (Figure 4C). These lexicality decoders displayed high electrode weightings across the ventral temporal surface, IPS, pCS and aIFG (Figure 4D). Decoders trained to distinguish exception and regular words did not show higher decoding accuracy than in the baseline period.

(A,B) MEMA contrasts of (A) exception – pseudoword and (B) exception – regular, revealing regions of significantly different BGA between conditions (p < 0.01 corrected). Regions in black did not have consistent coverage for reliable MEMA results. (C) Decoding accuracies of the logistic regression decoders trained to distinguish exception word vs. pseudoword trials (left) and exception word vs regular word trials (right). Grey lines represent individual patient decoding accuracies. Colored line represents median accuracy. (D) Cortical surface representation of population average electrode weightings of the exception vs pseudoword decoder between 300 – 500 ms.
We observed lexicality distinctions between known words (regular and exception) and novel pseudowords broadly across the previously defined ROIs (Figure 5). These distinctions were observed earliest in mFus before spreading to pCS and visual word form regions, and subsequently to IFG and IPS. Distinctions were also observed in post-articulatory auditory regions (posterior insula and superior temporal gyrus) relating to differences in RT between known and novel words.

Mean activation (± SE) for each word class, within each ROI, during word reading, averaged within patient, time locked to stimulus onset. Number of electrodes and patients, per ROI, is indicated. LOT, Lateral OccipitoTemporal cortex; mFus, mid-Fusiform Cortex; IPS, Inferior Parietal Sulcus; pCS, pre-Central Sulcus; pIFG, posterior Inferior Frontal Gyrus; aIFG, anterior Inferior Frontal Gyrus; FO, Frontal Operculum; iMC, inferior Motor Cortex; SMG, Supra Marginal Gyrus; SMA, Supplementary Motor Area; PI, Posterior Insula; STG, Superior Temporal Gyrus.
For the six ROIs that showed a clear pre-articulatory peak in activation, we analyzed their activity for sensitivity to the main drivers of RT seen in the behavioral analysis; lexicality, word frequency of known words and orthographic neighborhood of pseudowords. mFus showed the earliest sensitivity to lexicality, followed by LOT and pCS, and then broad sensitivity across multiple regions (Figure 6A). mFus showed an early and long-lasting word frequency sensitivity, with IPS and aIFG becoming sensitive later (500-700 ms). Sensitivity to orthographic neighborhood of pseudowords was only seen in IPS (500-700 ms).

(A) Bayes factor analysis of lexicality, word frequency and orthographic neighborhood effects in the six pre-articulatory ROIs, for three time windows. Lexicality tested all known words against pseudowords. Word frequency was regressed across all known words. Orthographic neighborhood was regressed across all pseudowords. Bayes factor (ln(BF10)) shown for each contrast and values >2.3 are highlighted. (B,C) Linear mixed effects (LME) model regression of (B) word frequency in known words and (C) orthographic neighborhood in pseudowords, in three ROIs (β ± SE; mFus, 49 electrodes, 19 patients; IPS, 21 electrodes, 9 patients; aIFG, 35 electrodes, 9 patients). Colored bars represent regions of significance (q < 0.05).
For the three regions we found to have evidence of word frequency or orthographic neighborhood sensitivity, mFus, IPS and aIFG, we used LME models at a higher time resolution. Sensitivity to word frequency was observed earliest in mFus (200 ms) followed by IPS and aIFG (425 ms) (Figure 6B). In IPS we observed a period of elevated orthographic neighborhood sensitivity, but this did not show significance at this time resolution (Figure 6C).
Discussion
This large population intracranial study comprehensively maps the spatiotemporal spread of cortical activation across the left hemisphere during word reading to derive the dynamics of cortical networks underlying literacy. Dual-route architectures of reading networks (Coltheart et al., 2001; Perry et al., 2007, 2010, 2019), derived on behavioral and lesional data, imply separable processing routes for known vs novel words. We find a network of regions sensitive to lexicality, initially the mFus and pCS, then spreading broadly across IPS and IFG. The spatial distribution of this lexicality effect is broadly comparable with the lexicality network identified with fMRI (Heim et al., 2013; Taylor et al., 2013, 2014), with the added benefit of millisecond temporal resolution. Responses in lexicality sensitive regions maximally separate for known and novel words between 300-500ms after stimulus onset, in a manner that is reliable enough to enable single trial decoding of lexicality. These data minimize the impact of response time variations, which confounds modalities with lower temporal resolution (e.g. fMRI) and may artificially inflate lexicality effects in regions such as IFG (Taylor et al., 2014).
We have previously demonstrated that mFus is the earliest region in ventral temporal cortex to show sensitivity to word frequency while reading (Woolnough et al., 2021). It is commonly assumed that sensitivity to statistical properties of language such as word frequency seen in ventral temporal cortex are as a result of top-down modulation from IFG (Heim et al., 2013; Price and Devlin, 2011; Woodhead et al., 2014). Here, we demonstrate again the primacy of the mFus in coding both word frequency and lexicality, preceding the engagement of aIFG and IPS in these processes by over 200 ms. This consolidates mFus’s role as a specialized orthographic lexicon, organized based on statistical regularities of individual words in natural language.
The IPS was the only region with sensitivity to orthographic neighborhood. This sensitivity likely reflects grapheme-phoneme conversion processes in this region (Dehaene-Lambertz et al., 2018; Xu et al., 2020). Given that IPS shows both word frequency and lexicality sensitivity, its role in sub-lexical processing might appear to be questionable. However, for known words, the lexical route is faster and more accurate than the sub-lexical route – thus, once a letter string is identified as a known lexical object, sub-lexical processes are no longer required. Given the word frequency dependence of lexical identification, the timing of the cessation of sub-lexical processes should also be frequency dependent. This interpretation is entirely consistent with our data as IPS shows more sustained activity, but not higher peak activity for novel words.
It is theorized that pCS is involved in articulatory phonological processing, specifically feedforward control of articulator velocity (Matchin and Hickok, 2020; Tourville and Guenther, 2011). Through lesion studies pCS has also been linked to phonological dyslexia (Rapcsak et al., 2009; Tomasino et al., 2020). Our data demonstrate that pCS activation begins early, preceding the IFG, suggesting a role in early linguistic or phonological processing, potentially as part of the sub-lexical route. pCS demonstrates lexical sensitivity but no effect of word frequency. Given the association of pCS with articulation phonology and phonological dyslexia, this may represent part of the process of constructing novel phonologies.
This study provides further evidence that medial frontal operculum is involved in pre-articulatory, preparatory processes, distinct from those of the lateral IFG (Mălîia et al., 2018; Woolnough et al., 2019). Lesions involving this region have been linked to impairment of complex articulation (Baldo et al., 2011) which may explain the greater engagement during pseudoword articulation.
We observed no significant pre-articulatory activity in middle temporal gyrus or angular gyrus, regions that have been linked to semantic and phonological processes during word processing (Graves et al., 2010; Hartwigsen et al., 2010; Sliwinska et al., 2015; Stoeckel et al., 2009). These regions appear to be engaged during reading in children but may not be recruited in adults for simple reading tasks (Martin et al., 2015), instead being used primarily for comprehending multi-word phrases (Dronkers et al., 2004; Fridriksson et al., 2018; Matchin et al., 2017).
Materials and Methods
Participants
44 patients (25 male, 19-60 years, 5 left-handed, IQ 94 ± 15, Age of Epilepsy Onset 18 ± 9 years) participated in the experiments after giving written informed consent. All participants were semi-chronically implanted with intracranial electrodes for seizure localization of pharmaco-resistant epilepsy. Participants were excluded if they had confirmed right-hemisphere language dominance or a significant additional neurological history (e.g. previous resections, MR imaging abnormalities such as malformations or hypoplasia). All experimental procedures were reviewed and approved by the Committee for the Protection of Human Subjects (CPHS) of the University of Texas Health Science Center at Houston as Protocol Number HSC-MS-06-0385.
Electrode Implantation and Data Recording
Data were acquired from either subdural grid electrodes (SDEs; 4 patients) or stereotactically placed depth electrodes (sEEGs; 40 patients). SDEs were subdural platinum-iridium electrodes embedded in a silicone elastomer sheet (PMT Corporation; top-hat design; 3mm diameter cortical contact), and were surgically implanted via a craniotomy (Pieters et al., 2013; Tandon, 2012; Tong et al., 2020). sEEGs were implanted using a Robotic Surgical Assistant (ROSA; Medtech, Montpellier, France) (Rollo et al., 2020; Tandon et al., 2019). Each sEEG probe (PMT corporation, Chanhassen, Minnesota) was 0.8 mm in diameter and had 8-16 electrode contacts. Each contact was a platinum-iridium cylinder, 2.0 mm in length and separated from the adjacent contact by 1.5 - 2.43 mm. Each patient had 12-20 such probes implanted. Following surgical implantation, electrodes were localized by co-registration of pre-operative anatomical 3T MRI and post-operative CT scans in AFNI (Cox, 1996). Electrode positions were projected onto a cortical surface model generated in FreeSurfer (Dale et al., 1999), and displayed on the cortical surface model for visualization (Pieters et al., 2013). Intracranial data were collected during research experiments starting on the first day after electrode implantation for sEEGs and two days after implantation for SDEs. Data were digitized at 2 kHz using the NeuroPort recording system (Blackrock Microsystems, Salt Lake City, Utah), imported into Matlab, initially referenced to the white matter channel used as a reference for the clinical acquisition system and visually inspected for line noise, artifacts and epileptic activity. Electrodes with excessive line noise or localized to sites of seizure onset were excluded. Each electrode was re-referenced to the common average of the remaining channels. Trials contaminated by inter-ictal epileptic spikes were discarded.
Stimuli and Experimental Design
All patients undertook a word reading task. Stimuli were presented on a 2,880 × 1,800 pixel, 15.4” LCD screen positioned at eye-level, 2-3’ from the patient. Participants were presented with 80 each of monosyllabic (i) phonologically regular words, (ii) phonologically irregular exception words and (iii) novel pseudowords and asked to read them aloud. Stimuli were presented using Psychophysics Toolbox (Kleiner et al., 2007) in Matlab, in all lower-case letters, in Arial font with a height of 150 pixels (~2.2° visual angle). Each stimulus was displayed for 1,500 ms with an inter-stimulus interval of 2,000 ms. Stimuli were presented in two recording sessions, each containing presentation of 120 stimuli in a pseudorandom order with no repeats. 95 ± 4% of trials were correctly articulated. The most common errors were regularization of exception words (e.g. sew as sue, soot as sute) or lexicalization of pseudowords (e.g. shret as shirt, jinje as jingle).
Signal Analysis
Analyses were performed by first bandpass filtering raw data of each electrode into broadband gamma activity (BGA; 70-150Hz) following removal of line noise (zero-phase 2nd order Butterworth bandstop filters). A frequency domain bandpass Hilbert transform (paired sigmoid flanks with half-width 1.5 Hz) was applied and the analytic amplitude was smoothed (Savitzky - Golay finite impulse response, 3rd order, frame length of 201 ms). BGA is presented here as percentage change from baseline level, defined as the period −500 to −100 ms before each word presentation.
Electrodes were tested to see if they were responsive during the task. Responsiveness was defined as displaying >20% average BGA over baseline for at least one of the three following windows: 100 to 500 ms following stimulus onset, −500 to −100 ms before articulation onset or 100 to 500 ms following articulation onset. Of the 3,642 useable electrodes, 1,158 electrodes were designated responsive based on these criteria.
Neural Decoding
Decoding analyses were performed using logistic regression classifiers, using 5-fold cross validation, implemented within MNE-Python (Gramfort, 2013; Gramfort et al., 2014). For each patient, decoding performance was summarized with an area under the curve (AUC) and a set of classifier weights for each electrode. Temporal decoding was performed on BGA using a sliding estimator at each time point, using all available electrodes. Spatial distribution of classifier weights was reconstructed by a cortical surface transform onto a standardized brain surface using each electrode’s presumed “recording zone”, an exponentially decaying geodesic radius (Kadipasaoglu et al., 2014). Cortical surface maps were amplitude normalized within patient then averaged across patient to create a population weighting map.
Linguistic Analysis
We quantified word frequency as the base-10 log of the SUBTLEXus frequency (Brysbaert and New, 2009). This resulted in a frequency of 1 meaning 10 instances per million words and 4 meaning 10,000 instances per million words. There was no significant difference between word frequency of regular (1.5 ± 0.35; Mean ± SD) and exception (1.7 ± 1.0) words (Wilcoxon rank sum, p = 0.36). Positional letter frequency was calculated as the base-10 log of the sum of the SUBTLEXus frequencies of all words with a given letter in a specific ordinal position. Orthographic neighborhood was quantified as the orthographic Levenshtein distance (OLD20); the mean number of single character edits required to convert the word into its 20 nearest neighbors with a log frequency greater than 0 (Yarkoni et al., 2008). Phonological neighborhood densities were obtained from the Irvine Phonotactic Online Dictionary (IPhOD) (Vaden et al., 2009). Pseudowords were phonemically transcribed using the most common pronunciation.
Author Contributions
Conceptualization: OW, CD, SD, NT; Methodology: OW, CD, NT; Data curation: OW, CD, PSR, ZR; Software: OW, CD, AC; Formal Analysis: OW, AC; Writing – Original Draft: OW; Writing – Review and Editing: OW, SD, SFB, NT; Visualization: OW; Funding Acquisition: NT; Neurosurgical Procedures: NT.
Declaration of Interests
The authors declare no competing interests
Supplementary Information
Video 1: Spread of Stimulus-Locked Activity across the Cortical Surface. MEMA movie of the time course of broadband gamma activation across the cortical surface with trials time-locked to onset of the visual stimulus. Regions in black did not have consistent coverage for reliable MEMA results.
Video 2: Spread of Articulation-Locked Activity across the Cortical Surface. MEMA movie of the time course of broadband gamma activation across the cortical surface with trials time locked to the onset of articulation. Regions in black did not have consistent coverage for reliable MEMA results.
Minimum, median and maximum values for each of the regressors used, across the whole stimulus set and for individual word classes. Statistical models used normalized data, subtracting the minimum value and dividing by the range across the whole stimulus set.

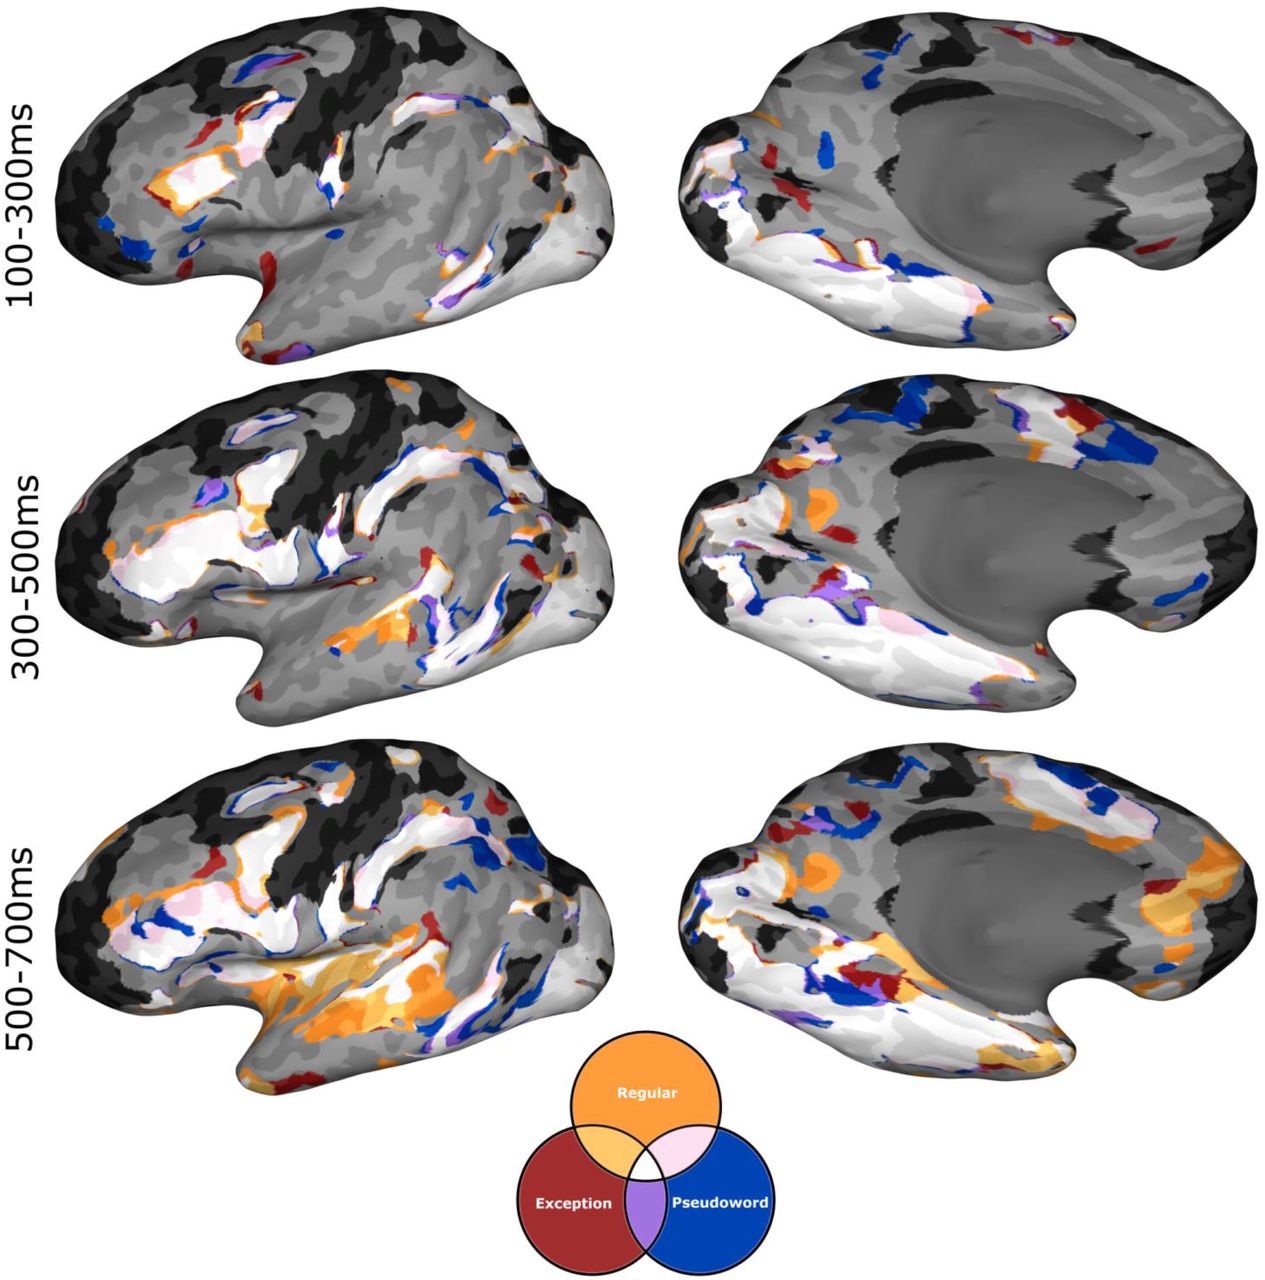
MEMA conjunction maps showing overlap of binarized activation maps of each of the three word classes tested (%BGA > 5%, t > 2.58, patients ≥ 3), over three time windows locked to stimulus onset. Across all time windows all three word classes demonstrate a gross overlap of activation (white). In the later time window, areas associated with post-articulatory processes (e.g. auditory cortex) show selective activation for known words, reflecting differences in response time between known words and novel pseudowords. Regions in black did not have consistent coverage for reliable MEMA results.
Acknowledgements
We express our gratitude to all the patients who participated in this study; the neurologists at the Texas Comprehensive Epilepsy Program who participated in the care of these patients; and the nurses and technicians in the Epilepsy Monitoring Unit at Memorial Hermann Hospital who helped make this research possible. This work was supported by the National Institute of Neurological Disorders and Stroke NS098981.


