

Abstract
The flexible and sophisticated movement of the gastrointestinal (GI) tract implies the involvement of mechanisms that are intellectually coordinating excitation in micro-regions other than the neural reflex. We thus performed image analysis of pacemaker micro-coordination in the small intestine of mice, which contains network-forming pacemaker cells. Field potentials were recorded by a dialysis membrane-reinforced microelectrode array (MEA). The micro-coordination of pacemaker activity varied considerably although four basic patterns were identified. Two major patterns of pacemaker activity were ‘expanding’ and ‘migrating’, defined as the initiation from and propagation to the MEA sensing area, respectively. The existence of ‘expanding’ and ‘migrating’ patterns were attributed to duplicated pacemaker current systems such as intracellular Ca2+ oscillation-activated and voltage-gated mechanisms. Consequently, these patterns reflect spontaneity and synchrony/continuity, respectively. The initiation region of ‘expanding’ activity fluctuated while the direction of ‘migrating’ activity changed, even reversibly. The ‘bumpy’ pattern was characterized by spatiotemporal irregularity and was associated with local impairment of excitability, while the ‘colliding/converging’ pattern involved the interaction of multiple activities in the MEA sensing area. Therefore, both represent the disruption of synchrony/continuity. Interconversion between the four micro-coordination patterns occurred in the same area. 5-Hydroxytryptamine (5-HT) promoted ‘migrating’ activity, accompanied by decreases in ‘bumpy’ and ‘colliding’ events, implying an improvement/restoration of spatial conductivity. These results agree well with the action of 5-HT to change GI movement toward propulsion. In conclusion, our MEA method of image classification enables the quantitative assessment of spatio-temporal excitation underlying GI motility, and is especially useful in small model animals.
Introduction
The flexible and sophisticated movement of the gastrointestinal (GI) tract implies an underlying mechanism that intellectually coordinates excitability in microregions, and is additionally operated with the reflex of intrinsic neural circuits. The patterns of GI movement are often described using simple terms such as ‘segmentation’ and ‘peristalsis’ for agitation and transportation of the luminal contents, whereas, in reality, the GI tract exhibits smooth, elaborate and highly varied movements that show subtle changes between cycles. Interestingly, the complexity of this regulatory system is illustrated by the interaction of GI motility with subconscious thoughts and emotions, which is mediated via autonomic neurons and circulating hormones/cytokines and influences health/disease conditions of the GI tract (Fukudo, 2007; Van Oudenhove et al. 2016; Kaelberer et al. 2018). For example, bowel dysmotility diseases such as irritable bowel syndrome (IBS) are associated with uncoordinated GI movements that enhance feelings of discomfort and stress through brain-gut interactions.
In this study, we describe the micro-coordination patterns of pacemaker activity in the small intestine, which were investigated using a microelectrode array (MEA) technique that we refined for this purpose. Visualization of the MEA field potential data revealed huge variations of spatiotemporal pacemaker activity in microregions, and enabled us to classify them into four basic patterns. In addition, 5-hydroxytryptamine (5-HT, serotonin), which is known to promote propulsive movements (Bülbring and Lin, 1958; Mawe and Hoffman, 2013), exerted consistent modulatory effects on the micro-coordination patterns with its function in vivo. To date, intrinsic neural circuits are thought to play a major role in coordinating GI movements (Bayliss and Starling, 1899; Spencer et al. 1999) whereas the network-like structure and dense distribution of interstitial cells of Cajal (ICCs), also referred to as pacemaker cells, imply their potential for precise spatio-temporal coordination (Faussone-Pellegrini, 2005; Nakayama et al. 2006; Lammers et al. 2008; Huizinga and Lammers, 2009). We anticipate that the visualized micro-coordination patterns of pacemaker potentials support a more realistic understanding of flexible and sophisticated GI movement, and that our method of image classification will be beneficial for functional assessment of the GI tract in health and disease, especially in small model animals.
Materials and Methods
Animals and preparations
Animals were treated ethically in accordance with the guidelines for the proper conduct of animal experiments published by the Science Council of Japan. All procedures were approved by the Animal Care and Use Committee of Nagoya University Graduate School of Medicine (Permissions #28316, #29121, #30312 and #31199). C57BL/6J wild-type mice and W/Wv (WBB6F1/Kit-KitW/KitW-v/Slc) mice that lack ICCs in the intestine (8–40 weeks old, Japan SLC, Hamamatsu, Japan) were sacrificed by cervical dislocation after the inhalation of carbon dioxide. The whole GI tract was quickly resected, and small pieces (^20 mm) of the ileum were isolated and cut along the mesentery. The entire muscularis propria containing the myenteric plexus was isolated by removing from the mucous membrane using forceps.
Immunohistochemistry
Samples of the ileal musculature were fixed with acetone, blocked with 1% bovine serum albumin (BSA), stained with phycoerythrin-conjugated anti-c-kit rat monoclonal antibody (clone 2B8, eBioscience, San Diego, CA, USA) and mounted on a glass slide with an anti-fading agent (ProLong, Molecular Probes, Thermo Fisher Scientific, Waltham, MA, USA). Transmission and fluorescence images were acquired simultaneously by using an inverted confocal microscope (A1, Nikon, Tokyo, Japan).
Solutions and drugs
The extracellular solution used for the MEA recordings was a modified Krebs solution with the following composition (in mM): NaCl 125, KCl 5.9, MgCl2 1.2, CaCl2 2.4, glucose 11, and Tris-HEPES 11.8 (pH 7.4). Nifedipine, 5-HT hydrochloride, 2Me-5HT and ondansetron were purchased from Sigma-Aldrich (St Louis, MO, USA). Nifedipine (2 μM) was applied to block L-type voltage-gated Ca2+ channels and thereby suppress smooth muscle contraction.
Electrical recordings
We developed the dialysis membrane-reinforced MEA recording technique to stably monitor the micro-organization of ICC pacemaker activity in the GI tract of small animals (Iwata et al. 2017; Morishita et al. 2017) because previous multi-electrode array studies had been limited to large animals and humans (Lammers et al. 2008; O’Grady, 2012; Sanders et al. 2016; Huizainga, 2017; O’Grady et al. 2017). An 8 × 8 array of microelectrodes (P515A, Alpha MED Scientific, Ibaraki, Japan) was used to measure electric activity in the ileum. The inter-electrode distance of the MEA was 150 μm, and the sensing area was ∼ 1 mm2. Samples of mouse ileal muscle sheets were firmly mounted onto the MEA, with the longitudinal muscle layer facing downward, using a small piece of dialysis membrane (cellulose tube, Visking, Chicago, IL, USA) and a slice anchor (SDH series, Harvard Apparatus Japan, Tokyo, Japan). A large reference electrode made of platinum was immersed in the extracellular solution (Fig.1A,B). During the propagation of pacemaker potentials, the membrane currents (IM) flowing through the access resistance (Ra) between the sensing and reference electrodes changed the field potential (IM × Ra). A set of 8 × 8 field potentials was simultaneously recorded using a multi-channel AC amplifier that stabilized the baseline potential with high-pass filtering at 0.1 Hz and reduced noise with low-pass filtering at 10 kHz in accordance with conventional extracellular electrode recording techniques (Astrand et al. 1988). The arrayed data were digitized and stored by a personal computer using a 14-bit A/D converter with a sampling rate of 20 kHz (50-μs intervals). The dynamic range of A/D conversion was usually set to ± 1 mV with a digital resolution of ∼0.12 μV.

(A) Photographs showing a muscle sample isolated from the mouse ileum and mounted on an 8 × 8 MEA using a piece of dialysis membrane and an anchor. (B) Illustration showing the arrangement of the muscle sample and dialysis membrane on the MEA plate. The muscle sheet was positioned with the longitudinal muscle layer facing downward and with the oral and anal ends located toward the upper and lower sensing electrodes, respectively. Each microelectrode (ME) sensed changes in field potential reflecting the flow of local membrane current (IM) through the access resistance (Ra) between the ME and a reference electrode. CM: circular muscle; ICC: interstitial cells of Cajal; LM: longitudinal muscle. (C) An 8 × 8 plot showing the spontaneous electric activities recorded from a muscle sample in the presence of nifedipine. (D) Confocal transmitted light image (upper) and c-kit immunofluorescence image (lower) showing the network of pacemaker interstitial cells of Cajal (ICCs) in the myenteric region (representative of ≥3 experiments). (E) Procedures used for potential mapping (left) and a series of potential images transformed from the time-domain data shown in C. HPF: high-pass filtering; LPF: low-pass filtering. (F) Four patterns of pacemaker potential micro-coordination: ‘expanding’, ‘migrating’, ‘bumpy’ and ‘colliding/converging’. Representatives of 1305 pacemaker events in N = 49 series of MEA experiments.
For all samples, the oral and anal ends of the muscles were oriented toward the upper and lower ends of the MEA, respectively. The dialysis membrane had a molecular weight cut-off of 12,000, thus oxygen, ions and energy metabolites could be exchanged. The MEA recording chamber (∼2 mL in volume) was placed on a heater maintained at ∼34°C. The samples were incubated at least 20 min before MEA recordings. Nifedipine (2 μM), a dihydropyridine Ca2+ channel antagonist, was added to the extracellular medium to selectively block L-type voltage-gated Ca2+ channels (a major Ca2+ influx pathway in GI smooth muscle) (Akbarali et al. 2010) and suppress smooth muscle contraction without impeding the pacemaker activity of ICCs (Kito and Suzuki, 2003). The above procedures stabilized the electric conditions to enable recordings to be made over a long period of time.
Each sensing microelectrode of the MEA (P515A) had a square profile with a side length of ∼50 μm and was made from deposited platinum black nanoparticles, which increased the surface area by ∼200-fold (equivalent to 0.5 mm2) (Fig. 1A,B). From the capacitance (CME: 0.052 μF) and resistance (RME: 15 kΩ) of the sensing microelectrode, the estimated impedance was sufficiently low to follow a wide frequency range of electric signals (Taniguchi et al. 2013; Iwata et al. 2017). For instance, the impedance (ZME) of the sensing electrode at 0.1 Hz [∼31 MΩ = √ {1/(2π × 0.1 Hz × 0.052 μF) 2 + (15 kΩ)2}] was sufficiently small compared with the input resistance of the multi-channel amplifier used in this study (100 MΩ). Thus, the efficacy of electric signal transmission (Tr) was estimated to be ∼95% at 0.1 Hz [100 MΩ / √ {(100 MΩ)2 + (31 MΩ)2}].
Data analysis and field potential imaging
The arrayed field potential data were acquired at a 14-bit depth with a sampling interval of 50 μs. The digital resolution was reduced to 0.5–25 ms to display the time course of the pacemaker oscillations. Data processing, including digital filtering and linear spectrum analysis, was performed using commercial software (Kaiseki, Kyowa Electronic Instruments, Tokyo, Japan; Mobius, Alpha Med Scientific, Ibaraki, Japan; MATLAB software package, MathWorks, Natick, MA, USA).
For potential mapping, after reducing the digital resolution to 5 ms, field potential data were processed by a band-pass filter at 0.25–10.5 Hz. Numerous factors, including variations in RME and Ra and differences in IM between different populations of pacemaker and modulator cells, were considered to affect the magnitude of the field potential oscillation. Therefore, to compensate for these factors and reconstitute a smooth field potential map, the amplitude of the field potential recorded in the nth microelectrode region [ME(n)] was corrected by a normalizing factor [FN (n)]:
 where LS0.25–10.5 (n) is the density of the linear spectrum in the frequency range between 0.25–10.5 Hz for the field potential data at ME(n). To avoid excessive compensation, FN (n) was limited to within 1.0 ± 0.5. The sum of the LS0.25–10.5 values for all 64 Mes was used to represent the magnitude of the pacemaker activity. Subsequently, the 8 × 8 field potentials were interpolated with 50 points using a ‘cubic’ protocol, and each point of the field potential map was displayed as a ‘hot’ map (MATLAB software package) (Morishita et al. 2017).
Statistics
Numerical data are expressed as the mean ± S.D. Comparisons of normally distributed datasets were made using paired t-tests. P < 0.05 was considered statistically significant.
Results
Four basic patterns of pacemaker micro-coordination
Our dialysis membrane-reinforced MEA technique enabled electric activity in the GI tract of small animal models to be stably monitored. Smooth muscle sheets isolated from mouse ileum were mounted on an 8 × 8 MEA with an interpolar distance of 150 μm and a sensing region of ∼1 mm2. Each smooth muscle sheet was mounted beneath a piece of dialysis membrane that maintained the conditions required for electric recording, such as the access resistance (Ra) between the sensing and reference electrodes and the isolation resistance between the sensing electrodes, while allowing the exchange of ions and metabolites needed for spontaneous electric activity (Fig. 1A,B). In addition, a dihydropyridine Ca2+ channel antagonist (nifedipine) was added to suppress smooth muscle contraction without inhibiting pacemaker activity. The MEA detected field potential changes generated by the pacemaker activity of network-forming ICCs (Fig. 1C,D). This was confirmed by the MEA measurement in W/Wv mice that lacks network-forming ICCs in the ileum (Supplemental Fig. S1). The frequency of pacemaker activity ranged from 10–35 cycles per min (cpm), agreeing well with values reported for ICCs in the myenteric plexus region (Kito and Suzuki, 2003).
The pacemaker potentials recorded by the 8 × 8 MEA were reconstructed into pseudo-color potential images (Fig. 1E) in which positive and negative field potentials, reflecting outward and inward currents, were assigned dark and light colors, respectively. Visualization of the MEA measurements enabled us to classify the micro-coordination of the pacemaker potentials into four basic patterns: ‘expanding’, ‘migrating’, ‘bumpy’ and ‘colliding/converging’ activities (explained by examples in Fig. 1F; also see Supplemental Videos SV1–4.). Under the control condition (1305 events detected for 3445 s, N = 49 series of MEA experiments), ‘expanding’ and ‘migrating’ were two major activities with an occurrence of 7.76 and 9.51 events per min, respectively.
The ‘expanding’ pattern was defined by the initiation of spontaneous electric activity in the MEA sensing area and a subsequent progressive expansion of the active region while the activity of the initiating region gradually subsided. As a result, ‘expanding’ activity typically formed an annular shape during the late phase (Expanding in Fig. 1F; Supplemental Video SV1). ‘Migrating’ activity was defined by pacemaker activity propagating from a region adjacent to the MEA sensing area, and was manifested by an elongated active (light-colored) region that propagated approximately orthogonally to its long axis over the MEA sensing area (Migrating in Fig. 1F; Supplemental Video SV2). An additional feature of typical ‘migrating’ activity was a dark-colored area (indicating a transient positive potential) preceding the light-colored active area (further explanation is provided below).
By contrast, ‘bumpy’ activity was defined by a lack of spatiotemporal regularity in various micro-regions of the MEA sensing area, thereby indicating poor and spatially confined electric coupling. In the example (Bumpy in Fig. 1F; Supplemental Video SV3), spontaneous activity was initiated in the upper-left region and propagated toward the lower-right region while avoiding the lower-left region. A fourth type of micro-coordination pattern was termed ‘colliding/converging’ activity, in which multiple propagating pacemaker potentials interacted in the MEA sensing area. Namely, they collided and/or converged to either annihilate each other (Colliding in Fig. 1F; Supplemental Movie SV4) or merged and propagated in a different direction (explained later).
Variations in the micro-coordination of pacemaker activity
Visualization of the MEA field potential data enabled us to realize considerably large variations of spatio-temporal pacemaker activity. Even in the same muscle sample the initiating region of ‘expanding’ propagations fluctuated in the MEA sensing area (Fig. 2A). In this sample, a continuous recording demonstrated that most cases of propagating activity were of the ‘expanding’ type (12 out of 13 cycles), including the first three activities (in field potential traces in Fig. 2A). The first event was initiated in the upper-left region and propagated to adjacent regions (Expanding-1), the second event was initiated in the lower-right region (Expanding-2), and the third event was initiated near the center (Expanding-3) before expanding in an annular pattern (Supplemental Video SV5).

(A) Field potentials recorded continuously by three microelectrodes [ME(25), ME(28) and ME(31)] arranged transversely on the same muscle preparation. The field potential images show three consecutive ‘expanding’ activities that were initiated in different regions: upper-left (Expanding-1), lower-right (Expanding-2) and near the center (Expanding-3), corresponding to E-1*, E-2* and E-3* in continuous field potential recording, respectively. Mc: maximum potential used for color assignment. Traces of field potential waves recorded by three individual MEs are shown below each series of field potential images. Recorded MEs are indicated by the same color on the MEA. The electric potential wave near the initiating region (blue arrow) lacked a transient positive potential (red arrowhead). Representatives of N = 446 ‘expanding’ activities. (B) Field potential images showing three examples of ‘migrating’ activities propagating in different directions: longitudinally in the oro-anal direction (downward; Migrating-L1), longitudinally in the aboral direction (upward; Migrating-L2) and diagonally in the oro-anal direction (circumferentially leftward; Migrating-D1). Traces of representative field potential waves are shown along with each series of field potential images. Transient positive potentials (red arrowheads). Representatives of N = 546 ‘migrating’ activities. (C,D) Illustrations showing the cellular processes proposed to underlie ‘migrating’ activity and ‘expanding’ activity, respectively (see text for the explanation). The square cells represent pacemaker interstitial cells along with adjacent smooth muscle cells electrically connected, thereby increasing the electric capacitance.
‘Migrating’ activity exhibited variations in the direction of propagation (Fig. 2B). Notably, longitudinal propagation of activity in these two samples occurred in opposite directions, namely in the aboral (oral-to-anal, ordinally transporting) direction (Migrating-L1) and oral direction (Migrating-L2). In addition, pacemaker activity reversed in the circular (transverse) direction (Migrating-C1 and C2 in Supplemental Fig. S2), and propagated diagonally (Migrating-D1; Migrating-D2 in Supplemental Fig. S2). The finding that ‘migrating’ activity propagated in various directions rather than following the course of the muscle layers and enteric innervation suggests a major contribution of the ICC network (Fig. 1D) to the generation of this activity. We also noted that numerous features of propagation (i.e., the amplitude and rate as well as the direction) varied within the same muscle sample, even between two successive cycles of activity (Supplemental Video SV6).
Careful comparisons of potential images and field potential traces in ‘expanding’ activity indicated that the pacemaker potential lacked a preceding transient positive potential in the initiating micro-region (blue arrow in Fig. 2A). On the other hand, in ‘migrating’ activity, a dark-colored area preceded a light-colored area when activity propagated from the adjacent area of the MEA sensing area (Fig. 2B; Supplemental Fig. S2). This corresponds to a transient positive potential (red arrowhead) preceding the fast down-stroke of the pacemaker potential.
In ‘migrating’ activity, the light- and dark-colored areas are considered to be the ‘source’ and ‘sink’ of a local circuit current, respectively (see schematic illustrations in Fig. 2C and Supplemental Fig. S3). The sink progressively charges until the pacemaker current is activated in that region, thereby propagating the pacemaker activity sequentially along the muscle sheet, which acts as a ‘volume conductor’. The cells in the micro-region near microelectrode ME(2) are in the active (‘A’) state, generating voltage-gated pacemaker inward current. At the same time, ME(3) and ME(4) sense changes in field potential due to the propagation of the pacemaker current via gap junction channels which electrically couple the cells. This cell-to-cell propagation of current that converts the cells from the resting (‘R’) state to the charging (‘C’) state, charges the plasma membranes until voltage-gated inward current is activated. On the other hand, ME(1) senses field potentials while the cells in that micro-region are in a slowly oscillating (‘S’) refractory state (a plateau phase that is associated with both inward and outward currents of Ca2+-activated Cl- channels and K+ channels, respectively). Since the plasma membranes in the microregion near ME(1) are already positively charged, pacemaker current propagates toward the cells in the ‘C’ state, i.e., in the direction of ME(3) and ME(4).
A cellular model of ‘expanding’ activity, which does not have a transient positive potential preceding the pacemaker current, can be constructed by adding an ‘initiating’ (‘I’) state (scheme in Fig. 2D). We consider the initiation of pacemaker activity to involve a Ca2+ clock such as the activation of Ca2+-activated inward current in response to the spontaneous release of Ca2+ from the endoplasmic reticulum (ER) that we previously demonstrated (Aoyama et al. 2004; Saeki et al. 2019). After ‘expanding’ activity has been initiated by a Ca2+ clock mechanism, it can subsequently propagate away from the initiating region by the same mechanism as ‘migrating’ activity. Nevertheless, some of the pacemaker potentials near the initiating site did not have preceding positive potentials, indicating that propagation in the immediate vicinity of the initiating region was not always due to ‘migrating’ activity (Fig. 2A). In such cases, the pacemaker activity may have been propagating through a microregion that coincidentally contained cells in the ‘I’ state in addition to cells in the ‘C’ state. This possibility would agree well with the shift in the position of the initiating region that was observed in some samples.
Interconversion of micro-coordination patterns
In addition to the large variations seen within the same category of micro-coordination pattern, we also observed interconversion between micro-coordination patterns (N = 24 experiments). The frequency of interconversion differed substantially between samples. Continuous MEA recordings from a muscle sheet with frequent interconversions exhibited eight consecutive pacemaker activities: one ‘migrating’, four ‘expanding’ (with different initiating regions), two ‘colliding’ and one ‘bumpy’ (Fig. 3A). The ‘migrating’ activity occurred in the diagonal direction (Fig. 3B), and the ‘expanding’ activity was initiated in the upper-left region (Fig. 3C; the last ‘expanding’ event in Fig. 3A). The ‘bumpy’ event initially propagated from the lower region of the image in the aboral direction, but the activity only reached the upper-left region and failed to propagate to the upper-right region (Fig. 3D). In the first of the two ‘colliding’ events (Colliding-1: Fig. 3E), two pacemaker activities expanded from the upper-left and lower-middle regions to collide near the center, following which the merged activity propagated toward the upper-right region. In the second ‘colliding’ event (Colliding-2: Fig. 3F), two pacemaker activities initially propagated similar to the first ‘colliding’ event, but the merged activity did not propagate further due to the presence of a slowly oscillating potential in the middle-right region (‘bumpy’ spot in Fig. 3F). We speculate that the aberrant slow potential substantially prolonged refractory period of pacemaker cells in this region, resulting in a ‘bumpy’ event. Indeed, various types of regional aberrant electric activity were associated with ‘bumpy’ events. For example, in another sample showing an interconversion of micro-coordination patterns, multiple pacemaker activities occurred independently in the small recording area and were separated by a ‘bumpy’ spot where rapid potentials run frequently (Supplemental Fig. S4).

(A) Field potentials continuously recorded from a muscle sample by three microelectrodes [ME(10), ME(28) and ME(51)], showing interconversion between the four micro-coordination patterns. Asterisks indicate the pacemaker activities shown as potential maps in B–F (representative of N = 24 experiments). (B) Potential images of the ‘migrating’ activity shown in A (M*). (C) Potential images of the ‘expanding’ activity shown in A (E*). (D) Potential images of the ‘bumpy’ activity shown in A (B*) together with superimposed field potential traces recorded by different microelectrodes. (E) Potential images of the first ‘colliding’ activity shown in A (C-1*) together with superimposed field potential traces recorded by different microelectrodes. (F) Potential images of the second ‘colliding’ activity shown in A (C-2*) and the phase that followed. The superimposed field potentials reveal slow potentials in the middle-right region (‘bumpy’ spot), suggesting that this may have caused a ‘bumpy’ event in the next cycle of pacemaker activity.
Proof-of-concept through the action of 5-HT
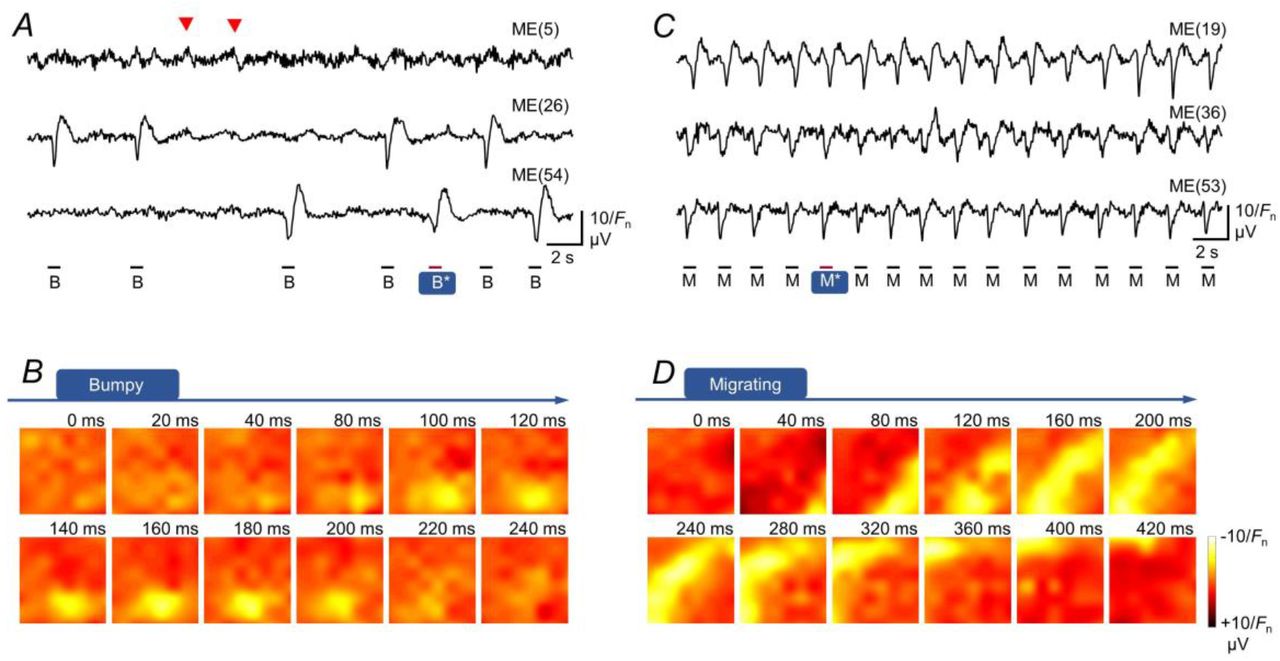
Since 5-HT is an important signaling molecule known to modulate GI movement (Spiller, 2011; Mawe and Hoffman, 2013), we examined whether 5-HT influenced the micro-coordination of pacemaker activity (Fig. 4). An example of a series of MEA recordings from a muscle sheet demonstrated frequent pacemaker activities of ‘expanding’ pattern: a typical cycle involved the initiation of activity in the upper-middle region in control conditions (Fig. 4A,B; Supplemental Video SV7), and those converted into ‘migrating’ pattern in the presence of 5-HT (100 μM), accompanied by the increase in the frequency (Fig. 4C,D; Supplemental Video SV8). Linear spectrum analysis of the 0.25–10.5 Hz frequency range (LS0.25–10.5Hz) revealed no significant effect of 5-HT on the magnitude of pacemaker activity (99.1 ± 29.8% of the control, P = 0.90, N = 16; Fig. 4E). The frequency of pacemaker activity was higher in the presence of 5-HT than in its absence (27.3 ± 7.2 cpm vs. 21.3 ± 7.8 cpm, P = 0.0003, N = 16; Fig. 4F). Notably, 5-HT increased the occurrence of ‘migrating’ activity (from 26.3% of 642 events in the absence of 5-HT to 55.9% of 799 events in the presence of 5-HT), while it decreased the occurrence of ‘other’ types of activity (from 23.7% of 642 events under control conditions to 5.3% of 799 events in the presence of 5-HT; Fig. 4G). In a muscle sheet, a typical change of the micro-coordination pattern was recorded: the frequent occurrence of ‘bumpy’ activity in control, on the other hamd, all ‘migrating’ activities in the presence of 5-HT (Fig. 5).

(A) Field potentials continuously recorded in a sample of ileal musculature in control medium. All activities are of the ‘expanding’ type. (B) Series of field potential images and superimposed field potential traces for the period marked with a bar in A. (C, D) Effects of 5-HT (100 μM) on pacemaker activity in the same sample. All activities are of the ‘migrating’ type. (E, F) Graphs showing the magnitude (E: linear spectrum, 0.25–10.5 Hz) and frequency (F: cycles per min [cpm]) of pacemaker activity under control conditions and in the presence of 5-HT. (G) Graphs showing the relative contributions of ‘migrating’, ‘expanding’ and ‘other’ types of micro-coordination patterns to pacemaker activity (representative of N = 16 experiments). (H,I) Effects of 2-methyl-5-hydroxytryptamine (2Me-5HT) on the magnitude (H: linear spectrum, 0.25–10.5 Hz) and frequency (I: cpm) of pacemaker activity (representative of N = 5 experiments). Linear spectrum and frequency datasets (in mV and cpm) were compared using paired t-tests. (J) Illustration showing a potential mechanism by which 5-HT might modulate the spatiotemporal characteristics of pacemaker activity.

Field potential traces recorded from different microelectrodes and corresponding field potential images obtained under control conditions (A, B) and in the presence of 5-HT (C, D) (representative of N = 9 experiments showing ‘bumpy’ events). The field potential images correspond to the B* (‘bumpy’ in the control) and M* (‘migrating’ in 5-HT) events indicated in the field potential traces. During the first half of the control recording period, premature activity-like potentials (red arrowheads) occurred between the ‘bumpy’ activities.
5-HT3 receptors exert excitatory influences on a wide range of GI functions (Talley, 1992; Spiller, 2011). Therefore, our subsequent experiments evaluated whether 5-HT3 receptors mediated the effects of 5-HT on pacemaker activity. The application of 2-methyl-5-HT (2Me-5HT, 50 μM), a 5-HT3 receptor agonist, increased the frequency of pacemaker activity (24.8 ± 5.1 cpm vs. 21.1 ± 2.7 cpm, P = 0.056, N = 5) with little or no effect on the magnitude (LS0.25-10.5Hz: 105.1 ± 10.9% of the control, P = 0.356, N = 5; Fig. 4H,I). Furthermore, the additional application of ondansetron (500 μM), a 5-HT3 receptor antagonist, in the presence of 5-HT decreased both the frequency (33.5 ± 5.7 cpm vs 24.1 ± 4.2 cpm, P = 0.041, N = 4) and magnitude (LS0.25-10.5Hz: 45.0 ± 29.1% of the value in 5-HT alone, P = 0.047, N = 4; Fig. 6) of pacemaker activity. These results suggested that 5-HT3 receptors were at least partly responsible for the effects of 5-HT. Nonetheless, the contribution of other subtypes of 5-HT receptors and the role of endogenous 5-HT remains to be elucidated in future experiments.

(A, B) Continuous measurement of MEA field potentials and potential images in the presence of 5-hydroxytryptamine, and (C, D) during additional application of ondansetron. The period of potential image processing is shown by the bars in field potentials (A, C). (E, F) Graphs showing changes in the magnitude (linear spectrum, 0.25–10.5 Hz) and frequency (cpm) of pacemaker activity after the application of ondansetron (representative of N = 4 experiments).
Discussion
Biological significance of the two major patterns
The dialysis membrane-reinforced MEA revealed surprisingly large variations in spatio-temporal pacemaker activity with perpetual changes between cycles, and enabled us to classify them into four basic patterns. Pacemaker potentials in the small intestine are synchronized with intracellular Ca2+ oscillations (Torihashi et al. 2002; Park et al. 2006). Therefore, the initiation of a pacemaker potential, such as ‘expanding’ activity in the MEA sensing area, is considered to reflect the Ca2+ clock mechanism operated by the co-existence of ryanodine receptors and inositol 1,4,5-trisphosphate receptors [IP3 Rs] in the ER of ICCs (Aoyama et al. 2004; Saeki et al. 2019) that consequently activates transmembrane Ca2+-activated Cl- channels such as anoctamin-1 (Dickens et al. 1999; Hwang et al. 2009). On the other hand, ‘migrating’ activity represents the propagation of pacemaker activity from a region adjacent to the MEA sensing area. The two major micro-coordinations, ‘expanding’ and ‘migrating’, are thus considered to represent spontaneity and synchrony/continuity in the MEA sensing area, respectively.
Typical ‘migrating’ activity was characterized by a dark-colored (positive potential) area at the front of the propagating waveform that was followed by a light-colored (negative potential) area. The spatiotemporal relationship between the light- and dark-colored areas implies that intercellular coupling causes the ICCs in the dark-colored region to become electrically charged by the intercellular pacemaker current that has been activated in the ICCs in the light-colored region (sink and source regions, respectively, in Fig. 2C). In other words, pacemaker activity propagates through a core conductor due to the formation of local circuits. This can be explained by the involvement of voltage-gated inward current due to TTX-resistant Na+ channels (Nav 1.5) (Strege et al. 2005) and/or atypical non-selective cation channels (Goto et al. 2004) in the pacemaker current during the propagation process. In addition, we need to bear in mind that the Ca2+-activated pacemaker current also forms the basis of coordinating GI movement, as long-distance coupling by a Ca2+ clock mechanism (van Helden and Imtiaz, 2003).
Both ‘expanding’ and ‘migrating’ activities showed large variations. Notably, ‘migrating’ activity was able to propagate in any direction (including oral, aboral, circumferential and diagonal), and ‘expanding’ activity was observed to propagate in all directions from the initiating region. Although ‘expanding’ activity generally propagated away from the initiation site by a mechanism similar to that of ‘migrating’ activity (i.e., intercellular currents), one interesting observation was that preceding positive potentials were not always observed (Fig. 2A), indicating mechanisms other than voltage-gated ‘migrating’ process in the propagation near the initiating region. A possible interpretation is that pacemaker activity had propagated through a micro-region that coincidentally contained cells in the ‘I’ state (i.e., in the process of initiating their own intracellular Ca2+ oscillations via a Ca2+ clock mechanism: Fig. 2E), and this proposal was consistent with the observed variations in the position of the initiating site (Fig. 2A). An alternative possibility is that a small group of cells neighboring the initiating region were activated by the intercellular propagation of Ca2+ or intracellular messengers (e.g., IP3) via gap junctions, which has been reported for other cell types (Halidi et al. 2011).
Alteration of micro-coordination patterns relating with motor function
The propagation of ‘bumpy’ activity was characterized by a lack of spatiotemporal regularity likely due to impaired electric connectivity between micro-regions. This disruption of electric communication may be attributed to irregularities of the refractory period in pacemaker cells within spatially localized areas. Some ‘bumpy’ events obviously occurred in micro-regions of impaired excitation (‘bumpy’ spot), associated with aberrant electric activities (rapid potentials in Supplemental Fig. 5C; slow potentials after ‘colliding’ events in Fig. 3F). In the small intestine, it has been shown that the aberrant slow electric oscillations generated in ICCs-DMP yield segmentation of the tract by waxing and waning the basal pacemaker activity in network-forming myenteric ICCs (Huizinga et al. 2014). Interestingly, our visualization study suggests multiple causes for ‘bumpy’ events. Further characterization of aberrant potentials in the microregion is merited in a functional correlation between electrical and mechanical activities. Likewise, ‘colliding/converging’ events of multiple activities represent the disruption of synchrony/continuity, and are thereby related with the occurrence of segmentation movement.
5-HT signaling is involved in promoting the propulsion of foodstuff through the intestine (Bülbring and Lin, 1958; Mawe and Hoffman, 2013). Therefore, the increase in the ratio of ‘migrating’ to ‘bumpy’ and ‘colliding/converging’ events during 5-HT application likely reflects a change in the functional state of the GI tract from segmentation-like movement to propulsion-like movement. In addition, a decrease in the occurrence of ‘bumpy’ activity is equivalent to an improvement in electric connectivity between network-forming myenteric ICCs that enabled pacemaker activity to propagate over a longer range. In turn, this allowed pacemaker activity originating in areas adjacent to MEA to reach the MEA-sensing area more often (Fig. 4H). In line with this notion, we previously demonstrated that 5-HT enlarges the active area of pacemaker Ca2+ oscillations in cellular organoids obtained from the ileum (Liu et al. 2011). We speculate that 5-HT might act to amplify basal pacemaker activity by suppressing aberrant spontaneous rhythmicity from other cell members (e.g., slow potentials as shown in Fig. 3F) as well as improving local electric conduction in micro-regions (also see Extended Discussion related with 5-HT and IBS).
Pathophysiology
In light of the effects of 5-HT and related chemicals, the pathogenesis of functional bowel motility likely involves excessive modification of pacemaker coordination during dysregulation of 5-HT signaling. Therefore, it will be interesting to establish whether ‘migrating’ activity is enhanced in hypermotility disorders that are associated with an elevation of 5-HT, such as bacterial enteritis, celiac disease and carcinoid tumors. Conversely, enhanced re-uptake of 5-HT would diminish bowel motility. Long (L) and short (S) variants of the serotonin-transporter-gene-linked polymorphic region (5-HTTLPR) are known to increase and decrease 5-HT uptake, respectively, by changing the expression of the 5-HT transporter (Lesch et al. 1996; Kunugi et al. 1996; Murphy and Lesch, 2008). A meta-analysis of epidemiologic studies reported that the LL genotype of 5-HTTLPR was a risk factor for constipation-predominant IBS (IBS-C) (Zhang et al. 2014), raising the possibility that reduced pacemaker activity might contribute to a reduction in propulsion. Interestingly, reduced inhibitory feedback on brain-gut interactions is associated with the development of IBS symptoms due to an amplification of gut activity in response to visceral stimuli via the autonomic nervous system (Hall et al. 2010; Holtmann et al. 2016; Hong et al. 2016). The pacemaker micro-coordination pattern, which underlies smooth and flexible GI movement, may be one of the factors involved in this brain-gut interaction. In addition, a small proportion of IBS-C cases are causally associated with genetic mutation of SCN5A, which encodes the pore-forming α-subunit of a TTX-resistant voltage-gated Na+ channel (Nav 1.5). Mutation of SCN5A underlies a congenital prolonged QT syndrome caused by prolongation of cardiac depolarization, and mutation of this gene can also induce IBS symptoms (Beyder et al. 2014); this is likely due to a functional disorder of network-forming ICCs that express this channel, because ‘migrating’ activity relies on the activation of voltage-gated inward current by the intercellular conduction of pacemaker current (see the spatiotemporal relationship between the dark-colored charging and light-colored active areas in Fig. 2B and Supplemental Fig. S2). We speculate that loss-of-function mutations of voltage-gated Nav 1.5 channels would impair ‘migrating’ activity. Furthermore, mutations of atypical non-selective cation channels, if expressed in human ICCs, might also be a potential cause of IBS.
Conclusion
The visualization of dialysis-membrane-reinforced MEA field potential data revealed large variations in pacemaker micro-coordination, suggesting that the dynamics of pacemaker activity in micro-regions likely underpins flexible and sophisticated movement of the GI tract. Nonetheless, the pacemaker micro-coordination was classified into four basic patterns. ‘Expanding’ and ‘migrating’ patterns were two major patterns, defined by the initiation in and propagation to the MEA-sensing area. Therefore, these patterns represent spontaneity and synchrony/continuity of the area, and were considered to reflect duplicating pacemaker current systems of Ca2+ oscillation-activated and voltage-gated channels, respectively. ‘Bumpy’ and ‘colliding/converging’ patterns represented the local impairment of conduction and the interaction of multiple activities, respectively, both indicating disruption of synchrony/continuity of the area. The fact that 5-HT modulated the frequency of these patterns agrees well with its action that causes a shift in the contractile function of the GI tract from segmentation to propulsive motions. Further refinement of the methodology and criteria for classifying micro-coordination are required (for example subclassification including the amplitude, direction and distance of propagation in each event, etc.). Despite this, our study provides a proof-of-concept that our method employing image classification of pacemaker micro-coordination enables the quantitative assessment of spatio-temporal excitation underlying GI motility in health and disease, and is especially useful in small model animals.
Author contributions
NI: Investigation, Data curation, Visualization, Validation, Writing – review & editing
CT: Investigation, Data curation, Visualization
MY: Investigation Data curation.
NM: Investigation Data curation, Writing – review & editing.
NK: Conceptualization, Validation.
SN: Conceptualization, Methodology, Investigation Data curation, Validation, Funding acquisition, Supervision, Writing – original draft.
Funding
This work was partly supported by a grant-in-aid for Scientific Research from the Japan Society for the Promotion of Science (JSPS No. 19H03558) and research grants from the Japan Agency for Medical Research and Development (AMED No. 16ek0210037h0003).
Acknowledgments
We are grateful to Tatsuhiro Noda, Hirotaka Morishita and Tomoka Nomura (Department of Cell Physiology, Nagoya University Graduate School of Medicine) for their help with the MEA experiments.
References


