

Abstract
How cells control their size is a fundamental question of biology. In bacteria, cell shape is imposed by the extracellular cell wall, in particular by the continuous polymer of peptidoglycan (PG) that surrounds the cell. Thus, bacterial cell morphogenesis results from the coordinated action of the proteins assembling and degrading the PG shell. Remarkably, during steady-state growth, most bacteria maintain a defined shape along generations, suggesting that an error-proof mechanism tightly controls the process. In the rod-shaped model for Gram-positive bacteria, Bacillus subtilis, it is well known that the average cell length varies as a function of growth rate but that cell diameter remains constant throughout its cell cycle and across growth conditions. Here, in an attempt to shed light on the cellular circuits controlling bacterial cell width, we developed a screen to identify genetic determinants of cell width in B. subtilis. Using HCS (high-content screening) fluorescence microscopy and semi-automated measurement of single-cell dimensions, we screened a library of ∼ 4000 single knockout mutants. We identified 13 mutations significantly altering cell diameter, in genes that belong to several functional groups. In particular, these results highlight a link between cell width control and metabolism.
Introduction
The bacterial landscape is surprisingly filled in by a variety of shape that, at the single bacterial species level, are usually highly conserved (1). The rationale behind a specific shape and its selective value remains speculative in most cases (1), as are the molecular mechanisms enabling a specific shape to be determined and maintain across generations.
The shape of the cells directly depends on that of their cell wall (CW). The CW is composed of a peptidoglycan (PG) scaffold that forms a rigid shell responsible for the mechanical properties of the cell envelope and, in Gram-positive (G(+)) bacteria, of PG-linked glycopolymers, the most abundant being the wall teichoic acids (WTA) (2). The PG sacculus is a contiguous matrix of circumferential sugar strands crosslinked by perpendicular peptide bridges (3). Rod-shaped bacteria like Bacillus subtilis and Escherichia coli, the models for G(+) and Gram-negative (G(-)) bacteria respectively, use two different PG-synthesizing machineries: the divisome and the elongasome (4, 5). The divisome is required for cell division to build the septum that, upon cell separation, will become the new polar caps of the resulting daughter cells, while the elongasome synthesizes the cylindrical sidewall. The latter comprises two machineries working independently or semi-independently: some involving aPBPs (class A penicillin binding proteins), bifunctional enzymes with transpeptidase (TP) and transglycosylase (TG) activity, and some called “Rod complexes” containing the TG RodA and bPBPs (class B PBPs) carrying mono-functional TP activity such as PBP2A and PbpH in B. subtilis (5, 6). The prevailing model postulates that the Rod complex processively builds the bulk of the organized PG meshwork, while aPBPs would perform limited and localized, potentially unoriented, strands insertion (6, 7). In B. subtilis, and consistent with this model, aPBPs are dispensable (8, 9) while most proteins of the Rod complex are essential such as RodA (6, 8, 10) or co-essential as the bPBPs PBP2A and PbpH (11). This reflects that a failure in the proper establishment of the PG mesh compromises the cellular integrity.
In addition to the TP and TG enzymes, the Rod complex includes other essential morphogenetic proteins: MreC and MreD, presumed regulators of the activity of the complex (4, 12), and the actin homolog MreB and in B. subtilis its paralog Mbl, putative coordinators of the complex recently suggested to orient the direction of the synthetic machineries (5, 13). To note that the B. subtilis genome encodes a third mreB paralog, mreBH, that becomes essential only in absence of the other paralogs, under stress conditions or at low Mg concentration (14, 15). RodZ, a protein of unknown function, is a suspected member of the rod-complex as well. However, despite its critical role for rod shape maintenance in both G(-) bacteria Caulobacter crescentus and E. coli, the protein is essential only in B. crescentus (16–19). Its involvement in shape control and its essentiality are even less clearly established in G(+) bacteria. Described as essential in B. subtilis in an early report (20), several insertional or deletion mutants have been reported since then, displaying minimal shape defects (21–23). It has long been known that rod-shaped bacteria vary their cell size depending on the growth conditions and in particular on nutrient availability (24, 25). Cells growing fast have a larger volume that in slow growth condition, a relationship often referred to as the (nutrient) growth law (for a review on this topic, see (26) or the very detailed (27)). However, while E. coli cell width varies greatly (up to 100%) and concomitantly to its length (24, 28–30), B. subtilis cells adjust their length but maintain a virtually constant diameter regardless of the growth conditions (30–33). Only limited variations of the width (in the 50 nm range) have been recently reported, presumably linked to the growth phase (34). This remarkable consistency suggests that cell width is a physiological parameter somehow encrypted in the genome of B. subtilis, and that it must be carefully monitored during growth to correct for potential deviations to its nominal value. Yet how rod-shaped bacteria check and balance their diameter remains unclear.
Recently, Garner and co-workers showed how the balance between the Rod and aPBPs elongation machineries influence cell diameter (7). They proposed a model in which the activity of aPBPs introduce disorganized materials into the PG meshwork, enlarging the tight cylinder imposed by the Rod complex (7). Still, in the absence of PbpA (B. subtilis main aPBPs, encoded by ponA), albeit thinner, cells remain perfectly rod-shaped indicating that the ‘check & balance’ process is still in place (35, 36). Conversely, alteration of the Rod complex leads to increase cell diameter, either because of the raise of the aPBPs/Rod ratio or because of the rounding of the cells consecutive to the absence of elongation, the two intertwined causes being difficult to differentiate. Indeed, depletion of each essential (or co-essential) part(s) of the Rod complex, RodA, MreC, MreD, PBP2A/PbpH or MreB/Mbl/MreBH, leads to spherical cells following the absence of PG elongation (11, 37–40). It is thus not surprising that all mutants reported to display an enlarged width are involved in CW homeostasis, a phenotype frequently accompanied by more or less dramatic shape defect such as uneven diameter, bulges, swelling and frequently lysis. This can be observed for example with the single deletion of the mreB or mbl paralogs (41, 42), or with the partial depletion of the essential MurB and TagD that catalyze key steps in the synthesis of the PG and the teichoic acids (TA) precursors, respectively (34, 43).
In contrast, a limited number of mutants of B. subtilis display a reduced cell diameter to our knowledge. In addition to the previously mentioned ponA, deletion of ltaS (yflE), yfnI (yetP, ltaSA) or yqgS, encoding lipoteichoic acid synthases (44, 45), or the simultaneous inactivation of the cell division genes ezrA and gpsB (35) drive to reduce cell width. Similarly, the absence of MreBH or the PG hydrolase LytE, two proteins shown to interact in a so-called “LytE-system”, was reported to lead to a slightly reduced diameter (14, 44, 46). To note that curiously the simultaneous inactivation of mreBH and lytE was reported to widen B. subtilis (44) while a lytE knock out displayed a wild-type width in a separate study (47). Overall, the mechanism(s) at stake for cell width maintenance remains mysterious.
Here, we aimed at identifying at the genome scale level the determinants involved in cell width control during rapid exponential growth. We screened a complete organized collection of B. subtilis deletion mutants (22) using High-Content Screening microscopes (HCSm). Our protocol for mid-throughput analysis allowed us to uncover several new genes that may work to maintain cell diameter. These are involved in cell wall synthesis, cell division, metabolism, and translation, suggesting that cell width homeostasis results from the combined action of several cellular processes. Finally, our analysis suggests that two main routes are leading to cell width alteration of the cell.
Results
Bacillus subtilis displays limited width variability during rapid exponential growth
It has long been accepted that, in contrast to E. coli, the cell diameter of B. subtilis cells remains virtually constant regardless of the growth rate (30, 31). We wondered how variable the cell diameter could be in isogenic B. subtilis populations during fast exponential growth. We used MicrobeJ, a FIJI plugin (48–50), to perform cell segmentations and quantify their diameter (see M&M, Sup. Table 1, Sup. Information). We first compared six independently acquired datasets of wild type B. subtilis cells grown exponentially in rich LB medium (Fig. 1A). We observed that the average width remained remarkably constant between experiments (below 2 %; Sup. Table 2). Also, the cell-to-cell variability of the measured width in each population (standard deviation to the mean, sdm) remained low, ranging from 0.071 to 0.089 µm across the different replicates (Sup. Table 2). These variations might reflect potential -true-differences of cell diameter or just the error of our measurements, but in either case variability was low. This reproducibility allowed us to expect the detection of potentially small variations of cell diameter between mutant strains. We next compared the diameter of B. subtilis cells exponentially growing in two different media, rich (LB) and poor (S), and thus supporting different growth rates. In agreement with previous reports (30, 31), we found no significant difference of width between cells grown in rich and poor media (Fig. 1B). The cell-to-cell variability was similar in the two media, indicating that this variability is independent of the growth rate. Taken together, these experiments indicated that B. subtilis exerts a tight control over its diameter, whose variability remains below 2 % in average across conditions and replicates.
Settings used for MicrobeJ pluggin
Average width differences (%) across replicates

A. Comparison of cell width distribution of six independent cultures of fixed wild-type B. subtilis cells grown in rich (LB) medium. One-way ANOVA statistical analysis showed no significant differences between the replicates (Sup. Table 2). B. Comparative cell width distributions of fixed wild-type B. subtilis cells grown in rich (LB) and minimal (S) media. C. Qualitative (images) and quantitative (distribution of measured cell width) comparisons of data acquired on a wide-field epifluorescence microscope and a confocal HCSm, using the wild-type, ΔmreB and ΔponA mutant strains of B. subtilis. Fluorescent images were acquired on cells grown to mid exponential phase (0.2<OD600 nm<0.3), fixed and stained with the FM1-43fx membrane dye. Discrete fluorescent foci result from cell fixation. Scale bar, 5 µm. Width distributions are displayed as violin plots with the broken line indicating the mean. Statistical analyses were performed using (A) a one-way ANOVA or (B, C) nested t-tests. For each statistical test, **** = P<0.0001, *** = 0.0001<P<0.001, ** = 0.001<P<0.01, * = 0.01<P<0.05, and ns = P>0.05. When significant, the difference between the means, expressed as a percent, is indicated on the plots. B and C are compilations of at least two independent experiments.
HCS microscopy allows screening for small phenotypic variations of cell width
We next defined conditions that would minimize false positives in a microscopy-based screen of a genome-scale deletion library of B. subtilis. First, cells were fixed to obtain snapshots of their dimensions during exponential growth. Fixation induced a slight reduction of cell width relative to live cells (Fig. Sup. 1A), but prevents issues resulting from the time required for the preparation of 96-well plates and the image acquisition inherent to the HCS method. Second, the growth medium was supplemented with 20 mM of MgSO4 to prevent perturbation of growth and/or the estimation of the cell width in mutants defective for CW synthesis that might display irregular shapes or lyse. In B. subtilis, high levels of magnesium are known to reduce the activity of PG hydrolases (51), limiting the defects of mutants affected in CW formation and allowing propagation of otherwise lethal mutations (52–54). Importantly, while magnesium rescues most morphological defects, such mutants still present an abnormal width (52, 53). Again, we noticed that the addition of Mg2+ to the growth medium slightly reduced the average width of wild-type cells (Fig. Sup. 1B), as previously reported (35). These slight width differences detected either when cells were fixed (Fig. Sup. 1A) or when grown in high magnesium (Fig. Sup. 1B) confirmed our ability to detect small variations of width between populations.

A. Cell width of live and fixed cells were measured using the FIJI plugins MicrobeJ and Chain tracer, or by manual measurements (see Material and methods). The differences between the means of live and fixed cells (in %) is specified for each method. B. Comparative cell width distribution of fixed wild-type B. subtilis cells grown in LB with and without 20 mM magnesium supplementation. Broken line: mean. Statistical analysis were performed using nested t-tests, were **** = P<0.0001, *** = 0.0001<P<0.001, ** = 0.001<P<0.01, * = 0.01<P<0.05, and ns = P>0.05. Differences between the means, expressed as a percent, is indicated on the plots. Data are compilations of at least two independent experiments.
Next, to demonstrate the sensitivity of our assay, we tested in our conditions the mreB and ponA mutants, known to be wider and thinner, respectively, than wild-type cells (36, 41). As shown in Figure 1C, the altered width of mreB and ponA mutants was unambiguously detected when cells were grown in high Mg2+, fixed and observed in either our conventional epifluorescence microscope or the HCSm. The cell-to-cell variability and the average cell widths noticeably increased when measurements were performed on HCSm-acquired images but the relative difference of width between the two mutant strains relative to the wild-type were perfectly conserved (Fig. 1C). These control experiments showed that mutants affected for the control of width could be identified in our medium-throughput HCSm approach.
Following up our promising preliminary controls, we screened the complete B. subtilis kanamycin-marked ordered deletion library (BKK) (22), which contains 3983 single-gene deletion mutants of the 168 strain (GenBank Al009126), thus ∼93 % coverage of its genome open reading frames (Fig. 2, see M&M for details). In order to prevent plate-to-plate fluctuations and to compare the widths of the mutants across plates, each mutant’s width was expressed relatively to the average cell diameter per plate (ADP (see M&M; Fig. Sup. 2A). The average of the ADPs of the 48 plates and the average cell width of the wild-type strain grown and imaged in the same conditions showed no significant difference (Fig. Sup. 2B). For each single mutant, we calculated the delta between its average width and the ADP of its plate (Sup. Table 3). The 3983 Δwidth obtained present a Gaussian distribution, spreading from - 13.9 to +23.4 % but with 90 % of the values comprised in a narrow +/- 5 % variation to the mean (Fig. 3A). Next, we arbitrarily setup a cutoff of the 1 % most affected strains (0.5 % largest and 0.5 % thinnest) (Fig. 3A). The 40 mutants selected displayed a difference in diameter > 8 % to that of their ADP (Sup. Table 4). Using low-throughput epifluorescence microscopy imaging and the wild type B. subtilis strain as a reference, we checked the phenotypes of the selected mutants (see M&M), while the deletion in each mutant was verified by PCR.

A. ADP of the 48 96-well plates containing the BKK library. Each ADP is the mean of all width (∼18 700) on a plate, and error bars are the standard deviations to the mean (SDM). The 48th plate has a smaller value because the acquisition was performed on the epifluorescence microscope (with 100x magnification) and not on the HCSm. B. Comparison of the average of the ADPs of all 48 plates and the average width of a wild-type cell population measured with the HCSm. There is no significant difference between the two values according to the Mann-Whitney non parametric test, indicating ADPs are similar to the wild type diameter (1.160 µm vs 1.153 µm, respectively). Similarly, the ADP calculated for the 48th plate is close to the wild-type strain measured in the corresponding microscope (0.975 µm vs 0.964 µm, respectively). Error bars are SDM.
Cell width of mutants of the BKK collection
Width of the 0.5% largest and thinnest selected strains

Screening of the B. subtilis BKK collection arrayed in 96-well plates was based on automated image acquisition using an HCSm. The MicrobeJ plugin of FIJI was used for cell segmentation and width measurements. Average cell diameter of each mutant was compared to the average diameter of all cells on the plate (ADP). Candidates where confirmed by measuring their diameter on images acquired with an epifluorescence microscope, relative to the wild-type strain. The selected mutants were then backcrossed into a wild type background before final width determination over triplicate experiments.

A. Width difference (Δ width) of each mutant relative to the ADP of its plate. Dotted lines indicate the cut-offs for the 0.5 % largest (top) and thinnest (bottom) mutants. Red dots mark the 13 mutants with confirmed diameter defects after deletion were backcrossed into the wild-type strain. B-C. Cell width (B) and cell length (C) distributions of the 13 selected (backcrossed) mutants. Red and green plots correspond to thinner and wider mutants respectively, compared to their parental wild-type strain (blue). Broken line: mean. Data are compilations of three independent experiments. The difference between the means of each mutants and the wild-type is indicated, in %. Statistical significance between the mutant and the wild-type strain width (B) and length (C) were calculated using nested t-tests (see Table 1 for P-values). All differences were significant except for the mean width of the ΔminJ mutant (B) and the mean length of the ΔcwlO mutant (C). D. Phenotypes of the backcrossed mutants segregate into four classes based on their width and length defects. ΔminJ and Δrpe mutants form both thinner (arrowhead, 1) and larger (arrowhead, 2) cells. Displayed are images of FM1-43fx membrane-labelled fixed cells. Scale bar, 5µm.
Cellular parameters of the confirmed width-control defficient strains
In only half of them the wider or thinner phenotypes could be confirmed when using a low Δwidth cutoff of 4%, suggesting the presence in our selection of several false positive (Fig. 2 and Sup. Table 4). Nonetheless, all mutants with a confirmed deletion were kept to the next step and backcrossed into the wild-type background before attempting further characterization, in order to prevent the possibility that some phenotypes might be unlinked to the deletions (Fig. 2, Sup. Table 5).
B. subtilis strains used in this study
Cell wall and central carbon metabolism genes are linked to cell width control
Next, we carefully measured the diameter of the 40 backcrossed mutants, using low-throughput epifluorescence imaging (Sup. Table 4). Confirming the trend observed during the previous step, several mutants presented only a limited width difference with that of the parental strain and were rejected. Choosing a cautious Δwidth cutoff of 8%, we selected 12 mutants significantly and reproducibly, over 3 independent experiments, wider (7) or thinner (5) (Fig. 3B, Table 1 and Sup. Table 4). We also kept the ΔminJ mutant despite its non-significant Δwidth (-1 %) because it displayed an unusually large distribution of widths (Fig. 3B, 3D, Sup. Table 4). The width phenotypes were conserved for all 13 mutants when grown without magnesium supplementation (Sup. Table 4), confirming that at the contrary to the bulging, swelling and lysis observed as consequences of CW synthesis impairment, magnesium cannot bypass the alteration of width. This might suggest that the width alteration is not a result from uncontrolled autolysin activities.
Thus, we identified nine new genes affecting cell width of B. subtilis and we confirmed the phenotype of four out of the ten genes previously reported to affect cell width, present in the BKK library and expected to be found with our method (Sup. Table 6): rodZ, cwlO, ftsE, and ftsX. To note that despite not being in the top 1 % of genes retained for further analysis, ponA still displayed a significantly reduced width in the first step of our screen (Sup. Table 3), as expected (Fig. 1C). However, mreBH, lytE and the three recently spotted genes encoding lipoteichoic acid synthases (ltaS, yqgS, yfnI) did not display a significant width difference in our experiment (Sup. Table 3).
Genes reported to affect cell width in B. subtilis
The genes identified in our screen belong to different functional categories and, interestingly, a majority are not directly involved in CW homeostasis (Table 1). In addition to the previously reported ftsE, ftsX, cwlO, and rodZ, only dacA belong to this group. This gene encodes the bPBP PBP5 involved in PG maturation (55, 56).
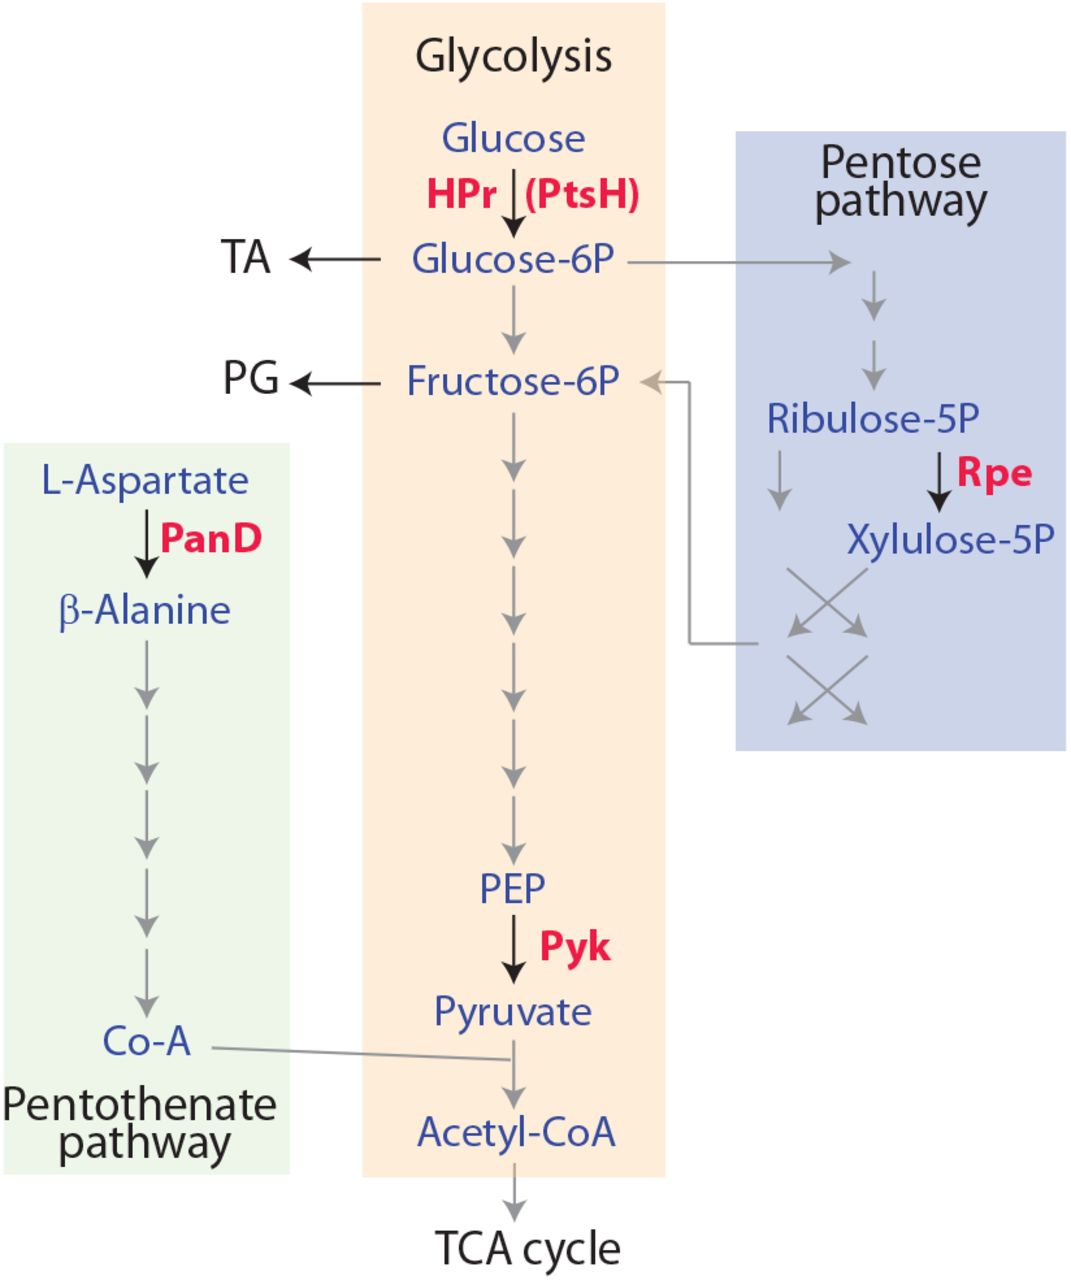
The second most represented functional category among our selected width-deficient mutants is the metabolism (Table 1). One gene, guaA, is involved into purine nucleotide synthesis (encoding the GMP synthetase (57)), while the four others are part of the central carbon metabolism (Fig. Sup. 3): pyk, specifying the pyruvate kinase acting in glycolysis (58); ptsH, encoding HPr, a component of the sugar phosphotransferase system (PTS) (59); panD, involved in coenzyme A biosynthesis (60) and yloR (rpe), probably encoding Rpe (ribulose-P-epimerase) of the pentose phosphate pathway.

The four genes selected in our the current screen and involved into carbo metabolism, panD, ptsH, pyk and rpe and encoding enzymes required for the pentothenate, glycolysis and penthose pathway respectively. PanD converts L-asp into β-alanine, the first step of the pathway leading to Coenzyme A (Co-A) synthesis. Co-A is used in glycolysis as a substrate for Pyk to form acetyl-CoA. HPr (encoded by ptsH) is a bi-functional protein acting also in glycolysis as a part of the PTS (phosphotransfer system) required for the import/phosphorylation of sugars, and in the regulation of the carbon catabolite control, as an allosteric regulator with CcpA. Rpe produces xylulose-5P in the penthose pathway.
Noteworthy, while most mutants involved in CW synthesis are larger (Table 1 and Sup. Table 6), four out of five of them were thinner (Fig. 3B, 3D; Table 1). Only the rpe mutant displays a wider diameter but intriguingly, the phenotype was opposite in the mutant strain from the BKK collection, a point we will return to below. This observation might suggest that a common mechanism could be at play for each functional category.
The three remaining genes selected are involved in cell division (minJ (61, 62)), translation (yaaA, encoding a ribosome assembly factor (63)), or have an unknown function (ybzH). Using the prediction HHPRED tool, YbzH was predicted to be a putative transcriptional repressor of the ArsR family (64).
ΔminJ and Δrpe display a unique phenotype of diameter instability
The mutant strains selected in our screen displayed a thinner or a larger mean diameter relative to wild-type cells. Although their mean width differs, these mutants still control their diameter to maintain it constant over generations. Interestingly, two mutants, Δrpe and ΔminJ, displayed a distinctive high dispersion of width values among their population (Fig 3, Sup. Table 4).
The Δrpe mutant (BKK15790) was first selected based on its slim width (-11.4 % relative to wt) during the systematic analysis (Sup. Table 4). Surprisingly, once backcrossed into our 168 background, the rpe KO strain (RCL856) displayed the opposite phenotype with an increased average diameter (+11 %) compared to the wild type (Fig. 4A; Sup. Table 4), nonetheless indicative of a defect of width control. The most striking difference between the two mutants is however not their average width but their dispersion (Fig. 4A). While the BKK rpe-shows a SD similar to the control strain with cells harboring thin and regular diameters, the backcrossed mutant presents the broadest width variability (SD 0.179) of our selection (Fig. 4A, 3B), and arguably the most dramatic loss of control. This mutant also forms small colonies, indicative of a growth defect, a characteristic not shared with its BKK parent (Fig. Sup. 7). This suggests that the BKK strain might have acquired some suppressor mutation(s), partially restoring its growth and shape control and reducing the width dispersion to the price of a smaller diameter.
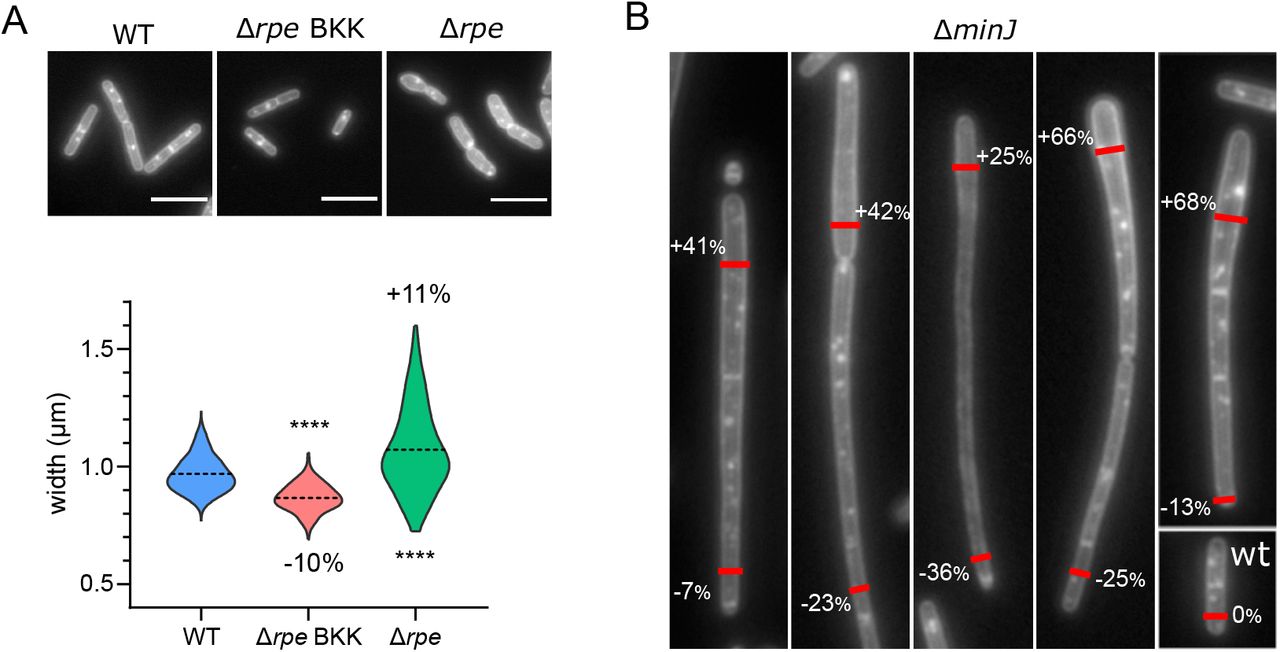
A. Images of membrane-labelled strains and corresponding distribution of cell widths for the wild type strain, Δrpe from the BKK collection and Δrpe backcrossed into 168 wild type background. Broken line: mean. Data are compilations of two independent experiments and statistical significance between mutants and the wild type strains was calculated using the Mann-Whitney non parametric test (**** = P<0.0001; *** = 0.0001<P<0.001; ** = 0.001<P<0.01; * = 0.01<P<0.05; ns = P>0.05). B. Images of membrane-labelled ΔminJ mutant, presenting varying width along single cells or chain of cells. This phenotype is observed in approximately 15% of the population. Percentages indicate the difference of width compared to that of the wild type strain, at the position of the red marks.
The second strain with an instable diameter is ΔminJ. This mutant of the “Min” system, a complex in charge of controlling the placement of the divisome, is known to present a reduced septum formation leading to long cells (61, 65). Although its average cell width was marginally affected (-1%), the standard deviation was unusually large, and extreme widths ranged from 0.6 to 1.5 µm (Fig. 3B). As observed on Fig. 4B, some filamentous ΔminJ cells displayed unusually large and small diameters. This phenotype affected only a fraction of the population (∼15 %), which could explain why it was not previously reported. A unique trait of this mutant is that the diameter varied within single chains or even single cells as well (Fig. 4B). This loss of width control was not randomly distributed along the cell length but presents a polarity, with cells progressively widening or thinning from a given diameter, suggestive of some kind of gradient between the poles.
RodZ: a non-essential protein involved in cell shape control
We next brought a special attention to rodZ, encoding a putative component of the CW machinery, whose mutant appeared wider and longer than the wild type strain in our screen (Fig. 3, Table 1, Sup. Table 4). rodZ was reported to be essential in B. subtilis (20) as it was shown beforehand in G(-) bacteria (16–19). But another team reported more recently that the inactivation of the gene led to robust growth and only mild shape defects (23). In addition, two collections to our knowledge include a rodZ inactivation mutant (21, 22). Facing an apparent discrepancy, here we decided to construct by homologous recombination a fresh, independent rodZ deletion mutant (CcBs351; see Supplementary Information). Similarly to the backcrossing of the ΔrodZ from the BKK library (BKK16910) into the wild-type 168 strain (RCL828) in which countless positive transformants were obtained, the mutant was readily constructed, confirming the non-essentiality of the gene in B. subtilis 168.
We assayed the various rodZ mutants to our disposal for growth and shape in different conditions. In rich LB medium, rodZ KO strains (CcBs351, BKK16910, RCL828) displayed no difference of growth with their parental wild type B. subtilis strain (Fig. 5.A). Similarly, their shape could not be easily discriminated (Fig. 5.B), and only the quantification reveals the difference of cell diameter (Fig. 5.C). We confirmed however the presence of minicells (Fig. Sup. 5B), indicative of the perturbation of the division process (65). When grown on the slightly poorer MSM, a casamino-acids-based medium, phenotypes of rodZ mutant cells worsen: cells widen, frequently divided asymmetrically (Fig. 5.B, D; Fig. Sup. 5A) and shown a solid but slightly reduced growth rate compared to that of the wild type (Fig. 5.A). This reduction of growth in MSM might not be directly linked to the richness of the medium since all strains grew almost identically in the much poorer citrate/glucose-based S medium (Fig. Sup. 6A.). Noticeably, a difference appeared between the mutants, with the BKK16910 displaying a growth lag and a reduced maximum cell density compared to the others. Since the backcrossed deletion of the BKK16910 (RCL828) showed no difference with our independently constructed deletion mutant CcBs351, we inferred that some unknown genetic differences in this strain rather than the deletion itself could be at play.

A. Average cell lengths as a function of average cell widths for each mutant. Functional categories are color-encoded: orange for metabolism, blue for CW homeostasis and white for others. Wild type (wt) strains is labelled in green. B. Average generation time (GT), length (L), surface to volume ratio (S/V) and width (W) of cell width deficient mutants compared to the wt. The dotted line marks the level of the average wt value. Generation time are calculated on populations (see M&M) and are the average of 4 independent experiments. Length, S/V ratio and width data are calculated per cell and compiled data from three independent experiments. Statistical significance of the difference between each mutant and the wild type was calculated using either a Mann-Whitney non parametric test (generation time) or a nested t-tests (length, S/V ratio and width) and indicated using P-values, as follows: **** = P<0.0001; *** = 0.0001<P<0.001; ** = 0.001<P<0.01; * = 0.01<P<0.05; ns = P>0.05. C. Average length and width as a function of the generation time (GT). Upper panel: metabolism-related mutant; lower panel: CW homeostasis-related mutant. R² of the linear regressions (lines) are indicated on the panels. Data are compilations of at least three independent experiments.

A. Epifluorescence images of B. subtilis cells grown to mid exponential growth phase, colored with FM1-43Fx membrane dye. Strains are wild type 168 (‘wt’; 168), deleted for rodZ in 168 background (‘351’, CcBs351), rodZ- from BKK library (‘BKK’, BKK16910), rodZ- from BKK backcrossed into 168 wt (‘BC‘, RCL828), wild type PY79 (‘PY’, PY79), and deleted for rodZ in PY79 background (‘628’, RCL628). B. rodZ mutants form minicells during growth in LB medium. Display are images of CcBs351 grown to mid exponential growth phase in LB medium, colored with FM1-43Fx and imaged by phase contrast (right panels) or epifluorescence (left panels) microscopy. Arrowheads point to minicells. Scale bars (A-B): 1 µm.

A-B. Typical growth curves of wt and rodZ mutants of B. subtilis in rich LB (blue), poor MSM (green) and S (orange) media. Strains are derivative of the wt 168 strain (A) or PY79 (B), and either wt (plain; 168 or PY79), or deleted for rodZ- (dashed; CcBs351 or RCL628). Panel A has two extra curves for rodZ- from BKK library (circles; BKK16910) and rodZ- from BKK backcrossed into 168 wt (dotted; RCL828). C. Cell width distributions of the rodZ mutant (black) and its parental wild type PY79 strain (red), grown to mid exponential phase in LB and MSM media. Difference of width between the two strains was estimated with a nested t-test (**** = P-value <0.0001).

Chromosomal DNA of strain BKK15790, K-O for rpe, was transformed into wild type B. subtilis 168. Transformants display a ‘small-colony’ phenotype indicative of a growth defect. Here are shown isolates colonies of a typical transformant (RCL856), and its parental wild type (WT; 168) and rpe mutant from the BKK collection (BKK15790), streaked on LB plate and grown for 24h at 37°C.

A. Typical growth curves of wt and rodZ mutants of B. subtilis grown in rich LB (blue) and poor MSM (green) media. Strains are wt (168; solid line), rodZ- in 168 background (CcBs351; dashed line), rodZ- from BKK library (BKK16910; open circles) or rodZ- from BKK backcrossed into 168 wt (RCL828: dotted line). B. Epifluorescence images of B. subtilis strains (same as in A), FM1-43Fx membrane-labelled, grown to mid exponential phase in LB or MSM media. C-D. Distribution of cell width of strains (same as A) grown to mid exponential phase in rich LB (C) or poor MSM (D) media, in at least two independent experiments. Cell widths were determined using the manual method. Statistical analyses were performed using nested t-tests, and **** indicates a P-values <0.0001.
Pursuing on the idea that the genetic background could affect the phenotype of the rodZ mutant, and realizing that the original mutation attempt from Muchova and coworkers was performed into the distantly related PY79 wild type B. subtilis, we transfered our rodZ deletion into the PY79 strain (CcBs628). However the shape defects (cell widening, asymmetric division) for rodZ were similar in both the 168 and PY79 backgrounds (Fig. Sup. 5A.). The only notable difference was a strong growth lag correlated to the richness of the medium, for the rodZ KO in PY79 (Fig. Sup. 6B).
Taken together, we concluded that rodZ is not essential for growth, that it displays shape and division defects that worsen based on the composition of the medium (which critical factor(s) remain to be identified) and that the genetic background influences this sensitivity to the medium.
Analysis of the mutants’ growth and shape suggest distinct causes are responsible for altered cell width
During the phenotypic characterization of the selected width-deficient mutants, we noticed that the guaA mutant was unambiguously shorter than the others, while at the opposite the minJ mutant formed distinctive long cells (Fig. 3D). This observation suggests that these mutants might be affected in the control of the division process. We then systematically measured the length of the selected mutants, revealing to our surprise that all mutants but cwlO displayed an average length significantly greater or smaller than that of the wild-type cells (Fig. 3C, Table 1). While the wild type strain’s average length variability ranged from 0.1% to 5.6 % across replicates (Sup. Table 7), 11 mutants displayed an average length >9 % larger or thinner than that of the wild-type cells (Fig. 3C; Table 1). It should be noted that the minicells formed by ΔminJ and ΔrodZ, as previously reported (20, 66), were not taken into account in our length quantification.
Average length differences (%) across replicates
As shown on Figure 3, the ordering of the strains by width (3B) did not predicted their ordering by length (3C), indicating the absence of a simple correlation between the two parameters (Fig. Sup. 4A). However, all metabolism-related mutants but Δrpe were shorter (>12 %) and thinner (>8 %) than the wild type (Fig. 3B-D and Table 1). In contrast, shorter and wider mutants were all related to CW metabolism, again to the exception of Δrpe.
In the course of our experiments, we also noticed that the mutants selected were obviously growing at different pace. Because the length –but not the width- of B. subtilis usually correlates with its growth rate (the “growth law”), we wondered i- if the differences of length observed between the mutants would reflect their growth and ii- if and how their width would varies regarding their growth. We determined the generation time of the 12 mutant strains with a significantly affected width during mid exponential growth (see Material & Method; Fig. Sup. 4B). All the metabolism related mutants, and only these, presented an altered generation time (GT) with a >75 % increase compared to that of the wild type. For these, the GT strongly correlates with their length (R²=0.837) indicating that in such mutants the “growth law” is conserved (Fig. Sup. 4C), at the contrary to CW homeostasis mutants for which the growth rate appeared unaffected despite a change in their length (Fig. Sup. 4B-C). However, the GT was not or poorly correlated with the width for both above-mentioned subcategories suggesting that both parameters are not connected (Fig. Sup. 4C).
Finally, we calculated the surface area (S) to volume (V) ratio of the mutants, a parameters that was proposed to be a key values maintained constant in a defined condition, that may be a key determinant of the cell shape (67). Calculation of S/V showed that this ratio was significantly altered in every mutants (to the exception of minJ-) and that the width variation, not the length, was the main contributor to the S/V variation between mutants (Fig. Sup. 4B). As a consequence, all CW homeostasis mutants presented a small S/V ratio while the metabolic mutants but not rpe displayed a larger S/V. The S/V is remarkably constant over time for a given conditions, which has been hypothesized to originate from a scaling between the growth rates of S and V (68). Harris & Theriot proposed that this scaling originates from the rates of surface and volume growth being both functions of V (and not functions of S and V, respectively) (67). A consequence of their model is that a diminishing rate of S growth, for example when reducing the CW synthesis, both increases cell width and reduces S/V. In the frame of this model, one could hypothesizes that the increase of width observed in the mutants we have selected may be a direct consequence of a decreased CW incorporation affecting the S/V homeostasis.
Overall, these results discriminate between two main group of mutants with similar trends: those of genes involved into cw homeostasis displaying an increased width and reduced S/V but an unaffected growth rate, and mutants of metabolic genes, strongly affected for growth and presenting a reduced width and increased S/V. In this dichotomy, rpe is stepping out, sharing characteristics of both groups and suggesting that its phenotypes might reflect a defect in both pathways, which could be a cause for its instability. Also, based on these observations, it is thus tempting to predict that ybzH deletion is affecting the ‘metabolic pathway’ while yaaA is somehow affecting the ‘cw homeostasis’ pathway.
Discussion
The cell width is probably one of the most tightly regulated physiological parameter in B. subtilis (33). But the mechanism allowing its fine control remains unclear. Our approach aimed at revealing in a systematic way the (non-essential) genes involved in this process. Reassuringly, we confirmed most of the non-essential (or non-synthetic) factors previously reported (Sup. Table 6) and identified 9 new genes presenting a strong effect on B. subtilis diameter. Since we arbitrarily setup a cutoff to select the most drastically affected mutants, it is likely that extra genes could potentially participate in the process, along with some essential genes or genes acting synthetically. A quick survey of the top 10 % most affected mutants (Sup. Table 3) shows a few dozen of genes involved in CW (e.g. walH, pbpG, lytG, yocH, murQ, murE…), lipid metabolism (fabI, lipL, araM, fadE…) or central carbon metabolism (tkt, ywjH, coaA…), albeit to a lesser degree. This complete list should be taken with cautious since the two-step verification performed on our top 1% selection revealed a significant number of false positive. Until now, all the genes described to affect the cell width were involved into CW synthesis or affecting it (Sup. Table 6), and many mutants selected in the present study belongs to this group as well. In addition to the known cwlO, rodZ, ftsX and ftsE we identified dacA, encoding the major vegetative DD-carboxypeptidase PBP5, responsible for the maturation of the PG by trimming the terminal D-Ala of the pentapeptide (69).
However, since the cell shape results from the proper synthesis of the PG meshwork, such mutants are necessarily overrepresented in our study and were expected. Therefore the underlying question of this project was: is there proteins not belonging to the CW machinery that could control or contribute to the tight maintenance of the cell diameter? The answer is yes since most genes reported here have a known function unrelated to it or have not been characterized yet.
In particular, we identified several known metabolic genes, guaA, ptsH, pyk, rpe and panD. For two of them, guaA and ptsH, a few strings could connect them to the CW synthetic pathway. guaA, which displays the smallest cell diameter of our entire study, encodes a GMP synthetase and therefore belongs to the purine nucleotide synthetic pathway (57). Interestingly, it was shown decades ago that GuaA inhibition leads to a decreased synthesis and recycling of the PG (70). Together, these results suggest a tight link between purine metabolism and cell shape. The second gene, ptsH, encodes Hpr, a component of the sugar phosphotransferase system (PTS). The complex is responsible for glucose uptake, and as such is feeding the glycolysis and the PG precursor synthesis pathways (59). In addition, mutants of ptsI, that encodes another piece of the PTS, were previously selected as suppressors of an mreB mutant (71). Finally, preliminary results from our lab indicate a connection between the PTS and MreC and MreD (Keary et al., to be published), strengthening this connection. Thus, one could imagine that Hpr could be a moon-lightening protein monitoring sugar availability to coordinate its uptake with the elongation machinery.
Remarkably, previous studies have linked the cell metabolic status with the cell size, although in these cases the mutants were affected for their length (reviewed in (26)). Out of the 17 B. subtilis mutants previously reported, only pyk, encoding the pyruvate kinase PykA (that produces pyruvate in the final step of glycolysis), was identified in our screen (26). These studies, aiming at deciphering how the growth law (which describes the correlation between cell size and growth rate) is encoded, have revealed how some metabolic genes are encoding enzyme acting as nutrient sensors controlling and coordinating cell division. It should be pointed out that to a couple of exceptions the mechanisms remain unknown. Since B. subtilis diameter, at the contrary to its length, is usually constant, a similar sensing mechanism would make little sense. However, Here, one could imagine that the identified metabolic enzymes may influence one of the two competing elongation machineries (the Rod complex and PBP1). Such effect could be direct via a moon-lightening activity (as observed for the control of length with UgtP (32)) or indirect if a metabolite influences the activity of a third-party regulatory protein (as observed with PykA (72)).
It is nonetheless striking that all the metabolic genes revealed in the present screen were affected both for width and length control. In addition, all these mutants were both thinner and shorter as if both dimensions were somehow linked (to the exception of rpe that presents an uncontrolled width, with both wider and thinner cells). Independently of these metabolic genes, another link between length and width was found in the course of our study with the selection of the minJ and rodZ mutants. RodZ is a known “thinning” factor (Sup. Table 6), member of the Rod complex, and it is suspected to interfere with cell division because of the presence of anucleated minicells in a depletion mutant, a phenotype we confirmed here in the KO strains (20, 65). This role was proposed to be mediated via its interaction with MinJ, although the mechanism remains unknown (65). MinJ is part of the Min system, composed in B. subtilis of MinC, MinD, MinJ and DivIVA, that controls the proper positioning of the septum (61, 62, 73). The phenotype of the minJ knockout in elongation is therefore well known but not its implication on width. Considering the width, the phenotypes of the two mutants differ slightly, rodZ-forming uniform wider cells, while minJ- displays this unique uncontrolled width in a fraction of the population. Interestingly, two other mutants, encoding parts of the Min system, divIVA and minC presented a somewhat thinner diameter as well in our primary screen (-6.1 % and -4.9 % respectively) (Sup. Table 3). Since MinJ interacts with both DivIVA and RodZ which have opposite effect on width control, the mix phenotype of minJ-may reflect the composite result of their opposing influences. Nonetheless, it remains to determine why the perturbation of Min affect the cell diameter. A tempting hypothesis would be that their primary effector, the divisome, may play a role in cell elongation in such perturbed genetic background.
Overall, our study have highlighted several new genes involved into a limited number of cellular pathways that play a role in B. subtilis width control. Even though PBP1 and the Rod complex are certainly important players in this process, these results demonstrate that other factors are required as well. It will thus be critical to understand the function of the identified genes in hope, in the future, to decipher the mechanism underlying the setting and the monitoring of the cellular diameter during bacterial growth.
Materials and methods
General methods and bacterial growth conditions
Methods for growth of B. subtilis, transformation, selection of transformants and so on have been described extensively elsewhere (74). DNA manipulations were carried out by standard methods. B. subtilis strains used in this study are listed in Sup. Table 5. B. subtilis strains were grown at 30 or 37 °C in rich lysogeny broth medium (LB), except for assaying growth in poor media were strains were grown in Modified Salt Medium (MSM) supplemented with 10 mM MgSO4 (52) and S medium (31) with the corrected 1.2 µg/ml of MnSO4. For precultures, media supplements were added at the following final concentrations: MgSO4 20 mM, and genotype-depending, neomycin 15 µg.ml−1, spectinomycin 100 µg.ml−1 or chloramphenicol 5 µg.ml−1 (Sup. Table 5). Transformants were selected on LB agar plates supplemented with MgSO4 and neomycin. For the determination of generation time (GT), cells from overnight cultures were diluted to a fixed starting OD600nm of 0.01 in fresh LB medium supplemented with MgSO4 in 96-well cell culture plates (CellStar) and grown in microplate reader at 250 rpm at 37°C. GT was calculated using a Matlab script available at the following link:.
General screening procedure
Screening was performed on the BKK library using HCSm setups (see ‘High content screening microscopy’), leading to the selection of 3974 out of the 3983 mutants from this collection (9 clones were absent from the published library or failed to regrow) (22). Images were processed and cell diameter was measured (see ‘Image processing and cell size quantification’). The 1% most affected strains (40 mutants) were selected and their phenotype confirmed on an epifluorescence widefield microscope (see ‘Low throughput epifluorescence microscopy’ and ‘Image processing and cell size quantification’). Deletions in the selected clones was verified by PCR revealing that 2 out of 40 mutants (yoqC, yorP) were wild type for the expected locus and discarded for further analysis. The remaining 38 mutants were backcrossed into the wild type 168 strain to be analyzed over triplicates experiments, using low throughput microscopy. An arbitrary cutoff of 8% Δwidth, obtained by comparison to the wild type strain width, was chosen and 12 genes were selected.
High content screening microscopy
Cells from overnight cultures, grown in the presence of neomycin and MgSO4, were diluted 600 × in fresh LB medium supplemented with MgSO4 in 96-well cell culture plates (CellStar) and grown on an orbital shaker at 250 rpm at 37°C until mid-exponential phase (OD600 ∼ 0.2). To fix the cells, 150 µL of culture were mixed with 50 µL of fixation solution (0.5 M KPO4 pH 7, 8 % paraformaldehyde, 0.08 % glutaraldehyde) in 96-well PCR plates and incubated 15 min at room temperature followed by 15 min on ice. The cells were pelleted by a 5 min centrifugation at 450 g and the supernatant carefully removed by pipetting. The pellets were washed with 200 µL of washing buffer (KPO4 0.1 M pH 7) and centrifuged again. The pellets were resuspended in 20 µL of water containing 3.3 µg/mL FM1-43FX (ThermoFisher, F35355) and incubated 5 min at room temperature. 180 µL of washing buffer were added and the cells were centrifuged a last time to be concentrated 3.75 × in 40 µL washing buffer. 96-well (Fisher) or 384-well (Greiner) microscopy plates were treated with 60 µL of poly-L-lysine 0,01 % and washed with 60 µL of deionized water. 40 µL of cells were put in each well and discarded after a 1 min incubation. Finally, 40 or 120 µL of deionized water were added into each well of 96-well or 384-well plates. Imaging was performed either on an ImageXpress micro Confocal (Molecular Devices) or an INCell 6000 analyzer (GE Healthcare) used in non-confocal mode. The ImageXpress HCS microscope was equipped with a 60 × Nikon air objective (NA 0.95), a FITC filter (Ex.488/Em.536) and a Zyla 4.2 Andor sCMOS camera with a final pixel size of 115 nm and controlled by MetaXpress software package. The INCell 6000 analyzer was equipped with a 60 × water objective (NA 0.95), a FITC filter (Ex.488/Em.525) and a sCMOS 5.5 Mpixels camera with a final pixel size of 108 nm and controlled by the INCell 6000 Analyzer - Acquisition v.7.1 Software. Images from 4 fields of view were acquired for each strain.
Low throughput epifluorescence microscopy
Cultures were performed as for HCS microscopy but in shaking tubes instead of microplates. For live cell imaging, 300 µL of cultures were directly mixed with FMTM 1-43FX (ThermoFisher) to reach the concentration of 3.3 µg/mL and concentrated 3.75 × before 1 µL of the preparation was spotted onto a thin 2 % agarose-LB pad, topped by a coverslip and immersion oil, and mounted immediately in the temperature-controlled microscope stage. For the imaging of fixed cells, cells were fixed as described for HCS microscopy except that 300 µL of culture were mixed with 100 µL of fixation solution and subsequently washed with 300 µL of buffer. Cells were either loaded on a 2 % agarose-LB pad or loaded on poly-L-lysine treated 96 well microscopy plate. For the latter, the wells were washed then filled with deionized water. Epifluorescence images of the stained membranes were acquired on a previously described setup equipped with a 100 × objective (75).
Image processing and cell size quantification
The post-acquisition treatment of the images was done with the Fiji shareware and the measures (mean cell diameter and length) with the MicrobeJ plugin (48–50). In MicrobeJ, the width was calculated as the mean value along the medial axis of the cell. The parameters used for the MicrobeJ module are listed in Sup. Table 1. Cells aggregates were excluded and segmentation was manually corrected when necessary.
During high throughput screening, the cell width of each strain was calculated as the mean of 225 cells (in average). When the four-image set contained less than 30 measurable cells, a new acquisition was performed. Because the library is devoid of a wild type reference, and to prevent putative plate to plate variability, the mean cell width of each mutant was compared to the average width of all measured cells of its 96-well plate, or ADP (average cell diameter per plate) index (17-19.103 cells/plate) (Fig. Sup. 2A). Each strain’s diameter deviation relatively to this index was calculated, as:
 From these differences, the 0.5st and 99.5th percentile were calculated and the 99 % of the mutants between these two values eliminated.
During low-throughput microscopy (for the verification of the BKK candidates and for clones resulting from the backcross into the 168 strain) the cell width and length of each strain was calculated as the mean of 245 cells (in average). The calculated Δwidth was expressed by comparison with the wild type cell size.
Alternative methods for cell width measurement
Cell widths were measured either with the ChainTracer plugin of the Fiji shareware, or by “manually” determining the width at maximum height on intensity profiles (76) (Fig. S1). For ChainTracer, we used a stack of phase contrast and epifluorescence images of stained membranes, and only analyzed isolated chains of cells to prevent segmentation issues. For the measurement using intensity profiles, a line was manually drawn perpendicularly to the cell’s long axis, on epifluorescence images of stained membranes, and a profile plot of the fluorescence intensity was generated. The cell diameter was determined by measuring the distance between the two maxima.
Acknowledgment
This work was supported by a starting grant form the European research council (ERC-StG 311231) to R.C-L. We thank the BioImaging Center Lille-Nord de France (BICeL) facility (Lille, France). Financial support for HCS equipments was provided by the FEDER (12001407 (D-AL) Equipex Imaginex BioMed).
References


