

Abstract
Although sensory input is continuous, we perceive and remember discrete events. Event segmentation has been studied extensively in adults, but little is known about how the youngest minds experience the world. The main impediment to studying event segmentation in infants has been a reliance on explicit parsing tasks that are not possible at this age. fMRI has recently proven successful at measuring adult event segmentation during task-free, naturalistic perception. Applied to infants, this could reveal the nature of their event segmentation, from low-level sensory transients to high-level cognitive boundaries. We collected fMRI data from 25 adults and 25 infants less than one year of age watching the same short movie. Neural events were defined by the stability of voxel activity patterns. In adults, we replicated a hierarchical gradient of event timescales, from shorter events in early visual regions to longer events in later visual and narrative regions. In infants, however, longer events were found throughout the brain, including in a second dataset. Infant event structure fit adult data and vice versa, but adult behavioral boundaries were differently expressed in adult and infant brains. These findings have implications for the nature of infant experience and cognition.
Introduction
From the moment we are born, our sensory systems are bombarded with information. We overcome this perceptual challenge as adults by segmenting continuous experience into discrete events (Zacks, 2020), both online (Kurby and Zacks, 2008; Zacks et al., 2010) and after the fact (Clewett et al., 2019). Experience can be carved up at multiple timescales (Hard et al., 2006), allowing us to perceive the passage of long events (e.g., a talk from a visiting scientist) and to differentiate or integrate shorter events that comprise them (e.g., an impressive results slide or funny anecdote). The multiple timescales of event perception can be flexibly modulated by attentional states (Bailey et al., 2017) or goals (Hard et al., 2006). In turn, event structure helps with forming and organizing episodic memories, making adaptive decisions, and predicting the future (Shin and DuBrow, 2021).
The hierarchy of event processing found in adults may either be present at birth or built up over development. In adults, coarser event segmentation is associated with conceptual understanding (Hard et al., 2006), and may be important for the construction of abstract knowledge structures such as event schemas and narratives (Ghosh and Gilboa, 2014). The protracted development of narrative understanding (Nelson and Fivush, 2020) suggests that coarser event segmentation may not be developed in early childhood. Thus, infants may segment experience at its most sensory level, in reaction to transient changes in low-level prop-erties. At the same time, infants are sensitive to complex event types such as human action sequences (Baldwin et al., 2001; Saylor et al., 2007; Stahl et al., 2014) and cartoon narratives (e.g., of a crab playing with a beach ball; Sonne et al. 2016, 2017). In one set of studies, infants recognized the similarity between target action segments and longer sequences that contained them, showing greater sensitivity to discrete actions (e.g., an object occlusion event) than to transitions between actions (e.g., an object sliding along the ground) (Hespos et al., 2009, 2010). Thus, there is some reason to believe that infant experience is structured into longer events. This fits with other work showing that infants and toddlers have longer temporal processing windows for vision (Farzin et al., 2011; Freschl et al., 2021) and multisensory information (Lewkowicz, 1996; Lewkowicz and Flom, 2014).
Behavioral measures such as looking time have expanded our understanding of infant event processing, yet can only provide indirect evidence and are overdetermined (Aslin, 2007). This makes it diffcult to identify representations of events at multiple timescales. Neural measures provide a potential solution. Functional magnetic resonance imaging, for example, has proven excellent at capturing parallel representations relevant to event segmentation in adults (Stawarczyk et al., 2021). In one approach, behavioral boundaries from an overt parsing task are used as event markers to model fMRI activity during passive movie watching. Regions such as the superior temporal sulcus and middle temporal area respond to events at different timescales (Zacks et al., 2001, 2006, 2010). An alternative approach discovers events in a data-driven manner (Baldassano et al., 2017; Geerligs et al., 2021). An unsupervised computational model learns stable neural event patterns in participants watching movies. This model can be fit to different regions across the brain to discover a range of event timescales. In adults, sensory regions process events on a short timescale, whereas higher-level regions process events on a longer timescale, mirroring the topography of temporal receptive windows (TRW; Hasson et al. 2008; Lerner et al. 2011; Himberger et al. 2018). Moreover, event boundaries in regions associated with narrative processing (such as the precuneus and posterior cingulate; Hasson et al. 2015) best match narrative changes in the movie (Baldassano et al., 2017).
Although fMRI has enhanced our understanding of event segmentation in adults, it has traditionally not been used for this purpose in infants. EEG is often used instead. For example, it has shown that the infant brain is sensitive to pauses that disrupt familiar and novel goal-directed actions (Reid et al., 2007; Pace et al., 2013). The timing of event-related potentials (ERPs) to disrupted novel events indicated a hierarchy of event processing in adults that was similar but not the same as infants (Pace et al., 2013). Infants also show greater attention and different ERPs to pauses at the end of novel actions compared to pauses within an event (Pace et al., 2020). The strength of EEG is that it can precisely determine when during continuous experience infants segment events. However, its limited spatial resolution and sensitivity to signals near the scalp constrain the types of representations that can be probed. In particular, many of the key regions for event segmentation are away from the scalp, including subcortical structures such as the hippocampus (Ben-Yakov and Henson, 2018) and midline regions such as the precuneus and medial prefrontal cortex (Baldassano et al., 2017, 2018). fMRI produces rich, whole-brain data that, when applied to infants, could reveal aspects of event perception that may not otherwise be accessible (Yates et al., 2021). fMRI in awake infants is much rarer than in adults because of experimental and technical challenges, but is possible (Dehaene-Lambertz, 2002; Biagi et al., 2015; Deen et al., 2017; Ellis et al., 2020a,d).
In this study, we collected movie-watching fMRI data from infants under one year old to investigate the early development of event perception during continuous, naturalistic experience. We collected fMRI data from adults who watched the same movie, as a comparison set, and from infants and adults in a second movie, to test for generalization. Our first question was whether the movie would be processed reliably across participants. As an initial check, we predicted that neural responses would be correlated across adults throughout the brain, including in sensory and narrative regions (Hasson et al., 2004). Infant eye movements are less consistent than adults during movie-watching (Kirkorian et al., 2012; Franchak et al., 2016), and thus we expected lower or perhaps even absent intersubject correlation across infants. Our second question was about the presence and timescale of event boundaries across participants. We sought to replicate previous adult work showing a hierarchical gradient of timescales in event processing across regions, though here with a shorter, infant-friendly animated video. With this comparison in hand, we could then test whether and where in the brain the same boundaries and timescales exist in infants. One possibility is that infant event structure is similar to adults only in early visual regions. Indeed, we recently found that retinotopy — a hallmark of visual cortex organization — is nearly adult-like in infants (Ellis et al., 2020b). Another possibility is that infants have similar event structure to adults in higher-order regions associated with narratives, given their sensitivity to causal relations and goals (Baillargeon et al., 2016).
Results
Intersubject correlation reveals reliable neural responses in infants
We scanned infants (N = 25; 3.6–12.7 months) and adults (N = 25; 18–32 years) while they watched a short, silent movie (“Aeronaut”) that had a complete narrative arc. To investigate the consistency of infants’ neural responses during movie-watching, we performed leave-one-out intersubject correlation (ISC), in which the voxel activity of each individual participant was correlated with the average voxel activity of all other participants (Hasson et al., 2004). This analysis was performed separately in adults and infants for every voxel in the brain and then averaged within eight regions of interest (ROIs), spanning from early visual cortex (EVC) to later visual regions (lateral occipital cortex, LOC), high-level amodal regions (angular gyrus, AG; posterior cingulate cortex, PCC; precuneus; medial prefrontal cortex, mPFC) and the hippocampus. Because the movie was silent, we used early auditory cortex (EAC) as a control region.
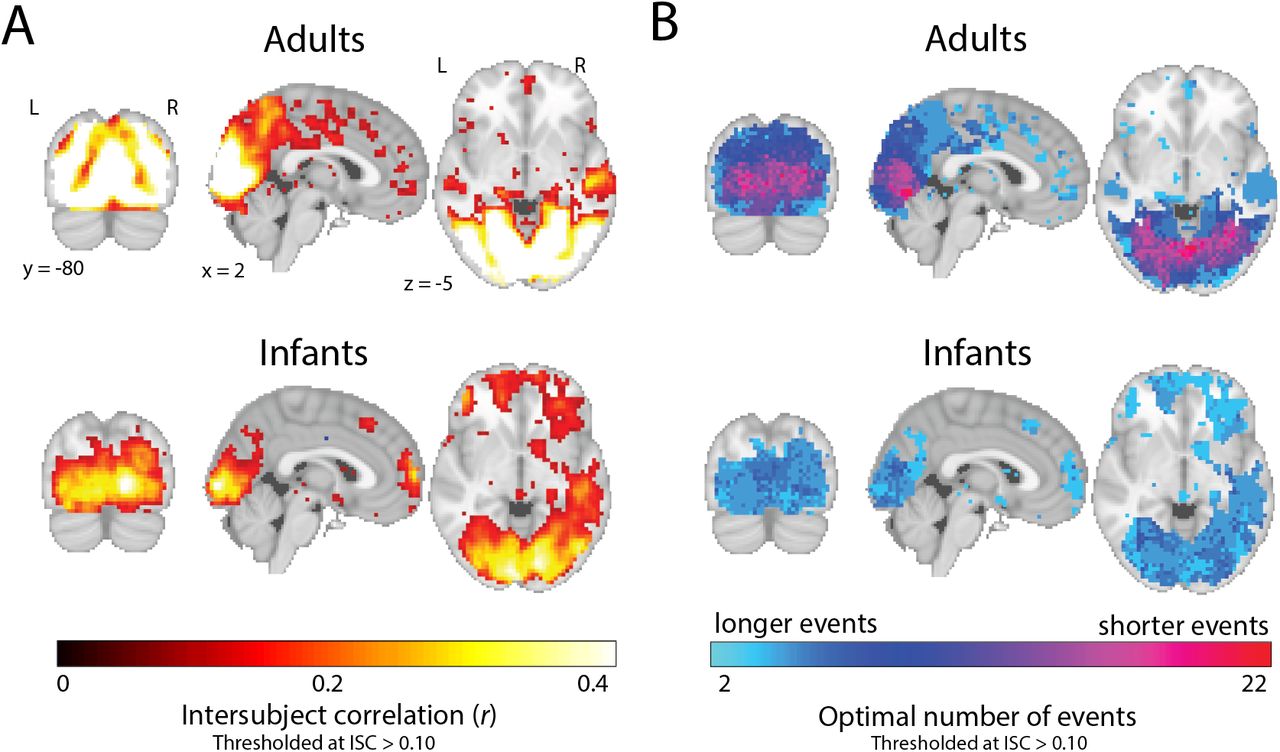
Whole-brain ISC was highest in visual regions in adults (Figure 1A), similar to prior studies with movies (Hasson et al., 2004; Chen et al., 2017). That said, all eight ROIs were statistically significant in adults (EVC: M = 0.492, CI = [0.444, 0.535], p < 0.001; LOC: M = 0.427, CI = [0.389, 0.464], p < 0.001; AG: M = 0.091, CI = [0.058, 0.120], p < 0.001; PCC: M = 0.143, CI = [0.098, 0.184], p < 0.001; precuneus: M = 0.155, CI = [0.121, 0.189], p < 0.001; mPFC: M = 0.063, CI = [0.041, 0.087], p < 0.001; hippocampus: M = 0.042, CI = [0.028, 0.058], p < 0.001; EAC: M = 0.087, CI = [0.054, 0.119], p < 0.001). These results are consistent with prior movie-watching studies, albeit with a much shorter movie here, for all ROIs except EAC. We speculate on why we found significant ISC in EAC during a silent movie in the Discussion.

Average leave-one-out intersubject correlation (ISC) in adults and infants. (A) Voxel-wise ISC values in the two groups, thresholded arbitrarily at a mean correlation value of 0.10 to visualize the distribution across the whole brain. (B) ISC values were significant in both adults and infants across ROIs (except EAC in infants). Dots represent individual participants and error bars represent 95% CIs of the mean from bootstrap resampling. *** p < 0.001, ** p < 0.01, * p < 0.05, ∼p < 0.1. ROIs: primary visual cortex (EVC), lateral occipital cortex (LOC), angular gyrus (AG), posterior cingulate cortex (PCC), precuneus (Prec), medial prefrontal cortex (mPFC), hippocampus (Hipp), primary auditory cortex (EAC).
ISC was weaker overall in infants than adults, but again higher in visual regions compared to other regions. All ROIs except for EAC were statistically significant in infants, and hippocampus was marginally significant (EVC: M = 0.251, CI = [0.168, 0.332], p < 0.001; LOC: M = 0.181, CI = [0.116, 0.242], p < 0.001; AG: M = 0.085, CI = [0.032, 0.134], p = 0.002; PCC: M = 0.091, CI = [0.047, 0.142], p < 0.001; precuneus: M = 0.079, CI = [0.038, 0.120], p < 0.001; mPFC: M = 0.073, CI = [0.024, 0.116], p = 0.003; hippocampus: M = 0.046, CI = [0.000, 0.093], p = 0.054; EAC: M = 0.023, CI = [-0.014, 0.056], p = 0.189). Nonetheless, there were differences between the adult and infant groups. ISC was significantly higher in adults than infants in EVC (M = 0.241, permutation p < 0.001), LOC (M = 0.246, p < 0.001), precuneus (M = 0.076, p = 0.007), and EAC (M = 0.064, p = 0.011); all other regions did not exhibit different ISC between groups (AG: M = 0.006, p = 0.859; PCC: M = 0.052, p = 0.135; mPFC: M = -0.010, p = 0.697; hippocampus: M = -0.005, p = 0.864). In sum, there is strong evidence of a shared response across infants, not just in visual regions, but also in regions involved in narrative processing in adults.
Gradient of event processing is absent in the infant brain
Given that infants process the movie in a similar way to one another, we next asked whether their neural activity contains evidence of event segmentation, as in adults. Our analysis tested whether infant brains transition through discrete event states characterized by stable voxel activity patterns, which then shift into new stable activity patterns at event boundaries. We used a computational model to characterize the stable neural event patterns of infant and adult brains (Baldassano et al., 2017). We analyzed the data from infant and adult groups separately. Within each group, we first split the data in half, with one set of participants forming a training set and the other forming a test set. In a searchlight analysis, we applied the model to the training set using a range of event numbers from 2 to 21, and then applied the learned event segmentation to the test set. Model fit was assessed by the log probability of the test data according to the learned event segmentation (referred to as the log-likelihood). We iterated this splitting process 24 times, switching which participants were used in the training and test sets, and then assigned to each voxel the number of events that maximized the log-likelihood of the model across iterations. This same pipeline was performed at the ROI level using the pattern of voxel activity from all voxels that made up an ROI, rather than the voxels contained in a searchlight.
In adults, despite the movie being substantially shorter, we replicated previous work showing a gradient of event granularity across cortex, with more events in early visual compared to narrative regions (Figure 2A). In infants, we did not find strong evidence of a gradient. In fact, the model performed optimally with fewer, longer events across the brain, including in visual regions (Figure 2B).

Event structure across the adult and infant brain. (A) The optimal number of events for a given voxel was determined via a searchlight across the brain, which found the number of events that maximized the model log-likelihood in held-out data. Voxels with an average ISC value greater than 0.10 are plotted for visualization purposes. In adults, there was a clear difference in the number of events found in early visual regions vs. narrative regions, but this was not present in infants. (B) Example timepoint-by-timepoint correlation matrices in EVC and precuneus in the two groups. The model event boundaries found for each age group are outlined in red (EVC) and aqua (precuneus).
Coarser but reliable event structure across brain regions in infants
The above analysis provides a qualitative description of the timescale of event processing in the infant brain. However, comparing the relative model fits for different timescales does not allow us to assess whether the model fit at the optimal timescale is significantly above chance. To quantify whether these learned events truly demarcated state changes in neural activity patterns, we used nested cross-validation. For each ROI, we followed the steps above for finding the optimal number of events, but critically, held one participant out of the analysis completely (and iterated so each participant was held out once). On each leave-one-participant-out iteration, the number of optimal events in the remaining N-1 training participants could vary; the held-out participant had no impact on the learned event model. The model with the optimal event structure was then fit to the held-out participant’s data and to time-shifted permutations of their data. A z-score of the log-likelihood for the actual result versus the permuted (null) distribution was calculated to determine whether the learned event structure generalized to a new participant better than chance (Figure 3A). This analysis can tell us whether the smaller number of events observed in infants reflects true differences in processing granularity between adults and infants, or results from combining across infants who have idiosyncratic event structures1.

The nested cross-validation analysis of adult and infant age groups. (A) Schematic explaining the nested cross-validation procedure for computing the reliability of event segmentation. (B) Results of ROI analyses for adults and infants. There is reliable event structure, operationalized as better model fit in actual vs. permuted held-out data, in both adults and infants across ROIs. The number of events that optimized model log-likelihood in the full sample of participants is labeled below the x-axis. Dots represent individual participants and error bars represent 95% CIs of the mean from bootstrap resampling. *** p < 0.001, ** p < 0.01, * p < 0.05, ∼p < 0.1.
Overall, the models for different ROIs reliably fit independent data (Figure 3B). All ROIs except hippocampus were significant in adults (EVC: M = 4.79, CI = [4.48, 5.10], p < 0.001; LOC: M = 5.52, CI = [5.20, 5.81], p < 0.001; AG: M = 4.97, CI = [4.39, 5.47], p < 0.001; PCC: M = 3.05, CI = [2.29, 3.75], p < 0.001; precuneus: M = 4.64, CI = [4.22, 5.06], p < 0.001; mPFC: M = 3.03, CI = [2.09, 3.90], p < 0.001; hippocampus: M = 0.711, CI = [-0.023, 1.41], p = 0.058; EAC: M = 3.79, CI = [3.31, 4.19], p < 0.001). This was also true for infants, except in PCC and hippocampus (EVC: M = 3.29, CI = [2.61, 3.95], p < 0.001; LOC: M = 4.76, CI = [4.07, 5.39], p < 0.001; AG: M = 2.35, CI = [1.73, 2.99], p < 0.001; PCC: M = 0.545, CI = [-0.110, 1.24], p = 0.106; precuneus: M = 3.27, CI = [2.21, 4.18], p < 0.001; mPFC: M = 1.42, CI = [0.493, 2.29], p < 0.001; hippocampus: M = 0.172, CI = [-0.506, 0.612], p = 0.306; EAC: M = 3.54, CI = [2.42, 4.61], p < 0.001). Given that some of these regions are involved in higher-order processing, at least in adults, these findings suggest that infant event segmentation is not entirely sensory-driven.
Relationship between adult and infant event structure
The optimal number of events for a given region differs across adults and infants, but this does not necessarily mean that the patterns of neural activity are unrelated. For instance, the coarser event structure in infants may still be present in the adult brain, with their additional events carving up these longer events at a finer scale. Conversely, the finer event structure found in adults may still be developing in the infant brain, such that it may be present but have less optimal fit. We thus investigated whether event structure from one group could explain the neural activity of individual participants in the other group (Figure 4). We compared this to the extent that other members of the same group could explain an individual’s neural activity. If event structure better explains neural data from the same age group compared to the other age group, then we can conclude that event structures differ between age groups.

Reliability of event structure for models fit with participants of the same vs. other age group. (A) Light bars indicate fit of adult and infant event structures to adult data, and dark bars indicate fit of adult and infant event structures to infant data. Note that the fit of event structures to data from the same group (adult events in adults, infant events in infant) are replotted from Figure 3 without statistics. Overall, event structures learned from adults and infants fit data from the other group (clearest in EVC, LOC, AG, PCC, Prec, mPFC, EAC). However, in several regions using adult event structure, these fits were weaker than to data from the same group (clearest in EVC, LOC, AG, PCC). Error bars represent 95% CIs of the mean from bootstrap resampling. *** p < 0.001, ** p < 0.01, * p < 0.05, ∼p < 0.1.
When event segmentation models fit to adults were applied to infant neural activity, all ROIs except hippocampus showed significant model fit over permutations (EVC: M = 3.79, CI = [3.36, 4.20], p < 0.001; LOC: M = 4.64, CI = [4.13, 5.12], p < 0.001; AG: M = 2.82, CI = [2.23, 3.33], p < 0.001; PCC: M = 1.55, CI = [0.896, 2.23], p < 0.001; precuneus: M = 3.54, CI = [2.90, 4.19], p < 0.001; mPFC: M = 3.07, CI = [2.43, 3.75], p < 0.001; hippocampus: M = 0.185, CI = [-0.619, 0.967], p = 0.337; EAC: M = 2.66, CI = [1.69, 3.63], p < 0.001). This suggests that although infants and adults had a different optimal number of events in these regions, there was some overlap in their event representations. In most of these regions, models trained on adults showed significantly better fit to adults compared to infants, (EVC: M = 1.00, CI = [0.478, 1.55], p < 0.001; LOC: M = 0.873, CI = [0.325, 1.47], p < 0.001; AG: M = 2.16, CI = [1.38, 2.96], p < 0.001; PCC: M = 1.50, CI = [0.506, 2.39], p = 0.002; precuneus: M = 1.10, CI = [0.385, 1.87], p < 0.001; EAC: M = 1.12, CI = [0.086, 2.18], p = 0.036), suggesting that adult-like event structure is still developing in these regions. Indeed, how well adult event structure fit an infant was related to their age, at least in LOC (r = 0.472, p = 0.018). No other ROIs showed a relationship with age, although our relatively small sample for evaluating individual differences and our truncated age range may have limited our ability to discover age effects.
When event segmentation models fit to infants were applied to adult neural activity, all ROIs showed significant model fit over permutations (EVC: M = 2.73, CI = [2.03, 3.44], p < 0.001; LOC: M = 3.95, CI = [3.21, 4.62], p < 0.001; AG: M = 2.06, CI = [1.15, 2.98], p < 0.001; PCC: M = 1.65, CI = [1.01, 2.34], p < 0.001; precuneus: M = 3.49, CI = [2.85, 4.11], p < 0.001; mPFC: M = 1.41, CI = [0.548, 2.19], p = 0.001; hippocampus: M = 2.41, CI = [1.57, 3.20], p < 0.001; EAC: M = 2.59, CI = [1.62, 3.55], p < 0.001). Infant event models did not explain infant data better than adult data in any of the regions. Interestingly, infant event models showed significantly better fit to adult vs. infant neural activity in PCC (M = -1.10, CI = [-2.11, -0.184], p = 0.020) and hippocampus (M = -2.24, CI = [-3.28, -1.25], p < 0.001), potentially due to higher across-subject reliability among the adults. That is, if infant data are noisier than adult data, but otherwise both groups have similar event structure, the model may fit better to a held-out adult. Altogether, the finding that events from one age group significantly fit data from the other age group shows that infant and adult event representations, though optimized to different event numbers, are not unrelated. Nonetheless, the better fit in some ROIs when applying events from one age group to neural activity from the same vs. other age group provides evidence that their event structures are at least partially distinct.
Expression of behavioral event boundaries
We took a data-driven approach to discovering event representations across different regions of the adult and infant brain, but how do these neural event representations relate to what we report behaviorally? In adults, event boundaries in regions such as the AG, precuneus, and PCC align best with annotations of high-level scene changes in a movie (Baldassano et al., 2017). Given that our previous analysis found that adult event boundaries in these narrative regions significantly fit infant neural activity, we tested whether behavioral boundaries from adults were also reflected in the infant brain.
We collected behavioral event segmentation data from 22 independent adult participants who watched the same movie (Ben-Yakov and Henson, 2018), identifying the most salient boundaries (Figure 5A). Participants were not instructed to annotate at any particular timescale, and were simply asked to indicate when it felt like a new event occurred. We quantified the fit of behavioral boundaries to neural activity by calculating the difference in pattern similarity between two timepoints within vs. across boundaries, equating temporal distance. Results were weighted by the number of unique timepoint pairs that made up the smaller group of correlations (e.g., close to the boundary, there are fewer across event pairs than within event pairs). A more conservative approach that only considers timepoint pairs within vs. across event boundaries anchored to the same timepoint yields similar results (Appendix 2 Figure 1). To the extent that behavioral reports reflected the event boundaries in a region, we expected greater neural similarity for timepoints within events.

Relating behavioral boundaries to neural activity. (A) Percentage of behavioral participants who indicated an event boundary was present at each TR in the movie. The 11 TRs with the highest percentage of agreement were used as event boundaries (green dashed lines). (B) Whole-brain searchlight analysis for each age group comparing pattern similarity between timepoints drawn from within vs. across behavioral event boundaries. Bootstrapped z-scores are thresholded at p < 0.05, uncorrected. (C) ROI analysis of difference in pattern similarity within minus between behavioral events. Dots represent individual participants and error bars represent 95% CIs of the mean from bootstrap resampling. Infant participants with values beyond the y-axis range for AG, hipppocampus, and EAC are indicated with Xs at the positive edge. *** p < 0.001, ** p < 0.01, * p < 0.05, ∼p < 0.1.
We performed this analysis in both whole-brain searchlights and in the previous ROIs. In adults, the searchlight analysis revealed that occipital pole, superior occipital cortex, and right supramarginal gyrus exhibited significantly greater pattern similarity within vs. across behavioral event boundaries (Figure 5B). This generally fits with previous work showing that event representations in visual and semantic regions are similar to behavioral boundaries (Baldassano et al., 2017). For the ROIs, we found significantly greater pattern similarity within vs. across behavioral boundaries only in early visual cortex of adults (Figure 5C; EVC: M = 0.014, CI = [0.003, 0.024], p = 0.01; LOC: M = 0.008, CI = [-0.005, 0.023], p = 0.278; AG: M = -0.015, CI = [-0.036, 0.004], p = 0.122; PCC: M = -0.009, CI = [-0.031, 0.011], p = 0.394; precuneus: M = -0.012, CI = [-0.030, 0.004], p = 0.170; mPFC: M = -0.008, CI = [-0.018, 0.001], p = 0.092; hippocampus: M = -0.004, CI = [-0.012, 0.002], p = 0.220; EAC: M = -0.004, CI = [-0.014, 0.006], p = 0.428). Given that most of the non-significant ROIs in this analysis showed reliable event segmentation overall (Figure 3B), indicating stable neural patterns within events, the behavioral event boundaries may have been misaligned. There are several potential sources of this misalignment, including that both age (Cohen and Baldassano, 2021) and anticipation (Lee et al., 2021) can shift the locations of event boundaries. Anticipation in particular seems possible for a child-friendly movie like this, with a slowly evolving and relatively simple plot.
In infants, several regions showed greater pattern similarity within vs. across behavioral boundaries in the searchlight analysis, including visual regions, supramarginal gyrus, and medial and lateral frontal cortex. This was mirrored in the ROIs, where there were significant results in early visual cortex and PCC (EVC: M = 0.048, CI = [0.019, 0.078, p < 0.001; LOC: M = 0.014, CI = [-0.019, 0.052], p = 0.468); AG: M = 0.032, CI = [-0.009, 0.083], p = 0.160); PCC: M = 0.035, CI = [0.003, 0.068], p = 0.032; precuneus: M = 0.010, CI = [-0.013, 0.038], p = 0.524; mPFC: M = 0.008, CI = [-0.019, 0.036], p = 0.580; hippocampus: M = 0.026, CI = [-0.005, 0.068], p = 0.136; EAC: M = 0.021, CI = [-0.008, 0.058], p = 0.162). Thus, infants can have neural representations related to how adults explicitly segment a movie, long before they can perform the behavior, understand task instructions, or even speak. The regions in which this occurred did not always overlap with those from adults, suggesting functional changes over development in the behavioral relevance of neural signals for event segmentation.
Replicating results in a more heterogeneous cohort
We applied the same suite of analyses to a more heterogeneous convenience sample of infants watching a different, short cartoon movie (“Mickey”). In 15 adults, we found a similar topography of ISC as in the main cohort, with significant values in EVC, LOC, AG, PCC, precuneus, and EAC (Appendix 3 Figure 1). There was again a gradient of event timescales across the cortex, with more events in sensory regions and fewer events in narrative regions (Appendix 3 Figure 2). In all but mPFC and hippocampus, event structure significantly explained held-out adult data. The 15 infants showed weaker ISC, though still significant in EVC and LOC. Weaker ISC may potentially be related to the broader age range of the infants (4–33 months) – almost two additional years – given the dramatic developmental changes that occur in this age range and the reliance of ISC on common signal across participants. There was again no evidence of a hierarchical gradient in the number/granularity of events in the infant brain (Appendix 3 Figure 2). The model again favored fewer/coarser events across regions, yet these events reliably fit neural activity from a held-out participant in EVC, LOC, precuneus, mPFC, and hippocampus (Appendix 3 Figure 2). In sum, we obtained results consistent with those of the main cohort, despite the movie being shorter and the age of infants being much more variable.
Discussion
In this study, we investigated neural event segmentation using a data-driven, computational approach in adults and infants watching the same short movie. We found synchronous processing of the movie and reliable event structure in both groups. In adults, we replicated a previously observed gradient of timescales in event processing across brain regions. However, this gradient was absent in infants, who instead had coarse neural event structure across regions. We replicated this pattern in a separate, more heterogeneous set of infants watching a different movie. Although event structure from one age group provided a reliable fit to the other age group, suggesting some similarity in their representations, adult event structure best fit adult data, suggesting developmental differences. Furthermore, whereas behavioral boundaries aligned with event structure in early visual regions in adults, they were more broadly aligned in infants, including in posterior cingulate cortex. Altogether, this study provides novel insights into how infants represent continuous experience, namely that they segment experience into discrete events, as in adults, but at a coarser granularity.
Traditionally, findings of cognitive and neural development have focused on the earlier maturation of sensorimotor systems, followed by the later development of associative regions (Casey et al., 2005). If associative regions are still developing, infant event segmentation may be sensory-driven. However, ISC and event structure in infants was not limited to visual regions, extending into regions linked to narrative processing in adults (Lee et al., 2020). Furthermore, infants structured events over a longer timescale, consistent with their ability to represent more extended, complex content. Indeed, the event structure in several infant regions including the posterior cingulate cortex resembled event boundaries that adults reported explicitly in behavior. We found general similarity between event representations in high-level regions of adults and infants, which can perhaps be understood in light of the sensitivity of infants to goal-directed actions and events (Levine et al., 2019). Young infants both predict the outcomes of actions (Woodward, 1998) and are surprised by ineffcient paths towards a goal (Liu et al., 2019) when a causal agent is involved. Unambiguous agency also increases the ability of older infants to learn statistical structure (Monroy et al., 2017), suggesting that the infant mind may prioritize agency. Indeed, infants are better at imitating a sequence of actions that have hierarchical versus arbitrary structure (Bauer and Mandler, 1989; Bauer, 1992) and show better memory for events that have a clear agent (Howard and Woodward, 2019), perhaps because of a propensity to segment events according to goals during encoding. Together, these results provide reason to believe that infants can represent high-level event structure from early ages.
In both of the infant movie-watching datasets, the optimal number of events in visual regions was lower in infants than adults. We interpret this result as reflecting the development of temporal receptive window lengths. Indeed, young children bind multi-sensory and uni-modal visual information over longer windows (Lewkowicz, 1996; Lewkowicz and Flom, 2014; Farzin et al., 2011; Freschl et al., 2021). Interestingly, diminished temporal resolution may be advantageous to infants when gathering information about objects and events in their environment (Freschl et al., 2019). For instance, infants may better extract meaning from social interactions if they can bind together continuously unfolding visual, auditory, and emotional information; accordingly, toddlers with autism spectrum disorder have shorter than normal temporal receptive windows (Freschl et al., 2021). This behavioral literature has been agnostic to how or why temporal receptive windows are dilated in infancy, but perhaps the lack of neural gradient contributes to the binding of information over longer time scales. Future work combining behavioral and neural approaches to temporal processing could inform this relationship. One alternative explanation for the smaller number of events in visual regions could be model bias, for example if the model defaults to fewer events in heterogeneous participant groups. Although the Aeronaut dataset had a narrower age band (all participants were under 12 months old), there are still dramatic cognitive and neural changes during the first year of life (Turesky et al., 2021). We found some evidence of developmental differences in how well adult event structure fit infant LOC, but no other regions showed age-dependent changes. Furthermore, we found overestimation in the number of events when noise was increased in simulations. This is inconsistent with attributing the fewer and longer events observed in infants to their greater functional and anatomical variability.
The nature of conducting fMRI research in awake infants means our study has several important limitations. First, there was more missing data in the infant age groups from eye closure and eye movements. We partially addressed this issue by introducing a new variance parameter to the computational model, but acknowledge that it remains an unavoidable quirk in the datasets. Second, our analyses were conducted in a common adult standard space, requiring alignment across participants. Because of uncertainty in the localization and extent of these regions in infants, we defined our a priori ROIs liberally. This may explain the curious finding of reliable event structure in EAC for both adults and infants. Indeed, the EAC ROI encompassed secondary auditory regions and superior temporal gyrus, which is important for social cognition (Jacoby et al., 2016) and motion and face processing (Hein and Knight, 2008). Future work could define ROIs based on a child atlas (Oishi et al., 2019), although that would complicate comparison to adults. Alternatively, ROIs could be defined in each individual using a functional localizer task, though collecting both movie and localizer data from a single infant session is diffcult. Nonetheless, in other work, we have successfully used adult-defined ROIs to investigate infant visual processing (Ellis et al., 2020a) and attentional cuing (Ellis et al., 2020d).
In conclusion, we found that infants segment continuous experience into discrete neural events, but do so in a coarser way than the corresponding brain regions in adults and without a resulting gradient in the timescale of event processing across these regions. By using a neural approach to access event representations during naturalistic movie-watching from neural activity, we supplement the limited repertoire of behavioral tasks and measures available in the first year of life, providing a new perspective on the assumed “blooming, buzzing confusion” (James, 1890) of infant visual experience.
Methods and Materials
Participants
Data were collected from 25 infants under one year of age (3.60 – 12.70 months; M = 7.43, SD = 2.70; 13 female) while they watched a silent cartoon (“Aeronaut”). Infants who moved their head excessively (N = 11) or did not look the screen (N = 4) during more than half of the movie were excluded. We further excluded participants for whom we had to stop the scan less than halfway through the movie because of fussiness or movement (N = 9). For comparison, we also collected data from 25 adult participants (18 – 32 years; M = 22.64, SD=3.62; 14 female) who watched the same movie. The study was approved by the Human Subjects Committee (HSC) at Yale University. All adults provided informed consent, and parents provided informed consent on behalf of their child.
Materials
Aeronaut is a 3-minute long segment of a short film entitled “Soar” created by Alyce Tzue (https://vimeo.com/148198462). The film was downloaded from YouTube in Fall 2017 and iMovie was used to trim the length. The audio was not played to participants in the scanner. The movie spanned 45.5 visual degrees in width and 22.5 visual degrees in height. In the video, a girl is looking at airplane blueprints when a miniature boy crashes his flying machine onto her workbench. The pilot appears frightened at first, but the girl helps him fix the machine. After a few failed attempts, a blueprint flies into the girl’s shoes, which they use to finally launch the flying machine into the air to join a flotilla of other ships drifting away. In the night sky, the pilot opens his suitcase, revealing a diamond star, and tosses it into the sky. The pilot then looks down at Earth and signals to the girl, who looks up as the night sky fills with stars.
The code used to show the movies on the experimental display is available at https://github.com/ntblab/experiment_menu/tree/Movies/. The code used to perform the data analyses is available at https://github.com/ntblab/infant_neuropipe/tree/EventSeg/; this code builds on tools from the Brain Imaging Analysis Kit (Kumar et al. 2020; https://brainiak.org/docs/). Raw and preprocessed functional data and anatomical images will be released publicly.
Data acquisition
Procedures and parameters for collecting MRI data from awake infants were developed and validated in a previous methods paper (Ellis et al., 2020a), with important details repeated below. Data were collected at the Brain Imaging Center in the Faculty of Arts and Sciences at Yale University. We used a Siemens Prisma (3T) MRI and the bottom half of the 20-channel head coil. Functional images were acquired with a whole-brain T2* gradient-echo EPI sequence (TR = 2s, TE = 30ms, flip angle = 71, matrix = 64×64, slices = 34, resolution = 3mm iso, interleaved slice acquisition). Anatomical images were acquired with a T1 PETRA sequence for infants (TR1 = 3.32ms, TR2 = 2250ms, TE = 0.07ms, flip angle = 6, matrix = 32×320, slices = 320, resolution = 0.94mm iso, radial slices = 30000) and a T1 MPRAGE sequence for adults (TR = 2300ms, TE = 2.96ms, TI = 900ms, flip angle = 9, iPAT = 2, slices = 176, matrix = 256×256, resolution = 1.0mm iso). The adult MPRAGE sequence included the top half of the 20-channel head coil.
Procedure
Before their first session, infant participants and their parents met with the researchers for a mock scanning session to familiarize them with the scanning environment. Scans were scheduled for a time when the infant was thought to be most comfortable and calm. Infants and their accompanying parents were extensively screened for metal. Three layers of hearing protection (silicon inner ear putty, over-ear adhesive covers, and ear muffs) were applied to the infant participant. They were then placed on the scanner bed on top of a vacuum pillow that comfortably reduced movement. Stimuli were projected directly on to the surface of the bore. A video camera (MRC high-resolution camera) was placed above the participant to record their face during scanning. Adult participants underwent the same procedure with the following exceptions: they did not attend a mock scanning session, hearing protection was only two layers (earplugs and optoacoustics noise-canceling headphones), and they were not given a vacuum pillow. Finally, infants may have participated in additional tasks during their scanning session, whereas adult sessions contained only the movie task (and an anatomical image).
Gaze coding
Gaze was coded offline by 2-3 coders for infants (M = 2.08, SD = 0.74) and by 1 coder for adults. Based on recordings from the in-bore camera, coders determined whether the participant’s eyes were on-screen, offscreen (i.e., blinking or looking away), or undetected (i.e., out of the camera’s field of view). In two infants, gaze data were not collected because of technical issues; in both cases, infants were monitored by visual inspection of a researcher and determined to be attentive enough to warrant inclusion. For all other infants, coders were highly reliable: They reported the same response code on an average of 93.2% (SD = 5.17%; range across participants = 77.7–99.6%) of frames. The modal response across coders from a moving window of five frames was used to determine the final response for the frame centered in that window. In the case of ties, the response from the previous frame was used. Frames were pooled within TRs, and the average proportion of TRs included was high for both adults (M = 98.8%, SD = 3.17%; range across participants = 84.4–100%) and infants (M = 88.4%, SD = 12.1%; range across participants = 56.0–100%).
Preprocessing
Data from both age groups were preprocessed using a modified FSL FEAT pipeline designed for infant fMRI (Ellis et al., 2020a). If infants participated in other tasks during the same functional run, the movie data was cleaved to create a pseudorun (N = 12). Three burn-in volumes were discarded from the beginning of each run/pseudorun. Motion correction was applied using the centroid volume as the reference – determined by calculating the Euclidean distance between all volumes and choosing the volume that minimized the distance to all other volumes. Slices in each volume were realigned using slice-timing correction. Timepoints with greater than 3mm of translational motion were excluded and temporally interpolated so as not to bias linear detrending. The vast majority of infant timepoints were included after motion exclusion (M = 92.8%, SD = 9.8; range across participants = 65.6–100%) and all adult timepoints were included (100% for all participants). These timepoints and timepoints during which eyes were closed for a majority of the volume were then excluded from subsequent analyses. The signal-to-fluctuating-noise ratio (SFNR) was calculated (Friedman and Glover, 2006) and thresholded to form the mask of brain vs non-brain voxels. Data were spatially smoothed with a Gaussian kernel (5mm FWHM) and linearly detrended in time. AFNI’s despiking algorithm was used to attenuate aberrant timepoints within voxels. After removing excess burn-out TRs, functional data were z-scored within run.
The centroid functional volume was registered to the anatomical image. Initial alignment was performed using FLIRT with a normalized mutual information cost function. This automatic registration was manually inspected and then corrected if necessary using mrAlign from mrTools (Gardener lab). To compare across participants, functional data were further transformed into standard space. For infants, anatomical images were first aligned automatically (FLIRT) and then manually (Freeview) to an age-specific MNI infant template (Fonov et al., 2009). This infant template was then aligned to adult MNI standard (MNI152). Adult anatomical images were directly aligned to the adult MNI standard. For all analyses, we only considered voxels included in the intersection of all infant and adult brain masks.
In an additional exploratory analysis, we re-aligned participants’ anatomical data to the adult standard using ANTs (Avants et al., 2011), a non-linear alignment algorithm. For infants, an initial linear alignment with 12 DOF was used to align anatomical data to the age-specific infant template, followed by non-linear warping using diffeomorphic symmetric normalization. Then, as before, we used a predefined transformation (12 DOF) to linearly align between the infant template and adult standard. For adults, we used the same alignment procedure, except participants were directly aligned to adult standard. Results using this non-linear procedure were nearly identical to the original analyses (Appendix 4 Figure 1).
Regions of interest
We performed analyses over the whole brain and in regions of interest (ROIs). We defined the ROIs using the Harvard-Oxford probabilistic atlas (0% probability threshold; Jenkinson et al. 2012) in early visual cortex (EVC), lateral occipital cortex (LOC), angular gyrus (AG), precuneus, early auditory cortex (EAC), and the hippocampus. We used functionally defined parcellations obtained in resting state (Shirer et al., 2012) to define two additional ROIs: medial prefrontal cortex (mPFC) and posterior cingulate cortex (PCC). We included these regions because of their involvement in narrative perception, event processing, and longer time-scales of integration (Hasson et al., 2015).
Intersubject correlation
We assessed whether participants were processing the movie in a similar way using intersubject correlation (ISC; Hasson et al. 2004; Nastase et al. 2019). For each voxel, we correlated the timecourse of activity between a single held-out participant and the average timecourse of all other participants in a given age group. We iterated through each participant and then created the average ISC map by first Fisher-transforming the Pearson correlations, averaging these transformed values, and then performing an inverse Fisher-transformation on the average. We visualize the whole-brain map of the intersubject correlations for adults and infants separately, thresholded at a correlation of 0.10.
For the ROI analysis, the voxel ISCs within a region were averaged separately for each held-out participant using the Fisher-transform method described above. Statistical significance was determined by bootstrap resampling. We randomly sampled participants with replacement 1,000 times, on each iteration forming a new sample of the same size as the original group, then averaged their ISC values to form a sampling distribution. The p-value was calculated as the proportion of resampling iterations on which the group average had the opposite sign as the original effect, doubled to make it two-tailed. For comparing ISC across infant and adult groups, we permuted the age group labels 1,000 times, each time recalculating ISC values for these shuffled groups and then finding the difference of group means. This created a null distribution for the difference between age groups.
Event segmentation model
To determine the characteristic patterns of event states and their structure, we applied a Hidden Markov Model (HMM) variant (Baldassano et al., 2017) available in BrainIAK (Kumar et al., 2020) to the average fMRI activity of participants from the same age group. This model uses an algorithm that alternates between estimating two related components of stable neural events: (1) multivariate event patterns and (2) their event structure (i.e., placement of boundaries between events). The constraints of the model are that each event state is only visited once, and that staying versus transitioning into a new event state have the same prior probability. Model fitting stopped when the log probability that the data were generated from the learned event structure (i.e., log-likelihood; Etz 2018) began to decrease.
To deal with missing data in the input (a reality of infant fMRI data), we modified the BrainIAK implementation of the HMM. First, in calculating the probability that each observed timepoint was generated from each possible event model, timepoint variance was scaled by the proportion of participants with data at that timepoint. In other words, if some infants had missing data at a timepoint because of head motion or gaze, the variance at that timepoint was adjusted by the square-root of the maximum number of participants divided by the square-root of the number of participants with data at that point. This meant that even though the model was fit on averaged data that obscured missing timepoints, it had an estimate of the “trustworthiness” of each timepoint. Second, for the case in which missing timepoints persisted after averaging across participants, the log-probability for the missing timepoint was linearly interpolated based on nearby values.
The HMM requires a hyperparameter indicating the number of event states. By testing a range of event numbers and assessing model fit, we can determine the optimal number of events for a given voxel or region. We used a cubical searchlight (7×7×7 voxels) to look at the timescales of event segmentation across the whole brain. In a given searchlight, the HMM was fit to the average timecourse of activity for a random split half of participants using a range of event counts between 2 and 21. We capped the maximum number of possible events at 21 to ensure that at least some events would be several TRs long. The learned event patterns and structure for each event count were then applied to the average time course of activity for held-out data, and model fit was assessed using the log-likelihood. We iterated through this procedure, each time splitting the data in half differently. The center voxel of the searchlight was assigned the number of events that maximized the average log-likelihood across 24 iterations (chosen to be approximately the same number of iterations as a leave-one-participant-out analysis). This analysis was performed in each searchlight, separately for adults and infants, to obtain a topography of event timescales. We also used this method to determine the optimal number of events for each of our ROIs. In these analyses, the timecourse of activity for every voxel in the ROI was used to learn the event structure.
To test whether a given ROI had statistically significant event structure, we used a nested cross-validation approach. The inner loop of this analysis was identical to what is described above, except that a single participant was completely held out from the analysis. After finding the optimal number of events for all but that held-out participant, the event patterns and structure were fit to that participant’s data. The log-likelihood for those data was compared to a permuted distribution, where the participant’s data was time-shifted for every possible shift value between one and the length of the movie. We calculated a z-statistic as the difference between the actual log-likelihood and the average log-likelihood of the permuted distribution, divided by the standard deviation of the permuted distribution. We then iterated through all participants and used bootstrap resampling of the z-statistics to determine significance. We randomly sampled participants with replacement 1,000 times, on each iteration forming a new sample of the same size as the original group, then averaged their z-statistics to form a sampling distribution. The p-value was calculated as the proportion of resampling iterations with values less than zero, doubled to make it two-tailed.
Behavioral segmentation
Behavioral segmentation was collected from 22 naive undergraduate students attending Yale University (18 – 22 years; M = 18.86, SD=0.97; 14 female) All participants provided informed consent and received for course credit. Participants were instructed to attend to the Aeronaut movie and press a key on the keyboard to indicate whenever a new, meaningful event occurred. Participants watched a version of the movie with its accompanying audio – a musical track without language. While the visual input remained the same as the fMRI data collection, these auditory cues may have influenced event segmentation (Cutting, 2019). During data collection, participants also evaluated nine other movies, not described here, and verbally recalled each movie after segmenting. We elected to have participants use their own judgement for what constituted an event change. Participants had a 1-minute practice movie to orient them to the task, and the Aeronaut movie appeared in a random order among the list of other movies. To capture “true” event boundaries and avoid contamination by accidental or delayed key presses, we followed a previously published procedure (Ben-Yakov and Henson, 2018). That is, we set a threshold for the number of participants who indicated the same event boundary, such that the number of event boundaries agreed upon by at least that many participants was equal or close to the average number of key presses across participants. We found 11 event boundaries (12 events) that were agreed upon by 32% of participants (for reference, ∼31% was used in Ben-Yakov and Henson 2018).
To evaluate whether these behavioral boundaries predicted neural data, we tested whether voxel activity patterns for timepoints within a boundary were more correlated than timepoints spanning a boundary. This within-vs-across boundary comparison has been used previously as a metric of event structure (Bal- dassano et al., 2017). For our analysis, we considered all possible pairs of timepoints within and across boundaries. For each temporal distance from the boundary, we subtracted the average correlation value for pairs of timepoints that were across events from the average correlation value for pairs of timepoints within the same event. At different temporal distances, there are either more or less within-event pairs compared to across-event pairs. To equate the number of within and across event pairs, we subsampled values and recomputed the within vs. across difference score 1,000 times. To combine across distances that had different numbers of possible pairs, we weighted the average difference score for each distance by the number of unique timepoint pairs that made up the smaller group of timepoint pairs (i.e., acrossevent pairs when temporal distance was low, within-event pairs when temporal distance was high). This was repeated for all participants, resulting in a single weighted within vs. across difference score for each participant. For the ROIs, we used bootstrap resampling of these participant difference scores to determine statistical significance. The p-value was the proportion of difference values that were less than zero after 1,000 resamples, doubled to make it two-tailed. For the whole-brain searchlight results, we also used 1,000 bootstrap resamples to determine statistical significance for within-vs-across difference scores for each voxel. We then calculated a z-score for each voxel as the the distance between the bootstrap distribution and zero, and thresholded the bootstrapped z-score map at p < 0.05, uncorrected.
Author contributions
T.S.Y: Conceptualization, Software, Data collection, Formal analysis, Writing - original draft, Writing - review and editing. L.J.S.: Data collection, Writing - review and editing. C.T.E.: Conceptualization, Data collection, Writing - original draft, Writing - review and editing. A.J.B.: Data collection, Writing - review and editing. C.B.: Methodology, Software, Writing - review and editing. N.B.T-B.: Conceptualization, Data collection, Writing - original draft, Writing - review and editing, Supervision, Funding acquisition.
Acknowledgments
We are thankful to the families of infants who participated. We also acknowledge the hard work of the Yale Baby School team, including L. Rait, J. Daniels, and K. Armstrong for recruitment, scheduling, and administration. Thank you to J. Wu, J. Fel, and A. Klein for help with gaze coding and to R. Watts for technical support. We are grateful for internal funding from the Department of Psychology and Faculty of Arts and Sciences at Yale University. N.B.T-B. was further supported by the Canadian Institute for Advanced Research and the James S. McDonnell Foundation (https://doi.org/10.37717/2020-1208).
Appendix 1
Log-likelihood simulations
To assess whether the log-likelihood metric would be biased to higher or lower numbers of events, we tested how well we could recover event structure in simulated data. We first generated event patterns (voxels by number of events) with values drawn from a standard normal distribution. Because each voxel was treated as an independent source, we used fewer voxels (5) than our actual analyses to better simulate the correlated patterns present in real fMRI data. Event labels were assigned to each of 90 timepoints. We generated 25 “participants” by applying the simulated event patterns to each timepoint with an additional noise component (cov: the covariance matrix of a multivariate nor- mal distribution). The resulting voxel by timepoint matrices were convolved with a double-gamma hemodynamic response function (HRF) using an fMRI simulation package (Ellis et al., 2020c) available in BrainIAK (Kumar et al., 2020). We followed the same analysis approach described in the Methods and Materials section to estimate the optimal number of events while simulating across a range of actual numbers. We calculated model error as the difference between the actual simulated number and the estimated optimal number.
With low noise (cov = 0.1), the timepoint by timepoint similarity matrices showed clear block structure along the diagonal. Average error between model estimates and the correct number of events was negative (M = -1.10, p < 0.001), meaning that the model under-estimated the number of events (Appendix 1 Figure 1). When noise increased to a moderate level (cov = 2), model error did not significantly differ from zero (M = 0.042, p = 0.900), that is, it did not under- or over-estimate the number of events. With high noise (cov = 20), model error was positive (M = 1.95, p < 0.001), indicating that the model over-estimated the number of events.

Simulations of log-likelihood metric under different noise regimes. Dots represent differences between the K values that maximized the model log-likelihood and the actual simulated K values for different iterations. One example error value for each noise regime is circled, and its corresponding timepoint-by-timepoint correlation matrix is inset. Boundaries demarcating the model’s best estimated K value are shown in red. In general, K values were underestimated when noise was low, guessed correctly when noise was moderate, and overestimated when noise was high.
Appendix 2
Alternative behavioral boundary approach
We tested whether voxel activity patterns for timepoints within a behavioral boundary were more correlated than timepoints spanning a boundary by considering all possible pairs of timepoints within and across boundaries up to the temporal distance of the largest event. This approach has the advantage of using as many timepoint pairs as possible for calculating within vs. across boundary correlations, but may be vulnerable to increased noise due to comparing timepoints from different parts of the movie. Here we report a more conservative approach for testing how behavioral boundaries predict neural data by only considering timepoint pairs that are equated in temporal distance and also “anchored” to the same timepoint. Namely, for each TR we measured the correlation between the spatial activity pattern at that timepoint and timepoints forward and backward in time at a matched temporal distance. If one timepoint pair was within an event and the other was across an event, we calculated the within minus across boundary correlation. However, if both timepoint pairs were either within an event or across an event, or if one of the timepoint pairs was already included in a different calculation, the within vs. across boundary correlation was not included. We performed this for each temporal distance up to the length of the largest event and calculated the average within vs. across boundary correlation for each subject. For statistical analysis, we used the same bootstrap resampling techniques described in the Methods.
In adults, the searchlight analysis again showed that occipital pole, superior occipital cortex, and right supramarginal gyrus exhibited significantly greater pattern similarity within vs. across behavioral event boundaries (Figure 1A). In fact, the voxelwise map of the average within vs. across boundary correlation was highly correlated with the map using our main approach (r = 0.865). We also found several regions showing greater pattern similarity within vs. across behavioral boundaries in infants, where again the voxelwise map was the highly correlated with our main results (r = 0.854).
For the ROIs, the within vs. across behavioral boundaries were now marginal in early visual cortex and otherwise non-significant in adults (Figure 5C; EVC: M = 0.015, CI = [-0.001, 0.031], p = 0.086; LOC: M = 0.006, CI = [-0.011, 0.021], p = 0.412; AG: M = -0.020, CI = [-0.051, 0.009], p = 0.174; PCC: M = -0.014, CI = [-0.039, 0.010], p = 0.292; precuneus: M = -0.016, CI = [-0.043, 0.010], p = 0.274; mPFC: M = -0.009, CI = [-0.022, 0.005], p = 0.206); hippocampus: M = -0.006, CI = [-0.017, 0.003], p = 0.222; EAC: M = 0.000, CI = [-0.010, 0.012], p = 0.928). In infants, there were again significant results in early visual cortex and PCC, with marginally significant results in the hippocampus and EAC (EVC: M = 0.057, CI = [0.018, 0.099, p = 0.002; LOC: M = 0.022, CI = [-0.016, 0.061], p = 0.286); AG: M = 0.035, CI = [-0.012, 0.091], p = 0.174); PCC: M = 0.046, CI = [0.007, 0.089], p = 0.022; precuneus: M = 0.025, CI = [-0.005, 0.063], p = 0.152; mPFC: M = 0.003, CI = [-0.030, 0.036], p = 0.862; hippocampus: M = 0.035, CI = [-0.001, 0.079], p = 0.060; EAC: M = 0.033, CI = [-0.002, 0.074], p = 0.074). Thus, the findings were largely consistent across the two approaches.

Alternative approach relating behavioral boundaries to neural activity. (A) Whole-brain searchlight analysis for each age group comparing pattern similarity between timepoints drawn from within vs. across behavioral event boundaries when pairs of correlations are anchored to the same timepoint. Bootstrapped z-scores are thresholded at p < 0.05, uncorrected. (C) ROI analysis of difference in pattern similarity within minus between behavioral events. Dots represent individual participants and error bars represent 95% CIs of the mean from bootstrap resampling. Adult participants with values beyond the y-axis range for AG, PCC, and precuneus are indicated with Xs at the negative edge. Infant participants with values beyond the y-axis range for EVC, AG, PCC, precuneus, hippocampus, and EAC are indicated with Xs at the positive edge. *** p < 0.001, ** p < 0.01, * p < 0.05, ∼p < 0.1.
Appendix 3
Mickey dataset
We applied our analyses to a second, previously collected dataset of infant movie-watching. This provides a test of generalization, as the data came from a different group of infants, who spanned a wider age range, and watched a different movie. fMRI data were collected in 15 sessions (4.00 – 32.60 mo; M = 13.92, SD = 8.87; 9 female) while infants watched a silent cartoon lasting 142 s (“Mickey”). This movie was shown on a smaller display than the Aeronaut movie, spanning 22.75 visual degrees in width and 12.75 visual degrees in height. In this video, a surprise party is thrown where characters dance and play the piano while one character makes an exploding cake in the kitchen. Two infants participated twice after a delay (6.3 months and 2.3 months difference) and were treated as independent sessions. As before, additional infants with head motion above 3 mm (N = 5) or eyes off-screen (N = 2) for more than half of the movie were excluded. For comparison, we also collected data from 15 adults (19 – 27 years; M = 21.47, SD = 2.90; N = 10 female) who watched the same movie. All adults and 9 infants watched the movie twice in a row. For these participants, data were averaged across the two viewings. This helped with robustness to excision of individual timepoints with excessive motion or eye closure, as the corresponding timepoint from the other viewing could be retained. Infants were collected at the Scully Center for the Neuroscience of Mind and Behavior at Princeton University (N = 7) and the Magnetic Resonance Research Center (MRRC) at Yale University (N = 8). Adult participants were collected at the Brain Imaging Center (BIC) at Yale University. This study was approved by the Institutional Review Board at Princeton University and the Human Investigation Committee (MRRC) and Human Subjects Committee (BIC) at Yale University. Adults provided informed consented for themselves or their child.
Data acquisition, preprocessing, and analyses were identical to the Aeronaut dataset with two minor variations: First, infant data were acquired at Princeton using a Siemens Skyra (3T) MRI. Second, functional images for infants were collected under a slightly different functional EPI sequence (TR = 2s, TE = 28ms, flip angle = 71, matrix = 64×64, slices = 36, resolution = 3mm iso, interleaved slice acquisition). Adults were collected with the same functional sequence as Aeronaut (same as above except with TE = 30, slices = 34). Gaze coding was highly reliable: coders reported the same response on an average of 91.4% of frames (SD = 5.0%; range across participants = 79.7–98.4%). The average proportion of TRs retained after exclusion for looking off screen was high in adults (M = 99.3%, SD = 1.6%; range across participants = 93.9–100%) and infants (M = 89.1%, SD = 13.0%; range across participants = 58.1–100%). Eye-tracking data were not collected for one infant because of experimenter error. Timepoints with less than 3mm of translational motion were included (infants: M = 91.2%, SD =10.7%, range across participants = 64.9%–100%; adults: 100% for all participants).
In the whole-brain analysis, ISC was again strongest in visual regions for both adults and infants (Appendix 2 Figure 1). In the ROI analysis, adult ISC was significant in EVC (M = 0.468, CI = [0.420, 0.516], p < 0.001), LOC (M = 0.383, CI = [0.330, 0.438], p < 0.001), AG (M = 0.151, CI = [0.121, 0.186], p < 0.001), PCC (M = 0.187, CI = [0.114, 0.264], p < 0.001), precuneus (M = 0.227, CI = [0.177, 0.281], p < 0.001) and EAC (M = 0.045, CI = [0.006, 0.084], p = 0.026); marginal in mPFC (M = 0.031, CI = [-0.004, 0.066], p = 0.088); and not significant in hippocampus (M = 0.011, CI = [-0.010, 0.030], p = 0.290). Infant ISC was significant in EVC (M = 0.076, CI = [0.032, 0.123], p < 0.001), LOC (M = 0.039, CI = [0.009, 0.073], p = 0.019); significant or marginal in a negative direction (likely noise) in AG (M = -0.039, CI = [-0.085, 0.002], p = 0.084), PCC (M = -0.066, CI = [-0.127, -0.007], p = 0.037), and EAC (M = -0.049, CI = [-0.082, -0.016], p = 0.002); and not significant in precuneus (M = -0.014, CI = [-0.060, 0.032], p = 0.575), mPFC (M = 0.000, CI = [-0.035, 0.036], p = 0.994), or hippocampus (M = 0.050, CI = [-0.014, 0.114], p = 0.129). ISC was significantly greater in adults than infants in EVC (M = 0.393, permutation p < 0.001), LOC (M = 0.344, p < 0.001), AG (M = 0.190, p < 0.001), PCC (M = 0.252, p < 0.001), precuneus (M = 0.240, p < 0.001), and EAC (M = 0.094, p = 0.003); and not significantly different in mPFC (M = 0.031, p = 0.238) and hippocampus (M = -0.039, p = 0.298).

Average leave-one-out intersubject correlation (ISC) in adults and infants watching the Mickey movie. (A) Whole-brain voxel-wise ISC values in the two groups, thresholded for visualization purposes at voxels with correlation values greater than 0.10. (B) ISC values in the ROIs, with the mean at the column height. Dots represent individual participants and error bars represent 95% CIs of the mean from bootstrap resampling. *** p < 0.001, ** p < 0.01, ∼p < 0.1.
In the searchlight analysis, we applied an HMM to one half of adult or infant participants using a range of event numbers from 2 to 18 and then tested on the second half. This maximum number of events ensured that at least some events were several TRs long, but was less than Aeronaut because the Mickey movie was shorter. Log-likelihood was again used to assess model fit. Similar to our main analyses, sensory regions of the adult brain had more events than higher level regions, although there were fewer events overall (Appendix 2 Figure 2). We replicated the lack of a gradient of event processing in infants, with the optimal number of events generally low across the brain.
In the nested analysis for reliability of event structure, most ROIs were significant in adults, including EVC (M = 3.98, CI = [3.66, 4.31], p < 0.001), LOC (M = 4.35, CI = [3.87, 4.77], p < 0.001), AG (M = 1.72, CI = [0.515, 2.96], p = 0.010), PCC (M = 3.59, CI = [2.62, 4.45], p < 0.001), precuneus (M = 4.42, CI = [3.97, 4.88], p < 0.001), and EAC (M = 2.69, CI = [1.56, 3.80], p < 0.001); but not mPFC (M = 0.157, CI = [-1.21, 1.42], p = 0.840) or hippocampus (M = 0.273, CI = [-0.822, 1.37], p = 0.724). In infants, reliable event structure was found in EVC (M = 2.04, CI = [0.972, 2.97], p < 0.001), LOC (M = 2.85, CI = [1.83, 3.77], p < 0.001), precuneus (M = 3.42, CI = [2.23, 4.30], p < 0.001), mPFC (M = 2.56, CI = [1.38, 3.63], p < 0.001), and hippocampus (M = 1.31, CI = [0.366, 2.13], p = 0.002); marginal in EAC (M = 0.846, CI = [-0.047, 1.74], p < 0.035); and not in AG (M = 0.735, CI = [-0.097, 1.65], p = 0.100) or PCC (M = 0.399, CI = [-0.364, 1.22], p = 0.306). By generalizing to a different movie with distinct samples across a wider infant age range, these results provide further evidence for coarser event representations in infancy.

Event structure and reliability for the Mickey movie. (A) The optimal number of events plotted across the brains of adults and infants. Voxels with an average ISC value greater than 0.10 are plotted for visualization purposes. (B) Results of the nested cross-validation procedure for computing the reliability of event segmentation in ROIs for adults and infants, calculated as the z-statistic comparing actual and permuted participant data. The number of events that optimized model log-likelihood in the full sample of participants is labeled below the x-axis. Dots represent individual participants and error bars represent 95% CIs of the mean from bootstrap resampling. *** p < 0.001, ** p < 0.01, * p < 0.05.
Appendix 4
Nonlinear alignment
In our main analyses, we used a linear alignment procedure for infant anatomical images (with manual adjustments). However, dramatic developmental differences within and across ages raise the possibility that a nonlinear approach may be more appropriate. We thus used ANTS (Avants et al., 2011) to re-align infant and adult brain data from the Aeronaut dataset to adult anatomical data. We then repeated the whole-brain ISC analyses and the searchlight analyses of optimal event number. For both adults and infants, the results were unchanged: ISC was highest in visual regions in both adults and infants (Appendix 3 Figure 1A) and there was a gradient in the number of events that maximized the model log-likelihood in adults but not infants (Appendix 3 Figure 1B). Thus, our results are robust to these procedures for aligning between infant and adult brains.

Results from nonlinear anatomical alignment. (A) Whole-brain voxel-wise ISC values in the two groups. (B) The optimal number of events for a given voxel was determined via a searchlight analysis across the brain, which found the number of events that maximized the model log-likelihood in held-out data. In both panels, voxels with an average ISC value greater than 0.10 are plotted for visualization purposes.
Footnotes
↵1 In simulated data, the model tended to over-estimate the optimal number of events when noise increased. (Appendix 1 Figure 1). This suggests that the smaller number of events in infants was not because of increased noise per se.


