

Abstract
Theoretical models are fundamental in Ecology and Evolutionary Biology (EEB), but they can be difficult to teach in undergraduate classrooms because students come in with inconsistent mathematical training and varying attitudes towards mathematics. A promising way to make these models more approachable is to use active learning exercises that allow model exploration and simulation. Thus, we present EcoEvoApps, a collection of free, open-source interactive web apps that simulate various theoretical EEB models. By surveying students who used these apps in two remote undergraduate Ecology courses in the U.S.A., we found that using the apps led to considerable gains in students’ confidence and understanding of the focal models and underlying concepts. We envision EcoEvoApps as a widely available, equitable tool for students around the globe. Consequently, we have developed EcoEvoApps as a fundamentally collaborative platform, with an aim to build an international community of EEB researchers, educators, and students.
Introduction
Mathematical and conceptual models are foundational for research and teaching across the life sciences (Jungck 1997), especially in ecology and evolutionary biology (EEB) (Marquet et al. 2014, Servedio et al. 2014). Such models promote a deeper conceptual understanding of biological systems by clarifying the role and consequence of different biological factors, disentangling complex interactions and feedbacks, and explaining or even revealing novel phenomena. Furthermore, mathematical models can have important applications in biological forecasts and in informing actions and policies at the interface of science and society (Conway 1977, Odenbaugh 2005, Akçakaya et al. 2007). Given their vital role, theoretical models have long been central features of many undergraduate EEB textbooks and courses (e.g. Otto and Day 2007, Gotelli 2008). More recently, there has been a renewed emphasis on strengthening quantitative and computational training in undergraduate curricula, due to both the increasingly quantitative nature of EEB research and the increased demand for such skills across STEM careers (Cohen 2004, Ellison and Dennis 2010, Hunter 2010, Losos et al. 2013, Barraquand et al. 2014, Feng et al. 2020, Cooke et al. 2021). A central challenge for instructors teaching quantitative topics is the need to manage issues such as limited mathematical training or negative emotions towards mathematics among students, which can interfere with students’ abilities to process mathematical problems and can lower student achievement and interest across STEM disciplines (Ashcraft 2002, Foley et al. 2017).
One promising approach for effectively teaching quantitative biology models is to use activities that allow students to directly interact with these models, rather than relying solely on traditional lecture- or textbook-based instruction (Waldrop et al. 2015, Sperber et al. 2020). Active learning strategies can increase student performance (Freeman et al. 2014) and enhance student understanding of core quantitative topics (Thompson et al. 2010, Goldstein and Flynn 2011, Bravo et al. 2016). In particular, exercises that integrate interactive computer apps can help students understand complex mathematical models (Soderberg and Price 2003, Whitworth et al. 2018, Neyhart and Watkins 2020). Such simulation exercises can promote student appreciation of mathematics in biology by making theoretical models more approachable (e.g. Thompson et al. 2010), and when used effectively, can also help develop students’ scientific inquiry skills by allowing them to directly interrogate model behavior (Smetana and Bell 2012).
Another growing concern is to make access to education globally equitable, for example through the development of open educational resources that make content freely available in multiple languages (Cobo 2013, Miao et al. 2016). Addressing the need for free and inclusive educational resources for EEB has become more feasible with the advent of open-source projects like R (R Core Team 2021) and the shiny framework (Chang et al. 2021). R is an open-source statistical computing language that is popular among EEB researchers (e.g. Lai et al. 2019) and is increasingly becoming an important component of EEB education (Auker and Barthelmess 2020). With the shiny package, R code can be used to build web-based apps that present reactive visualizations, which users can interact with through a variety of intuitive input options (e.g. numeric or text input, slider bars, action buttons). These apps can either be installed onto individual computers and run locally, or be centrally hosted online (e.g. on RStudio’s shinyapps.io platform), which dramatically reduces the need for computational power on students’ personal computers or mobile devices. Unlike some other proprietary simulation platforms that charge substantial fees, shiny apps can be made freely available to students, making them more equitable classroom materials (Colvard et al. 2018, Nusbaum et al. 2020). Further, shiny apps are straightforward to build for users with some R proficiency, which makes it easy for instructors to develop new apps or to customize existing resources to suit their classroom needs.
Here we describe EcoEvoApps, an open-source R package (ecoevoapps) and website (https://ecoevoapps.gitlab.io) that provides a collection of functions and freely available shiny apps that simulate theoretical EEB models. The package also includes functions to directly run models through the R console. To illustrate the value of these apps for teaching quantitative ecology, we also present results of student surveys from two undergraduate courses that incorporated these apps into course assignments. Throughout the manuscript we highlight the collaborative, open-source nature of EcoEvoApps, and present several mechanisms by which educators, researchers, and students can contribute to the project. While the apps currently included in the package focus primarily on ecological models to reflect the authors’ expertise and teaching needs, we outline a vision to grow EcoEvoApps to include a wider array of models, including core models from evolutionary biology and apps that help develop other quantitative skills like graphical literacy.
Implementation
The ecoevoapps R package currently includes 11 shiny apps, along with associated functions that simulate model dynamics (Supplement S1). The existing apps can be broadly grouped into three categories: population ecology, species interactions, and landscape ecology. The ecoevoapps package depends on various packages in the Tidyverse (Wickham et al. 2019), which in turn requires R version 3.3 or above. The functions in ecoevoapps also make extensive use of deSolve (Soetaert et al. 2010) to simulate differential equations. The shiny apps can either be accessed directly on RStudio’s shinyapps.io servers (links in Supplement S1), or they can be directly deployed from users’ personal computers by installing the package (instructions available on the package website: https://gitlab.com/ecoevoapps/ecoevoapps). Each app also includes a brief description of the model structure and history, and a table with parameter definitions. The code for all models is openly available, so users can also simulate the models directly through the R console rather than through the apps. Importantly, we have developed EcoEvoApps as a community-based educational resource which can evolve to suit the needs of educators through the contribution of additional apps. In the following sections, we describe apps in the three aforementioned categories, and then describe how other researchers, educators, and students can contribute to the project.
Population dynamics
Population ecology models often serve as an introduction to mathematical modeling in ecology (Gotelli 2008). The ecoevoapps package includes five apps that simulate single population dynamics. For example, the “Single Population Growth in Continuous Time” app begins by simulating the dynamics of a population experiencing exponential growth in continuous time. Users can visualize the model’s dynamics in terms of population size (or log population size) over time (Fig. 1b, 1c), and in terms of population growth rate as a function of population size (Fig. 1d, 1e). The app also allows users to add some biological realism by introducing density-dependence in the form of logistic growth up to a carrying capacity. This density-dependence may either be instantaneous, or operate with a time lag. Sufficiently high intrinsic growth rates or time lags can be used to show how damped oscillations arise even in this simple population growth model. Users can simulate the dynamics of a second species and visualize both populations on the same graph to visualize how small changes in parameter values can have large effects on population dynamics.

User interface of the “Single Population Growth in Continuous Time” app, showing an exponentially growing species. (a) Users can specify the type of growth, rate of growth, and type of plots for one species. Users can input values of carrying capacity and time lag if simulating a population with density-dependent growth (not shown). Plots (b) and (c) respectively show population size and the natural log of population size against time. Plots (d) and (e) respectively show population growth rate and per capita growth rate as a function of population size.
ecoevoapps includes three other apps that simulate population growth models. The “Single Population Growth in Discrete Time” app simulates population growth using the discrete exponential, discrete logistic (May and Oster 1976), Ricker (Ricker 1954), or Beverton-Holt (Beverton and Holt 1957) models. The “Structured Population Growth” app models the dynamics of a structured population, in which the survival and fecundity rates vary among age classes. The “Source-Sink Dynamics” app implements Pulliam’s (1988) metapopulation model, which describes the dynamics of a population whose growth in a “source” habitat can maintain its presence in a “sink” habitat if there is sufficient migration, and if the quality of the source is sufficiently high. Finally, ecoevoapps includes an app that implements the offspring size optimality model of Smith and Fretwell (1974), which explores the fundamental life history trade-off between making few large vs. many small offspring.
Species interactions
Ecology classes often build on single-species population dynamics models by introducing models that describe the dynamics of multiple interacting species. The ecoevoapps package has five apps that simulate a variety of such interactions, including competition, predator-prey dynamics, and disease dynamics. For example, the “Infectious Disease” app simulates several compartmental models of infectious disease spread through populations of interacting individuals. In the classic SIR model (Kermack et al. 1927), the disease transmits from infectious to susceptible individuals, who recover with immunity (Fig. 2). The app also presents other scenarios, such as diseases from which recovered individuals cannot gain immunity and instead become susceptible again (SIS), or diseases that can incubate in exposed individuals who are not yet infectious (SEIR). The rate of change of each group is governed by the natural birth/death rate, infection rate at encounter, recovery rate, and vaccination rate for newborns (Fig. 2a). Users can adjust these parameters to study the effect of individual processes (e.g. vaccination) amongst complex interactions.
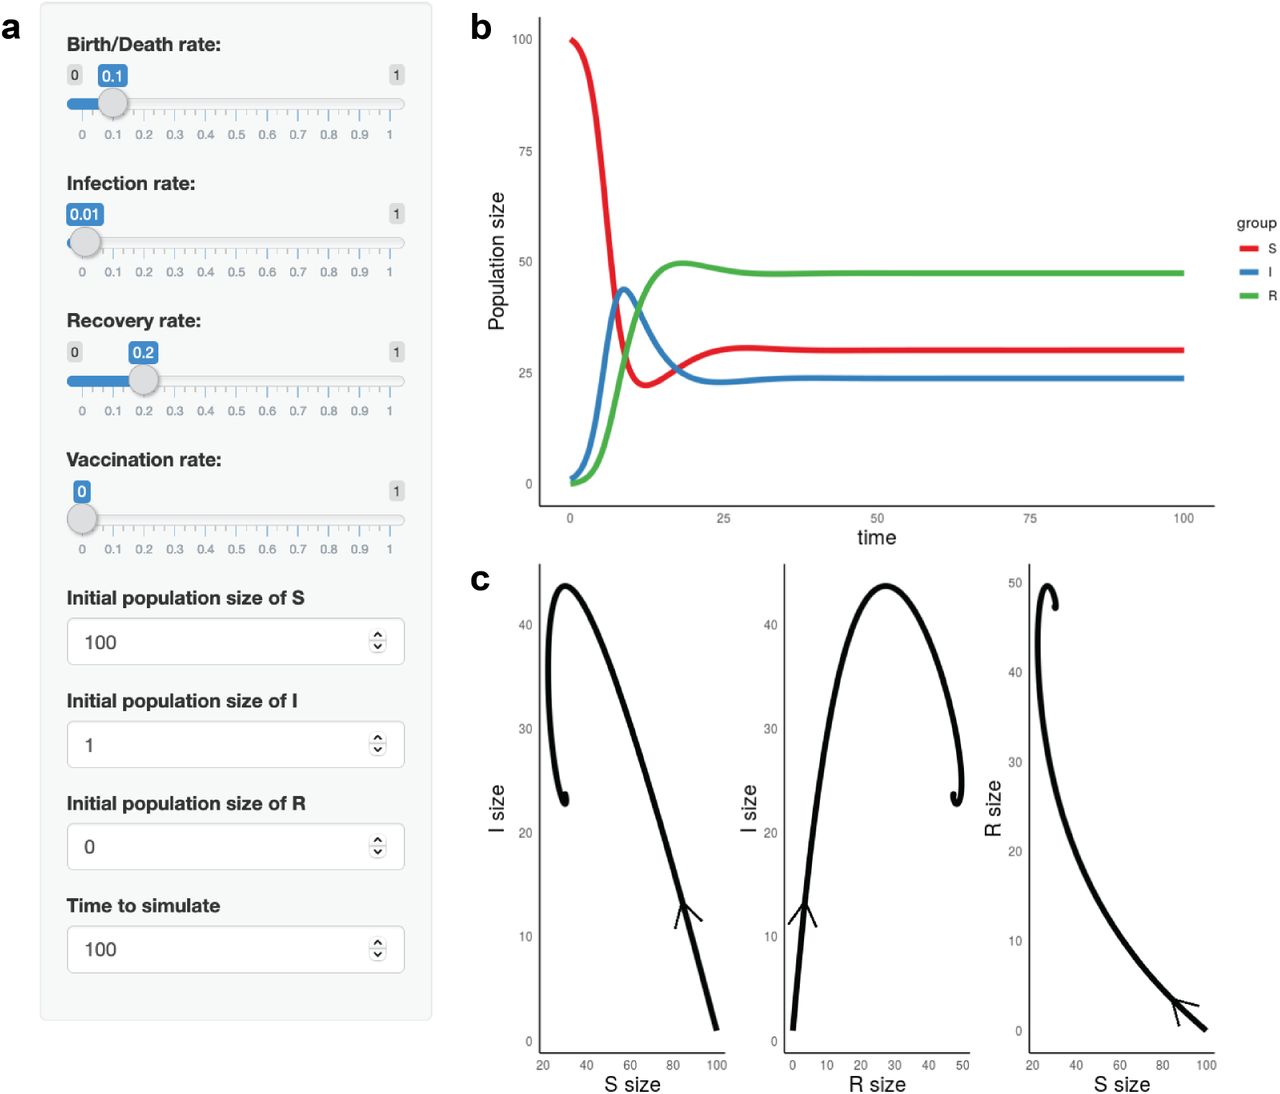
User interface of the “Infectious Disease” app, featuring the classic SIR model. (a) Users can define the rates of birth/death process, infection, recovery, and vaccination, and specify the initial size of the susceptible, infectious, and recovered populations. Plots (b) and (c) respectively visualize the population sizes against time and against each other under the density-dependent transmission, which depends on the absolute number of the susceptible individuals. Users can also define the transmission to be frequency-dependent, i.e., dependinging on the relative frequency of the susceptible individuals in the whole population.
The other four apps in this category cover a diversity of interactions. The “Consumer-Resource Dynamics” app models the interaction between a predator (consumer) population and its prey (resource). Users can explore four scenarios, with prey species growing exponentially or logistically, and the predator consuming prey with either a Holling’s (1959) type I or type II functional response. The “Lotka-Volterra Competition” app presents the classic interaction between two competing populations, where the competitive effects are captured by some collective terms without mechanistic details (Lotka 1932). In comparison, the “Abiotic Resource Competition” and “Biotic Resource Competition” apps explicitly incorporate the dynamics of two abiotic essential resources or a biotic resource (prey), respectively, and the consumption of the resource by both competitors (Armstrong and McGehee 1980, Tilman 1980).
Landscape ecology
Ecological processes, including species interactions, can play out on spatial landscapes. Modeling has been an effective teaching method for landscape ecology because it is otherwise challenging to conduct large-scale experiments or observational studies (Pearson et al. 1999, but see Almeida-Gomes et al. 2016). ecoevoapps has two apps to simulate population dynamics that incorporate spatial movements. One is the “Source-Sink Dynamics” app, which we previously described under “Population Ecology.” The second landscape ecology app implements the classic “Island Biogeography” model of MacArthur and Wilson (1967), which models species richness on islands as an outcome of migration from the mainland and extinction on the island. Users can define the area of an island, its distance to the mainland, and the mainland species richness (Fig. 3a). These three parameters together determine the equilibrium island species richness. The app simulates two islands for side-by-side comparison of parameter effects. It generates a graphical illustration of island size and distance to the mainland (Fig. 3b), and another plot to visualize the resulting migration and extinction rates, whose intersection determines the equilibrium species richness (Fig. 3c).

User interface of the “Island Biogeography” app. (a) Users define the areas of both islands, their distances to the mainland, and the mainland species richness. Plot (b) visualizes island size and distance from mainland according to the defined parameters. Plot (c) shows the immigration and extinction rates on both islands and their respective equilibrium species richness (here, 50 species on Island A and 11 on Island B).
Contribution
We have developed EcoEvoApps as a collaborative, open-source project in which we seek to leverage the diverse expertise of the EEB community to build an open-source teaching resource. As such, EcoEvoApps offers several mechanisms by which educators, researchers, and students can easily contribute to the project. These mechanisms include (1) writing and contributing new apps, (2) submitting links to external apps for inclusion in the EcoEvoApps website, (3) revising existing apps, (4) reviewing newly contributed apps or features, (5) providing feedback, translating apps, or requesting new apps or features, and (6) contributing classroom activities involving EcoEvoApps (see Supplement S3 for detailed contribution guidelines). We have already invited contributions from multiple EEB researchers and feature several external apps on the website (Supplement S2). As an initial step towards our goal of making EcoEvoApps globally accessible and to inspire future contributions, we have also translated the “Island Biogeography” app into Chinese, Portuguese, and Spanish.
Teaching methods
To determine the value of these apps for teaching theoretical ecology concepts, we surveyed students who used EcoEvoApps in two upper-division undergraduate ecology courses. Students in BIOL 3650 (General Ecology) at the University of Missouri, Columbia (“MU”), completed activities using the Lotka-Volterra Competition and Infectious Disease apps, and students in EE BIOL 122 (Ecology) at the University of California, Los Angeles (“UCLA”) completed activities using the Lotka-Volterra Competition and Island Biogeography apps. Students were offered extra-credit points for completing a learning activity (Supplement S4) using the interactive apps and were encouraged to complete a survey (Supplement S5) before and after completing the activity. Classroom research was reviewed by the MU Institutional Review Board (Project #2031063; Review #276104) and the UCLA Institutional Review Board (IRB#20-002179), and was determined to constitute “exempt” studies.
The pre-activity survey at both universities asked students to rate their interest in six ecological sub-disciplines (population ecology, community ecology, conservation ecology, ecosystem ecology, global change ecology, and disease ecology). Students were also asked to report their confidence on a scale of 1-7 in specific concepts that were either relevant to the focal learning activity, or control topics that were related to a different topic covered in the course (Structured population growth in the MU class; Biogeochemistry/Molecular ecology in the UCLA class). The learning activities at both universities were worksheets that guided students through manipulating the apps with various parameter combinations, which were chosen to illustrate specific biological scenarios. For example, the MU Lotka-Volterra competition activity asked students to identify a pair of values for the interspecific competition terms α and β for which the competing species coexist despite a large carrying capacity imbalance. The UCLA learning activity also included a short instructional video explaining the conceptual basis of the focal model, as well as a demonstration of the interactive app. Worksheets from both classes are available in Supplement S4.
At MU, questions on the post-activity survey were the same as those on the pre-activity survey. This allowed us to calculate, for each student, the change in confidence in specific concepts related to the focal models before and after using an interactive app. At UCLA, the post-activity survey asked students to rate on a scale of 1-7 how helpful they found the interactive apps as a way to learn a series of relevant concepts, and also requested general feedback to help improve the apps through a free-response question. Although the UCLA survey design did not allow us to track potential changes in individual students’ confidence with the topics, we used these responses to evaluate whether students generally found the interactive apps to be a helpful and engaging way to learn ecological models.
We evaluated whether using the interactive apps changed students’ self reported confidence between the pre- and post-activity surveys at MU by computing the normalized change metric (Marx and Cummings 2007), modified to reflect 7 as the maximum score for each question:

This metric scales each students’ realized gains or losses relative to the maximum possible gain or loss according to the pre-activity survey, thus allowing for more fair comparisons among questions. Following Marx and Cummings (2007), we interpret the results in terms of the mean and standard error of the normalized change for each question. We used data from the UCLA surveys to evaluate whether students found the apps useful for learning various ecological concepts, and read through all feedback to identify the salient themes. All analyses were conducted in R version 4.0.5 (R Core Team 2021). R code to recreate analyses is provided in Supplement S7.
Teaching results
Students at MU reported substantial gains in their confidence in all concepts related to the Lotka-Volterra competition model after completing the related activity (mean ± SE of normalized change across all Lotka-Volterra-related concepts = 0.241 ± 0.0244; normalized change across all structured population growth concepts (control) = 0.152 ± 0.033, Fig. 4a). Students with higher levels of interest in community ecology generally reported higher gains in their confidence after using the app than students who were largely uninterested in community ecology (Fig. 4b). Within the Lotka-Volterra category, students reported highest gains in confidence for general concepts related to the model (e.g. positive or negative species interactions; two-species interactions) rather than for specific concepts or model parameters (e.g. competition coefficients; inter- vs. intra-specific interactions) (Fig. 4c).

Normalized change in MU students’ confidence before and after completing a learning activity that incorporated the relevant apps. Panels (a) and (d) show mean and SE (n = 32 and n = 35, respectively) for all concepts relevant to the models covered in the focal apps, or for concepts covered in the “Structured Population Growth” module of the course, which served as controls. Panels (b) and (e) show variation in normalized gains according to students’ pre-activity interest in community ecology or disease ecology, respectively. Panels (c) and (f) show normalized gains in specific topics related to the model covered in the focal app or in the control group. summarized across all concepts relevant to each model. In all panels, grey squares indicate questions from the control category (structured population growth), and the orange/green circles indicate questions from the experimental categories.
Students also reported substantial gains in confidence in concepts related to the SIR disease dynamics model as a whole (mean ± SE of normalized change across all SIR-related concepts = 0.219 ± 0.0324; normalized change across all structured population growth concepts (control) = 0.164 ± 0.0329, Fig. 4d). Gains in student confidence were largely unrelated to pre-activity interest in disease ecology, though unlike for the Lotka-Volterra app, students with the least interest in disease ecology appear to have benefitted substantially from the activity (Fig. 4e). Broken down by specific concepts, students’ understanding of how vaccination rates influence disease dynamics was the only concept substantially different from gains in the control category (Fig. 4f).
Among students at UCLA, an overwhelming majority indicated that the interactive apps were a moderately helpful to very helpful way to learn the related models (Lotka-Volterra: 78% (40/51) gave a rating of 6 or 7, and 14% gave a rating of 4 or 5; Island Biogeography: 78% gave a rating of 6 or 7, and 18% gave a rating of 4 or 5, Fig. 5a). Students reported the apps as being substantially more helpful to learn the concepts related to the Lotka-Volterra competition model or the Island Biogeography model relative to the control topics (Fig. 5b). The students generally rated the apps as being slightly less helpful to learn concepts related to the Lotka-Volterra competition model than concepts related to Island Biogeography (Fig. 5b).

Students at UCLA (n = 51) generally rated the Lotka-Volterra competition and Island Biogeography apps to be valuable tools to help learn the models overall (a), as well as for specific topics within each model (b).
The free response feedback about the apps from UCLA students largely fell into four themes: visualization, help understanding concepts, manipulating parameters/making connections, and applicability of the models (Supplement S6). A vast majority of the students (88%) reported that the models helped them learn the overall models (Lotka-Volterra/Island Biogeography) or identified a specific concept that the apps helped them understand, such as coexistence and population dynamics. In particular, 24% of students highlighted that being able to manipulate individual parameters and observe model outcomes was helpful in understanding the mathematical basis of the models, which was difficult to grasp without directly interacting with the model. 22% of students mentioned the value of the visualizations generated by the apps (time series, isoclines) for understanding model outcomes. Finally, 6% of students reported that they better understood the models by working through the case studies presented in the worksheet. Most students left comments that integrated across each of these themes, e.g.:
“The Lotka-Volterra simulation helped me understand what the Lotka-Volterra [model] predicts because it was more hands on than listening to its explanation during lecture. The island [biogeography] simulation also made it easy to understand how different variables and values of size/distance affect island populations. Visualizing these concepts made the model very clear.”
Discussion
Teaching mathematical and conceptual models, which are at the heart of a great deal of EEB research, remains a key challenge for EEB education. Thanks to new platforms like R and shiny, we now have the tools to give everyone the experience with complex feedbacks that would have taken years of modeling or empirical observation to fully comprehend. We leveraged these tools to build EcoEvoApps, a collection of web apps that allow users to interactively explore such models, adding to a variety of existing interactive EEB education web resources (e.g. Evo-Ed (http://www.evo-ed.org), HHMI BioInteractive (https://www.biointeractive.org), Populus (Alstad 2001)). We developed EcoEvoApps as an open-source R package and website so that the apps remain freely accessible resources to learn and teach models in EEB, a field where R has rapidly become one of the most common programming languages (Lai et al. 2019). We focus our Discussion on how interactive apps like those in EcoEvoApps can be used effectively to help teach quantitative concepts in classrooms in a variety of settings.
Lessons from student surveys
Our surveys of upper-division students in general ecology courses at two large public universities highlight the power of such apps to improve student understanding and confidence in key mathematical models, a central challenge in undergraduate STEM education (Beilock and Maloney 2015). In particular, students at MU generally reported higher confidence across all focal concepts after completing the activity (Fig. 4a and 4d), with two striking patterns. First, gains in student confidence in concepts related to the Lotka-Volterra competition model appeared to be strongly related to students’ pre-activity interest in community ecology, with students reporting higher interest in these concepts achieving higher gains in confidence (Fig. 4b). This is consistent with variation in students’ interest being a key driver of their learning outcomes (Renninger and Hidi 2016), and supports the value of instructors regularly incorporating activities designed to stimulate students’ situational interest (i.e. spontaneous interest stimulated by classroom environment or activities, Schraw et al. 2001) to improve learning outcomes (e.g. Pany et al. 2019). Surprisingly, we did not find the same association between student interest and gains in confidence for topics related to the SIR disease dynamics model (Fig. 4e), with the students indicating lowest interest in disease ecology before the activity reporting substantial normalized gains in confidence in topics related to the SIR model. It is possible that in this case, our activity itself served as a “trigger” for students’ situational interest in disease ecology (Hidi and Renninger 2006), which translated into higher gains in student learning for students who were largely uninterested in this subject prior to the activity.
Another striking pattern in the results from our classroom surveys is the variation in students’ self-reported gains in confidence across different concepts related to the same overarching model. For the SIR model of infectious disease dynamics, we observed substantial gains in normalized confidence in students’ understanding of how vaccination affects disease spread, while in other topics related to the SIR model, gains in confidence were not substantially higher than in unrelated control categories (Fig. 4f). This result is likely driven at least partially by conducting our survey in Fall 2020, at a time when the potential for vaccinations against SARS-CoV-2 to control the spread of COVID-19 was a dominant topic affecting almost every aspect of students’ lives (Giuntella et al. 2021). Given the topic’s timeliness, five out of the seven questions on the worksheet associated with the infectious disease dynamics app pertained to the effects of varying vaccination rates on disease spread through the population (Supplement S4). More generally, this result underscores how important it is for instructors to illustrate how quantitative ecology and evolution models can generate insights that are relevant to students’ lives (Kember et al. 2008, Hernandez-Martinez and Vos 2018). We encourage instructors to think broadly about connecting the intuitions that students can gain from fundamental EEB models to pressing issues in conservation biology, climate change, and other applied fields that students may find more directly relatable.
Moving forward, we see great value in future work that evaluates whether EcoEvoApps help students learn broader concepts from quantitative ecology and biology. In particular, future studies should quantify how using interactive apps change students’ perceptions towards mathematical biology in terms of their interest, utility value, and perceived cost using standardized instruments like the Math–Biology Values Instrument (MBVI, Andrews et al. 2017). Future studies should also evaluate whether incorporating interactive apps at all stages of undergraduate education leads to higher student learning of key ecology and evolution concepts using standardized concept inventories like EcoEvoMaps (Summers et al. 2018).
Other educational applications of EcoEvoApps
While many authors have called for an increased emphasis on quantitative training in undergraduate EEB curricula, these calls focus primarily on an increased emphasis on statistical models (e.g. Ellison and Dennis 2010) or on programming/computational skills (e.g. Losos et al. 2013, Feng et al. 2020). Curiously, despite the ubiquity of mathematical models across many EEB courses and the fundamental insights they generate (Scheiner 2013, Marquet et al. 2014, Servedio et al. 2014), there has been less attention paid to the pedagogy of theoretical models (but see Lehman et al. 2020). EcoEvoApps directly addresses this gap, and moreover, we argue that incorporating EcoEvoApps for teaching theoretical EEB models offers instructors a clear path to simultaneously address statistical, computational, and mathematical fluency. For example, instructors can develop conceptual and statistical fluency by asking students to use the discrete population growth app to explore different forms of density-dependence models, and then evaluate an empirical study that uses statistical model selection to choose the appropriate model for their focal population (e.g. Barrowman et al. 2003).
More broadly, EcoEvoApps can be used to teach skills and concepts that extend beyond the traditional domain of EEB classes. The structure of these apps, which visualize the consequences of varying parameters on model outputs, intrinsically emphasizes the importance of graphical literacy, a key skill for all undergraduate students that can be difficult to teach in traditional lectures (Glazer 2011). While the apps likely passively encourage graphical literacy by exposing students to a range of different types of graphs, we also think there is tremendous potential to incorporate EcoEvoApps into learning activities that specifically target this skill. For example, an activity in which students model population growth can also encourage students to explore the trajectory of an exponentially growing population on a linear vs. a log scale (as in Fig. 1b-c).
Instructors can then initiate a conversation centered on the observation that a population with an exponential “J” shape on a linear scale appears linear when plotted on a log scale, and explore how this relates to students’ understanding of other exponential processes. Such conversations could help address critical gaps in scientific literacy, such as the skepticism towards disease prevention measures in early phases of the COVID-19 pandemic, which was due in part to widespread misunderstanding of the nature of exponential disease spread (Katz et al. 2020, Lammers et al. 2020).
Community contributions to EcoEvoApps
Given the range of settings in which we envision applying EcoEvoApps, we have developed EcoEvoApps with an explicit focus on enabling contributions from across the EEB community (Supplement S3). Apps in the ecoevoapps package are coded entirely in R, a common programming language in EEB research (Lai et al. 2019), opening the door to opportunities for members of the EEB community to collaboratively contribute, review, and continually revise a wide variety of apps. One such opportunity is to translate apps into several languages, thereby increasing the potential for EcoEvoApps to reach a global audience. By also providing links to external EEB-related apps developed by community members (Supplement S2), our website can serve as a hub for interactive apps pertaining to theoretical models in EEB. Additionally, to facilitate the adoption of these apps, we aim to compile resources, use cases, and activities that illustrate how instructors can use these apps in the classroom. We continue to make efforts to review, develop, and curate the apps and are dedicated to maintaining an open-source, open access interactive learning platform.
Future directions
EcoEvoApps is a living project, and our community contribution infrastructure (Supplement S3) paves a way to sustainably maintain, improve, and add functionality to the project. While we invite members of the EEB community to contribute in any capacity that is relevant to their needs, we will focus initially on two areas of growth. Our next step is to build more apps that simulate fundamental models in evolutionary biology. Specifically, we think interactive apps will be valuable teaching tools for population genetics models such as the Wright-Fisher model or the Price equation, both of which are central to many upper-division evolution courses (Gillespie 2004). A second area of growth is to incorporate apps on data visualization in EEB to further promote graphical literacy. These new apps can contain real-life data sourced from individual projects and public datasets, or the whole app can be contributed by researchers who have developed shiny apps for their own papers. This expansion could benefit multiple stakeholders, as it will help equip students with practical data interpretation skills, support EEB education using real-life examples, and make the value of EEB research more comprehensible to the general public.
Conclusion
Quantitative models drive progress in ecology and evolutionary biology, but for a variety of reasons including inconsistent quantitative training and math anxiety, they can be difficult to teach and learn. EcoEvoApps fills a gap in our current pedagogical toolkit by offering a range of open-source, interactive apps that allow users to explore how changes in model parameters drive new outcomes. Our classroom surveys highlight the potential for the use of these apps in educational settings in combination with activities that combine lecture material and present theoretical models in interactive ways that spark curiosity and lead to better understanding. Incorporating such apps into our standard EEB courses will give students a much deeper appreciation for how quantitative thinking helps make sense of the world around them. We have highlighted various directions and mechanisms to contribute to this project, and we welcome educators, researchers and students to help us grow EcoEvoApps as a community resource for more inclusive EEB education.
Acknowledgements
We acknowledge the Gabrielino/Tongva peoples as the traditional land caretakers of Tovaangar (the Los Angeles Basin and Southern Channel Islands), where the University of California, Los Angeles (UCLA) is located. We also respectfully acknowledge that the University of Missouri is located on the traditional, ancestral lands of the Osage, Omaha, and Kaw peoples, among others. We thank Gary Bucciarelli for helping conduct surveys in the Fall 2020 Ecology course at UCLA, and Mayda Nathan, Chris Muir, and Daniel Gruner for contributing apps to the EcoEvoApps website. We thank Caroline Farrior for comments on this manuscript. This material is based upon work supported by the National Science Foundation Graduate Research Fellowship Program to RMM under Grant No. (DGE-2034835). Any opinions, findings, and conclusions or recommendations expressed in this material are those of the author(s) and do not necessarily reflect the views of the National Science Foundation or the NIH. RMM was also supported by the Eugene V. Cota-Robles Fellowship. MCC was supported by an NIH Systems in Integrative Biology Training Grant. MCV was supported by a CAPES doctoral fellowship (2014, BEX:10079-13-0).
Footnotes
Coauthor contact information:
Madeline C. Cowen: mcowen{at}ucla.edu, Marcel C. Vaz: marcelcvaz{at}gmail.com, Lauren L. Sullivan: sullivanll{at}missouri.edu
Supplementary materials: Supplemental PDF with 7 components (S1-S7)
References


