

Abstract
Vesicle fusion is assumed to occur at flat membrane of excitable cells. In live neuroendocrine cells, we visualized vesicle fusion at Ω-shape membrane generated by preceding fusion, termed sequential compound fusion, which may be followed by fusion pore closure, termed compound kiss-and-run. These novel fusion modes contribute to vesicle docking, multi-vesicular release, asynchronous release, and endocytosis. We suggest modifying current models of exo-endocytosis to include these new fusion modes.
Vesicle fusion releases transmitters, hormones and peptides to mediate many physiological functions, such as synaptic transmission, fight or flight response, and controlling blood glucose level relevant to diabetes1, 2. In the last half a century of studies in excitable cells, including neurons and endocrine cells, all models on release steps and modes, such as vesicle docking, fusion pore opening and closure (kiss-and-run), mono- or multi-vesicular release at single release sites, synchronized or asynchronized release, are constructed under a fundamental assumption that vesicles fuse at the flat plasma membrane (PM)1, 2. Despite generally accepted, this assumption has not been tested in live cells. Against this concept, sequential compound fusion (Fusionseq-comp) – vesicle fusion at a previously fused vesicular Ω-shape structure – has long been proposed in non-excitable cells containing extremely large (~1-5 μm) granules that release contents extremely slowly (~10 s to minutes)3–5. Fusionseq-comp could in principle provide a novel mechanism underlying a series of fusion steps and modes, such as vesicle docking, desynchronized multi-vesicular release, asynchronous release, and subsequent endocytosis. These fusion steps and modes may enhance synaptic strength, synaptic reliability, firing information transfer, and the dynamic range of synaptic plasticity and neuromodulation at many synapses1, 6–8. However, the concept of Fusionseq-comp remains to be established, because its membrane dynamics, fusion pore, and content release have not been directly visualized and thus proved in any non-excitable or excitable cell. Here we established the Fusionseq-comp concept in excitable cells by direct visualization of its membrane dynamics, fusion pore dynamics and content release dynamics in live cells for the first time.
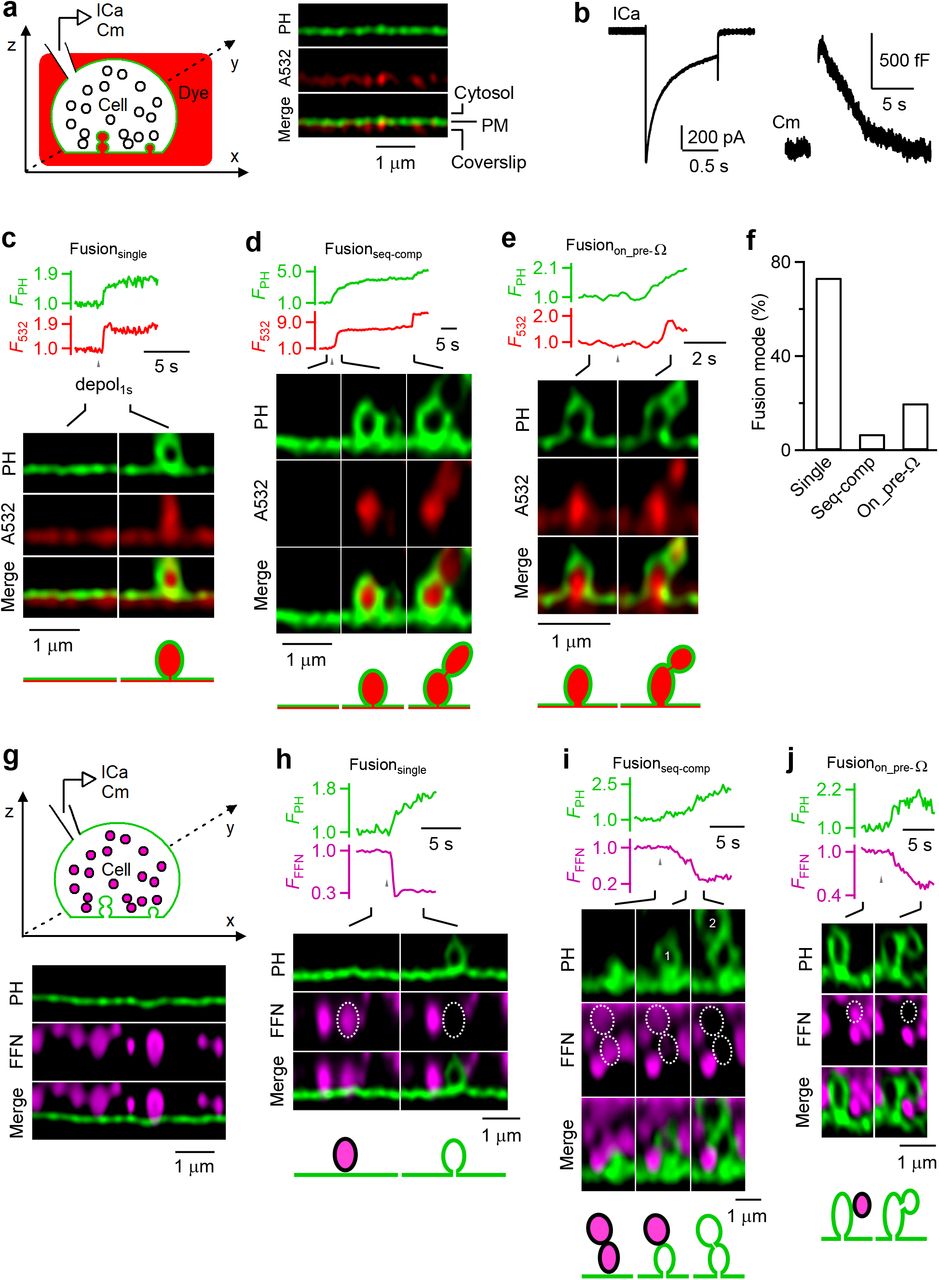
To visualize membrane dynamics, we transfected EGFP or mNeonGreen attached to phospholipase C delta PH domain (PHG), which binds to PtdIns(4,5)P2 (PIP2) at, and thus labels the plasma membrane (PM) in neuroendocrine cells, the primary cultured bovine adrenal chromaffin cell (Fig. 1a)9, 10. We added Atto 532 (A532) in the bath, which enters and thus labels fusing vesicles’ Ω-shape profiles (Fig. 1a)9, 11. A 1-s depolarization (−80 to +10 mV) via a pipette at the whole-cell configuration induced calcium currents, capacitance changes reflecting exo- and endocytosis, and fusion events observed with stimulated emission depletion (STED) microscopy of PHG/A532 (Fig. 1b-e). Images were acquired at the XZ-plane (near cell bottom) with Y-location fixed at about the cell center for ~1-2 min (XZ/Yfix imaging, 26-300 ms per frame, Fig. 1a); each cell was subjected to only 1 depol1s to avoid whole-cell exo- and endocytosis run-down9, 11.

a, Left: setup drawing. Cell’s membrane is labelled with PHG (green), and bath labelled with A532 (red). ICa and Cm (capacitance) are recorded from the whole-cell pipette. Right: XZ-plane PHG (green) and A532 images for a fraction of a cell (near cell bottom) at rest. Cytosol, PM and coverslip locations are labelled.
b, Sampled ICa and Cm change induced by depol1s.
c-e, ΩPH fluorescence (FPH, normalized to baseline), A532 spot fluorescence (F532, normalized to baseline) and STED XZ/Yfix images at times indicated with lines for Fusionsingle (c), Fusionseq-comp (d), and Fusionon_pre-Ω (e). FPH and F532 were collected from fusing vesicle(s).
f, The percentage of Fusionsingle, Fusionseq-comp and Fusionon_pre-Ω observed with STED XZ/Yfix imaging of PHG/A532 (336 events from 274 cells showing these fusion events).
g, Similar to panel a, but for imaging FFN511-loaded vesicles (purple, pseudo-colour) and PHG-labelled cell membrane (green).
h-j, FPH, FFN511 spot fluorescence (FFFN) and STED XZ/Yfix images at times indicated with lines showing release of FFN511 for Fusionsingle (g), Fusionseq-comp (h, vesicle 1 and 2 are circled and labelled), and Fusionon_pre-Ω (j).
To provide more conclusive proof and to characterize Fusionseq-comp, STED PHG/A532 imaging data were collected from a large number of cells, 1211 cells, at the voltage-clamp configuration. A total of 336 PHG-labelled Ω-shape profiles filled with A532 (ΩPH) appeared within a single image frame (26-300 ms), reflecting vesicle fusion that allowed for PHG/A532 diffusion from PM/bath into the fusion-generated Ω-profile (Fig. 1c–f). Among 336 ΩPH, 247 ΩPH (73.5%) appeared at the flat PM (Fig. 1c, f), reflecting single vesicle fusion (Fusionsingle, for detail, see Ref. 9, 10, 12); 23 ΩPH (6.9%) appeared at flat PM, but followed at 0.2-85 s later on its top by a sudden appearance of another ΩPH, forming an 8-shape structure reflecting Fusionseq-comp (Fig. 1d, f); 66 ΩPH (19.6%) appeared on the top of ΩPH preformed before depol1s (Fusionon_pre-Ω), which also formed an 8-shape structure (Fig. 1e, f). Preformed ΩPH could be from previous fusion events that maintained a Ω-shape, as recently reported9, 11. Supporting this possibility, the 2nd fusion may occur ~20-85 s after 1st fusion during Fusionseq-comp (e.g., Fig. S1, n = 4). Thus, Fusionon_pre-Ω may reflect Fusionseq-comp with a prolonged delay.
To demonstrate the release dynamics of Fusionseq-comp and Fusionon_pre-Ω, we loaded vesicles with fluorescent false neurotransmitter FFN511, a substrate for vesicle monoamine transporter, via bath application (Fig. 1g)13. XZ/Yfix imaging of PHG/FFN511 revealed decrease of FFN511 spot fluorescence (FFFN) and simultaneous appearance of ΩPH at the same spot, reflecting fusion-generated ΩPH that releases FFN511 (Fig. 1h–j). FFN511 releasing spots may 1) fuse on flat PM, reflecting Fusionsingle (Fig. 1h, n = 153), 2) fuse on flat PM, but followed on its top by the 2nd fusion that released its FFN511 content and created the 2nd ΩPH, (forming an 8-shape structure with the 1st ΩPH), reflecting Fusionseq-comp (Fig. 1i, n = 11), or 3) fuse on preformed ΩPH to form a PHG-labelled 8-shape structure, reflecting Fusionon_pre-Ω (n = 31, Fig. 1j). These results established the concept of Fusionseq-comp and Fusionon_pre-Ω by demonstrating their vesicular positions and content release.
Next, we examined fusion pore and ΩPH membrane dynamics of Fusionseq-comp and Fusionon_pre-Ω. As previously characterized9, 10, ΩPH in Fusionsingle may maintain an open pore (stay-fusion, Fig. 2a), close its pore at ~0.05 - 30 s later (close-fusion, Fig. 2b), or shrink to merge with the plasma membrane (shrink-fusion, Fig. 2c; summarized in Fig. 2d). Close-fusion was detected as A532 fluorescence (F532, strongly excited) dimming due to pore closure that prevented bath fluorescent A532 from exchanging with bleached A532, while PHG fluorescence (FPH, weakly excited) sustained or decayed with a delay that reflected PtdIns(4,5)P2 conversion into PtdIns(4)P and/or vesicle pinch off (Fig. 2b); stay-fusion was detected as sustained F532 and FPH (Fig. 2a); shrink-fusion, ΩPH shrinking with parallel decreases of F532 and FPH (Fig. 2c) (for detail, see Refs. 9, 10).
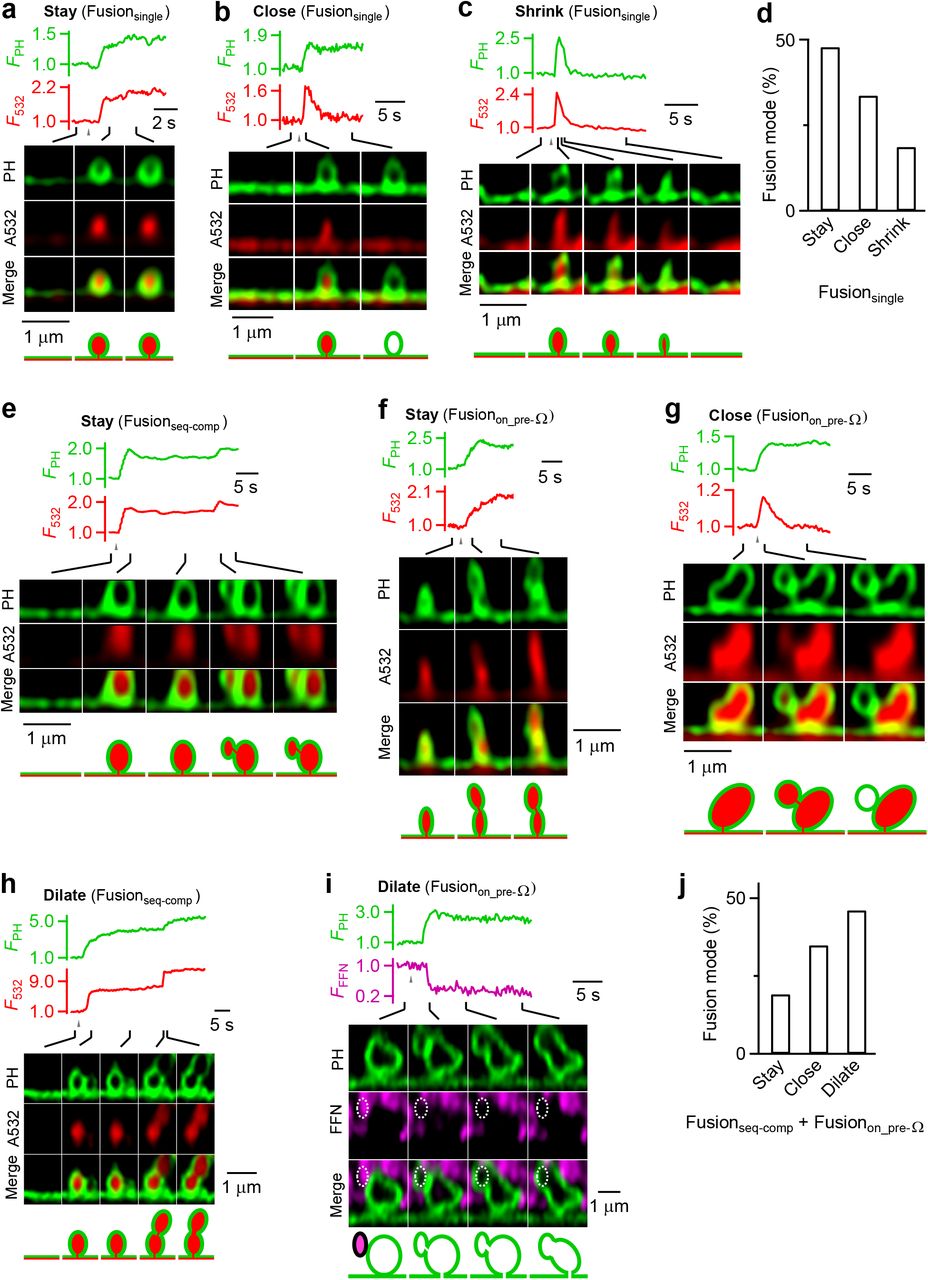
a-c, FPH, F532, and sampled images for three modes of Fusionsingle: stay-fusion (a), close-fusion (b), and shrink-fusion (c).
d, Stay-, close- and shrink-fusion percentage for Fusionsingle (247 events, 212 cells). e-f, FPH, F532, and sampled images showing stay-fusion for Fusionseq-comp (e, stay-fusion refers to 2nd fusion event) and for Fusionon_pre-Ω (f).
g, FPH, F532, and sampled images showing close-fusion for Fusionon_pre-Ω.
h, FPH, F532, and sampled images showing dilation of the fusion pore during Fusionseq-comp (pore dilation refers to 2nd vesicle fusion)
i, FPH, F511, and sampled images showing dilation of the fusion pore during Fusionon_pre-Ω.
j, Percentage of stay-fusion, close-fusion and pore dilation for the vesicle that fused at the previously generated ΩPH (n = 89). Data from Fusionseq-comp (n = 23) and Fusionon_pre-Ω (n = 66) were pooled together.
The 2nd ΩPH in Fusionseq-comp and Fusionon_pre-Ω may 1) remain unchanged with an open pore, reflected as sustained F532 and FPH (Fig. 2e, f), analogous to Fusionsingle’s stay-fusion (Fig. 2a), 2) close its pore at ~0.05-30 s later, reflected as F532 decay while FPH sustained or decayed with a delay (Fig. 2g), analogous to Fusionsingle’s close-fusion (Fig. 2b), or 3) dilate its pore till the 8-shape was converted to an elongated or large Ω-shape (e.g., Fig. 2h, i; Fig. 2j shows their percentages). We termed 2nd ΩPH close-fusion (e.g., Fig. 2g) compound kiss-and-run, a new form of kiss-and-run. Unlike Fusionsingle, we did not observe 2nd ΩPH shrink-fusion, but pore dilation (Fig. 2h–j).
The 20-80% FFN511 fluorescence decay time was similar between the 2nd and the 1st ΩPH during Fusionseq-comp (Fig. 3a, b), suggesting that Fusionseq-comp releases vesicular contents as efficiently as Fusionsingle. However, the 2nd ΩPH appeared at ~0.2-85 s after the 1st ΩPH during Fusionseq-comp (e.g., Figs. 1d, 1i, 2e; summarized in Fig. 3c), indicating that Fusionseq-comp can generate desynchronized multi-vesicle release at single release sites. Given that the 1st ΩPH occurred mostly during and within ~1 s after depol1s (Fig. 3c), the 1st ΩPH reflected synchronized release; the various time delay of the 2nd ΩPH (Fig. 3c) thus reflected asynchronous release. We concluded that Fusionseq-comp contributes to the generation of desynchronized multi-vesicular release and asynchronous release.

a, FPH, FFFN, and sampled images of the 1st (dotted circle, dotted trace) and the 2nd (solid circle, solid trace) fusion for a Fusionseq-comp event.
b, The 20-80% FFFN decay (release) time (mean + s.e.m.) for 1st and 2nd fusion during Fusionseq-comp (11 events, 11 cells under PHG/FFN511 imaging). No significant difference was found (paired t test, p = 0.712).
c, Upper: the onset time of the 1st and the 2nd fusion during Fusionseq-comp (23 events, 23 cells under PHG/A532 imaging). 1 fusion per circle; dash lines connect two fusion events from the same Fusionseq-comp. Onset time 0 refers the onset of depol1s. Lower: mean onset (+ s.e.m., n = 23) of the 1st and the 2nd fusion during Fusionseq-comp (**: p < 0.01, paired t-test). Left and right panels are from the same data set.
The present work firmly established the concept of sequential compound fusion and compound kiss-and-run by directly visualizing their membrane, fusion pore and content-release dynamics in live cells for the first time. Establishing these new concepts in excitable cells may conceptually advance our understanding of secretory vesicle exo-endocytosis, because sequential compound fusion and compound kiss-and-run may constitute new mechanisms contributing to the generation of desynchronized multi-vesicular release at single release sites, asynchronous release, vesicle docking and priming, and vesicle endocytosis, as discussed below.
Multi-vesicular release from single release sites enhance synaptic strength, synaptic reliability, and the dynamic range of synaptic plasticity and neuromodulation at many synapses1. The mechanism underlying multi-vesicular release at single release sites is poorly understood1. Sequential compound fusion readily explains how single release sites produce multi-vesicular release, particularly the desynchronized multi-vesicular release, which enhances the precise and efficient firing information transfer at synapses6, 7. If the release interval of sequential compound fusion is minimal, it may also explain the coordinated or simultaneous multi-vesicular release at single release sites1, 14.
While depolarization-evoked release is mostly synchronized, asynchronous release lasting much longer than the brief depolarization also takes place in many excitable cells, which may transfer a brief presynaptic firing burst into a prolonged postsynaptic firing burst at synapses8. The differences in the mechanisms underlying asynchronous and synchronous release remain not well understood. Different calcium sensors with different calcium affinity have been suggested8. Sequential compound fusion evidently generates a delay in releasing the second vesicle (Fig. 3), providing a novel mechanism contributing to the generation of asynchronous release.
Vesicle fusion must involve vesicle movement towards the PM release sites for docking and subsequent vesicular V-SNARE and PM T-SNARE binding that may prime docked vesicles for release8, 15. Our findings suggest modifying this concept by including a new mechanism of generating release sites for docking – the fusion-generated Ω-profiles are maintained and serve as the new release sites for docking and priming. Such a docking process saves vesicles from spending energy to travel one-vesicle-length of distance for docking at the flat PM. The priming process may involve diffusion of T-SNARE from the PM to the fusion-generated vesicular Ω-profile and T-SNARE binding with V-SNARE of the docking vesicle16. These processes may take more time16, explaining the prolonged release interval of sequential compound fusion that produces asynchronous release.
Compound kiss-and-run reported here is a new mode of exo-endocytosis that retrieves vesicles undergoing sequential compound fusion. It may explain the electron microscopic observation of 8-shape (or sausage-shape) structures and large vesicles that are otherwise interpreted as different mechanisms, such as vesicle budding, bulk endocytosis of large vesicles, and/or cytosol vesicle-vesicle fusion. We suggest modifying current models of secretory vesicle endocytosis2, 17 by including compound kiss-and-run as a new mode of endocytosis.
While obtained from chromaffin cells containing large dense-core vesicles, our findings are most likely applicable to neurons for two reasons. First, like neurons, chromaffin cells are excitable cells with a neuronal origin and very similar calcium-, synaptotagmin-, SNARE-, and dynamin-dependent exo- and endocytosis2, 18. Second, neuron contains large dense-core and small clear-core vesicles, both of which may maintain an Ω-shape after fusion19–22, the prerequisite for mediating sequential compound fusion. Direct visualization is needed to prove sequential compound fusion and kiss-and-run in neurons. Visualizing sequential compound fusion of small synaptic vesicles (~30-50 nm) requires much higher spatial-temporal resolution than what we have (~60 nm/26-300 ms). Significant technical advancements are needed to overcome this technical problem in the future.
Cytosolic vesicle-vesicle fusion is the first form of compound fusion being proposed, based on the observation of 1) cytosolic 8-shape or sausage-like vesicular structures, and 2) capacitance jumps and synaptic miniature currents (quantal size) too large for single vesicle fusion in non-excitable and excitable cells, such as pancreatic acinar cells, eosinophils, mast cells, calyx-type and ribbon-type synapses3, 5, 23–27. However, direct observation of the membrane transformation during vesicle-vesicle fusion, which can fully establish the concept of vesicle-vesicle fusion is still missing. Similar to vesicle-vesicle fusion, sequential compound fusion was suggested in non-excitable cells based on the observation of 1) sequential release of lysotracker green loaded into the extremely large (~1-5 μm) granules in eosinophils3, and 2) sequential generation of extracellular-dye-loaded extremely large tube-like structures from the PM into the cytosol in acinar cells4. However, these observations could not fully exclude the possibility that the extremely large, apparently cytosolic structure could be docked at PM that was not visible at the imaged plane, or that the extracellular-dye-loaded structure reflects endocytic membrane invagination (content release is not imaged simultaneously). Because of these uncertainties, and most importantly the lack of evidence showing direct, simultaneous membrane, pore and release dynamics of sequential compound fusion in live cells, the concept of sequential compound fusion is not fully established2. The present work provided the missing evidence required to fully establish the concept of sequential compound fusion – the dynamics of membrane transformation, fusion pore, and content release. Furthermore, we link this concept to a new endocytic mode, compound kiss-and-run, and extend these concepts to excitable cells that release much smaller vesicles rapidly. Thus, sequential compound fusion and compound kiss-and-run may be a widespread exo-endocytosis mode used by excitable and non-excitable cells to release vesicular contents that may mediate important functions such as neuronal communication, fight or flight response, regulation of blood glucose level relevant to diabetes, and immune responses1, 2. The technique we used here opens the door to study the functions and mechanisms of sequential compound fusion in live cells.
Author Contributions
L.G. did most FFN511-related experiments. W.S. did most PHG/A532-related experiments. L.G.W. supervised the project. L.G. wrote the experimental results; L.G.W. wrote the manuscript with help from L.G. and W.S.
Declaration of interests
The authors declare no competing interests.
Materials and Methods
Chromaffin cell culture
We prepared primary bovine adrenal chromaffin cell culture as described previously11. Fresh adult (21 - 27 months old) bovine adrenal glands (from a local abattoir) were immersed in pre-chilled Locke’s buffer on ice containing: NaCl, 145 mM; KCl, 5.4 mM; Na2HPO4, 2.2 mM; NaH2PO4, 0.9 mM; glucose, 5.6 mM; HEPES, 10 mM (pH 7.3, adjusted with NaOH). Glands were perfused with Locke’s buffer, then infused with Locke’s buffer containing collagenase P (1.5 mg/ml, Roche), trypsin inhibitor (0.325 mg/ml, Sigma) and bovine serum albumin (5 mg/ml, Sigma), and incubated at 37°C for 20 min. The digested medulla was minced in Locke’s buffer, and filtered through a 100 μm nylon mesh. The filtrate was centrifuged (48 xg, 5 min), re-suspended in Locke’s buffer and re-centrifuged until the supernatant was clear. The final cell pellet was re-suspended in pre-warmed DMEM medium (Gibco) supplemented with 10% fetal bovine serum (Gibco).
Electroporation and plating
Cells were transfected by electroporation using Basic Primary Neurons Nucleofector Kit (Lonza), according to the manufacturer’s protocol and plated onto glass coverslips with mouse Laminin coating over PDL layer (Neuvitro). The cells were incubated at 37°C with 9% CO2 and used within 5 days.
Plasmids and fluorescent dyes
The PH-EGFP (phospholipase C delta PH domain attached with EGFP) was obtained from Dr. Tamas Balla. PH-mNeonGreen construct was created by replacing the EGFP tag of PH-EGFP with mNeonGreen (Allele Biotechnology) 28. Both PH-EGFP and PH-mNeonGreen are abbreviated as PHG. For Atto 532 (A532, Sigma) imaging, A532 concentration in the bath solution was 30 μM. For FFN511 (Abcam) imaging, cells were bathed with FFN511 (5-10 μM) for 10 min and images were performed after washing out FFN511 in the bath solution.
Overexpression of PHG did not significantly affect the basic properties of exo- and endocytosis, because 1) whole-cell capacitance measurements and imaging show robust exo- and endocytosis, and similar percentages of close-fusion and non-close-fusion as control10, 11, and 2) PHG-labelled fusion pore could also be observed with imaging of extracellularly applied mCLING-A488 or with EM9.
Electrophysiology
At room temperature (20 - 22°C), whole-cell voltage-clamp and capacitance recordings were performed with an EPC-10 amplifier together with the software lock-in amplifier (PULSE, HEKA, Lambrecht, Germany) 11, 29. The holding potential was -80 mV. For capacitance measurements, the frequency of the sinusoidal stimulus was 1000 - 1500 Hz with a peak-to-peak voltage ≤ 50 mV. The bath solution contained 125 mM NaCl, 10 mM glucose, 10 mM HEPES, 5 mM CaCl2, 1 mM MgCl2, 4.5 mM KCl, and 20 mM TEA, pH 7.3 adjusted with NaOH. The pipette (2 – 4 MΩ) solution contained 130 mM Cs-glutamate, 0.5 mM Cs-EGTA, 12 mM NaCl, 30 mM HEPES, 1 mM MgCl2, 2 mM ATP, and 0.5 mM GTP, pH 7.2 adjusted with CsOH. These solutions pharmacologically isolated calcium currents.
For stimulation, we used a 1-s depolarization from the holding potential of -80 mV to +10 mV (depol1s). We used this stimulus, because it induces robust exo-endocytosis as reflected in capacitance recordings (Fig. 1a) 11, 30, 31. In a fraction of experiments during FFN511 imaging, we used 10 pulses of 400-ms depolarization from -80 mV to +10 mV at 2 Hz, which evoked more fusion events.
STED imaging
STED images were acquired with Leica TCS SP8 STED 3× microscope that is equipped with a 100 x 1.4 NA HC PL APO CS2 oil immersion objective and operated with the LAS-X imaging software. Excitation was with a tunable white light laser and emission was detected with hybrid detectors. In time-gated STED mode, PH-EGFP and A532 were sequentially excited at 470 and 532 nm, respectively, with the 592 nm STED depletion beam, and their fluorescence collected at 475-525 nm and 540-587 nm, respectively. PH-mNeonGreen and A532 were sequentially excited at 485 and 540 nm, respectively, with the 592 nm STED depletion beam, and their fluorescence collected at 490-530 nm and 545-587 nm, respectively. PH-mNeonGreen and FFN511 were sequentially excited at 505 and 442 nm, respectively, with the 592 nm STED depletion beam, and their fluorescence collected at 510-587 nm and 447-490 nm, respectively.
The excitation power for A532 was 10% of the maximum, at which fluorescent A532 can be bleached within a few seconds. This feature was used to distinguish whether the fusion pore is closed or not, because pore closure prevents bleached A532 (caused by strong excitation) from exchange with fluorescent A532 in the bath, resulting in A532 spot fluorescence decay9-11. In contrast, an open pore would not cause A532 spot fluorescence decay, because an open pore allows for continuous exchange of bleached A532 in the Ω-profile with fluorescent A532 in the bath 9–11.
STED imaging generally causes more photobleaching and phototoxicity. Severe phototoxicity could cause loss of the whole-cell giga seal during patch-clamp recording 11. In general, we avoided severe phototoxicity by applying only one depol1s and imaging for ~1-2 minper cell. With this setting, we have not noticed significant differences in the exo- and endocytosis properties obtained under confocal and STED imaging conditions10, 11. For imaging of PHG and A532, continuous exchange of bleached PHG or A532 with fluorescent ones from non-imaging areas lessened the photobleaching problem.
STED scanning modes
STED images were acquired at the cell bottom at the XZ-plane (perpendicular to the coverslip) with the Y-axis location fixed at about the cell center (Figure 1a, XZ/Yfix scanning mode). We repeated XZ/Yfix scanning every 26-300 ms at 15 nm per pixel in an XZ area of 19.4 μm x 0.7-1.5 μm9.
The STED resolution for imaging PHG (PH-EGFP or PH-mNeonGreen) in our conditions was ~60 nm on the microscopic X- and Y-axis (parallel to cell-bottom membrane or coverslip), and ~150-200 nm on the microscopic Z-axis. STED images were deconvolved using Huygens software (Scientific Volume Imaging).
Data selection
For every cell recorded with a pipette under the whole-cell configuration, the data within the first 2 min at the whole-cell configuration were used, which avoided rundown of endocytosis (gradual disappearance of endocytosis) as previously reported under the whole-cell configuration for a long time11, 32. Cells expressed with PHG were used for visualization of fusion events. The criteria for selecting PHG-labelled Ω for analysis during XZ scanning are described in Figure S2 of Shin et al., 2018.
Analysis of PHG-labelled Ω-shape profiles
STED images of PH-Ω were analyzed with ImageJ and LAS X (Leica). During XZ scanning, some depol1s-induced PH-Ω-profiles were out of the same Y focal plane, as the outline of the Ω-profile was vague or unclear (for detail, see 9). These out-of-focus Ω-profiles were not included for analysis.
Pores labelled with PHG were identified based on the image and the fluorescence intensity line profile (for detail, see 9). We first identified the fluorescently labelled Ω-profiles with an open pore, the edge of which was continuous with PM. The intensity line profile in the pore region should show a valley with a peak at least three times larger than the baseline fluctuation (standard deviation) in the non-pore region (for detail, see 9). The full-width-half-maximum of the valley of the intensity line profile across the pore was proportional to the pore diameter, as shown with simulation9. Pore dilation of the fusing ΩPH during Fusionseq-comp or Fsuionpre-Ω was judged with eyes.
Identification of stay-, close- and shrink-fusion during XZ/Yfix STED imaging of PHG/A532 were described in detail previously9. During XZ/Yfix imaging, A532 was excited at a high laser power so that fluorescent A532 can be bleached with a time constant of 1.5-3.5 s. Pore closure was identified as the gradual dimming of the A532 spot fluorescence to baseline during XZ PHG/A532 imaging while PHG image remained unchanged or dimmed gradually without changing the ΩPH size9. A532 fluorescence dimming was not due to a narrow pore smaller than A532 molecule size, because after A532 spot dimming, bath application of an acid solution cannot quench the pH-sensitive VAMP2-EGFP or VAMP2-pHluorin overexpressed at the same spot, indicating that the spot is impermeable to H+ or OH−, the smallest molecules, and thus is closed10, 11.
Statistical tests
Data were expressed as mean ± s.e.m. Replicates are indicated in results and figure legends. N represents the number of cells, fusion events, pores, or Ω-profiles as indicated in results and figure legends. The statistical test used is t test or ANOVA. Although the statistics were performed based on the number of cells, fusion events, pores, and Ω-profiles, each group of data was collected from at least four primary chromaffin cell cultures. Each culture was from at least two glands from one bovine.
Acknowledgements
This work was supported by the National Institute of Neurological Disorders and Stroke Intramural Research Program (ZIA NS003009-15 and ZIA NS003105-10) to L.G.W. We thank Carolyn Smith for STED microscopy support.
References


