

SUMMARY
Translation modulates the timing and amplification of gene expression after transcription. Development of the brain’s neocortex requires precisely timed and spatially targeted gene expression, but the relationship between mRNA vs. protein synthesis throughout the genome is unknown. We perform a comprehensive analysis of the reactants, synthesis, and products of mRNA translation spanning mouse neocortex neurogenesis. Ribosome number in the cortical plate decreases sharply at mid-neurogenesis during a transition in neuronal subtype specification, shifting the fundamental kinetics of protein synthesis, with mRNA and protein levels frequently divergent. Satb2, which drives an essential neuronal subtype-specific program, is a highly dynamically translated mRNA with surprisingly broad transcription across diverse neuronal lineages. Satb2 protein achieves its neuronal subtype expression through timed regulation by the RNA-binding protein Pumilio2. Thus, the refinement of transcriptional programs by protein synthesis is a widespread feature of neuronal specification. Developmental neocortex translatome data are provided in an open-source resource: https://shiny.mdc-berlin.de/cortexomics/.
INTRODUCTION
Discrepancy between the levels of mRNA and protein often reflect dynamic cellular transition states (Buccitelli and Selbach, 2020). Timed cellular transitions pattern the nervous system during development, specifying stem cells into diverse neuronal lineages. Historically, transcription has been a principal focus of mechanisms driving nervous system patterning. A canonical example is spinal cord formation, which is driven by a Homeobox transcription factor code that sharply demarcates distinct circuits (Catela et al., 2015). However, in the more evolutionarily advanced mammalian neocortex, transcriptional signatures alone are insufficient to account for the enormous cellular complexity of the neocortex circuit. Recent single-cell RNA sequencing (scRNA-seq) analyses of neocortex development support this idea (Nowakowski et al., 2017; Telley et al., 2019; Zahr et al., 2018). For example, Telley et al. found that mRNA measurements are highly overlapping in differentiating neurons of distinct birthdates, locations, and circuits. Even further, transcription factors historically assigned to neurons in distinct cortical regions are also robustly expressed in astrocytes in the same region (Herrero-Navarro et al., 2021). These recent revelations suggest that transcriptional signatures defining cell and circuit type in the developing neocortex are less sharply demarcated. Thus, the blueprint of gene expression in neocortex development is likely multilayered, including and beyond transcription (Cadwell et al., 2019; Hoye and Silver, 2021; Kraushar et al., 2016; Telley and Jabaudon, 2018).
The neurogenic phase of neocortex development is a tightly controlled spatial and temporal program of tissue patterning (Figure 1A) (DeBoer et al., 2013; Greig et al., 2013). In mice, at approximately embryonic day 12.5 (E12.5) neural stem cells in the cortical ventricular zone begin to generate neurons. These early-born immature neurons migrate superficially to laminate lower layers of the nascent cortical plate, and will ultimately form predominantly subcortically projecting neuronal circuits that express cell fate determinants like Bcl11b (Arlotta et al., 2005). Later at mid-neurogenesis ∼ E15.5, neural stem cell divisions almost exclusively generate upper layer neurons. These late-born neurons migrate past previously formed lower layers, with adjacent upper layers projecting distinct, intracortical neuronal circuits that express cell fate determinants like Satb2 (Alcamo et al., 2008; Britanova et al., 2008). Distinguishing mRNA features of early vs. late-born neural stem cells are reversible with heterochronic transplantation and fade with differentiation, superseded by largely generic maturation-associated transcriptional states (Oberst et al., 2019; Telley et al., 2019).

(A) Developmental trajectory of neural stem cell differentiation in the neocortex, analyzed by RNA-seq, Ribo-seq, tRNA qPCR array, and MS at five stages. (B) Schematic of translation efficiency (TE). (C) Measurements of steady-state mRNA, ribosome-protected mRNA fragments (RPF), and TE calculated per gene. High-count filtering applied for quality-control (>32, black; <32, grey). (D) TE vs. steady state mRNA fold change (FC) at E12.5 compared to each subsequent stage. Significance assessed at ≥ 1.25 FC, p < 0.05. Not significant (n.s.). (E) Gene ontology (GO, molecular function) analysis of translationally down-regulated (TE down) and up-regulated (TE up) mRNAs. Top six rank-ordered significant pathways shown. (F) Transcriptome-to-proteome expression trajectory of ribosomal protein coding mRNAs of the large (Rpl) and small (Rps) subunits from E12.5 (t0) to subsequent stages (t). (G) Immuno-electron microscopy labeling ribosomal protein uS7 in the E12.5 and E15.5 neocortex (magenta), with (H) quantification for ribosomes per cytoplasmic area. Mean shown (dotted line), Welch’s ANOVA and Dunnett’s post hoc test, ***p < 0.001. Neural stem cells are located in the ventricular zone (VZ) and sub-ventricular zone (SVZ); post-mitotic neurons are located in the cortical plate (CP), lower layers (LL), upper layers (UL). Nuclei are outlined. See also Figures S1-3.
The final essential step of gene expression is mRNA translation by the ribosome. Direct measurements of protein synthesis may provide a clearer picture of functional gene expression in the neocortex; however, a large-scale high-resolution analysis of mRNA translation during neurogenesis has lagged behind transcriptome analysis, in part due to current technical limitations in protein measurement. Recent work suggests that targeted and selective protein synthesis refines the output of gene expression in neocortex development (Kraushar et al., 2014, 2015, 2021; Popovitchenko et al., 2020; Zahr et al., 2018, 2019). Importantly, abnormal neocortex ribosome levels and disrupted translation was found recently to be a mid-gestation etiology of neurodevelopmental disorders (Kalish et al., 2021). However, how ribosomes decode mRNA in the transcriptome-to-proteome transition during neocortex neurogenesis remains unknown.
To circumvent these challenges and measure the temporal dynamics of the reactants, synthesis, and products of mRNA translation during neocortex development, we performed sequencing of ribosome-protected mRNA fragments (Ribo-seq; ribosome profiling) (Ingolia et al., 2009) in parallel with RNA-seq, tRNA qPCR array, and mass spectrometry across five stages of mouse neocortex neurogenesis. By capturing ribosome-mRNA interactions at codon-level resolution, we find that ∼18% of mRNAs change translation efficiency in the progressive specification of neural stem cells to post-mitotic neurons. Ribosome numbers decrease sharply at mid-neurogenesis E15.5 in the cortical plate, coinciding with striking changes in translation initiation and elongation speed, and frequently divergent mRNA and protein levels in the neocortex.
We previously reported that Satb2 acts as an essential post-mitotic determinant of upper layer neurons (Britanova et al., 2008). Satb2 is among the most translationally upregulated mRNAs discovered in our data, and here reveal that Satb2 is unexpectedly transcribed broadly, including in the earliest-born neural stem cell lineage generating lower layers. Precocious Satb2 translation is prevented during the early period of ribosome abundance by the translation repressor Pumilio2, restricting its ultimate expression in broadly primed progenitors. Thus, by mapping the quantitative landscape of the transcriptome-to-proteome transition in the neocortex, we find that protein synthesis is a powerful and widespread layer of gene expression regulation that fundamentally shifts kinetics and impacts neuronal specification during development. We provide the developmental neocortex translatome as an open-source searchable web resource: https://shiny.mdc-berlin.de/cortexomics/.
RESULTS
Deep sequencing of protein synthesis at high resolution across neocortex neurogenesis
We designed a strategy to analyze the major reactants, synthesis, and products of mRNA translation across five stages encompassing neocortex neurogenesis (Figure 1A), including Ribo-seq measurement of ribosome-mRNA interactions. Ribo-seq measures 80S ribosomes bound to the open reading frame of mRNA – a quantitative indicator of active protein synthesis at codon-level resolution (Ingolia et al., 2009). Optimizations for analysis of neocortex ribosomes ex vivo circumvented the requirement for pharmacological ribosome stalling with cycloheximide (Kraushar et al., 2021), which introduces ribosome footprint redistribution artifacts (Ingolia, 2016), and enabled efficient nuclease digestion to generate high fidelity ribosome-protected mRNA fragments (RPFs) (Figure S1A-D). Quantifying both RNA-seq and Ribo-seq in an isoform-aware fashion, we obtained transcripts per-million (TPM) and RPF densities for 22,373 genes (Figure S2A, Table S1). Reproducibility of both RNA and RPF measurements permitted reliable calculation of mRNA translation efficiency (Figure S1E), which represents the ratio between total ribosome binding to an mRNA’s coding sequence (sum of RPFs) and the mRNA’s level overall (sum of TPMs) (Figure 1B-C). As a quality control, we focused further analysis on coding sequences with 32 or more Ribo-seq footprints in at least one stage as per (Dunn et al., 2013), which resulted in a set of 12,228 translated GENCODE-annotated transcripts.
While the majority of mRNAs are translated in high correlation to their steady state levels, subsets of mRNAs are heavily translated despite low abundance, or weakly translated while highly abundant – indicating substantial translation regulation (Figure 1C). Concordant with previous observations in yeast (Ingolia et al., 2009), we found an ∼ 100-fold variation in translation efficiency among expressed open reading frames, compared to the ∼ 10,000-fold variation in RNA expression (Figure S2B-C).
We next assessed the timing and distribution of dynamic translation fold changes after early neurogenesis at E12.5 (Figures 1D and S2D, Table S2). While both translation efficiency and steady state mRNA per gene are largely stable between E12.5-E14, a burst of gene expression regulation occurs at E15.5, during a timed developmental shift in lower to upper layer neurogenesis. Translation efficiency upregulation was found to occur in 1,129 genes and downregulation in 1,131 genes – with only 7 genes both translation up- and downregulated across development. A further 2,253 genes change in steady state mRNA only, without any significant translation efficiency change. Thus, we estimate ∼ 18% of the transcriptome is dynamically translated across neocortex neurogenesis, with an acute inflection point during the mid-neurogenesis transition.
Gene ontology analysis revealed distinct molecular pathways are impacted by upregulated vs. downregulated translation efficiency (Figure 1E). As neurogenesis progresses, mRNAs coding for structural constituents of the ribosome – predominantly ribosomal proteins – decrease in translation. In contrast, genes associated with chromatin binding, such as transcription factors, increase in translation.
Translation downregulates ribosome levels acutely at mid-neurogenesis
To begin investigating whether timed changes in the translation of ribosome-associated proteins reorganizes gene expression during development, we next calculated the developmental expression trajectory of all ribosomal proteins in the large and small subunits by RNA-seq, Ribo-seq, mass spectrometry (MS), and translation efficiency (Figure 1F). Results showed downregulation of nearly all ribosomal proteins at the Ribo-seq and MS level occurs acutely at E15.5, in advance of changes measured by RNA-seq, and reflecting translation downregulation until mid-neurogenesis. Decreasing ribosome levels by downregulation of ribosomal protein translation likely represents the coordinated regulation of this specific gene family, rather than a simple translation feedback loop, since numerous genes in other families undergo translation upregulation concurrently.
To visualize changing ribosome numbers sub-cellularly at high resolution, we performed immuno-electron microscopy analysis labeling ribosomal protein uS7 at E12.5 and E15.5 in the neocortex (Figures 1G-H and S3). A striking difference in ribosome number was observed in differentiating neurons between early and late stages. Ribosomes are abundant in cortical plate neurons at E12.5, but scarce in both upper and lower layer neurons of the cortical plate at E15.5. Notably, a progressive increase in ribosome number was observed as newly born neurons traverse away from the ventricular zone into the cortical plate at E12.5; while at E15.5, ribosome numbers decrease precipitously outside the ventricular zone, with few ribosomes measured in sub-ventricular zone intermediate progenitors. Thus, ribosome number is temporally encoded by translation at mid-gestation. Acute changes in ribosome number coincide with a critical period when translation is highly sensitive to a compromised maternal-fetal environment (Kalish et al., 2021). As ribosome abundance is a powerful determinant of translation kinetics and selectivity (Mills and Green, 2017; Shah et al., 2013), global shifts in translation activity may occur at mid-neurogenesis.
Translation initiation and termination in the mRNA coding sequence are developmentally dynamic
We next examined global translation activity during neocortex development by determining ribosome-mRNA interactions per-codon across all coding sequences. Ribosome position aligned to codons in the P-site demonstrated the characteristic 3-nucleotide periodicity in Ribo-seq metagene plots (Figure 2A). Ribosome occupancy surrounding the start codon increases sharply at E15.5, with progressive increases per stage until P0, while stop codon occupancy demonstrates the opposite trend and occurs independent of start codon changes. We applied RiboDiPA (Li et al., 2020), a linear modeling framework designed for positional analysis of Ribo-seq signal, to pinpoint the ∼5-fold ribosome occupancy changes to the 4 codon bin surrounding the start and stop (Figure 2B).

(A) Ribosome occupancy metagene plot including all mRNAs (top) surrounding the start (left) and stop (right) codons at five stages. Separation of mRNAs by changing or unchanged start codon occupancy (bottom). (B) Position specific fold changes in ribosome P-site counts surrounding the start and stop codons. (C) Start (left) and stop (right) codon occupancy vs. TE fold change between E12.5 and E17. (D) GO analysis of mRNAs with increasing start codon occupancy (molecular function, MF; biological process, BP). Top seven rank-ordered significant pathways shown. See also Figure S2.
Increased ribosome occupancy of the first four codons over time could represent a narrowing bottleneck in the transition from initiation to elongation, or signify increasingly robust initiation of target mRNAs. To begin distinguishing between these possibilities, we correlated fold changes in start codon occupancy with translation efficiency, and found an inverse relationship (Figure 2C). N-terminal translation thus may be rate-limiting to synthesize Sbno2 and Pcdhgc4, in contrast to Tuba1c and Tuba1b representing more processive translation during development. Gene ontology analysis of mRNAs with increasing ribosome occupancy at the start codon showed enrichment for pathways like microtubule binding and neuron projection maintenance, concurrent with the differentiation of neuronal morphology (Figure 2D). Translation and ribosome-associated pathways were also highly associated with increased start occupancy, concordant with translation downregulation of ribosomes in Figure 1E-H. Thus, as ribosome levels decline at E15.5 to P0, translation at the 5’-end of coding sequences occurs more slowly.
The kinetics of translation elongation per-codon fundamentally shift at mid-neurogenesis
Translation efficiency is a simple global sum, and does not reflect complex local variations in ribosome density on an mRNA. With developmental changes observed in ribosome number, translation efficiency, and at the start and stop of coding sequences, we next analyzed ribosome dwell time per codon – a measure of the codon-specific speed of translation (Gobet et al., 2020). We found that ribosomes early in development translate with codon-specific “fast” or “slow” kinetics, seen in the bimodal distribution of codon dwell times at E12.4-E14 (Figure 3A top left, and Table S3), and further observed in metacodon plots (Figure S4A-B). At mid-neurogenesis, codon dwell times begin to equalize, progressively reaching a unimodal distribution by P0. Thus, early-stage kinetic barriers in ribosome-codon interactions relax from mid to late neurogenesis.

(A) Correlations between per-codon ribosome dwell time and corresponding tRNA measurements across developmental stages. Rho and p-values are shown when significant. Each variable’s distribution is shown on the diagonal. Amino acid corrected (AAcor). (B) The distribution of codon dwell times at each developmental stage for proliferation and differentiation associated codons measured in (Gingold et al., 2014). (C) Variation in codon identity occupying ribosomal A-, P-, and E-sites at each developmental stage. (D) Ribosome A-site dwell time for each amino acid with corresponding synonymous codons across developmental stages. (E) Schematic of dynamic translation kinetics during neocortex development. See also Figures S4-5.
Varying ribosome dwell time on a codon might be attributable to the availability of a given tRNA. Dwell time is strongly correlated with tRNA abundance in yeast (Fang et al., 2018; Riba et al., 2019; Weinberg et al., 2016), but is less correlated in some mammalian systems (Gobet et al., 2020; Ingolia et al., 2011). To determine if tRNA abundance is responsible for driving ribosome dwell time differences in the developing neocortex, we measured levels of 151 tRNA isodecoders by quantitative PCR (qPCR) array at each stage (Figure S5). As expected, tRNA levels showed robust correlation with overall codon usage in the transcriptome (Figure 3A). However, we did not observe a correlation between tRNA abundance and ribosome dwell time per codon, or after correcting codon dwell times for their corresponding amino acids. Usage-corrected tRNA abundance (availability) (Gobet et al., 2020) and codon optimality – the non-uniform decoding rate between synonymous codons (dos Reis et al., 2004) – also failed to show any correlation with ribosome dwell time (Figure S4C).
While overall tRNA abundance/scarcity does not explain the observed codon dwell time variation, we did find that the spectrum of high and low dwell times detected at early developmental stages were partially associated with “proliferation” vs. “differentiation” codons, i.e. codons more heavily utilized in genes with proliferation vs. differentiation functions (Gingold et al., 2014) (Figure 3B). Proliferation-associated codons were more highly represented in short ribosome dwell times, while differentiation codons more represented by long dwell times. Notably, differentiation associated codons demonstrate G/C biases (Gingold et al., 2014), which we detected as a feature likewise correlated with longer dwell times (Figure S4D). However, dwell times for codons in both of these classes are overlapping and normalize at later developmental stages, and thus are not sufficient to account for the spectrum of dynamic ribosome-codon interactions.
We next investigated distinct positions where variations in ribosome dwell time take place (O’Connor et al., 2016) (Figure 3C; see Methods). A narrow region consistent with the ribosomal A-site accounts for most of the codon-specific variation in ribosome dwell time. Variation in A-site occupancy was most pronounced at E12.5-E14, with an acute decrease at E15.5-E17, and low variation by P0, consistent with results above (Figure 3A). Thus, the A-site codon in particular influences ribosome dwell time, which is a barrier most pronounced early in neurogenesis when ribosome levels are highest, and less pronounced after mid-neurogenesis when ribosome levels decline.
Focusing on the ribosome A-site, we found that the amino acid coded for is a strong determinant of codon dwell time, with synonymous codons showing similar dwell times (Figure 3D). Codons for acidic amino acids are among those with the highest dwell time, suggesting they represent a kinetic barrier in early development translation (Chadani et al., 2017; Riba et al., 2019). E12.5-E14 accounts for the extremes of A-site dwell time differences between amino acids and among synonymous codons, with a progressive, chronologic trend towards equalized dwell time by P0. Thus, the bimodal codon dwell time distributions at E12.5-E14 are due to a transient impact of A-site amino acids (Figure 3A). Some amino acids like leucine and isoleucine are coded for by both “fast” and “slow” synonymous codons, particularly apparent early in development, such as the fast TTA-Leu and slow CTG-Leu. Neither codon optimality (Figure S4C) nor codon rarity would account for such dwell time differences, as TTA-Leu is a relatively rare codon (Quax et al., 2015) with a short dwell time, while CTG-Leu is more common with a long dwell time.
Taken together, there is an early development sensitivity to “fast” and “slow” amino acids in the ribosome A-site when ribosome levels are transiently abundant (Figure 3E). These data strongly indicate that the fundamental kinetics of translation shift sharply at mid-neurogenesis.
Divergent trajectories of mRNA and protein reveal distinct developmental programs of neocortex gene expression
With accumulating evidence that mRNA translation is dynamic in neocortex development, we next assessed the extent to which protein levels are divergent from their corresponding mRNAs. We first measured steady state protein levels by MS at each stage (Figure S2A), and tested the correlation with RNA-seq or Ribo-seq data. Results showed that Ribo-seq density is better correlated with protein than mRNA levels, for both inter-gene comparisons within a sample (Figure S6A) and fold changes over time (Figure 4A). Our data in a complex, developing tissue reinforce observations of high Ribo-seq:MS correlation in cell culture (Fang et al., 2018; Jovanovic et al., 2015; Liu et al., 2017). While fold changes between adjacent developmental stages peaks for steady state mRNA at E15.5, translation dynamics persist from E15.5-P0, indicating that mid-neurogenesis initiates a prolonged period of robust translation control (Figure 4A, bottom).

(A) Correlation of MS and RNA-seq or Ribo-seq fold changes (FC) between adjacent developmental stages. (B) The percent variance in MS explained by RNA-seq or Ribo-seq at each developmental stage, and for subgroups with MS and translation efficiency (TE) changes. (C) Hierarchical clustering based on mRNA (RNA-seq) and protein (MS) expression trajectories per gene. Fold change expression increasing or decreasing from E12.5 (t0) to subsequent developmental stages (t) shown in heat map. Neural stem cell and neuronal marker genes are indicated (right). (D) Expression trajectories of mRNA and protein for each cluster in (C), with black lines denoting the median trajectory for each cluster, and grey intervals the upper and lower quartiles (left). Enrichment and proportion of TE up and down genes in each cluster (right), with significant enrichment annotated *p < 0.05. (E) GO enrichment (biological process, BP) for each cluster, with unique terms for a cluster outlined in grey. The top six most significant unique terms per cluster are shown. See also Figure S6.
To quantify the variance in protein levels explained by steady state mRNA vs. protein synthesis, we decomposed technical and systematic variation in protein levels, and estimated proportions explained by RNA-seq vs. Ribo-seq (Li et al., 2014) (Figures 4B and S6B). A majority of protein level variance is accounted for by RNAseq, in agreement with prior observations (Jovanovic et al., 2015; Li et al., 2014). However, Ribo-seq consistently explains a higher fraction of protein variation than RNA-seq at each developmental stage. Proteins whose levels increase over time showed a stronger relationship than those decreasing – as expected, given the importance of degradation rates in determining decreasing protein levels. The protein level predictivity of Ribo-seq was particularly pronounced for genes with changing translation efficiency.
As gene expression trajectory over time is indicative of coordinated developmental programs, we next performed hierarchical clustering of mRNA and protein expression trajectories after E12.5 per gene, which divided the proteome into 13 broad clusters (Figure 4C and Table S4). We found clusters representing concordant and divergent trajectories between mRNA and protein, with neural stem cell and differentiation markers segregating in distinct clusters. While translation efficiency up and down genes were found in all clusters, they were enriched in clusters demonstrating highly divergent mRNA and protein expression trajectory (Figure 4D). Reinforcing the biological significance of clusters representing different mRNA and protein trajectories, gene ontology analysis demonstrated largely non-overlapping, distinct pathways enriched in different clusters, such as neuron differentiation processes enriched in cluster D (Figure 4E). Therefore, measurement of the translatome by Ribo-seq captures important gene expression regulation, with mRNA and protein levels frequently divergent in neocortex development.
Differential translation of Satb2 results in developmental uncoupling of its mRNA and protein expression
Among the most differentially translated neurodevelopmental genes discovered in our data is Satb2, a chromatin binding protein essential for the late-stage formation of neocortex upper layers (Alcamo et al., 2008; Britanova et al., 2008), which undergoes translation upregulation during development (Figure 1D-E). We next assessed the developmental expression trajectory of Satb2 in our RNA-seq, Ribo-seq, and MS data, in addition to translation efficiency (Figure 5A). We compared Satb2 expression patterns with the pan-neural stem cell marker Nes (Frederikson and McKay, 1988), and early-stage lower layer neuron differentiation marker Bcl11b (Arlotta et al., 2005) that is expressed in a population of cells adjacent to the Satb2 lineage. As expected, Nes demonstrates predominantly transcriptionally driven expression downregulation, as the neural stem cell pool is depleted by progressive neuronal differentiation. Bcl11b is expressed in the early-born lineage with high concordance between RNA-seq and Ribo-seq, and with low fluctuation in translation efficiency. In contrast, fold changes in Satb2 Ribo-seq and MS signal are in excess of the RNA-seq, with 2-fold translation efficiency upregulation reaching a plateau at E15.5. These data suggest that Satb2 expression is amplified by translation.

(A) The trajectory of Nes, Bcl11b, and Satb2 gene expression measured by RNA-seq, Ribo-seq, MS, and translation efficiency (TE) in addition to scRNA-seq. scRNA-seq data track differentiating neocortex cells at 1, 24, or 96 hours after birth (y-axis), at birthdates E12, E13, E14, or E15 (x-axis) (Telley et al., 2019). Expected distribution of protein expression is outlined. (B) Neocortex coronal sections at E12.5, E14.5, and E16.5 analyzed for Satb2 and Bcl11b mRNA by fluorescence in situ hybridization, and protein by immunohistochemistry. DAPI (nuclei). Ventricular zone (VZ), cortical plate (CP), lower layers (LL), upper layers (UL). (C) Quantification of (B). Mean ± SEM. See also Figure S7.
Since Satb2 mRNA may undergo translation regulation, we next examined the cellular distribution of Satb2 mRNA in comparison to the expected protein expression in later born upper layer neurons as reported previously (Alcamo et al., 2008; Britanova et al., 2008). Analysis of scRNA-seq data (Telley et al., 2019) revealed, unexpectedly, that Satb2 mRNA is robustly expressed in differentiated neurons of both the early- and late-born lineage (Figure 5A, right). Thus, transcription of this upper layer program may occur in neuronal lineages that include lower layers, and outside of the expected protein distribution.
To directly visualize the expression of Satb2 mRNA and protein, we performed fluorescence in situ hybridization and immunohistochemistry in neocortical coronal sections (Figure 5B), with probe and antibody specificity confirmed in Satb2-/- brains (Figure S7A), and signal quantified per cell (Figures 5C and S7B). Unexpectedly, at the onset of neurogenesis E12.5, we detected robust Satb2 mRNA signal throughout the neocortex, with mRNA clusters present from the ventricular zone in multipotent progenitors and throughout the nascent cortical plate in early-born neurons. Satb2 protein was undetectable at this stage, whereas weak Bcl11b protein signal matched its cortical plate-localized mRNA signal. Notably, almost half of all Satb2 mRNA clusters colocalize with Bcl11b mRNA puncta in the cortical plate, but rarely in the ventricular zone.
At E14.5, when progenitors begin to yield upper layer neurons, Satb2 mRNA is predominantly in cells migrating towards the cortical plate, where weak Satb2 protein begins to appear. By E16.5, when newly born upper layer neurons are migrating through the previously formed lower layers, Satb2 mRNA and protein are broadly expressed across upper layers, lower layers, and the intermediate zone. However, upper layer neurons almost exclusively express Satb2 rather than Bcl11b protein, and protein colocalization is minimal in lower layers despite the intermixing of migrating cells in this region. In the intermediate zone, Satb2 and Bcl11b proteins remain co-expressed similar to the mRNA, as cells continue to migrate towards the cortical plate.
Thus, in contrast to Bcl11b in the adjacent lower layers, Satb2 mRNA and protein expression are divergent in developmental time and space. This divergence includes broad, early Satb2 mRNA expression despite Satb2 protein ultimately restricted to upper layers later in development. Furthermore, while the distribution and colocalization of mRNA for Bcl11b and Satb2 neuronal programs remains broad and overlapping at E16.5, corresponding protein expression is more exclusive, with the intermediate zone a transitory region where specification at both the mRNA and protein levels are still lacking distinction.
Satb2 is transcribed in the earliest neuronal lineages of the developing neocortex
Given the unexpected finding of Satb2 mRNA in early-born neural stem cells, we next sought to monitor transcriptional activation of the Satb2 locus, and employed a fate mapping approach with the Satb2Cre/+ mouse line (Ambrozkiewicz et al., 2017). A Cre expression cassette is located in place of exon 2 at the Satb2 locus, which allows for timed in utero electroporation of Cre-inducible reporters like loxP-STOP-loxP-tdTomato that clonally labels cells with tdTomato that have a history of Satb2 transcription (Satb2tdTom) (Figure 6A). Co-electroporation with an eGFP plasmid serves as a generic label for all transfected cells.
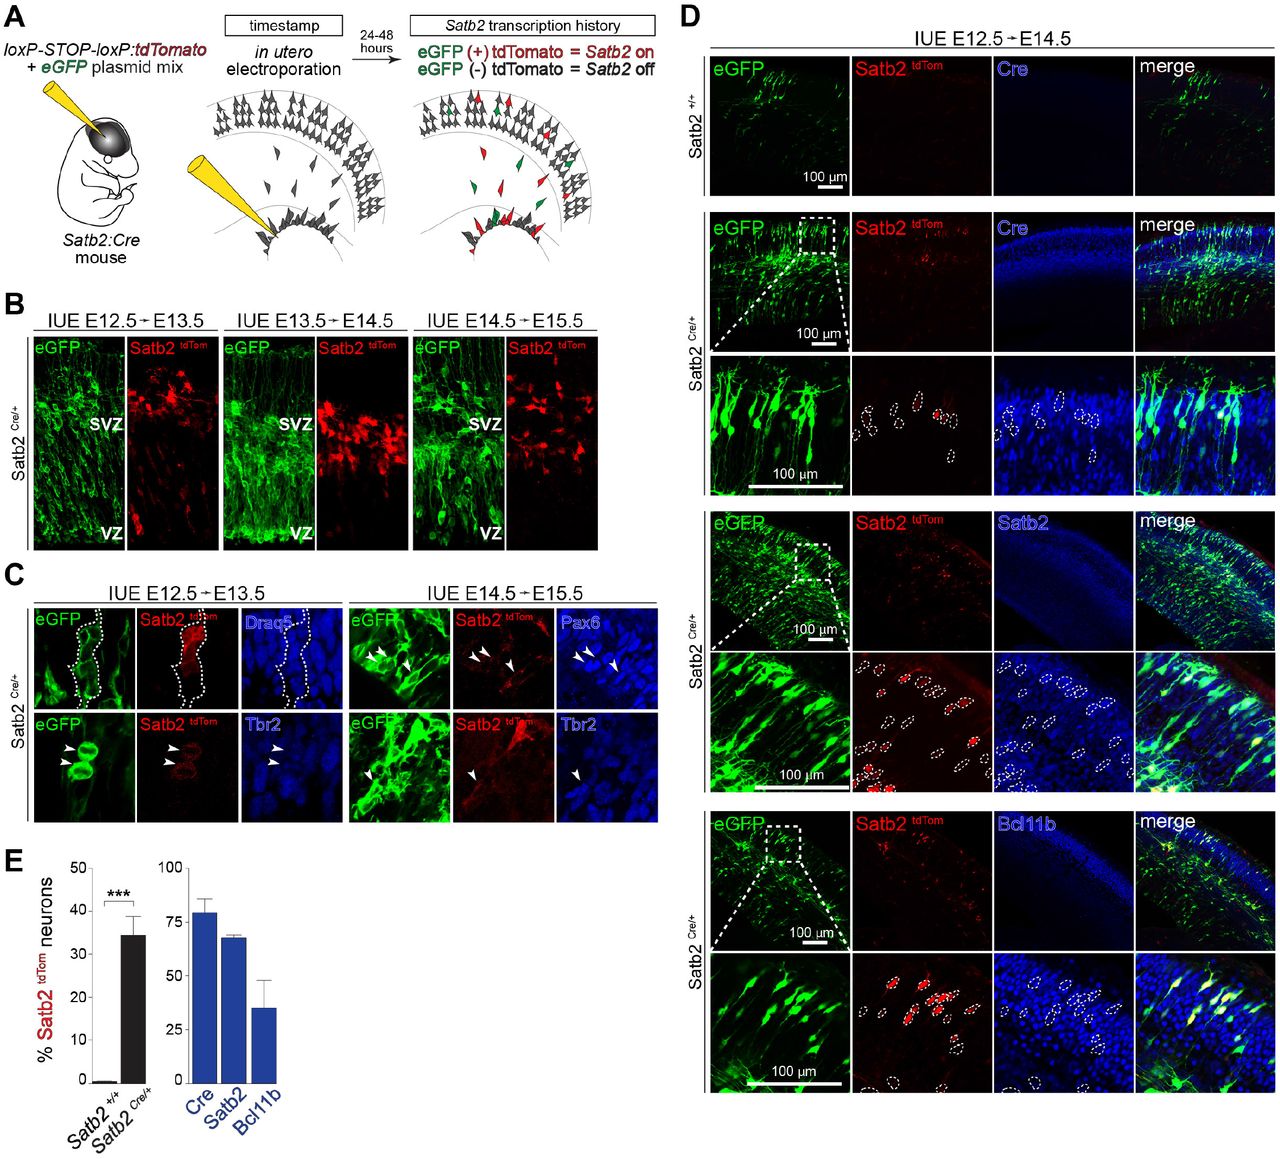
(A) Schematic of the experimental approach. (B) Satb2 transcription activity visualized by Cre-driven (Satb2Cre/+) tdTomato expression, with reporter in utero electroporation (IUE) at E12.5, E13.5, or E14.5 and imaged after 24 hours. Co-electroporation of an eGFP plasmid labels all transfected cells. Ventricular zone (VZ), subventricular zone (SVZ). (C) Satb2tdTom co-immunolabeling with Pax6 (apical progenitors), Tbr2 (intermediate progenitors), and Draq5 (nuclei). (D) Satb2tdTom expression at E12.5-E14.5, with co-immunolabeling for neuronal fate determinant proteins Satb2 and Bcl11b, among all electroporated cells (eGFP). Negative control is the absence of Cre (Satb2+/+). (E) Quantification of (D) for the expression of Cre, Satb2, and Bcl11b proteins in cells transcribing Satb2 mRNA (Satb2 tdTom). Mean ± SD, unpaired t-test, ***p < 0.0001. See also Figure S8.
Neocortical neuronal progenitors were transfected by in utero electroporation at E12.5, E13.5, and E14.5 with a mixture of loxP-STOP-loxP-tdTomato and eGFP, followed by expression analysis after 24 hours (Figure 6B). Remarkably, we detected Satb2tdTom cells in the ventricular zone at E12.5 forming clusters resembling clones or undergoing mitotic divisions. Satb2tdTom cells expressed neural progenitor markers like Pax6 (apical progenitors) or Tbr2 (intermediate progenitors) (Figure 6C). Satb2 transcription was observed for progenitors in the neocortex, but not in the ganglionic eminence (Figure S8). Thus, early Satb2 transcriptional priming occurs in early-born neocortex neural stem cells.
Lower layer Bcl11b neurons have a history of transcribing the upper layer determinant Satb2
Satb2 directly suppresses the Bcl11b enhancer in a DNA sequence-dependent manner, and loss of Satb2 engenders ectopic expression of the corticospinal tract determinant Bcl11b in upper layer neurons (Britanova et al., 2008). In specific brain regions and developmental stages, a distinct population of double positive Satb2+/Bcl11b+ neurons determines a subset of long-distance sub- and cortico-cortical projections (Cederquist et al., 2013; Harb et al., 2016; Nowakowski et al., 2017); however, the origin of these neurons remains unclear.
Given the finding that Satb2 and Bcl11b mRNA co-expression occurs as early as E12.5 in the cortical plate, we then investigated the transcription of Satb2 in Bcl11b-expressing cells. Satb2tdTom cells with in utero electroporation at E12.5 were analyzed at E14.5 by immunohistochemistry for neuronal markers followed by quantification (Figure 6D-E). At E14.5, approximately 35% of E12.5-electroporated cells have activated Satb2 during their development. Among these Satb2tdTom cells, ∼70% express Cre and Satb2 protein, and 30% express Bcl11b protein. Importantly, the Cre expression pattern matches that of native Satb2, with small differences likely attributable to antibody efficiency. The observation of robust Bcl11b expression in neurons with a history of Satb2 transcription suggests that additional layers of regulation may be necessary to restrict specification of Satb2 or Bcl11b lineages.
Pum2 represses premature Satb2 mRNA translation and precocious upper layer specification
With an abundance of ribosomes (Figure 1G-H) and Satb2 mRNA (Figure 5B-C) in the ventricular zone and cortical plate at E12.5 despite minimal Satb2 protein translation, we next searched for regulatory mechanisms controlling delayed Satb2 mRNA translation during early transcriptional priming. Strong post-transcriptional regulation is mediated during neurodevelopment by differentially expressed RNA-binding proteins and their binding sites in mRNA 5’- and 3’-untranslated regions (UTRs) (DeBoer et al., 2013; Lennox et al., 2018; Zahr et al., 2019). We first asked whether 5’- or 3’-UTR elements are associated with translation efficiency upregulation, as measured for Satb2 (Figure 5A). UTR length correlates with the availability of regulatory binding sites, and hence we took an unbiased approach assessing the degree to which 5’- and 3’-UTR length is associated with translation efficiency up or downregulation across all measured genes (Figure 7A). While increasing UTR length is associated with increased translation in both cases, the 3’-UTR demonstrates a particularly strong association with translation upregulation.

(A) The cumulative fraction of mRNAs across all stages with increasing, decreasing, or no change in translation efficiency (TE) as a function of 5’ and 3’-UTR length. (B) Positional weight matrix of the top two motifs ranked by p-value in the 5’ and 3’-UTRs of TE up or down mRNAs (across all stages). “TEsig” and “non” refer to the percentage of genes containing the motif among significantly changing TE sequences, and non-changing length-matched controls, respectively. (C) Developmental RNA-seq, Ribo-seq, and MS signal aligned to Satb2 isoforms, including the position of Pumilio2 (Pum2) binding motifs. (D) Neocortex Pum2 protein expression (heat) at E12.5 and E14.5 measured by immunohistochemistry. (E) Developmental protein expression trajectory of Satb2 and Pum2 measured by MS. (F) shRNA knockdown of Pum2 compared to scrambled control by in utero electroporation (IUE) at E13.5 followed by analysis at E15.5 with Satb2 and Bcl11b immunolabeling. Co-electroporation of eGFP labels all transfected cells. (G) Quantification of (F) for the percent of electroporated cells expressing Satb2 and/or Bcl11b protein. Mean ± SD, unpaired t-test, **p < 0.01. (H) Model.
We next asked whether known sequence motifs are highly represented in the UTRs of translation efficiency up and down genes, which may serve as binding sequences for neocortical RNA-binding proteins (Figure 7B). We found that the 3’-UTRs of translation upregulated mRNAs are enriched for Pumilio (Pum) RNA-binding motifs. In contrast, translation downregulated mRNAs did not display any enriched 3’-UTR motifs. Pumilio RNA-binding proteins are known translation repressors, influencing some neocortical transcripts like the lower layer specifier Tle4, preventing prolonged Tle4 protein expression later in neurogenesis (Zahr et al., 2018). An RNA cross-linking immunoprecipitation screen in the brain detected direct interactions between Pum2 (but not Pum1) and the Satb2 3’-UTR, while no Pum2 interactions were detected with Bcl11b mRNA (Zhang et al., 2017). Whether Pum2 acts early in neurogenesis to repress Satb2 specification before upper layer formation is unknown.
There are two candidate Pum2 binding motifs in the Satb2 3’-UTR (Figure 7C). Just prior to the onset of rapid Satb2 translation, we found Pum2 expression is decreasing by immunohistochemistry (Figure 7D) and MS (Figure 7E). At E12.5, early-born neural stem cells in the ventricular zone express high levels of Pum2. At E14.5, stem cells beginning the transition to upper layer neurogenesis express low levels of Pum2, while the early-born lineage in nascent lower layers retains the previously high expression. We hypothesized that the divergent expression patterns of Satb2 and Pum2 may reflect a gradually decreasing repression of early Satb2 translation by Pum2.
To test the effect of Pum2 on Satb2 and Bcl11b protein expression, we performed Pum2 shRNA knockdown in ventricular zone progenitors by in utero electroporation at E13.5, followed by immunohistochemistry assessment of protein expression at E15.5 (Figure 7F). Pum2 knockdown in early progenitors leads to an increase in the fraction of Satb2-positive neurons at E15.5 compared to scrambled control, while Bcl11b expression is unaffected (Figure 7G). These data suggest that Pum2 represses Satb2 mRNA translation during neocortical development, restricting Satb2 specification until upper layer formation, despite widespread Satb2 transcription.
DISCUSSION
Our study traces how functional gene expression is catalyzed in a complex developmental system, capturing the reactants, synthesis, and products of mRNA translation across the time course of neocortex neurogenesis (https://shiny.mdc-berlin.de/cortexomics/). During the transition from a stem cell predominant early development tissue towards a differentiated neuronal tissue, the level of the translation machinery itself is highly dynamic, with an acute decline in ribosome number at mid-neurogenesis. The transition from relative ribosome abundance to depletion is accompanied by a chronological shift in translation kinetics, where N-terminal codons are translated more slowly, and variations in codon dwell time during elongation – arising from specific amino acids in the A-site – equalize. We estimate ∼18% of the neocortex transcriptome undergoes translation efficiency changes, leading to uncoupling in developmental space and time of transcription and translation. Dynamic regulation of the translatome impacts functional gene expression, with mRNA and protein levels frequently divergent, impacting essential neuronal fate determinants like Satb2. Neural stem cells harbor a pool of mRNAs broadly inclusive of diverse neuronal fates, which is filtered at the protein level to refine neuronal specification, and sharply demarcate cellular boundaries patterning the neocortex.
The overwhelming influence that changes in ribosome number can have on global protein synthesis kinetics and mRNA-specific translation is strongly supported by theoretical and experimental data, and leads to “ribosomopathies” in disease states (Mills and Green, 2017; Shah et al., 2013). The global decrease in ribosome number per cell in the cortical plate represents a coordinated change in ribosomal protein synthesis occurring at the level of translation. Developmentally timed signals may initiate highly orchestrated translation regulation (Kraushar et al., 2021), such as secreted extracellular factors (Kraushar et al., 2015). Global shifts in ribosome levels were recently appreciated to be highly impactful in neurodevelopmental pathologies originating in pregnancy (Kalish et al., 2021), and is an interesting direction for future investigation.
By leveraging the single nucleotide resolution of Ribo-seq, we gain insights into the fundamental nature of translation in the developing brain. In our cycloheximide-free data, we find a position-specific developmental shift in the distribution of ribosome density surrounding both the start and stop codons. Previous studies of the “5’ ramp” present in Ribo-seq experiments have proposed that it represents ‘slow’ synonymous codon choice near the coding sequence start – an adaptation to prevent ribosome collision further into the open reading frame (Pechmann and Frydman, 2013). Our data argue against this as the sole mechanism of 5’ ramping, since numerous genes show an increase in start density despite the generally decreasing effect of codon choice. The increasing relative density at the 5’ of many mRNA coding sequences resembles what might be expected during a shift from ribosome abundant elongation-limited to ribosome scarce initiation-limited translation (Heyer and Moore, 2016), when kinetic barriers to start codon initiation and elongation of early N-terminal peptides (Verma et al., 2019) become comparatively prominent. Of note, we do not observe increasing start codon density only for high translation efficiency genes, or correlation with neurite-localized translation (Figure S2E-F). We therefore favor the hypothesis that ribosome occupancy at beginning of open reading frames becomes progressively rate-limiting for codon-independent reasons, such as scarcity of translation cofactors and the ribosome itself.
To our knowledge, our study is the first to demonstrate differences in the fundamental nature of codon-specific ribosome density over developmental time. Our study agrees with previous work (Gingold et al., 2014; Ingolia et al., 2011) that suggest tRNA levels are not a limiting factor for translation elongation in mammals, as they are in exponentially dividing yeast. Notably, however, these findings do not rule individual cases where a tRNA may influence ribosome stalling, as reported for one nervous system-specific tRNA postnatally (Ishimura et al., 2014). We find that the A-site amino acid strongly influences translation speed, suggesting that factors like the electrostatics of peptidyl chain elongation (Chadani et al., 2017; Riba et al., 2019), amino acid availability, and/or tRNA aminoacylation might play a more important role in early brain development. Directly measuring tRNA charging or the intrauterine metabolic level of amino acids would further address such questions directly, and are interesting directions for future study.
We measure substantial divergence of mRNA and protein expression for distinct neurodevelopmental programs. Broad co-existence of Satb2 and Bcl11b mRNA in the same cell, with co-expression more restricted at the protein level, is indicative of multi-level gene expression regulation during stem cell differentiation. Why would neuronal differentiation benefit from broad transcription of a more “generic” mRNA pool (Telley et al., 2019), followed by selective translation? We speculate that such a mechanism affords the opportunity for tightly timed, rapidly scalable, and spatially targeted gene expression to assemble highly evolved, complex circuits. Per gene per hour, translation is faster and more scalable than transcription by orders of magnitude (Schwanhäusser et al., 2009), and neuronal specification transitions occur in very narrow developmental windows. The availability of a diverse repertoire of both lower and upper layer associated mRNAs like Bcl11b and Satb2, respectively, which can be rapidly and selectively amplified at the protein level, may be essential to specify Bcl11b- or Satb2-exclusive neurons, in addition to Bcl11b-Satb2 double-positive neurons (Nowakowski et al., 2017).
Thus, our data and previous reports (Srinivasan et al., 2012; Zahr et al., 2018) indicate that genetic programs utilized in the developing cortex to specify upper layers are inherently intertwined with ones that give rise to deep layers, and rely on a tight spatiotemporal translational control, rather than a simple sequence of transcriptional regulation. Upper neocortical layers expanded evolutionarily to support higher associative connectivity and function, on top of the more evolutionarily ancient lower layers, and thus might include remnants of lower layer gene expression programs that are modulated post-transcriptionally. We find that the translation repressor Pum2, highly expressed in early rather than late born neural stem cells, helps restrict the production of Satb2-positive neurons to the late-born upper layer lineage. Our study thus joins an evolving body of work on RNA-binding proteins like the Elav (Kraushar et al., 2014; Popovitchenko et al., 2020) and Pumilio (Zahr et al., 2018; Zhang et al., 2017) families that regulate ribosome-mRNA interactions, in addition to direct ribosome binders (Kraushar et al., 2021) in the developing neocortex.
Taken together, our data suggests a model of gene expression where the fundamental levels and kinetics of translation shift during key developmental windows of neocortex neurogenesis, with mid-neurogenesis a major inflection point (Figure 7H). These developmental windows correspond to timed changes in neuronal specification from neural stem cells, where broad transcription of neuronal subtype-specific programs is ultimately refined by translational control, more precisely demarcating the boundaries of neuronal circuits in the neocortex.
AUTHOR CONTRIBUTIONS
M.L.K. designed and initiated the study, with D.H. and M.C.A. making essential contributions. U.O. and V.T. supervised the study, with contributions from C.M.T.S., M.L., M.S., and T.M. Computational experiments were performed by D.H., and laboratory experiments by M.C.A., M.L.K., E.B., A.R., R.D. Ribo-seq and RNA-seq sample preparation and sequencing were performed by U.Z. and M.L.K., and mass spectrometry sample preparation and measurement by K.I. and M.L.K. Immuno-electron microscopy samples were prepared by A.M.-W. and imaged by B.F. and M.L.K. Data were interpreted by D.H., M.C.A., and M.L.K. Manuscript figures and text were composed by D.H., M.C.A., and M.L.K., with valuable editing and input from all authors.
DECLARATION OF INTERESTS
The authors declare no competing interests.
STAR★METHODS
KEY RESOURCES TABLE
CONTACT FOR REAGENT AND RESOURCE SHARING
Lead Contact
Further information and requests for reagents may be directed to and will be fulfilled by the Lead Contact, matthew.kraushar{at}molgen.mpg.de (M.L.K.).
Materials Availability
This study did not generate new unique reagents.
Data and Code Availability
Code generated during this study, not otherwise referenced in the Methods, is supplied at https://github.com/ohlerlab/cortexomics. Further requests may be directed to and will be fulfilled by the Lead Contact, matthew.kraushar{at}molgen.mpg.de (M.L.K.). Data have been deposited in publicly available repositories as indicated in the Methods.
EXPERIMENTAL MODEL AND SUBJECT DETAILS
Mice
Mouse (Mus musculus) lines were maintained in the animal facilities of the Charité University Hospital and Lobachevsky State University. All experiments were performed in compliance with the guidelines for the welfare of experimental animals approved by the State Office for Health and Social Affairs, Council in Berlin, Landesamt für Gesundheit und Soziales (LaGeSo), permissions T0267/15, G0079/11, G206/16, and G54/19, and by the Ethical Committee of the Lobachevsky State University of Nizhny Novgorod. Mice were utilized in the embryonic (E12.5-E17) and early post-natal (P0) period, inclusive of both male and female sexes in each litter without distinction. Timed pregnant wild-type (WT) CD-1 mice utilized for Ribo-seq, RNA-seq, tRNA qPCR array, mass spectrometry, and immuno-electron microscopy were obtained from the Charles River Company (Protocol: T0267/15). Experiments with fluorescent in situ hybridization and immunohistochemistry (Figures 5, 7, and S7) were performed in NMRI WT mice. For experiments with the tdTomato reporter (Figures 6 and S8), Satb2Cre/+ males (Britanova et al., 2008) were mated to NMRI wild type females (Protocols: G0079/11, G54/19, and G206/16). Satb2Cre/+ mouse genotyping was performed as described (Britanova et al., 2008).
METHOD DETAILS
Neocortex sample preparation for bioinformatics analysis
Dissection, cryogenic lysis, and determination of optical density units (ODU) were performed as described (Kraushar et al., 2021).
Ribo-seq and RNA-seq sample preparation and sequencing
Each replicate for paired neocortex Ribo-seq and RNA-seq included 40 brains (80 hemispheres) at E12.5, 30 brains (60 hemispheres) at E14, 21 brains (42 hemispheres) at E15.5, 20 brains (40 hemispheres) at E17, and 17 brains (34 hemispheres) at P0 – performed in biological duplicate at each stage. Neocortex tissue was lysed on ice in 20 mM HEPES, 100 mM KCl, 7.5 mM MgCl2, pH 7.4, supplemented with 20 mM Dithiothreitol (DTT), 0.04 mM Spermine, 0.5 mM Spermidine, 1x Protease Inhibitor cOmplete EDTA-free (Roche, 05056489001), 0.3% v/v IGEPAL CA-630 detergent (Sigma, I8896) and clarified by centrifugation at 16100 xg for 5 min at 4 °C with a benchtop centrifuge. Samples were then measured for A260 ODU on a NanoDrop 1000 Spectrophotometer. Two thirds of the sample were transferred to a new tube for Ribo-seq preparation, with the remaining one third for RNA-seq was mixed with 100 U SUPERase-In RNAse inhibitor (ThermoFisher, AM2694) and frozen at -80 °C for downstream RNA isolation.
For digestion of ribosome protected RNA fragments (RPFs), Ribo-seq samples were then mixed with 60U RNAse-T1 plus 96 ng RNAse-A per ODU (as optimized, Figure S1A-B), and incubated for 30 min at 25 °C, shaking at 400 rpm. To stop RNAse activity, 200 U of SUPERase-In RNAse inhibitor was then added.
10-50 % 5 mL sucrose density gradients were prepared in Beckman Coulter Ultra-Clear Tubes (344057). Base buffer consisted of 20 mM HEPES, 100 mM KCl, 10 mM MgCl2, 20 mM Dithiothreitol (DTT), 0.04 mM Spermine, 0.5 mM Spermidine, 1x Protease Inhibitor cOmplete EDTA-free (Roche, 05056489001), 20 U/mL SUPERase-In RNAse inhibitor (ThermoFisher, AM2694), pH 7.4, prepared with 10 & 50 % sucrose w/v. Overlaid 10 & 50 % sucrose-buffer solutions were mixed to linearized gradients with a BioComp Gradient Master 107ip.
Digested lysates were overlaid on gradients pre-cooled to 4 °C. Gradients were centrifuged in a SW55 rotor (Beckman Coulter) for 1 hr, 4 °C, 37000 rpm, and fractionated using a BioComp Piston Gradient Fractionator and Pharmacia LKB SuperFrac, with real-time A260 measurement by an LKB 22238 Uvicord SII UV detector recorded using an ADC-16 PicoLogger and associated PicoLogger software. Fractions corresponding digested 80S monosomes (Figure S1C) were pooled and stored at -80 °C.
RNA isolation with TRIzol LS was then performed for both RNA-seq and Ribo-seq samples, as per the manufacturer’s instructions. For Ribo-seq and RNA-seq samples, downstream library preparation and sequencing were performed as described (Kraushar et al., 2021). RNA-seq data were utilized in a recent study (Kraushar et al., 2021) corresponding to NIH GEO entry GSE157425. Ribo-seq data in this study are deposited in the NIH GEO: GSE169457.
Mass spectrometry sample preparation
Total proteome analysis from neocortex lysates at E12.5, E14, E15.5, E17, and P0, including complete lysis in RIPA buffer, and downstream processing for mass spectrometry analysis, was performed in a recent study (Kraushar et al., 2021) corresponding to ProteomeXchange entry PXD014841.
tRNA qPCR array sample preparation and measurement
tRNA qPCR array measurement of 151 tRNA isodecoders was performed by Arraystar (Maryland, USA) for neocortex lysates at E12.5, E14, E15.5, E17, and P0 from the same total RNA isolated for RNA-seq described above. Data are deposited in the NIH GEO: GSE169621.
Ribo-seq and RNA-seq data processing
Raw sequence data was converted to FASTQ format using bcl2fastq. Adapters (sequence TGGAATTCTCGGGTGCCAAGG) were removed from Ribo-seq reads with cutadapt, as well as sequences with a quality score less than 20 or a remaining sequence length less than 12, and after removing duplicate read sequences, 4bp UMIs were trimmed from either end of each sequence using a custom perl script. Ribo-seq reads were then aligned to an index of common contaminants (including tRNA, rRNA, and snoRNA sequences) using bowtie2. The resulting processed read files were then aligned to coding sequences (the pc_transcripts fasta file), and separately, to the genome, from GENCODE release M12 (Mus musculus) using STAR, with the following settings: STAR --outSAMmode NoQS --outSAMattributes NH NM --seedSearchLmax 10 --outFilterMultimapScoreRange 0 --outFilterMultimapNmax 255 --outFilterMismatchNmax 1 --outFilterIntronMotifs RemoveNoncanonical. RNA-seq and Ribo-seq libraries achieved high coverage, with a median of 33M and 12M reads mapped to protein coding transcripts, respectively. For quality control, downstream analysis focused on coding sequences with 32 or more Ribo-seq footprints in at least one stage as per (Dunn et al., 2013), which resulted in a set of 12,228 translated gencode transcripts (Table S1).
Since ribosomes with their A-site over a given position will produce a distribution of read lengths mapping to nearby positions, A/P-site alignment represents a crucial step in the processing of Ribo-seq datasets. Frequently, algorithms for A-site alignment rely either explicitly (Calviello et al., 2019; Fang et al., 2018) or implicitly (Ahmed et al., 2019;) on the presence of large peaks at the start and/or stop codons, the known location of which provides a ‘true positive’ that can be used to choose P-site offsets for each read length. We found that such methods gave inconsistent results in our data, with optimal P-sites being chosen at biochemically implausible values (e.g., at 0 base pairs from the read 5’-end). This is likely due to 1) the variable occupancy of the start/stop peak in our data (Figure 2A-B), and 2) the presence of cut-site bias in our data due to the necessity of RNAse T1 & A digestion (Figure S1A-B). Calculating ‘metacodon’ (O’Connor et al., 2016) plots of RPF 5’-end occurrence showed that the most variation between different codons and time points (other than cut-site bias itself at RPF termini) was nonetheless limited to a narrow region a consistent distance from the codon, for each read length (Figure S4A-B). Normalizing these profiles to their median value and measuring the between-codon variance at each position revealed that it aligned with an offset of approximately 14-15 nt (consistent with the A-site position), for reads of length between 25 and 31, and so we chose these for further analysis of ribosome dwell time (Table S3). We also observed an adjacent region of lesser variability 3bp towards the RPF 5’ end, consistent with a non-zero but lesser influence of the P-site codon (Table S3). Genomic alignments were used for metagene plots and metacodon analyses.
The program DeepShapePrime (Cui et al., 2019), modified to accept our chosen P-site offsets instead of hardcoded ones, was then used to derive isoform specific abundance measurements for each protein coding transcript.
In parallel to the above, iso-form level quantification of the RNA-seq was carried out using salmon, with an index built from coding M12 sequences, and the following settings: salmon quant -l SR --seqBias --validateMappings
A snakemake file automating the above workflow is available at https://github.com/ohlerlab/cortexomics.
We then converted DeepShape-prime’s output to salmon format to combine both outputs, using the ORF length as effective length. The R package tximport was used to derive length-corrected gene-level counts and isoform level counts and TPMs for both datasets. The voom package was used for variance stabilization and linear modelling of this data to derive confidence intervals for transcriptional and translational change, both relative to E12.5, and stepwise between each stage. The xTail package (Xiao et al., 2016), which is specifically geared towards estimation of translational efficiency (TE; i.e. the ratio of Ribo-seq density to RNA-seq density) change in the presence of transcriptional change, was used to detect changing TE. Numbers for TE change quoted in the text refer to xtail’s differential TE calls.
For metagene plots (Figure 2A), a ‘best transcript’ (the transcript with the highest median Ribo-seq coverage across all samples) was selected for each gene. These transcripts were further limited to those with a length of 192 or greater. Each of these transcripts was also also analysed using the RiboDiPA package, which looks for position-specific differences in Ribo-seq occupancy between conditions. Since metacodon plots indicated that changes at the start and stop codon were limited to a distinct region 3-4 codons from the start and stop, we divided each coding sequence in to 15 bins, with 7 bins of 4 codons each centering on the start and stop, and a final ‘mid’ bin of variable size encompassing the rest of the ORF (ORFs too short to accommodate this were excluded). We then plotted bin-level log2 fold changes for each gene with significant q-value of using the AUG/stop changing bins (Figure 2B). For Figures 1D, 4A, 4C and S6B, linear fold change for RNA-seq and Ribo-seq were calculated using limma (Law et al., 2014), TEs were calculated using xtail, and MS fold changes were calculated using proDA (Table S2).
Fold changes were binarized into ‘significant’ (absolute fold change greater or less than 1.25, adjusted p-value < 0.05) and ‘non-significant’ for up and down regulated genes respectively, for plotting, and GO term analysis – referred to as dTE and non-dTE in the case of TE fold-change. For GO term analyses of TE change and positional Ribo-seq change, The R package topGO was used.
A list of ribosomal proteins for the mouse large and small subunits were curated from Uniprot.
tRNA abundance and codon dwell time analysis
tRNA abundance was calculated from Arraystar Ct values by the negative delta Ct value for each tRNA compared to the mean of 5S and 18S rRNA levels in each sample (Figure S5). Abundance per-codon was calculated by taking the mean of each replicate, and summing values for all relevant iso-decoders. Availability (Gobet et al., 2020) was calculated as the residual from a simple linear model regressing codon usage against abundance, where codon usage was defined as the occurrence of that codon in the M12 coding transcriptome, weighted by the relevant TPM of each transcript in that sample. We attempted weighting by wobble base pairs as in (dos Reis et al., 2004) and found this did not impact the conclusions in Figure 3.
Dwell time (Weinberg et al., 2016), for each codon, was defined as the mean occurrence of read 5’ ends at the 1st base pair of the A-site, for each codon, using the normalized metacodon occupancy profiles (see above section on P-site alignment).
Relationships between codon dwell time, tRNA abundance/availability, and amino acid identity, were investigated using the R function lm. The dataset used consisted of 269 – (i.e. one per quantified codon, per sample) with terms for the stage of the sample (S), the amino acid coded for (AA), and the abundance (or availability) of the encoding tRNAs (AB).
The largest explanatory variable was AA, which also showed a significant interaction with S, indicating that the amino acid coded for explained ∼ 34% of the variance in dwell time between codons. This term also showed a significant interaction with sample stage, indicating that the amino-acid specific factors determining dwell time may vary over development (e.g., due to the availability of amino acids changing). Within a sample or across all samples, there was no association between tRNA abundance and dwell time, even after correcting for the effect of amino acid coded-for. Some codons however show a significant interaction between abundance and developmental stage, and because these codons were biased towards the high or low end of the abundance dwell time spectrum, we plotted time-relative change vs abundance, for the top and bottom quartiles of dwell time abundance. This revealed a significant association between change in time-relative tRNA abundance and dwell time, with fastest codons showing decreasing tRNA abundance as they slowed, and the slowest codons also showing decreasing tRNA abundance.
Mass Spectrometry data processing
All raw data were analyzed and processed by MaxQuant (v1.6.0.1) (Cox and Mann, 2008). Default settings were kept except that ‘match between runs’ was turned on. Search parameters included two missed cleavage sites, cysteine carbamidomethyl fixed modification and variable modifications including methionine oxidation, protein N-terminal acetylation and deamidation of glutamine and asparagine. The peptide mass tolerance was 6ppm and the MS/MS tolerance was 20ppm. Minimal peptide length of 7 amino acids was required. Database search was performed with Andromeda (Cox et al., 2011) against the UniProt/SwissProt mouse database (downloaded 01/2019) with common serum contaminants and enzyme sequences. The false discovery rate (FDR) was set to 1% at peptide spectrum match (PSM) level and at protein level. Protein quantification across samples was performed using the label-free quantification (LFQ) algorithm (Cox et al., 2014). A minimum peptide count required for LFQ protein quantification was set to two. Only proteins quantified in at least two out of the three biological replicates were considered for further analyses.
To improve the match between mass spec data and sequence data, the peptides from each mass spec group were matched against M12 protein sequences. Instances in which a UNIPROT gene identifier did not match any gene in Gencode, but in which the associated peptide sequences matched proteins for a single Gencode gene, were updated to match that Gencode gene. All further analyses were carried out using gene-level proteomic data.
The R package proDA was used to calculate dropout-aware abundance estimates for each protein group, as well as fold changes and confidence intervals relative to E12.5. For each gene, a ‘best’ matching protein group was defined as the one with the least missing, and highest median, signal across all samples, and selected for further analysis.
Analysis of variance
Analysis of variance was carried out a manner similar to (Li et al., 2014). We fit a linear model regressing measured protein levels, or protein fold changes, P, against measured Ribo-seq or RNA-seq levels R. We then performed variance decomposition using the following equation:

Where  represents total variance in measured protein abundance, (i.e. in proDA-normalized LFQ values) and is decomposed into stochastic error in protein measurement
  (estimated standard error of the protein abundance model fit using proDA), systematic variation in protein levels independent of R
  and error in R measurement, where
  is the linear coefficient relating Ribo-seq and RNA-seq measurements to protein abundance,
  is the measurement bias for R, and
  s the stochastic measurement error in R. Lacking a means of measuring
  in our data, we experimented with a range of values, including the experimentally determined value of 1.21 based on NanoString measurements by Li et al. We found that due to the relatively minor stochastic error in measurements of R, our estimates of
  were robust to reasonable values of
  (between 0.75 and 1.5) and so we elected to fix its value at 1. We then calculated variance explained as:

We applied this equation both within each time point, and to the fold changes between each time point. Stochastic error terms for both within-stage and between stage values for R and P were calculated using limma and proDA respectively. Notably, correlation between the two sequencing assays and MS is strongly dependent on the magnitude of change at that time point, with technical noise specific to each assay non-correlated (Buccitelli and Selbach, 2020). For the R implementation of the above equations, see our github repository (https://github.com/ohlerlab/cortexomics), and the file src/Figures/Figure4/2_vardecomp.R.
Hierarchical clustering
For hierarchical clustering (Table S4), we took fold changes in RNA-seq and MS values relative to E12.5, for each gene, and carried out PCA on the resulting n x 8-dimensional matrix. We calculated Euclidean distances between genes and performed hierarchical clustering using the R function hclust and the ‘ward’ clustering criterion – i.e., favoring the creation of large clusters rather than small clusters containing few outliers. We found that our expression data showed a smooth reduction in variance explained as the number of clusters varied, and so we plotted GO-term enrichment for different cluster numbers, and finding that clusters with similar GO-term enrichments began to appear at a cluster number of 13 chose this as our cutoff. Meta-trajectories for each cluster were plotted using the median and upper/lower quartiles for each cluster. Enrichment of dTE genes in each cluster was calculated using Fisher’s exact test (with dTE status, and inclusion in the cluster, as binary variables). GO term analysis of each cluster was carried out using topGO.
Single cell RNA-seq data
Single cell RNA-seq (scRNA-seq) data in Figure 5A was derived from data and scripts in (Telley et al., 2019) and accompanying web resource http://genebrowser.unige.ch/telagirdon/#query_the_atlas. For each gene, it’s occurrence in neocortex cells measured by scRNA-seq is presented as a heat map arranged by chronological time of cell collection (x-axis) vs. time since cell birth (y-axis), after a timed pulse with a FlashTag label in utero. These axes correspond to roughly orthogonal programs of gene expression change, with the y-axis describing differences between apical progenitors and differentiated neurons, and the x-axis describing differences between cells born at different stages of development.
Sequence motif analysis and UTR length analysis
UTR length in Figure 7A was calculated by taking the longest 5’- or 3’-UTR for each gene. Motif analysis (Figure 7B) was carried out using the AME program from the Meme suite as per (Becker et al., 2018; McLeay and Bailey, 2010) because we observed a systematic difference in UTR length between TE changing and TE unchanging genes. AME requires that input and control sequences are of approximately equal length distribution, so we created a sample of TE changing genes whose length distribution matched that of the TE unchanging genes. We ran AME with the CISBP-RNA database of RNA-binding protein motifs. Additionally, we created PWMs from the Pum1 and Pum2 motifs listed in (Zhang et al., 2017). Locus plots in Figure 7C were created using Gviz (Hahne and Ivanek, 2016), and the motifs shown were found using consensus sequences from these PWMs.
Immuno-electron microscopy
Fixation, sectioning, immunolabeling, and electron microscopy were performed as described previously (Kraushar et al., 2021). E12.5 and E15.5 neocortex coronal sections were labeled with mouse anti-Rps5 (uS7; Santa Cruz, sc-390935) followed by 2.5 nm nanogold conjugated secondary antibody (Nanoprobes, 2001). Imaging was performed at 2700 x magnification on a Tecnai Spirit electron microscope. Quantification was performed in FIJI (Schindelin et al., 2012) with the Process > Find Maxima tool (as shown in Figure 1G, magenta pseudocolor), and Measure > Area tool, followed by statistical analysis in GraphPad Prism (GraphPad Software Inc.) to calculate puncta per μm2 (Welch’s ANOVA, Dunnett’s post hoc test). Primary antibody leave-out controls were prepared in parallel, and were absent of nanogold signal (Figure S3).
Expression vectors
For tdTomato reporter experiments, we used beta-actin driven expression constructs pCAG-EGFP and pCAG-flox-STOP-flox-tdTomato, as described previously (Ambrozkiewicz et al., 2017). A control vector with scrambled non-silencing shRNA (Ambrozkiewicz et al., 2018) was obtained from Thermo Scientific. A vector encoding an shRNA to knock-down mouse Pum2 was purchased from Sigma Mission (TRCN0000233377), sequence: 5’-CCGGCCTAATCCGACAGCGAATAAACTCGAGTTTATTCGCTGTCGGATTAGGTTTTTG-3’
In utero electroporation (IUE)
Mouse embryos were subjected to IUE exactly as described previously (Ambrozkiewicz et al., 2017, 2018, 2020). For the experiments with the tdTomato reporter in the Satb2Cre/+ line, we used an equal amount of pCAG-GFP and pCAG-flox-stop-flox-tdTomato.
Fluorescent in situ hybridization (FISH)
In situ hybridization using RNAscope Technology to detect mRNA of Satb2 and Bcl11b (Figure 5B) was performed according to the manufacturer’s protocols (ACD). Prior to hybridization, embryonic brains at E12.5, E14.5 and E16.5 were collected in PBS, fixed in 4 % PFA/PBS prepared with DEPC for 16-20 hours at 4 °C. Brains were then incubated in sucrose solutions (10 % - 20 % - 30 %/PBS) until they reach osmotic equilibrium, embedded in O. C. T. Compound (Tissue-Tek) in a plastic cryoblock mold and frozen on dry ice. Coronal sections of 16 μm thickness were collected using a cryostat.
Cryosectioning
For all histological procedures, brain sections were prepared on a Leica CM3050S cryostat. Prior to cryosectioning, brains were incubated for at least 5 hours with 10% sucrose in PBS, followed by incubation with 30% sucrose in PBS until the tissue reached osmotic equilibrium. Next, brains were frozen in -38 to -40°C isopentane (Roth). For processing of the tissue after in utero electroporation, coronal cryosections of 50 μm thickness were collected in PBS/0.01% sodium azide solution. For in situ hybridization and the mRNA/protein colocalization experiments in Figures 5B and S7A, 16 μm thickness were collected.
Immunohistochemistry
Fixed brain sections were washed with PBS three times at room temperature prior to the procedure to remove the sucrose and freezing compound residue. The sections were then incubated with Blocking solution (5% goat serum, 0.5% (v/v) Triton X-100, PBS) for one hour at room temperature, then with the primary antibody and DAPI diluted in blocking buffer for 16-20 hours at 4 °C, washed in PBS three times for 30 minutes and incubated with secondary antibody diluted in the blocking buffer for up to four hours at room temperature. Next, sections were incubated with PBS for 30 minutes three times and mounted with a cover glass (Menzel-Gläser) and Immu-Mount mounting medium (Shandon, Thermo-Scientific). For the experiment in Figures 5B and S7A, instead of mounting after the hybridization protocol, the sections were subjected to the immunohistochemistry as described above.
Antibodies for immunohistochemistry
Primary antibodies used for immunocytochemistry were used at dilutions indicated: anti-Satb2 (1:500, rabbit, home-made; (Ambrozkiewicz et al., 2017)), anti-Bcl11b (1:500, rat, Abcam, 25B6, anti-Ctip2), anti-GFP (1:1000, goat, Rockland), anti-Cre (1:1000, rabbit, SySy), anti-Tbr2 (1:300, rabbit, Abcam), anti-Pax6 (1:500, rabbit, Millipore), Draq5 (1:2000). All secondary antibodies were from Jackson Immunoresearch and were used at 1:250.
Confocal imaging
Imaging of brain coronal cross sections after IUE was performed at the level of primary somatosensory cortex primordium. For imaging of the overview of immunostaining, a Leica SPL confocal microscope with 20X, 40X and 63X objectives was used. For quantitative imaging of FISH signal, a Leica Sp8 microscope with 40X objective was used. Quantification of mRNA cluster sizes, and mRNA and protein localization, was performed using ImageJ software.
QUANTIFICATION AND STATISTICAL ANALYSIS
Quantification of distribution and size of mRNA clusters
mRNA puncta were manually quantified using ImageJ software. The maximum intensity of confocal image Z-stacks was projected on a single 2D plane. After thresholding, the images were binarized using the watershed segmentation to separate cluster clouds. The number of particles of 0.1 μm2 or bigger were then quantified using Measure Particles tool and normalized to the number of DAPI-labeled nuclei in a given cortical area (MZ, VZ, etc.). Area of clusters was quantified as well and expressed as an absolute surface.
Quantification of colocalization
Mander’s colocalization coefficient was quantified for neurons expressing Satb2 and Bcl11b protein and mRNA. Protein colocalization was determined manually, and RNA colocalization was quantified using binarized images after multiplication.
Quantification of neuronal cell markers
The manually quantified number of neurons expressing a given marker was normalized to the entire number of IUE-labeled neurons or to DAPI-labeled nuclei count.
Statistical analyses
Statistics in Figures 1H, 5C, 6E, 7F, and S7B were performed using SPSS v.17 (San Diego, USA) or GraphPad Prism software. All numerical values and description of statistical tests used, definition of center, dispersion, precision, and definition of significance can be found in the Table S5. Prior to comparison of experimental groups, normality and log-normality test were performed.
DATA AVAILABILITY
Code generated during this study is supplied at: https://github.com/ohlerlab/cortexomics. NIH GEO depositions: RNA-seq data: GSE157425; Ribo-seq data: GSE169457; tRNA qPCR array data: GSE169621. Mass spectrometry data are deposited in the ProteomeXchange: PXD014841.
Supplemental Information

Nuclease digestion for the generation of ribosome protected mRNA fragments (RPFs) from P0 neocortex, with (A) RNAse-I vs. (B) a combination of RNAse-T1 & A. Absorbance at 260 nm (A260). Chains of actively translating ribosomes (polysome) should be digested into single ribosomes (monosome). RNAse-I, typically used in yeast, was inefficient in neocortex lysates, and thus an RNAse-T1 & A protocol was used for this study. (C) Nuclease digestion and purification of neocortex RPFs in biological duplicates at each developmental stage with the optimized protocol from (B). Each biological replicate included 17-40 brains (34-80 neocortex hemispheres) as detailed in the Methods. (D) RPF read length distribution. (E) Correlation between biological replicates measured by RNA-seq, Ribo-seq, and calculated TE. Associated with Figure 1. See also Table S1.

(A) River plots demonstrating the number of unique genes detected across all 5 stages measured by RNA-seq, Ribo-seq, or mass spectrometry, compared to the number detected in <5 stages. (B) The distribution of translation efficiency (TE) and mRNA abundance (TPM) across all measured genes per stage, and (C) fold changes (FC) vs. the earliest stage E12.5. (D) The distribution of TE up and down compared to the earliest stage E12.5, with significant genes highlighted in black (p < 0.05). (E) TE distribution for genes with increasing start codon occupancy across developmental stages, compared to those without start occupancy changes. (F) The association of mRNAs demonstrating start codon occupancy changes with translation in neurites vs. the soma of cultured neurons (Zappulo et al., 2017). Associated with Figures 1-2. See also Tables S1-2.

(A) Raw images of neocortex coronal sections at E12.5 and E15.5 shown in Figure 1G, immunolabeled with anti-ribosomal protein uS7 followed by 2.5 nm gold secondary (dark black spots), which were automatically detected and quantified in FIJI (magenta spots in Figure 1G-H). Electron microscopy was performed in regions corresponding to the stem cell niches of the ventricular zone (VZ) and sub-ventricular zone (SVZ), in addition to regions of differentiating neurons in the cortical plate (CP), which includes both lower layers (LL) and upper layers (UL) at later stages. Quantification of nanogold secondary signal was performed per unit area of the cytoplasm, with nuclei excluded by tracing the nuclear membrane (black lines in Figure 1G). (B) Primary antibody leave-out controls were prepared in parallel.

5’ normalized ribosome-protected mRNA fragment (RPF) density for (A) all codons and (B) the top 3 slowest/fastest codons. Plotting the normalized density of Ribo-seq read 5’ ends relative to each codon/read length/sample shows two strongly variable regions corresponding to 5’- and 3’-end cut site biases during nuclease digestion. A third variable region in between corresponds to RPFs with their A/P-sites positioned over the codon. We infer the location of the A-site as the 3 bp region showing the most inter-codon variability, and use the normalized occupancy here to measure codon dwell times, and variance between codons. Independently, this region also identifies the location of intra-codon variability between samples. (C) Correlation between ribosome dwell time per codon and the optimality of the codon as defined in (dos Reis et al., 2004), with the mean across all stages shown. (D) Per codon ribosome dwell time at each developmental stage, separated by G/C content for each codon. Associated with Figure 3. See also Table S3.

Total tRNA levels at each stage measured by qPCR array in biological duplicate, with Ct values for each tRNA isodecoder (left) or averaged across isodecoders (right) compared to the mean of 5S and 18S rRNA levels in each sample (delta Ct). Associated with Figure 3.
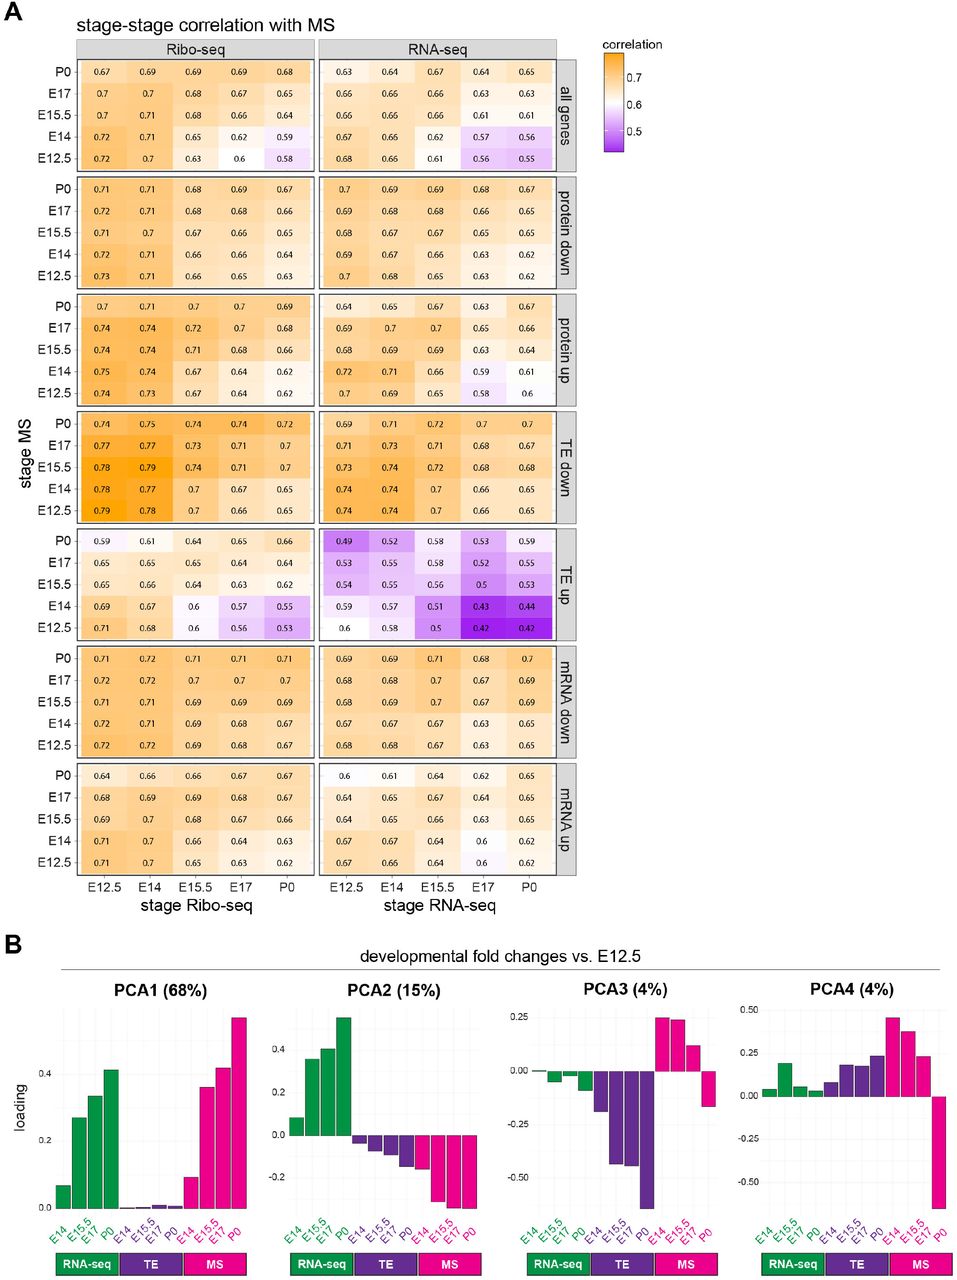
(A) Correlation (high, orange; low, purple) between steady-state protein levels measured by MS, and mRNA translation by Ribo-seq, or steady-state mRNA by RNA-seq. Correlations shown for all genes, and those with changing protein, TE, and mRNA levels. (B) Principal component analysis (PCA) of developmental fold changes in RNA-seq, TE, and MS from the earliest stage E12.5. The first four components are shown, with percent variance annotated. Associated with Figure 4. See also Table S4.

(A) Fluorescence in situ hybridization (FISH) and immunohistochemistry (IHC) probing for Satb2 and Bcl11b mRNA and protein, respectively, in wild-type (Satb2+/+) and Satb2 knockout (Satb2-/-) neocortex coronal sections at E14.5. Ventricular zone (VZ), cortical plate (CP). (B) Measurement of Satb2 and Bcl11b mRNA cluster sizes in FISH probed neocortex sections at three developmental stages. Intermediate zone (IZ), lower layers (LL), upper layers (UL). Mean ± SEM. Associated with Figure 5.

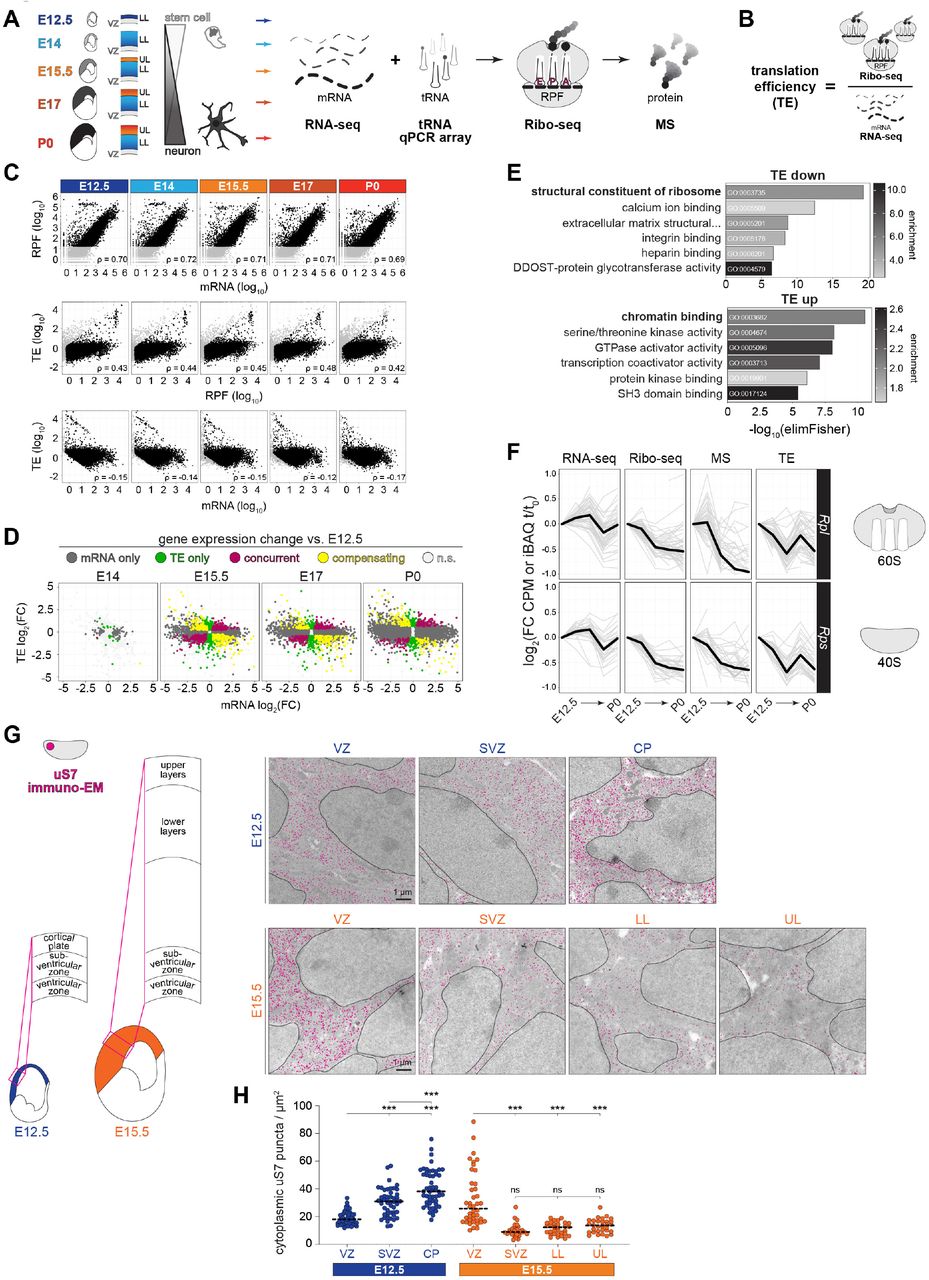
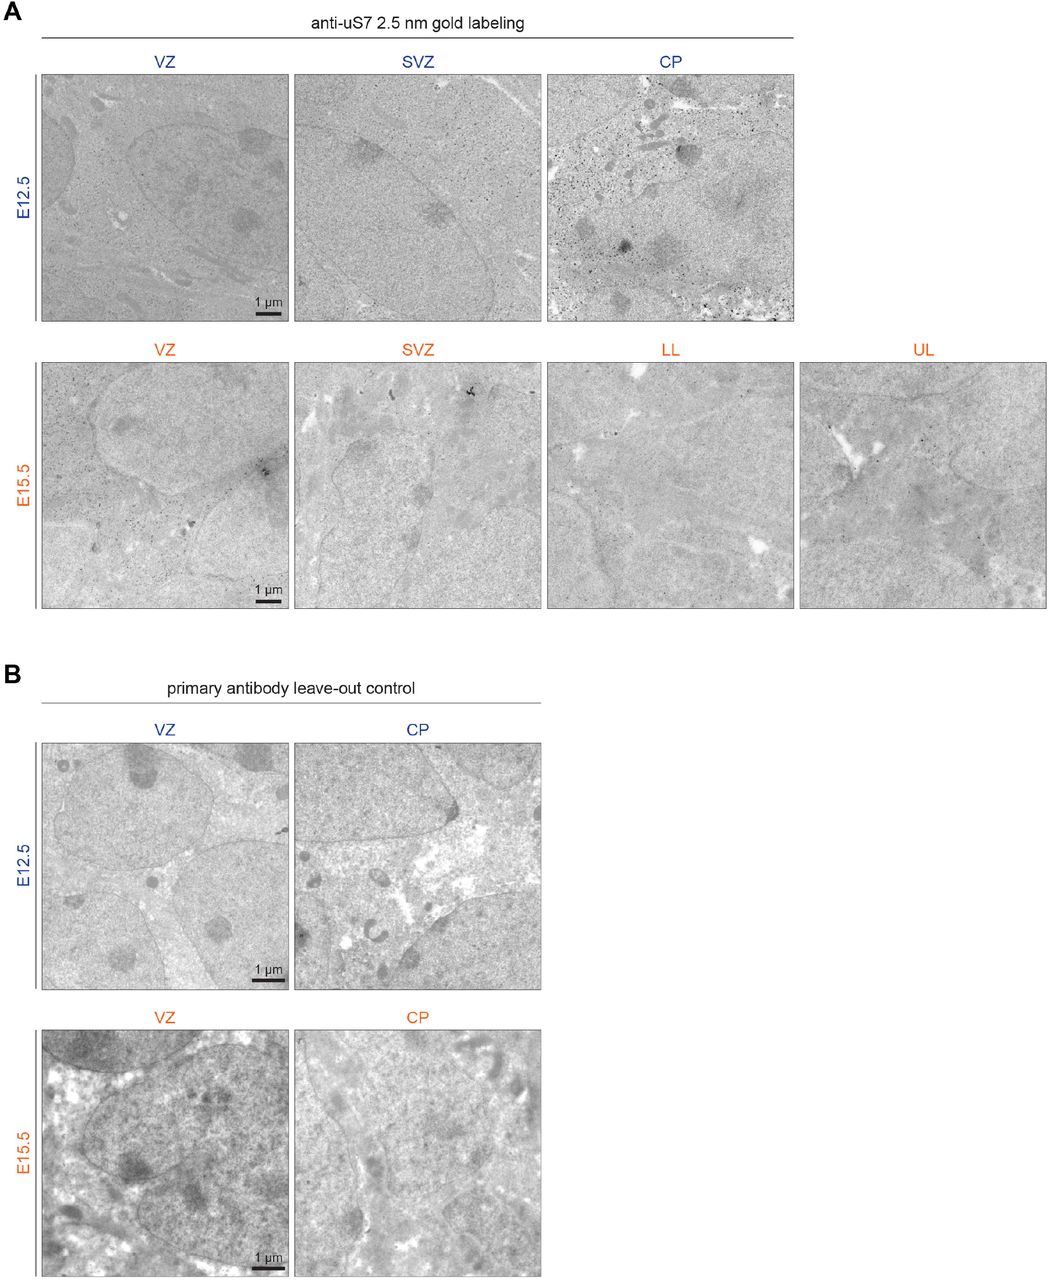
Satb2 transcription activation visualized in Satb2Cre/+ mice by in utero co-electroporation of the neocortex and ganglionic eminence with a loxP-STOP-loxP-tdTomato (Satb2tdTom) fluorescence reporter at E12.5, along with eGFP reporter for all transfected cells, and analysis in coronal sections at E13.5. Ventricular zone (VZ), sub-ventricular zone (SVZ), intermediate zone (IZ), cortical plate (CP). Associated with Figure 6.
ACKNOWLEDGEMENTS
We thank Nadja Klein for advice regarding modeling and statistics. M.L.K. would like to thank Martin Vingron for support. M.L.K. was funded by an EMBO Long-Term Postdoctoral Fellowship (190-2016), Alexander von Humboldt Foundation Postdoctoral Fellowship, and International Guest Fellowship from the Max Planck Institute for Molecular Genetics. D.H. was supported by a grant from the Klaus Tschira Boost Fund. In utero electroporation experiments were funded by a Russian Science Foundation grant (21-65-00017) to V.T.
Footnotes
↵† Senior author
REFERENCES


