

Abstract
Recent studies have provided substantial evidence supporting Ohno’s hypothesis that upregulation of active X chromosome genes balances the dosage of X-linked gene expression relative to autosomal genes. However, the dynamics of X-chromosome upregulation (XCU) during early development remain poorly understood. Here, we have profiled the dynamics of XCU in different lineages of female pre-gastrulation mouse embryos at single cell level through allele-specific single cell RNA-seq analysis. We found dynamic XCU upon initiation of random X-chromosome inactivation (XCI) in epiblast cells and cells of extraembryonic lineages, which undergo imprinted XCI, also harbored upregulated active-X chromosome. On the other hand, the extent of XCU remains controversial till date. While it is thought that it is a global phenomenon, some studies suggested that it affects dosage sensitive genes only. Interestingly, through profiling gene-wise dynamics of XCU, we found that X-upregulation is not global and primarily belongs to ancestral X-linked genes. However, it is not fully restricted to ancestral X-linked genes as some of newly acquired X-linked genes also undergo XCU, suggesting evolution of XCU to the newly acquired genes as well. Importantly, we found that occupancy of RNApolII, H3k4me3, H4k16ac and H3K36me3 is enhanced at loci of the upregulated/ancestral genes compared to non-upregulated/newly acquired X-linked genes. Moreover, upregulated X-linked genes showed increased burst frequency compared to the non-upregulated genes. Altogether, our study provides significant insight into the gene-wise dynamics, mechanistic basis, and evolution of XCU during early development.

Introduction
In therian mammals, sex is determined by the sex chromosomes: XX in female and XY in male. During the evolution of sex chromosomes from a pair of autosomes, the Y chromosome’s degradation led to the dosage imbalance between X and autosomal genes in males [1]. In 1967, Ohno hypothesized that the expression of X-linked genes in XY cells was upregulated to two-fold to correct this imbalance [2]. Subsequently, this X-chromosome upregulation (XCU) was inherited in females and thereby introduced an extra dosage of the X chromosome in female cells. Therefore, to counteract the extra dosage from X-chromosome in female cells, the evolution of X-chromosome inactivation (XCI) happened, a process that silent one of the X-chromosome in female mammals [3]. However, Ohno’s hypothesis was not accepted well for a long time due to the lack of proper experimental evidence supporting the existence of upregulated active-X chromosome. The first evidence of X-upregulation came through the studies based on microarray analysis; however, subsequently, it was challenged through RNA-seq based analysis [4–9]. Down the line, several independent studies came out both in supporting and refuting Ohno’s hypothesis [10–19]. Although, Ohno’s hypothesis is still contested, recent studies by us and others have shown the presence of upregulated active-X chromosome (X2a) in different cell types in vivo and in vitro [20]. However, the dynamics of X-chromosome upregulation (XCU) during early development remain poorly understood. Here, we have profiled the dynamics of XCU in different lineages of female pre-gastrulation mouse embryos at single cell level through allele-specific single cell RNA-seq analysis.
On the other hand, the extent of XCU, i.e., whether XCU is chromosome wide like XCI or restricted to specific genes, remains controversial. Many studies implicated that XCU might be global, though direct evidence showing gene-wise dynamics of upregulation is not well understood [11,14]. In contrary, several studies implicated that XCU affects dosage-sensitive genes such as components of macromolecular complexes, signal transduction pathways or encoding for transcription factors [21,22]. To get better insight about this, here we have explored gene-wise dynamics of XCU in pre-gastrulation mouse embryos. We found that XCU is neither global nor restricted to dosage sensitive genes only. Furthermore, we have investigated if XCU is related to the evolutionary timeline of X-linked genes. Based on the evolutionary time point X-linked genes can be categorized into two classes: ancestral X-linked genes, which were present originally from the beginning of sex chromosome evolution and newly acquired X-linked genes. Whether X-chromosome upregulation happens to the newly acquired X-linked genes or restricted to mostly in ancestral genes is another intriguing question. Here, we have analyzed the XCU kinetics in ancestral vs. newly acquire X-linked genes to understand the evolution of XCU. Finally, we have explored the mechanistic basis of XCU.
Results
Dynamic active-X upregulation upon random XCI in epiblast cells of pre-gastrulation embryos
In pre-gastrulation mouse embryos, while extraembryonic cells have imprinted inactive X, epiblast cells are at the onset of random XCI [23–27]. Therefore, to investigate the dynamics of XCU, we segregated the cells of E5.5, E6.25, and E6.5 mouse embryos into the three lineages: epiblast (EPI), extraembryonic ectoderm (ExE), and visceral endoderm (VE) based on lineage-specific marker gene expression by t-distributed stochastic neighbour embedding (t-SNE) analysis as described earlier (Fig. 1A). We investigated status of XCU in these different lineages of pre-gastrulation embryos through performing allelic/non-allelic gene expression analysis using the available scRNA-seq dataset of E5.5, E6.25, and E6.5 hybrid mouse embryos [28] (Fig. 1A). These embryos were derived from two divergent mouse strains (C57BL/6J and CAST/EiJ) and therefore harbored polymorphic sites across the genome, allowing us to profile gene expression with allelic resolution (Fig. 1A). First, we categorized the cells of different lineages of the embryos based on their XCI status: cells with no XCI (XaXa), partial or undergoing XCI (XaXp), and complete XCI (XaXi) through profiling the fraction of maternal allele expression (Fig. 1B). We found that in the EPI lineage lot of cells belongs to XaXp/XaXa indicating these cells are onset of random X-inactivation, whereas cells of VE/ExE lineage mostly belong to XaXi category since these cells underwent of imprinted X-inactivation (Fig. 1B). As expected, autosomal genes showed almost equivalent paternal/maternal allele expression, thus validating our allele-specific analysis (Fig S1A). Next, to check the upregulation dynamics, we profiled X:A ratio in the individual cells of different stages/lineages of embryos. If a diploid female cell (XaXi) has upregulated active X, the X:A ratio should be more than 0.5 and closer to 1. We found that X:A ratio of XaXp/XaXi cells is always > 0.5 and close to 1 despite XCI, indicating the presence of dynamic X-upregulation from the active X chromosome in XaXp/XaXi cells (Fig. 1C). For X:A analysis, we made sure that there are no significant differences between the X-linked and autosomal gene expression distribution (Method; Supplementary file 1). Next, we compared the allelic expression pattern from autosome and X-chromosome in individual cells of each lineage. As expected, we found that the active X expression is always significantly higher than the autosomal allelic expression in XaXp/XaXi cells, corroborating upregulation of gene expression from the active X -chromosome (Fig. 1D). On the other hand, there were no significant differences in active Xs and autosomal allelic expression in XaXa cells of epiblast lineage suggesting no upregulation of X-chromosome in absence of XCI (Fig. 1D). Altogether, these analyses suggested dynamic active XCU upon initiation of random XCI in epiblast cells of pre-gastrulation embryos.

(A) Schematic outline of the workflow: profiling of active X-upregulation in different lineages (EPI: Epiblast, ExE: Extraembryonic ectoderm, and VE: Visceral endoderm) of pre-gastrulation hybrid mouse embryos (E5.5, E6.25, and E6.50) at the single-cell level using published scRNA-seq dataset. Hybrid mouse embryos were obtained from crossing between two divergent mouse strains C57 and CAST. (B) Classification of cells based on XCI state through profiling of fraction maternal expression of X-linked genes in the single cells of different lineages of pre-gastrulation embryos (EPI, ExE, and VE). Ranges of fraction of maternal expression was considered for different category cells: XaXa = 0.4-0.6, XaXp= 0.6-0.9/ 0.1-0.4 and XaXi = 0.9-1/0-0.1. (C) X:A ratios represented as violin plots for the XaXa, XaXp, XaXi cells of different lineages of pre-gastrulation embryos. (D) Allelic expression levels of X-linked and autosomal genes in XaXa, XaXp, XaXi cells of different lineages of pre-gastrulation embryos.
X-chromosome upregulation is primarily confined to the ancestral X-linked genes
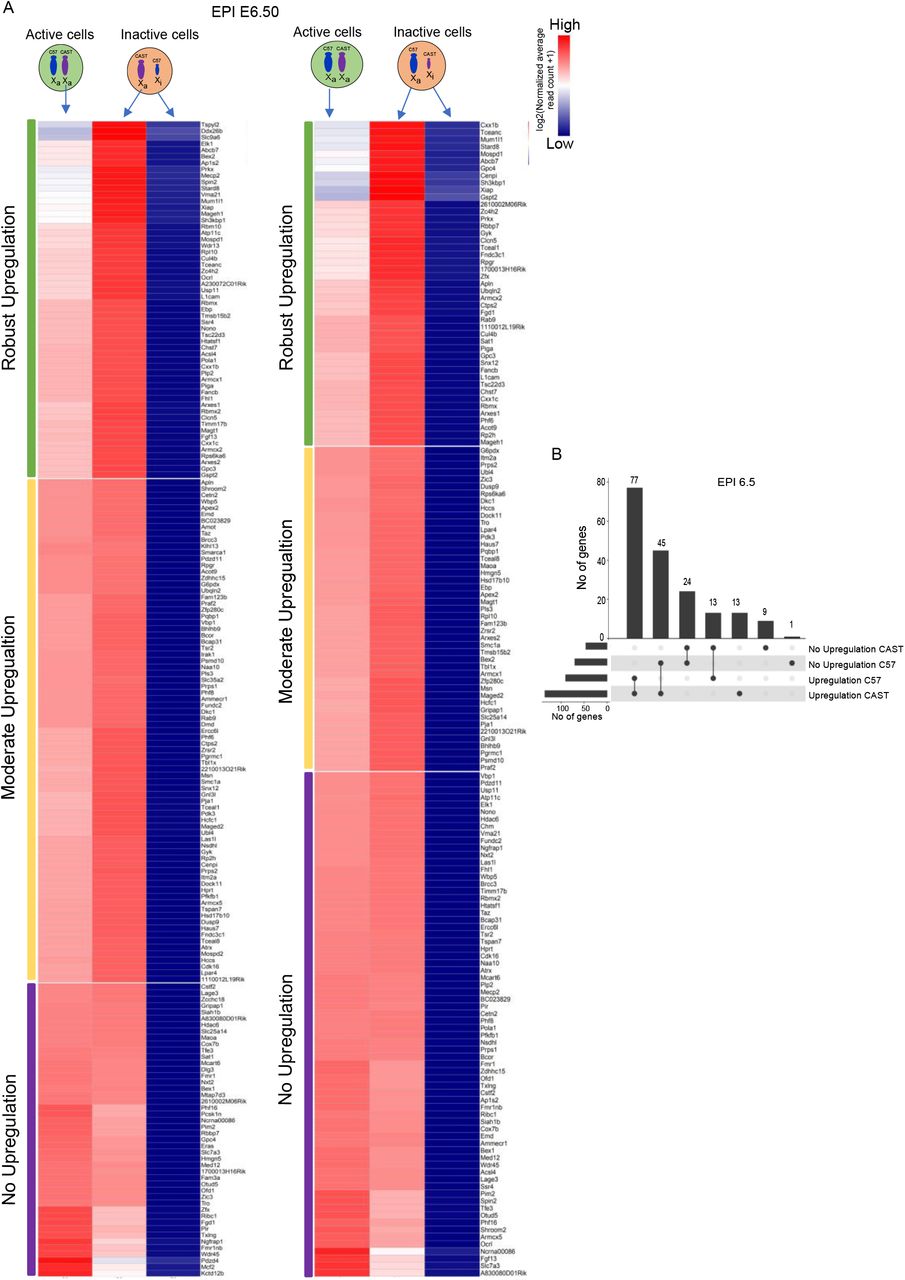
Our X:A analysis in pre-gastrulation embryos and differentiation mESCs revealed that the X:A ratio of XaXi cells is always lower compared to the XaXa cells (Fig. 1C). This data hinted that X-upregulation of X-linked genes in XaXi cells is partial or all genes do not undergo upregulation. To explore this further, we investigated whether X-chromosome upregulation occurs globally or restricted to certain class of genes. To test this, we profiled gene-wise dynamics of XCU by comparing the expression of X-linked genes from the active X chromosome of XaXi cells with the same active allele of XaXa cells in EPI E6.5 (Fig. 2A). If active allele of a gene is upregulated in XaXi cells, it will show increased expression from the active allele in XaXi cells compared to the same active allele of XaXa cells. We found that while many X-linked genes showed increased expression from the active-X allele in XaXi cells compared to the XaXa, there were significant number of genes which did not show such increased expression suggesting that all genes do not undergo upregulation (Fig. 2A). Moreover, while some genes showed robust upregulation from the active-X allele, the others were moderately upregulated. Altogether, this result suggested that X-upregulation is not global or do not occur chromosome-wide. On the other hand, surprisingly we found that an adequate number of upregulated X-linked genes showed allele-specificity as they showed upregulation from either C57 or CAST as an active-X suggesting regulation of upregulation of active allele may occur in parent of origin specific manner (Fig. 2B).

(A) Comparison of expression (log normalized reads) of individual X-linked genes from the active allele between the XaXa and XaXi EPI cells of E6.50 embryos (B) Plot representing intersections of allele-wise upregulation of X-linked genes in E6.5 EPI cells.
Next, we investigated the mechanistic basis of why some genes undergo upregulation and others are not. To find this, we categorized the X-linked genes in E6.5 EPI to three categories based on their active X-upregulation status. X-linked genes with robust upregulation from both C57 and CAST allele (Category 1), robust upregulation from one allele but moderate from the other allele (Category 2) and no upregulation from either of the allele (Category3) (Fig. 3A). First, we explored if there any relevance of the location of the genes on the X-chromosome with the upregulation. To test this, we profiled the position of the upregulated (Cat1 and Cat 2) and non-upregulated genes (Cat 3). We found that all these three categories’ genes are located across the X-chromosome and there is no specific pattern of position of upregulated vs non-upregulated genes indicating chromosomal positioning of X-linked genes is not relevant to X-upregulation (Fig 3B). Next, we asked if there any differences of expression level of these three classes of genes and found no significant differences (Fig. 3C). Moreover, the X-linked genes in the three categories did not show any distinction with respect to their location in topologically associated domains (TADs) (Fig. 3D). As the retrotransposon elements play a profound role in gene regulation, we wanted to see if the genes undergoing upregulation from active-X chromosome has any link to the retrotransposon enrichment. However, the three categories of X-linked genes showed no correlation with the density of LINE elements (Fig. 3E). SINEs on the other hand, were significantly enriched in not upregulated (Cat3) genes compared to the robustly upregulated (Cat1) genes (Fig. 3E). Previous reports stated that XCU is restricted only to dosage-sensitive genes such as genes encoding for large protein complexes, transcription factors, proteins involve in signal transduction etc. Therefore, we analyzed if the upregulated genes in EPI E6.5 is mostly belonging such dosage sensitive genes or not. However, we found that while there are some upregulated genes fall into dosage sensitive category, many genes are not (Supplementary file 2). Moreover, there are many dosage sensitive genes among the non-upregulated genes. Altogether, there are no significant differences of distribution of dosage sensitive / insensitive genes among the upregulated or non-upregulated genes suggesting XCU is not restricted to dosage sensitive genes only (Supplementary file 2). Next, we collated the three categories of X-linked genes with their one-to-one orthologs in chicken (ancestral X-linked genes) and found that most of the robustly upregulated (Cat1) and moderately upregulated (Cat2) genes belong to this ancestral class of X-linked genes (79% in Cat1 and 60% in Cat2) and only a few belong to the class of acquired X-linked genes. While the genes that showed no upregulation had equivalent distribution to two classes of ancestral and acquired X-linked genes (Fig. 3F). Altogether, these data suggest that the process of active-X upregulation is mostly confined to the ancestral class of X-linked genes (Fig. 3F).

(A) Shematic representation of different categories of X-linked genes in E6.5 EPI based on their allele-wise upregulation status. X-linked genes with robust upregulation from both C57 and CAST allele (Category 1), robust upregulation from one allele but moderate from the other allele (Category 2) and no upregulation from either of the allele (Category3). (B) Genomic position of the three categories of X-linked genes on the X-chromosome. (C) Comparison of expression levels (log2 TPM) between the three categories of X-linked genes. (D) Histograms representing the percent of the three categories of X-linked genes located in TADs. (E) Density of LINE and SINE repeats in the three categories of X-linked genes. p-values of Wilcoxon rank test comparing the retrotransposon enrichment in the three categories (p-value < 0.05; *) (F) Heatmap representing the segregation of the three categories of X-linked genes to ancestral and acquired classes of X-linked genes in E6.5 EPI cells.
Upregulated / ancestral X-linked genes show higher enrichment of active chromatin marks
Previous studies have reported that the X linked genes from active X-chromosome have greater enrichment of the active chromatin marks compared to the autosomal genes [14]. Therefore, we investigated if the different active chromatin marks (H3K4me3, H3K36me3, H4K16ac and RNA PolII) are differentially enriched at the transcriptional start site and gene body of upregulated (Cat1 and Cat2) vs not upregulated (Cat3) genes on the active X-chromosome (Fig. 4A). Interestingly, we found that the average density of H3K4me3, H4K16ac and RNA PolII showed notable increase in the upregulated X-linked genes (Cat1 and Cat2) compared to the not upregulated genes (Cat3) both around the TSS and gene body regions (Fig. 4A). However, for H3K36me3 there were slight difference in enrichment. Additionally, we compared the enrichment of these active marks between ancestral vs acquired X-linked genes on the active X-chromosome and found that the ancestral class of X-linked genes showed higher enrichment for these marks compared to the newly acquired X-linked genes (Fig. 4B). Finally, we profiled the allelic transcriptional burst kinetics between the upregulated and not upregulated X-linked genes in the XaXi cells of E6.5 EPI. Excitingly, the upregulated X-linked genes (Cat1 and Cat2) showed significantly higher burst frequency compared to the not upregulated X-linked genes (Cat3) (Fig. 4C). However, burst sizes were not significantly different between the two categories of X-linked genes (Fig. 4C).

Density plots showing the enrichment of RNA PolII S5P, active chromatin marks H3K4me3, H3K36me3 and H4K16ac in the (A) upregulated vs not upregulated X-linked genes and (B) ancestral vs acquired classes of X-linked genes on the active-X chromosome. (C) Comparison of allelic burst frequency and burst size of the upregulated vs not upregulated X-linked genes in the E6.5 EPI cells (Wilcoxon rank test: p-value < 0.01; ** and p-value < 0.001; ***). (D) Model representing that X-chromosome upregulation is mostly confined to the ancestral X-linked genes and mechanism of XCU.
Discussion
In 1967, Ohno hypothesized that gene loss from the Y chromosome led to the upregulation of X-chromosomes in both sexes, which subsequently led to the inactivation of one X-chromosome in female mammals to ensure proper X-dosage. However, Ohno’s hypothesis was contested for a long time due to the lack of appropriate experimental evidence. Recent studies have provided evidence supporting active X upregulation in different cell types in vivo and in vitro. However, the dynamics of X-upregulation during early development remain poorly understood. Here, we have profiled the XCU dynamics at single cell level in female pre-gastrulation mouse embryos. We found that in EPI cells (E5.5, E6.25, E6.5), which are at the onset of random XCI, X upregulation is dynamically linked with the X-inactivation. VE and ExE of pre-gastrulation embryos, which undergo imprinted X-inactivation also showed presence of upregulated active-X chromosome. Altogether, these results suggested that two X-chromosomes expression state is highly plastic in nature towards balancing the optimal X chromosome dosage during early development.
One intriguing question is whether X-upregulation occurs globally or restricted to certain class of genes. It is thought that upon X-chromosome inactivation, numerous trans-acting factors leave the inactivating-X and shift to the active-X thereby leading to global increase in expression from the active-X chromosome. In contrast, it is thought that XCU is restricted to dosage sensitive genes only. Interestingly, we found that though XCU is dynamically linked to XCI, XCU is not global like XCI. Indeed, we found that the X:A ratio of XaXi cells is always lower compared to the XaXa cells. Importantly, through assaying gene-wise dynamics of XCU we found that many X-linked genes do not undergo upregulation. Moreover, we found that upregulated genes are not restricted to dosage sensitive genes. Altogether, these results suggested that XCU is neither global nor restricted to dosage sensitive genes only. Interestingly, we found that XCU is mostly confined to the ancestral class of X-linked genes. However, it is not restricted to ancestral X-linked gene only as some of newly acquired X-linked genes also undergo X-upregulation, suggesting evolution of X-upregulation to the newly acquired genes as well.
On the other hand, mechanism of XCU, remain poorly understood. We found that the active histone marks such as H3K4me3, H3K36me3, H4K16ac as well as RNA PolII are highly enriched on the genes subjected to X-upregulation compared to the not-upregulated genes (Fig. 4A). Furthermore, these marks are seen to have higher average density on the ancestral X-linked genes compared to the newly acquired class of X-linked genes (Fig. 4B). Interestingly, we found that the transcriptional burst frequencies are significantly enhanced in upregulated genes compared to the non-upregulated genes. On the other hand, transcriptional burst sizes remained almost similar between the two categories of X-linked genes (Fig. 4C). Taken together, our results unveils that the distinctive enrichment of active chromatin marks and higher transcriptional burst frequencies might be one of the major regulators for XCU (Fig. 4D).
In summary, our study confers significant support to Ohno’s hypothesis. In addition, we show that although the two X-chromosomes’ expression state is highly plastic in nature towards balancing the optimal X chromosome dosage during development, XCU is not global like XCI. Importantly, we found that XCU is primarily confined to ancestral X-linked genes only.
Methods
Data acquisition
Pre-gastrulation embryo single-cell RNA-seq dataset for E5.5 and E6.25 generated from hybrid mouse embryos (C57BL/6J × CAST/EiJ) and E6.5 from hybrid mouse with the reciprocal cross (CAST/EiJ × C57BL/6J) was retrieved under the accession code-GSE109071 [28].
Read alignment and counting
RNA-seq reads were aligned to the mouse reference genome mm10 using STAR [29]. The reads aligned were then counted using HTSeq-count. To avoid the dropout events due to low amount of mRNA sequenced within single cells, we used a statistical imputation method scImpute [30], which identifies the likely dropouts without introducing any bias in the rest of the data. Expression levels of transcripts was computed using Transcripts per million (TPM) method.
Sexing of the embryos
For sex-determination of the pre-gastrulation embryos, an embryo was classified as male if the sum of the read count for the Y-linked genes (Usp9y, Uty, Ddx3y, Eif2s3y, Kdm5d, Ube1y1, Zfy2, Zfy1) in each cell of an embryo was greater than 12, rest were considered as female embryos.
X:A ratio
We calculated the X:A ratio for different lineages of pre-gastrulation embryo by dividing the median expression (TPM) of X-linked genes with the median expression (TPM) of the autosomal genes. For this analysis, we considered those X-linked and autosomal genes having ≥ 0.5 TPM. We also applied an upper TPM threshold which corresponded to the lowest 90 th centile of TPM expression to avoid any differences between the X-linked and autosomal gene expression distribution. Also, statistical Kolmogorov-Smirnov’s test was performed which again validated the non-significant differences in the levels of gene expression distribution between X and autosomal genes. We excluded the escapees of X-inactivation and the genes in the pseudo autosomal region from our analysis.
Allele-specific expression analysis
We first constructed in silico CAST specific parental genome by incorporating CAST/EiJ specific SNPs (https://www.sanger.ac.uk/science/data/mouse-genomes-project) into the mm10 genome using VCF tools. Reads were mapped onto C57BL/6J (mm10) reference genome and in silico CAST genomes using STAR allowing no multi-mapped reads. To exclude any false positives, we only considered those genes with at least 2 informative SNPs and minimum 3 reads per SNP site. We took an average of SNP-wise reads to have the allelic read counts. After normalization of allelic read counts, we considered only those genes for downstream analysis which had at least 1 average reads across the cells of each lineage from a specific developmental stage for pre-gastrulation embryos. Further, only those single-cells were considered for downstream analysis which showed at least 10 X-linked gene expressions. Allelic ratio was obtained individually for each gene using formula = (Maternal/Paternal reads) ÷ (Maternal reads + Paternal reads).
Classification of ancestral and acquired X-linked genes
The ancestral X-linked genes are identified as those having one-to-one orthologs in chicken and were retrieved from the Ensembl biomart release 102. All the remaining X-linked genes are considered as the acquired class of X-linked genes.
Topologically associated domains (TADs), LINE and SINE analysis
The coordinates of TADs called in mouse ES cells by GMAP method were retrieved from the TADKB database for our analysis [31]. For LINE and SINE element analysis, we used the table containing the genomic coordinates of repeat elements from the UCSC table browser, the remasker table (“rmsk”) for mm10 reference mouse genome assembly. The density of LINE and SINE elements was then calculated for a gene as the ratio of the total length of the retrotransposons present to the length of that gene.
Transcriptional burst kinetics
We used SCALE to profile allelic transcriptional burst kinetics [32]. For this analysis, we used genes with at least 5 average read counts across the cells of EPI E6.5.
ChIP-seq analysis
To estimate the enrichment of H3K4me3, H3K36me3, RNA PolII S5P, and H4K16ac in our gene categories, we retrieved the available ChIP-seq datasets for MEF cells from GSE33823 [33], GSE36905 [34] for H3K4me3, H3K36me3, RNAPolII S5P and GSE97459 [35] for H4K16ac.
Gene function analysis
We identified association of the genes with different biological function through Gene Ontology (Biological process, Molecular Function and Cellular Component, Signal related function (http://geneontology.org/) [36], Transcription factor databases (http://bioinfo.life.hust.edu.cn/AnimalTFDB/#!/, https://sunlab.cpy.cuhk.edu.hk/mTFkb/) [37,38], involved in protein complex (http://mips.helmholtz-muenchen.de/corum/#) [39], Dosage sensitive genes (human) (https://www.clinicalgenome.org/) [40], Housekeeping genes database (https://housekeeping.unicamp.br/, Li et al., 2017) [41,42].
Statistical tests and plots
All statistical tests and plots were performed in R version 3.6.3.
Author’s Contribution
SG conceptualized and supervised the study. HCN and DC did bioinformatic analyses. SG, DC, and HCN wrote, edited, and proofread the manuscript. The final manuscript was edited and approved by all the authors.
Acknowledgments
Study is supported by DBT grant (BT/PR30399/BRB/10/1746/2018), DST-SERB (CRG/2019/003067), DBT-Ramalingaswamy fellowship (BT/RLF/Re-entry/05/2016) and Infosys Young Investigator award to SG. We also thank DST-FIST [SR/FST/LS11-036/2014(C)], UGC-SAP [F.4.13/2018/DRS-III (SAP-II)] and DBT-IISc Partnership Program Phase-II (BT/PR27952-INF/22/212/2018) for infrastructure and financial support.
References


