

Abstract
To understand the architecture of human language, it is critical to examine diverse languages; yet most cognitive neuroscience research has focused on a handful of primarily Indo-European languages. Here, we report a large-scale investigation of the fronto-temporal language network across 45 languages and establish the cross-linguistic generality of its key functional properties, including general topography, left-lateralization, strong functional integration among its brain regions, and functional selectivity for language processing.
Main Text
Approximately 7,000 languages are currently spoken and signed across the globe1. These are distributed across more than 100 distinct language families, which vary in size from 2 to over 1,500 languages. Certain properties of human languages have been argued to be universal, including the capacity for productivity (making “infinite use of finite means”2) and communicative efficiency3. However, language is the only animal communication system that manifests in so many different forms4. The world’s languages exhibit striking diversity4, with differences spanning the sound inventories, the complexity of derivational and functional morphology, the ways in which the conceptual space is carved up into lexical categories, and the rules for how words can combine into phrases and sentences. To truly understand the nature of the cognitive and neural mechanisms that can handle the learning and processing of such diverse languages, we have to go beyond the limited set of languages used in most psycho- and neuro-linguistic studies5, 6. This much needed step will also foster inclusion and representation in language research7.
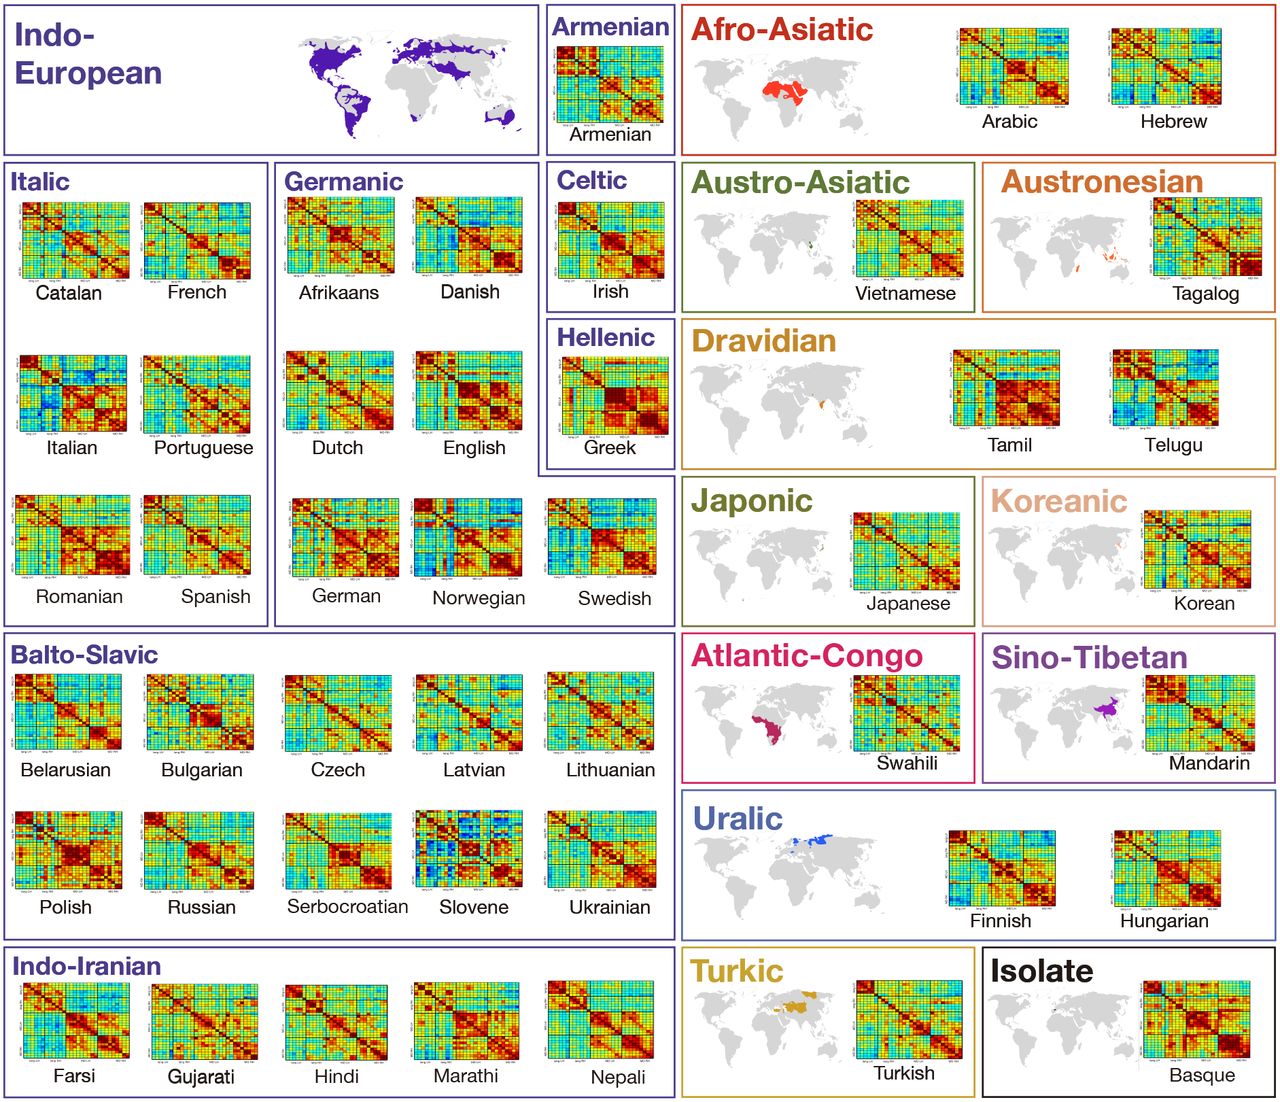
Here, in a large-scale fMRI investigation, we evaluate the claim of language universality with respect to core features of its neural architecture. In the largest to date effort to sample many diverse languages, we tested native speakers of 45 languages across 11 language families (Afro-Asiatic, Austro-Asiatic, Austronesian, Dravidian, Indo-European, Japonic, Koreanic, Atlantic-Congo, Sino-Tibetan, Turkic, and Uralic) and one isolate (Basque). To our knowledge, about a third of these languages have never been investigated with functional brain imaging (or only probed in clinical contexts), no experimental paradigm has been tested with more than four languages at a time, and no attempts have been made to standardize tasks / language network definitions across languages as needed to enable meaningful comparisons across studies (Supp. Table 1). We examined the cross-linguistic generality of the following properties of the language network: i) general topography (robust responses to language in the frontal and temporal brain areas), ii) lateralization to the left hemisphere, iii) functional integration among the different regions of the network, as assessed with inter-region functional correlations during naturalistic cognition, and iv) functional selectivity. The approach we took was to test a small number (n=2) of speakers for each language to see whether these properties—which have been shown to hold robustly for the speakers of English (at the individual-subject level8)—would also hold for speakers of typologically diverse languages.
Each participant performed several tasks during the scanning session. First, they performed two language ‘localizer’ tasks: the English localizer based on the contrast between reading sentences and nonword sequences9 (all participants were fluent in English; Supp. Table 2), and a critical localizer task, where they listened to short passages from Alice in Wonderland in their native language, along with two control conditions (acoustically degraded versions of the native language passages where the linguistic content was not discernible and passages in an unfamiliar language). Second, they performed one or two non-linguistic tasks included to assess the functional specificity of the language regions10 (a spatial working memory task, which everyone performed, and an arithmetic addition task, performed by 67 of the 86 participants). Finally, they performed two naturalistic cognition paradigms included to examine correlations in neural activity among the language regions, and between the language regions and regions of another network supporting high-level cognition: a ∼5 min naturalistic story listening task in the participant’s native language, and a 5 min resting state scan.
Consistent with prior investigations of a subset of these languages (e.g., Supp. Table 1), the activation landscape for the Native-language>Degraded-language contrast, which targets high-level language processing11, was remarkably consistent across languages and language families, with the activations covering extensive portions of the lateral surfaces of left frontal and temporal cortex (Figure 1). In the left-hemisphere language network, across languages, the Native-language condition elicited a reliably greater response than both the Degraded-language condition (2.13 vs. 0.84 % BOLD signal change relative to the fixation baseline; t(44)=21.0, p<0.001) and the Unfamiliar-language condition (2.13 vs. 0.76; t(44)=21.0, p<0.001) (Figure 2a; see Supp. Figures 1 and 2 for data broken down by language and fROI, respectively; see Supp. Info. 2 for statistics across language families, and Supp. Info 3 for analyses with linear mixed effects models). Across languages, the effect sizes for the Native-language>Degraded-language and the Native-Language>Unfamiliar-language contrasts ranged from 0.49 to 2.49, and from 0.54 to 2.53, respectively; importantly, for these and all other measures, the inter-language variability is actually lower than inter-individual variability (Supp. Info. 3).

Activation maps for the Alice language localizer contrast (Native-language>Degraded-language) in the left hemisphere of a sample participant for each language. Each significance map generated by FreeSurfer12 was smoothed using a Gaussian kernel of 4 mm full-width half-max and thresholded at the 70th percentile of the positive contrast for each participant (see Supp. Info 1 for details). The surface overlays were rendered on the 80% inflated white-gray matter boundary of the fsaverage template using FreeView/FreeSurfer. Opaque red and yellow correspond to the 80th and 99th percentile of positive-contrast activation for each subject, respectively. (These maps were used for visualization purposes only; all the statistical analyses were performed on the data analyzed in the volume.)

a) Percent BOLD signal change within the LH language functional ROIs (see inset for the RH language fROIs) for the three language conditions of the Alice localizer task (Native language, Acoustically degraded native language, and Unfamiliar language), Hard and Easy conditions of the spatial working memory (WM) task, and Hard and Easy conditions of the math task. The language fROIs show robust functional selectivity for language processing. Here and in the other panels, the dots correspond to languages (n=45), and the labels mark the averages for each language family (n=12; AfAs=Afro-Asiatic, AuAs=Austro-Asiatic, Aust=Austronesian, Drav=Dravidian, IndEu=Indo-European, Japn=Japonic, Korn=Koreanic, AtCo=Atlantic-Congo, SinT=Sino-Tibetan, Turk=Turkic, Ural=Uralic, Isol=Isolate). b) Three measures that reflect LH lateralization of the language network: i-strength of activation (effect sizes for the Native-language>Degraded-language contrast); ii-extent of activation (number of voxels at a fixed threshold for the Native-language>Degraded-language contrast); and iii-inter-region functional correlations during two naturalistic cognition paradigms (i-story comprehension in the participant’s native language; ii-resting state). The LH language network shows greater selectivity for language processing relative to a control condition, is more spatially extensive, and is more strongly functionally integrated than the RH language network. c) Inter-region functional correlations for the LH and RH language and the Multiple Demand (MD) networks during two naturalistic cognition paradigms (i-story comprehension in the subjects’ native languages; ii-resting state). The language and the MD networks are each strongly functionally integrated, but are robustly dissociated from each other (pairs of fROIs straddling network boundaries show little/no correlated activity).
The Native-language>Degraded-language effect was stronger in the left hemisphere than the right hemisphere (2.13 vs. 1.47; t(44)=7.00, p<0.001), and more spatially extensive (318.2 vs. 203.5; t(44)=6.97, p<0.001; Figure 2b). Additionally, in line with prior data from English13, the regions of the language network exhibited strong synchronization in their activity, with the average left hemisphere within-network correlation of r=0.52 during story comprehension and r=0.41 during rest, both reliably higher than zero (ts=31.0, ps<0.001) and phase-shuffled baselines (ts>10.0, ps<0.001; Figure 2c; see Supp. Figures 3 and 4 for data broken down by language). Further, as in prior work in English13, and mirroring lateralization effects in the strength and extent of activation, the inter-region correlations in the left hemisphere language network were reliably stronger than those in the right hemisphere during both story comprehension (0.52 vs. 0.35; t(44)=8.00, p<0.001) and rest (0.41 vs. 0.28; t(44)=8.00, p<0.001; Figure 2c).
Finally, brain regions that support language processing have been shown to exhibit strong selectivity for language over many non-linguistic tasks, including executive function tasks, arithmetic processing, music perception, and action observation10, 14. This selectivity appears to be robustly present across speakers of diverse languages. Responses to the Native-language condition were significantly higher than those to a) the hard condition of the spatial working memory (WM) task (2.13 vs. −0.06; t(44)=20.4, p<0.001), and b) the hard condition of the arithmetic addition task (2.13 vs. 0.04; t(40)=20.1, p<0.001; Figure 2a, Supp. Figures 1-2). Furthermore, as in English13, the language regions were robustly dissociated in their intrinsic fluctuation patterns from the regions of the bilateral domain-general multiple demand (MD) network implicated in executive functions15: within-network correlations were reliably greater than between-network correlations both during story comprehension (0.43 (language network, across the left and right hemisphere), 0.40 (MD network) vs. −0.01 (language-MD); ts>23, p<0.001), and rest (0.34 (language, across hemispheres), 0.43 (MD) vs. −0.03 (language-MD), ts>20, p<0.001; Figure 2c, Supp. Figures 3-4).
In summary, we have here established that several key properties of the neural architecture of language—including its topography, lateralization to the left hemisphere, strong within network functional integration, and selectivity for linguistic processing—hold across speakers of diverse languages spanning 11 language families; and the variability we observed across languages is lower than the inter-individual variability8. The language brain network therefore appears well-suited to support the broadly common features of languages, shaped by biological and cultural evolution. Although the traditional notion of linguistic universals, couched with the framework of Universal Grammar2, has been questioned4, other universalscf.16 have emerged in recent years3. Most have to do with cognitive and communicative pressures shaping language to optimize information encoding and transfer, such as the trade-off between word length and informativity17, the tendency to minimize syntactic dependencies18, and the way meanings are encoded linguistically19.
In spite of their shared features, languages do exhibit remarkable variation4. Whether/how this variation relates to the neural implementation of linguistic computations remains an important open question. By establishing broad similarity in the language network’s core features and making publicly available the ‘localizer’ tasks20 for 46 diverse languages (to be continuously expanded over time; the data reported here are also made available), this work lays a critical foundation for future in-depth cross-linguistic comparisons along various dimensions of interest (e.g., fixed vs. flexible word order21), including with multivariate analytic approaches and with methods with high temporal resolution, like MEG or intracranial recordings. Regardless of the recording methodology, the language localizer tasks enable narrowing in on the system of interest—the fronto-temporal network that selectively supports linguistic processing—yielding greater statistical power and interpretability22, and leading to a robust and cumulative research enterprise.
Cross-linguistic investigations will likely require testing many speakers for each language / language family in question because—to the extent that cross-linguistic differences exist in the neural implementation of language processing—they will have to exceed the variability that characterizes speakers of the same language in order to be detected. It is also important to note that the very idea of potential cross-linguistic differences in the neural linguistic architecture rests on the assumption that this architecture can be shaped by experience. This assumption is plausible given that at least some features of the language network, like the degree of left-lateralization and the strength of within-network functional connectivity, appear to change across the lifespan23, 24 (see also 25 for evidence of a cross-linguistic difference in the lower-level speech perception cortex between speakers of a tonal vs. a non-tonal language), but is not uncontroversial. But even if it turns out that no cross-linguistic differences exist in how different languages are neurally implemented, or such changes cannot be detected with the technologies we currently have for probing the human brain, the ability to reliably identify the language network in speakers of diverse languages opens the door to investigations of linguistic phenomena present in a small subset of the world’s languages, to paint a richer picture of the human language system.
In conclusion, probing human language in all of its diverse manifestations is critical for uncovering additional shared features, understanding the cognitive and neural basis of different solutions to similar communicative demands, characterizing the processing of unique/rare linguistic properties, and fostering inclusivity and representation in language sciences.
Online Methods
Participants
Ninety-one participants were recruited from MIT and the surrounding Boston community. Participants were recruited on the basis of their native language (the language acquired during the first few years of life). All participants were proficient in English (Supp. Table 2). Data from 5 participants were excluded from the analyses due to excessive in-scanner motion or sleepiness. The final set included 86 participants (43 males) between the ages of 19 and 45 (M=27.52, SD=5.49; Supp. Table 3). All participants were right-handed, as determined by the Edinburgh Handedness Inventory26 or self-report (n=3), and had normal or corrected-to-normal vision. All participants gave informed consent in accordance with the requirements of MIT’s Committee on the Use of Humans as Experimental Subjects (COUHES), and were paid for their participation.
Participants’ native languages spanned 11 language families (Afro-Asiatic, Austro-Asiatic, Austronesian, Dravidian, Indo-European, Japonic, Koreanic, Atlantic-Congo, Sino-Tibetan, Turkic, and Uralic) and 45 languages (Supp. Table 2). We tested 2 native speakers per language (one male, one female) when possible; for 4 of the 45 languages (Tagalog, Telugu, Slovene, and Swahili), we were only able to test one native speaker.
Experimental Design
Each participant completed i) a standard language localizer task in English9, ii) the critical language localizer in their native language, iii) one or two non-linguistic tasks that were included to assess the degree of functional specificity of the language regions (a spatial working memory task, which everyone performed, and an arithmetic addition task, performed by 67 of the 86 participants), and iv) two naturalistic cognition paradigms that were included to examine correlations in neural activity among the language regions, and between the language regions and regions of another network supporting high-level cognition—the domain-general multiple demand (MD) network15 (a ∼5 min naturalistic story listening task in the participant’s native language, and a 5 min resting state scan). With the exception of two participants, everyone performed all the tasks in a single scanning session, which lasted approximately two hours. One participant performed the English localizer in a separate session, and another performed the spatial working memory task in a separate session. (We have previously established that individual activations are highly stable across scanning sessions8.)
Standard (English-based) language localizer
Participants passively read English sentences and lists of pronounceable nonwords in a blocked design. The Sentences>Nonwords contrast targets brain regions that support high-level linguistic processing, including lexico-semantic and combinatorial syntactic/semantic processes27, 28. Each trial started with 100 ms pre-trial fixation, followed by a 12-word-long sentence or a list of 12 nonwords presented on the screen one word/nonword at a time at the rate of 450 ms per word/nonword. Then, a line drawing of a finger pressing a button appeared for 400 ms, and participants were instructed to press a button whenever they saw this icon, and finally a blank screen was shown for 100 ms, for a total trial duration of 6 s. The simple button-pressing task was included to help participants stay awake and focused. Each block consisted of 3 trials and lasted 18 s. Each run consisted of 16 experimental blocks (8 per condition), and five fixation blocks (14 s each), for a total duration of 358 s (5 min 58 s). Each participant performed two runs. Condition order was counterbalanced across runs. (We have previously established the robustness of the language localizer contrast to modality (written/auditory), materials, task, and variation in the experimental procedure9, 11.)
Critical (native-language-based) language localizer
Materials
Translations of Alice in Wonderland29 were used to create the materials. We chose this text because it is one of the most translated works of fiction, with translations existing for at least 170 languages30, and is suitable for both adults and children. Using the original (English) version, we first selected a set of 28 short passages (each passage took between 12 and 30 sec to read out loud). We also selected 3 longer passages (each passage took ∼5 min to read out loud) to be used in the naturalistic story listening task (see below). For each target language, we then recruited a native female speaker, who was asked to a) identify the corresponding passages in the relevant translation (to ensure that the content is similar across languages), b) familiarize themselves with the passages, and c) record the passages. In some languages, due to the liberal nature of the translations, the corresponding passages differed substantially in length from the original versions; in such cases, we adjusted the length by including or omitting sentences at the beginning and/or end of the passage so that the length roughly matched the original. We used female speakers because we wanted to ensure that the stimuli would be child-friendly (for future studies), and children tend to pay better attention to female voices31. Most speakers were paid for their help, aside from a few volunteers from the lab. Most of the recordings were conducted in a double-walled sound-attenuating booth (Industrial Acoustics). Materials for 3 of the languages (Hindi, Tamil, and Catalan) were recorded outside the US; in such cases, recordings were done in a quiet room using a laptop’s internal microphone. We ensured that all recordings were fluent; if a speaker made a speech error, the relevant portion/passage were re-recorded. For each language, we selected 24 of the 28 short passages to be used in the experiment, based on length so that the target passages were as close to 18 s as possible. Finally, we created acoustically degraded versions of the target short passages following the procedure introduced in Scott et al.11. In particular, for each language, the intact files were low-pass filtered at a pass-band frequency of 500 Hz. In addition, a noise track was created from each intact clip by randomizing 0.02-second-long periods. In order to produce variations in the volume of the noise, the noise track was multiplied by the amplitude of the intact clip’s signal over time. The noise track was then low-pass filtered at a pass-band frequency of 8,000 Hz and a stop frequency of 10,000 Hz in order to soften the highest frequencies. The noise track and the low-pass filtered copies of the intact files were then combined, and the level of noise was adjusted to a point that rendered the clips unintelligible. The resulting degraded clips sound like poor radio reception of speech, where the linguistic content is not discernible. In addition to the intact and degraded clips in their native language, we included a third condition: clips in an unfamiliar language (Tamil was used for 75 participants and Basque for the remaining 11 participants who had some exposure to Tamil during their lifetime). All the materials are available from the Fedorenko lab website: https://evlab.mit.edu/aliceloc (to be available upon publication; in the meantime, the materials are available from SMM upon request).
Procedure
For each language, the 24 items (intact-degraded pairs) were divided across two experimental lists so that each list contained only one version of an item, with 12 intact and 12 degraded trials. Any given participant was presented with the materials in one of these lists. Each list additionally contained 12 unfamiliar foreign language clips (as described above) chosen randomly from the set of 24. Participants passively listened to the materials in a long-event-related design, with the sound delivered through Sensimetrics earphones (model S14). The Native-language condition was expected to elicit stronger responses compared to both the Degraded-language condition11 and the Unfamiliar-language condition32 in the high-level language processing brain regions9. These language regions appear to support the processing of word meanings and combinatorial semantic/syntactic processes33, and these processes are not possible for the degraded or unfamiliar conditions. Each event consisted of a single passage and lasted 18 s (passages that were a little shorter than 18 s were padded with silence at the end, and passages that were a little longer than 18 s were trimmed down). We included a gradual volume fade-out at the end of each clip during the last 2 s, and the volume levels were normalized across the 36 clips (3 conditions * 12 clips each) in each set. The materials were divided across three runs, and each run consisted of 12 experimental events (4 per condition), and three fixation periods (12 s each), for a total duration of 252 s (4 min 12 s). Each participant performed three runs. Condition order was counterbalanced across runs.
Non-linguistic tasks
Both tasks were chosen based on prior studies of linguistic selectivity10 In the spatial working memory task, participants had to keep track of four (easy condition) or eight (hard condition) locations in a 3 x 4 grid10. In both conditions, participants performed a two-alternative forced-choice task at the end of each trial to indicate the set of locations that they just saw. Each trial lasted 8 s (see 10 for the timing details). Each block consisted of 4 trials and lasted 32 s. Each run consisted of 12 experimental blocks (6 per condition), and 4 fixation blocks (16 s in duration each), for a total duration of 448 s (7 min 28 s). Each participant performed 2 runs. Condition order was counterbalanced across runs.
In the arithmetic addition task, participants had to solve a series of addition problems with smaller (easy condition) vs. larger (hard condition) numbers. In the easy condition, participants added two single-digit numbers. In the hard condition, participants added two numbers, one of which was double-digits. In both conditions, participants performed a two-alternative forced-choice task at the end of each trial to indicate the correct sum. Each trial lasted 3 s. Each block consisted of 5 trials and lasted 15 s. Each run consisted of 16 experimental blocks (8 per condition), and 5 fixation blocks (15 s in duration each), for a total duration of 315 s (5 min 15 s). Most participants performed 2 runs; 12 participants performed 1 run; 19 participants did not perform this task due to time limitations. Condition order was counterbalanced across runs when multiple runs were performed.
Naturalistic cognition paradigms
In the story listening paradigm, participants were asked to attentively listen to one of the long passages in their native language. The selected passage was 4 min 20 s long in English. Recordings in other languages were padded with silence or trimmed at the end, to equalize scan length across languages. The same 2 sec fade-out was applied to these clips, as to the shorter clips used in the critical experiment. In addition, each run included 12 s of silence at the beginning and end, for a total duration of 284 s (4 min 44 s). In the resting state paradigm, following Blank et al.13, participants were asked to close their eyes but to stay awake and let their mind wander for 5 minutes. The projector was turned off, and the lights were dimmed.
fMRI data acquisition
Structural and functional data were collected on the whole-body 3 Tesla Siemens Trio scanner with a 32-channel head coil at the Athinoula A. Martinos Imaging Center at the McGovern Institute for Brain Research at MIT. T1-weighted structural images were collected in 179 sagittal slices with 1 mm isotropic voxels (TR = 2,530 ms, TE = 3.48 ms). Functional, blood oxygenation level dependent (BOLD) data were acquired using an EPI sequence (with a 90° flip angle and using GRAPPA with an acceleration factor of 2), with the following acquisition parameters: thirty-one 4mm thick near-axial slices, acquired in an interleaved order with a 10% distance factor; 2.1 mm x 2.1 mm in-plane resolution; field of view of 200mm in the phase encoding anterior to posterior (A > P) direction; matrix size of 96 x 96; TR of 2000 ms; and TE of 30 ms. Prospective acquisition correction34 was used to adjust the positions of the gradients based on the participant’s motion one TR back. The first 10 s of each run were excluded to allow for steady-state magnetization.
fMRI data preprocessing and first-level analysis
fMRI data were analyzed using SPM12 and custom MATLAB scripts. Each subject’s data were motion corrected and then normalized into a common brain space (the Montreal Neurological Institute (MNI) template) and resampled into 2mm isotropic voxels. The data were then smoothed with a 4mm Gaussian filter and high-pass filtered (at 128s). For the language localizer task and the non-linguistic tasks, a standard mass univariate analysis was performed whereby a general linear model estimated the effect size of each condition in each experimental run. These effects were each modeled with a boxcar function (representing entire blocks/events) convolved with the canonical hemodynamic response function. The model also included first-order temporal derivatives of these effects, as well as nuisance regressors representing entire experimental runs and offline-estimated motion parameters.
The naturalistic cognition paradigms (resting state and story listening) were preprocessed using the CONN toolbox35 with default parameters, unless stated otherwise. First, in order to remove noise resulting from signal fluctuations originating from non-neuronal sources (e.g., cardiac or respiratory activity), the first five BOLD signal time points extracted from the white matter and CSF were regressed out of each voxel’s time-course. White matter and CSF voxels were identified based on segmentation of the anatomical image36. Second, the residual signal was band-pass filtered at 0.008-0.09 Hz to preserve only low-frequency signal fluctuations37.
To create aesthetically pleasing activation projection images for Figure 1, the data were additionally analyzed in FreeSurfer12. Although all the analyses were performed on the data analyzed in the volume, the surface-based FreeSurfer maps are also available at https://osf.io/cw89s/?view_only=49981c407d784d2e88ebf6087e12fb3a.
fROI definition and response estimation
For each participant, functional regions of interest (fROIs) were defined using the Group-constrained Subject-Specific (GSS) approach9, whereby a set of parcels or “search spaces” (i.e., brain areas within which most individuals in prior studies showed activity for the localizer contrast) is combined with each individual participant’s activation map for the same contrast.
To define the language fROIs, we used six parcels derived from a group-level representation of data for the Sentences>Nonwords contrast in 220 participants (Figure 2). These parcels included three regions in the left frontal cortex: two in the inferior frontal gyrus (LIFG and LIFGorb), and one in the middle frontal gyrus (LMFG); and three regions in the left temporal and parietal cortices spanning the entire extent of the lateral temporal lobe and extending into the angular gyrus (LAntTemp, LPostTemp, and LAngG). Individual fROIs were defined by selecting—within each parcel—the top 10% of most localizer-responsive voxels based on the t- values for the relevant contrast (Sentences>Nonwords for the English localizer). We then extracted the responses from these fROIs (averaging the responses across the voxels in each fROI) to each condition in the critical language localizer (native language intact, native language degraded, and unfamiliar foreign language), and the non-linguistic tasks. Statistical tests were then performed across languages on the percent BOLD signal change values extracted from the fROIs.
We used the English-based localizer to define the fROIs i) because we have previously observed that as long as a participant is proficient in a language, the localizer based on that language works well32, and ii) to facilitate comparisons with earlier studies10, 13. However, in an alternative set of analyses (Supp. Figure 5), we used the Native-language>Degraded-language contrast from the critical language localizer to define the fROIs. In that case, to estimate the responses to the conditions of the critical language localizer, across-runs cross-validation22 was used to ensure independence38. The results were nearly identical to the ones based on the English-localizer fROIs, suggesting that the two localizers pick out similar sets of voxels.
In addition to the magnitudes of response, we estimated the degree of language lateralization in the native language localizer based on the extent of activation in the left vs. right hemisphere. To do so, for each language tested, in each participant, we calculated the number of voxels activated for the Native-language>Degraded-language contrast (at the p<0.001 whole-brain uncorrected threshold) within the union of the six language parcels in the left hemisphere, and within the union of the homotopic parcels in the right hemisphere8, as shown in Figure 2b. Statistical tests were then performed across languages on the voxel count values.
Finally, we calculated inter-regional functional correlations during each of the naturalistic cognition paradigms. For these analyses, in addition to the language fROIs, we examined a set of fROIs in another large-scale brain network that supports high-level cognition: the domain-general multiple demand (MD) network15, 39, which has been implicated in executive functions, like attention, working memory, and cognitive control. This was done in order to examine the degree to which the language regions are functionally dissociated from these domain-general MD regions during rich naturalistic cognition, as has been shown to be the case for native English speakers13, 40. To define the MD fROIs, following13, 41, we used anatomical parcels42 that correspond to brain regions linked to MD activity in prior work. These parcels included regions in the opercular IFG, MFG, including its orbital part, insular cortex, precentral gyrus, supplementary and presupplementary motor area, inferior and superior parietal cortex, and anterior cingulate cortex, for a total of 18 regions (9 per hemisphere). Individual MD fROIs were defined by selecting— within each parcel—the top 10% of most localizer-responsive voxels based on the t-values for the Hard>Easy contrast for the spatial working memory task13 (see Supp. Info 4 for an analysis showing that this effect is highly robust in the MD fROIs, as expected based on prior work).
For each subject, we averaged the BOLD signal time-course across all voxels in each language and MD fROI. We then averaged the time-courses in each fROI across participants for each language where two participants were tested. For each language, we computed Pearson’s moment correlation coefficient between the time-courses for each pair of fROIs. These correlations were Fisher-transformed to improve normality and decrease biases in averaging43. We then compared the average correlation for each language a) within the language network (the average of all 66 pairwise correlations among the 12 language fROIs), b) within the MD network (the average of all 190 pairwise correlations among the 20 MD fROIs), and c) between language and MD fROIs (the average of 240 pairwise correlations between the language fROIs and the MD fROIs). For the language network, we also computed the within-network correlations for the left and right hemisphere separately, to examine lateralization effects. All the statistical comparisons were performed across languages. The fROI-to-fROI correlations are visualized in two matrices, one for each naturalistic cognition paradigm (Figure 2c).
Data availability
The data that support the findings of this study are available at: https://osf.io/cw89s/?view_only=49981c407d784d2e88ebf6087e12fb3a.
Code availability
The code used to analyze the data in this study are available at: https://osf.io/cw89s/?view_only=49981c407d784d2e88ebf6087e12fb3a.
Author contributions

Supplementary Information
Supplementary Figures

Percent BOLD signal change within the LH language functional ROIs for the three language conditions of the Alice localizer task (Native language, Acoustically degraded native language, and Unfamiliar language), Hard and Easy conditions of the spatial working memory (WM) task, and Hard and Easy conditions of the math task. The dots correspond to participants for each language.
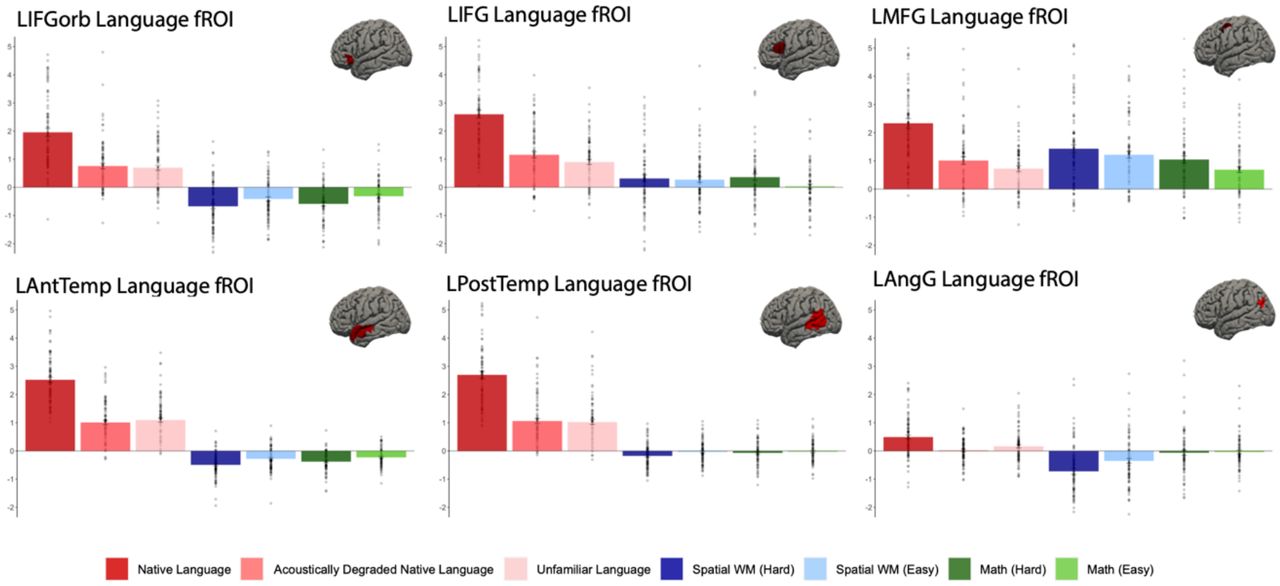
Percent BOLD signal change for each of the six LH language functional ROIs for the three language conditions of the Alice localizer task (Native language, Acoustically degraded native language, and Unfamiliar language), Hard and Easy conditions of the spatial working memory (WM) task, and Hard and Easy conditions of the math task. The dots correspond to individual languages (n=45).

Inter-regional functional correlations for the LH and RH language and the Multiple Demand (MD) networks during a naturalistic cognition paradigm (story comprehension in the participant’s native language).

Inter-regional functional correlations for the LH and RH language and the Multiple Demand (MD) networks during a naturalistic cognition paradigm (resting state).

Percent BOLD signal change across (panel a) and within each of (panel the LH language functional ROIs (defined by the Native-language>Degraded-language contrast from the Alice localizer, cf. the Sentences>Nonwords contrast from the English localizer as in the main text and analyses; Figure 2a and Supp. Figure 2) for the three language conditions of the Alice localizer task (Native language, Acoustically degraded native language, and Unfamiliar language), Hard and Easy conditions of the spatial working memory (WM) task, and Hard and Easy conditions of the math task. The dots correspond to individual languages (n=45).
Across languages and across the six fROIs, the Native-language condition elicited a reliably greater response than both the Degraded-language condition (2.32 vs. 0.91 % BOLD signal change relative to the fixation baseline; t(44)=18.57, p<0.001) and the Unfamiliar-language condition (2.31 vs. 0.99; t(44)=18.02, p<0.001). Responses to the Native-language condition were significantly higher than those to a) the hard condition of the spatial working memory task (2.32 vs. 0.06; t(44)=11.16, p<0.001), and b) the hard condition of the arithmetic addition task (2.32 vs. −0.02; t(40)=20.8, p<0.001). These results also hold for each fROI separately.
Supplementary Tables
A partial selective review of past fMRI studies on the languages included in the current investigation. For each language, SMM performed searches (on Google, GoogleScholar, PubMed, etc.) for “fMRI [language]”(e.g., fMRI Ukranian) and extracted the relevant citations where available. All papers dealing with speech (perception and articulation) and language (comprehension and production) were considered (i.e., we did not restrict our search to only papers that focus on high-level linguistic processing), including papers from the clinical literature (that simply used the language in question to facilitate pre-surgical planning rather than asking basic science questions about the particular language or language processing mechanisms in general) and papers where the language in question was used as a control condition. We classified languages into three groups: well studied languages (with >100 papers per language), somewhat studied languages (with >10 but <100 papers), and understudied / not studied languages (with <10 papers, several with not a single paper we could find). This table is not meant to serve as a comprehensive literature review, but to highlight the fact that for many, especially non- ‘dominant’, languages, no investigations have been conducted, and if they have been, they tend to be clinical in nature (e.g., developing tools for pre-surgical mapping), to use the language as a control condition, and/or to be published in low-impact journals.
Information on the language background of all participants. In each column, languages are listed in order of proficiency.
Information on the gender and age of participants (at testing).
Supplementary Text
Supp. Information 1: Details for how the activation projections for Figure 1 were created.
To create aesthetically pleasing activation projection images for Figure 1, the data were analyzed in FreeSurfer (Dale & Fischl, 1999). Although all the analyses were performed on the data analyzed in the volume (using SPM12), the surface-based FreeSurfer maps are available at https://osf.io/cw89s/?view_only=49981c407d784d2e88ebf6087e12fb3a.
Activation maps for the Alice language localizer contrast (Native-language>Degraded-language) in the left hemisphere were smoothed using a Gaussian kernel of 4 mm full-width half-max and thresholded at the 70th percentile of the positive contrast for each participant. Further, small and/or idiosyncratic bits of activation (relatively common in individual-level language maps; e.g., Fedorenko et al., 2010; Mahowald & Fedorenko, 2016; Affourtit et al., in prep.) were removed: in particular, clusters were excluded if a) their surface area was below 100 mm^2, or b) they did not overlap (by >10%) with a mask created for this cohort of 86 participants by overlaying the individual maps and excluding vertices that did not show language responses in at least 5% of the cohort. (We ensured that the idiosyncrasies were individual- and not language-specific: for each cluster removed, we checked that a similar cluster was not present for the second native speaker of that language.) The surface overlays were rendered on the 80% inflated white-gray matter boundary of the fsaverage template using FreeView/FreeSurfer.
Supp. Information 2: Statistics for the key effects across language families (cf. across languages, as in the main text).
Across language families (n=12; we here included Basque, an isolate, in addition to the 11 families, but the statistics are not affected by its inclusion), the Native-language condition elicited a reliably greater response than both the Degraded-language condition (t(11)=9.92, p<0.001) and the Unfamiliar-language condition (t(11)=9.53, p<0.001). The Native-language>Degraded-language effect was stronger in the left hemisphere than the right hemisphere (t(11)=3.90, p=0.002), and more spatially extensive (t(11)=4.01, p<0.001). The regions of the language network exhibited strong synchronization in their activity, during story comprehension and rest, both reliably higher than zero (ts>4, ps<0.001) and phase-shuffled baselines (ts>10, ps<0.001). Further, the inter-region correlations in the left hemisphere language network were reliably stronger than those in the right hemisphere during both story comprehension (t(11)=4.06, p<0.01) and rest (t(11)=4.78, p<0.001).
Responses to the Native-language condition were significantly higher than those to a) the hard condition of the spatial working memory task (t(11)=10.08, p<0.001), and b) the hard condition of the arithmetic addition task (t(11)=11.71, p<0.001). Furthermore, the language regions were dissociated in their intrinsic fluctuation patterns from the regions of the MD network: within-network correlations were reliably greater than between-network correlations both during story comprehension (ts>8, p<0.001) and rest (ts>12, p<0.001).
Supp. Information 3: Results of linear mixed effects models.
The analyses reported in the main text were supplemented with linear mixed effects models. These models enabled us to examine inter-individual and inter-language/language-family variance (see also Supp. Information 5).
The key neural measures were predicted by a model that included a fixed effect of condition (specified below for each measure) and random intercepts by participant (n=86), language (n=45), language family (n=12), and fROI (n=6).
EffectSize ∼ Condition + (1 | Participant) + (1 | Language) + (1 | Lang. Family) + (1 | fROI)
Response strength measures
Native-language > Degraded-language. The language fROIs responded more strongly in the Native-language condition than the Degraded-language condition (p<0.001). The estimated variance was 0.42 for participants, <0.01 for languages, 0.01 for language families, and 0.40 for fROIs.
Native-language > Unfamiliar-language. The language fROIs responded more strongly in the Native-language condition than the Unfamiliar-language condition (p<0.001). The estimated variance was 0.37 for participants, <0.01 for languages, <0.01 for language families, and 0.34 for fROIs.
Native-language > Spatial Working Memory (Hard). The language fROIs responded more strongly in the Native-language condition than the hard spatial working memory condition (p<0.001). The estimated variance was 0.16 for participants, <0.01 for languages, 0.02 for language families, and 0.48 for fROIs.
Native-language > Math (Hard). The language fROIs responded more strongly in the Native-language condition than the hard math condition (p<0.001). The estimated variance was 0.14 for participants, <0.01 for languages, 0.02 for language families, and 0.25 for fROIs.
Lateralization measures (response strength and activation extent)
EffectSize ∼ Hemisphere + (1 | Participant) (1 | Language) + (1 | Lang, Family) + (1 | fROI)
The language fROIs responded more strongly in the left hemisphere than the right (p<0.01). The estimated variance was 0.33 for participants, 0.04 for languages, 0.01 for language families, and 0.77 for fROIs.
The number of supra-threshold voxels was greater in the left hemisphere than the right hemisphere (p<0.01). The estimated variance was 11,701 for participants, 2,383 for languages, 0.00 for language families, and 91,579 for fROIs.
Lateralization measures (functional correlations)
EffectSize ∼ Hemisphere + (1 | Participant) + (1 | Language) + (1 | Lang. Family)
Story comprehension. The functional correlations were stronger in the left hemisphere than the right hemisphere (p<0.01). The estimated variance was 0.02 for participants, <0.01 for languages, and <0.01 for language families.
Resting state The functional correlations were stronger in the left hemisphere than the right hemisphere (p<0.01). The estimated variance was 0.01 for participants, <0.01 for languages, and <0.01 for language families.
Within- and between-network correlation measures
Here, networks (either language-language (pairs of fROIs within the language network) or language-MD (pairs of fROIs straddling network boundaries)) were modeled as a fixed effects:
EffectSize ∼ Systems + (1 | Language) + (1 | Subject) + (1 | Language Family)
Story comprehension. The within language network correlations were greater than the correlations between the language and MD networks (p<0.01). The estimated variance was <0.01 for participants, <0.01 for languages and <0.01 for language families.
Resting state. The within language network correlations were greater than the correlations between the language and MD networks (p<0.01). The estimated variance was <0.01 for participants, <0.01 for languages, <0.01 for language families.
Supp. Information 4: Validation of the fROIs comprising the Multiple Demand network.
Whereas the language regions did not respond to the spatial working memory (WM) and math tasks, the regions of the domain-general Multiple Demand (Duncan, 2010) network (defined by the Hard>Easy contrast of the spatial WM task) responded strongly to both, and more strongly to the harder conditions than the easier conditions (3.05 vs. 1.92 for the spatial WM task, t(40)=13.0, p<0.001; and 1.68 vs. 0.62 for the math task, t(40)=12.32, p<0.001). These results replicate Fedorenko et al. (2013).
Supp. Information 5: Inter-individual variability within vs. across languages in the strength of neural response during language processing.
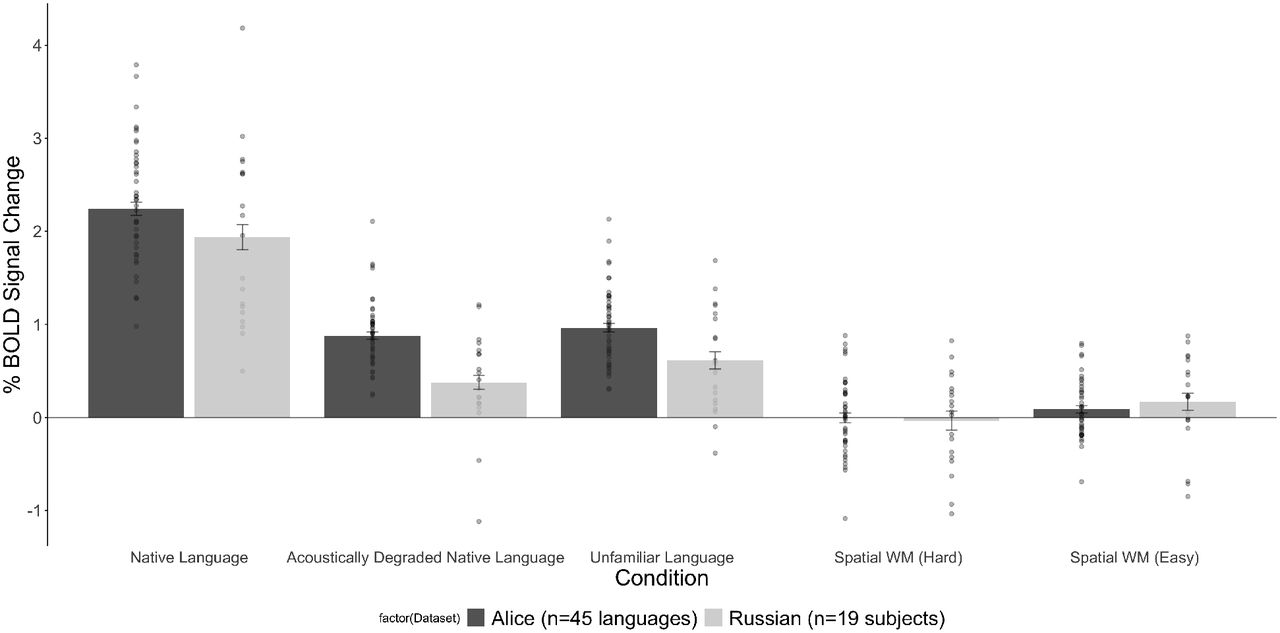
As can be seen in Figure 2a in the main text, we observed substantial variability across languages in the strength of neural response during language processing. In order to more directly compare the level of cross-linguistic variability to inter-individual variability (e.g., Mahowald & Fedorenko, 2016; Mineroff, Blank et al., 2018), we used a dataset of 19 native speakers of Russian, who completed the Alice localizer (and the spatial working memory task included here for completeness). As can be seen in Figure A below, the general pattern of condition responses looks similar in the two groups, and the cross-linguistic and inter-individual variability look comparable.
To quantitatively compare the cross-linguistic vs. inter-individual variance in the two datasets, we bootstrapped (n=1,000,000) the effect sizes for each of the five conditions in Figure 2A for 19 of the 86 participants in the Alice dataset and for the 19 participants in the Russian dataset. If cross-linguistic variability is above and beyond the variability that exists across individual speakers of the same language, we should see greater variance in the strength of the neural responses for the Alice dataset compared to the Russian dataset. As can be seen in Figure B below, the variance in the Alice dataset was not significantly higher than in the Russian dataset for the Native Language (p=0.55), Acoustically Degraded Native Language (p=0.54), Unfamiliar Language (p=0.58), Spatial Working Memory (Hard) (p=0.71), and Spatial Working Memory (Easy) (p=0.42) conditions. As a result, the variability that we see in the main Figure 2a is likely driven by the inter-individual rather than cross-linguistic variability. That said, as discussed in the main text, future work may discover small cross-linguistic differences (in sufficiently large datasets) in the measures examined here or some other ones that would surpass inter-individual variability.

Percent BOLD signal change averaged across the six LH language functional ROIs for the three language conditions of the Alice localizer task (Native language, Acoustically degraded native language, and Unfamiliar language), and Hard and Easy conditions of the spatial working memory (WM) task (included for completeness). Dark grey bars: the dataset in the current study (dots=individual languages, as in Figure 2a); light grey bars: a set of 19 native speakers of Russian, who performed the Alice localizer (native language=Russian, unfamiliar language=Tamil) (dots=individual participants) and the spatial WM task.

Bootstrapped variance in effect sizes of the Alice dataset (n=86 participants, bootstrap subsample size consisted of 19 participants at a time for better comparison with the Russian dataset) and the Russian dataset (n=19 participants) for each of the conditions in the Alice localizer task (Native language, Acoustically degraded native language, and Unfamiliar language), and the Hard and Easy conditions of the spatial working memory (WM) task.
Acknowledgments
We thank i) Zoya Fan, Jorge Vera-Rebollar, Frankie Frank, Annemarie Verkerk, Celeste Kidd, and Ming Xiang for help with locating the texts of Alice in Wonderland in different languages; ii) Zoya Fan, Frankie Frank, and Jorge Vera-Rebollar for help with finding and recording the speakers; iii) Idan Blank and Alex Paunov for help with the inter-region correlation analyses; iv) Josh McDermott for letting us use the sound booths in his lab for the recordings; v) Jin Wu for creating and Ben Lipkin for helping edit a website for disseminating the localizer materials and the data; vi) Martin Lewis for allowing the use of the linguistic family maps from the GeoCurrents website; vii) Barbara Alonso Cabrera for help with figures; viii) EvLab and TedLab members, and the audiences at the Neuroscience of Language Conference at NYU-AD (2019), and at the virtual Cognitive Neuroscience Society conference (2020) for helpful feedback, and Ted Gibson and Damián Blasi for comments on earlier drafts of the manuscript; ix) Doug Greve and Bruce Fischl for their help with the FreeSurfer analyses; and x) our participants. The authors would also like to acknowledge the Athinoula A. Martinos Imaging Center at the McGovern Institute for Brain Research at MIT, and the support team (Steven Shannon and Atsushi Takahashi). S.M-M. was supported by la Caixa Fellowship LCF/BQ/AA17/11610043. E.F. was supported by NIH awards R00-HD057522, R01-DC016607, and R01-DC-NIDCD and funds from the Brain and Cognitive Sciences Department and the McGovern Institute for Brain Research.
References


